

Propionyl-l-carnitine (PLC) is an SCFA esterified to carnitine that is rapidly transported into cells, in particular to the mitochondria, where it is transformed into free carnitine and propionyl coenzyme A(Reference Wiseman and Brogden1, Reference Binienda and Virmani2). The latter is converted into succinyl coenzyme A and finally to succinate, which is involved in the citric acid cycle. Through this mechanism, PLC supplies energy to ischaemic tissues(Reference Wiseman and Brogden1, Reference Siliprandi, Di Lisa and Menabò3). Carnitine plays an important role in the transport of long-chain fatty acids into the mitochondrial matrix, since it serves as an essential substrate for the enzyme which catalyses the initial step of β-oxidation, carnitine palmitoyltransferase 1.
These well-known roles of carnitine and PLC in fatty acid oxidation and energy expenditure have led to the increase of weight-loss and fitness products including l-carnitine supplements. Nevertheless, the scientific data reporting the effect of carnitine or PLC on obesity are scant. Obesity is a medical disorder characterised by overweight and is associated with co-morbidities such as hypertension, dyslipidaemia, insulin resistance and diabetes. The frequent simultaneous presence of these abnormalities led to the definition of the metabolic syndrome as the presence of increased waist circumference and two other cardiovascular risk factors: serum glucose, hypertriacylglycerolaemia, low HDL and/or hypertension(Reference Alberti, Zimmet and Shaw4). It is well established that obesity and the metabolic syndrome impair the vasodilating properties of the endothelium, leading to a dysfunction which, in turn, can be considered the first step in the progression of CVD(Reference Avogaro and de Kreutzenberg5).
Lipid toxicity occurring in obesity, together with an insulin-resistant state, may lead to an increased reactive oxygen species generation and to a decreased NO production(Reference Meigs, Larson and Fox6–Reference Kim, Montagnani and Koh8). These facts altogether may be suggested as possible mechanisms responsible for vascular functionality alterations in obesity. Our research group has provided evidence of the protective effect of PLC on endothelial dysfunction in hypertensive rats(Reference Bueno, Alvarez de Sotomayor and Perez-Guerrero9, Reference Alvarez de Sotomayor, Bueno and Pérez-Guerrero10) through a mechanism involving a decrease in reactive oxygen species generation(Reference de Sotomayor, Mingorance and Rodriguez-Rodriguez11). Moreover, some studies carried out with type 2 diabetic patients showed the efficacy of PLC on peripheral arterial disease(Reference Santo, Sergio and Luigi12) and the improvement on haemodynamic and metabolic markers after by-pass coronary surgery(Reference Lango, Smoleński and Rogowski13). Based on these antecedents, the aim of the present study was to evaluate the effect of an oral supplement of PLC on an animal model of the metabolic syndrome, focusing our attention on body-weight gain, lipid prolife, insulin resistance and vascular and endothelial function.
Experimental methods
Animals
Ten obese Zucker rats (OZR) and their ten littermate controls, lean Zucker rats (LZR) (aged 12 weeks; Charles River Laboratories, Barcelona, Spain), were housed at 24°C with 60 % relative humidity, on 12 h light and dark cycles and were fed with a standard diet and water ad libitum. LZR (n 10) and OZR (n 10) were divided into two groups of five animals and received either vehicle (water; W-LZR and W-OZR groups) or PLC-supplemented drinking water (200 mg/kg per d; PLC-LZR and PLC-OZR groups). Both PLC and vehicle were administered for 20 weeks. The selected dose of PLC is reported to reduce body-weight gain of hypertensive rats after a 56 d oral treatment(Reference Bueno, Alvarez de Sotomayor and Perez-Guerrero9).
Body weight, food intake, systolic blood pressure and heart rate were evaluated weekly. Systolic blood pressure and heart rate were measured by the ‘tail-cuff’ method with a pressure meter (Niprem 645; Cibertec, Madrid, Spain). When the treatment period finished, rats were anaesthetised and killed with chloral hydrate 12 % intraperitoneally. Blood samples were collected by intracardiac puncture for biochemical assays. Visceral adipose tissue and liver were removed and weighed and thoracic aorta and mesenteric vascular beds were isolated for vascular reactivity studies. The protocol for animal handling and experimentation of this investigation was in accordance with the European Union European Community guidelines for the ethical treatment of animals (European Economic Community Directive of 1986; 86/609/EEC) and was approved by the Ethical Committee for Animal Research of the University of Seville.
Oral glucose tolerance test
After 18 weeks receiving vehicle or PLC, an oral glucose tolerance test was performed by oral administration of glucose (2 g/kg body weight) to LZR and OZR previously starved for 14 h. Blood samples were collected from the tail vein just before and at 30, 90 and 180 min after the administration of glucose. Plasma glucose concentration was determined using a blood glucose commercial monitoring meter (Accutrend® GCT; Roche Diagnostics, Barcelona, Spain).
Serum biochemical assays
Serum samples were obtained from blood by centrifugation for 10 min at 3500 rpm and room temperature. Fasting glucose, TAG, total cholesterol and HDL-cholesterol were assessed by UV/visible spectrophotometry (Roche/Hitachi Modular P; Roche Diagnostics GmbH, D-68298 Mannheim, Germany). Plasma NEFA were measured by a commercial ELISA kit (Wako Diagnostics, Richmond, VA, USA); adiponectin and insulin were also measured by commercial ELISA kits (Linco Research, St Charles, MO, USA). The homeostasis model assessment of insulin resistance (HOMA-IR) was calculated as previously described(Reference Matthews, Hosker and Rudenski14).
Measurement of liver TAG
For determination of hepatic TAG, liver tissue (200 mg) was homogenised in 2 ml phosphate saline buffer with a Polytron disrupter. The homogenate was centrifuged at 800 g for 15 min, and the supernatant fraction was collected. TAG in the supernatant fraction were measured with a commercial kit (LabAssay™ Triglyceride kit; Wako Diagnostics, Richmond, VA, USA).
Assessment of vascular reactivity
Arterial preparation and mounting
Descending thoracic aortae and branches II or III of small mesenteric arteries (SMA) were dissected and placed in cold modified Krebs–Henseleit bicarbonate solution of the following composition (mm): NaCl, 118; KCl, 4·75; NaHCO3, 25; MgSO4, 1·2; CaCl2, 1·8; KH2PO4, 1·18; glucose, 11. Then, aortic rings (2–3 mm) and mesenteric segments (1·6–2·0 mm) were mounted on myographs as previously described(Reference Bueno, Alvarez de Sotomayor and Perez-Guerrero9, Reference Alvarez de Sotomayor, Bueno and Pérez-Guerrero10). Mechanical activity was measured isometrically by a force-displacement transducer (Pioden UF-1; Pioden Controls Ltd, Canterbury, Kent, UK for the aortae; Multi Myograph System-610M, Aarhus, Denmark for SMA) coupled to a Powerlab data acquisition system (ADInstruments, Melbourne, Vic, Australia). Contractile capacity of the vessels was assessed with either phenylephrine (Phe, 1 μm) or KCl (80 mm) before relaxation or contraction experiments, respectively. The presence of functional endothelium was assessed by the ability of acetylcholine (ACh; 1 μm) to induce more than 50 % relaxation of pre-contracted vessels.
Contraction and relaxation experiments
Aortic rings were exposed to cumulative increasing concentrations of Phe (1 nm to 10 μm) to obtain concentration–response curves. These concentration–response curves were assessed in both the presence and the absence of functional endothelium and in endothelium-intact arteries, after incubation with the NO synthase (NOS) inhibitor N G-nitro-l-arginine methyl ester (l-NAME; 300 μm). Endothelium-dependent and -independent relaxation was studied in aortic rings and mesenteric segments by adding to pre-contracted arteries at 80 % of their maximal contraction cumulative concentrations of ACh (1 nm to 10 μm) and the NO donor sodium nitroprusside (0·1 nm to 1 μm for aortae and 10 nm to 100 μm for SMA), respectively.
Western blotting
Arterial homogenates were centrifuged at 1400 g for 10 min at 4°C, and the protein concentration of the supernatant fractions was determined by the Bradford assay. A quantity of 50 μg protein was resolved by electrophoresis on 10 % SDS-PAGE gels and then transferred onto nitrocellulose membranes. Immunoblotting of individual proteins was performed using a specific primary mouse endothelial NOS antibody (0·4 μl/ml; BD Biosciences, Franklin Lakes, NJ, USA) at 4°C overnight, which reacted with a peroxidase-conjugated antibody.
Bands were visualised using the enhanced chemiluminescence assay (Pierce Chemical Company, Rockford, IL, USA) and evaluated by densitometry. The sample loading was verified by staining membranes with Ponceau red and by immunostaining of smooth muscle α-actin with monoclonal mouse anti-α-actin antibody.
Drugs and chemicals
PLC was kindly provided by Sigma-Tau (Pomezia, Italy). All the chemicals were purchased from Sigma Chemical Co. (St Louis, MO, USA).
Expression of results and statistical analysis
Vascular contraction was expressed in g/mg dry tissue. Relaxation induced by ACh was expressed as a percentage of the maximal contraction. Areas under curves were analysed in each individual concentration–response curve in the absence or presence of functional endothelium in order to evaluate its participation in the Phe-induced contraction. Sensitivities to agonists were expressed as maximal effect (Emax) and pD2, where pD2 = − log EC50 (where EC50 is the effective concentration that induced 50 % of Emax). GraphPad Prism 3.0 software (San Diego, CA, USA) was used to calculate non-linear regression equations and areas under curves. Two-way ANOVA was used to compare concentration–response curves to agonists. Differences between means were assessed with Student's t test for unpaired data. Differences were considered significant when P < 0·05. A StatView software package version 5.0 (SAS Institute Inc., Cary, NC, USA) was used for statistical analysis.
Results
Effect of propionyl-l-carnitine on weight values and food intake
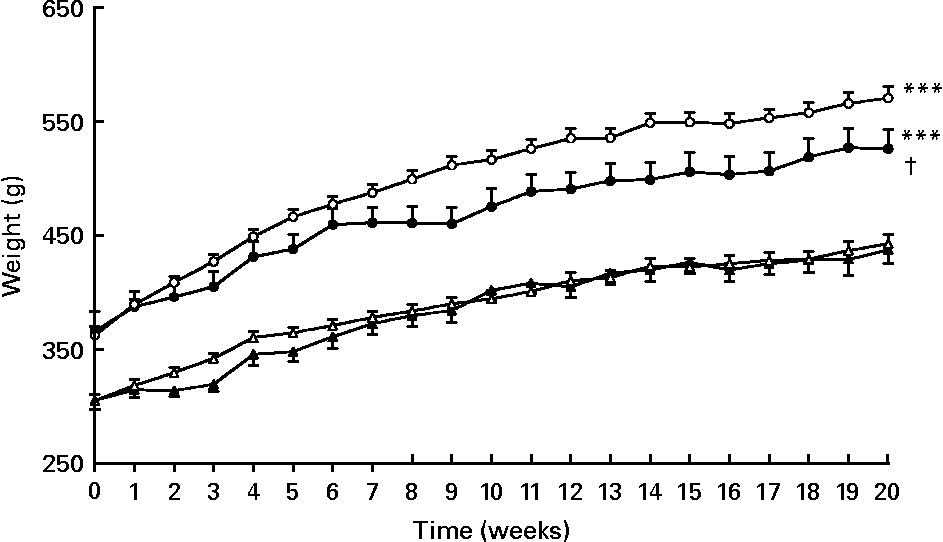
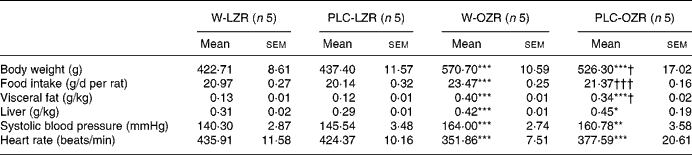
As expected, body, visceral adipose tissue and liver weights were higher in PLC-OZR and W-OZR than in PLC-LZR and W-LZR (Fig. 1, P < 0·001; Table 1, P < 0·001). OZR, but not LZR, receiving PLC showed a reduced body-weight gain over the 20-week treatment compared with their vehicle-treated control groups (Fig. 1; P < 0·05), which led to lower values of PLC-OZR body and visceral adipose tissue weights at the end of the study period (Table 1; P < 0·05). No effect was observed for liver weight after PLC administration (Table 1).
Weight evolution of obese Zucker rats (OZR) and lean Zucker rats (LZR) during 20 weeks of receiving either vehicle or propionyl-l-carnitine (PLC). (○), OZR receiving water only (vehicle) (W-OZR); (●), OZR receiving PLC-supplemented water (PLC-OZR); (△), LZR receiving water only (W-LZR); (▲), LZR receiving PLC-supplemented water (PLC-LZR). Data are means for five animals per group, with standard errors represented by vertical bars. *** Significantly different from W-LZR and PLC-LZR (P < 0·001). † Significantly different from W-OZR (P < 0·05).
(Mean values with their standard errors)
W-LZR, water (vehicle)-treated lean Zucker rats; PLC-LZR, propionyl-l-carnitine-treated lean Zucker rats; W-OZR, water (vehicle)-treated obese Zucker rats; PLC-OZR, PLC-treated obese Zucker rats.
Mean value was significantly different from those of the W-LZR and PLC-LZR: * P < 0·05, ** P < 0·01, *** P < 0·001.
Mean value was significantly different from that of the W-OZR: † P < 0·05, ††† P < 0·001.
Consistent with these results, the food intake observed in treated and non-treated OZR was higher than in the lean groups (Table 1; P < 0·001). Supplementation with PLC led to a decreased food ingestion of OZR towards values similar to those observed in LZR (Table 1; P < 0·001). This diminution in the daily food intake was not observed in lean PLC-treated animals (Table 1).
Effect of propionyl-l-carnitine on haemodynamic and biochemical parameters
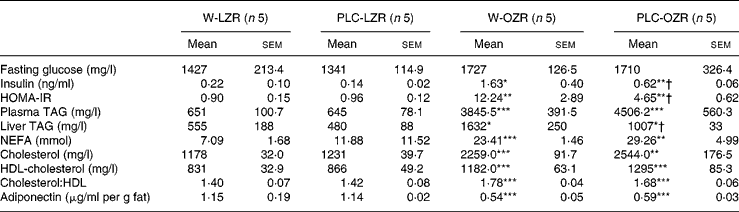
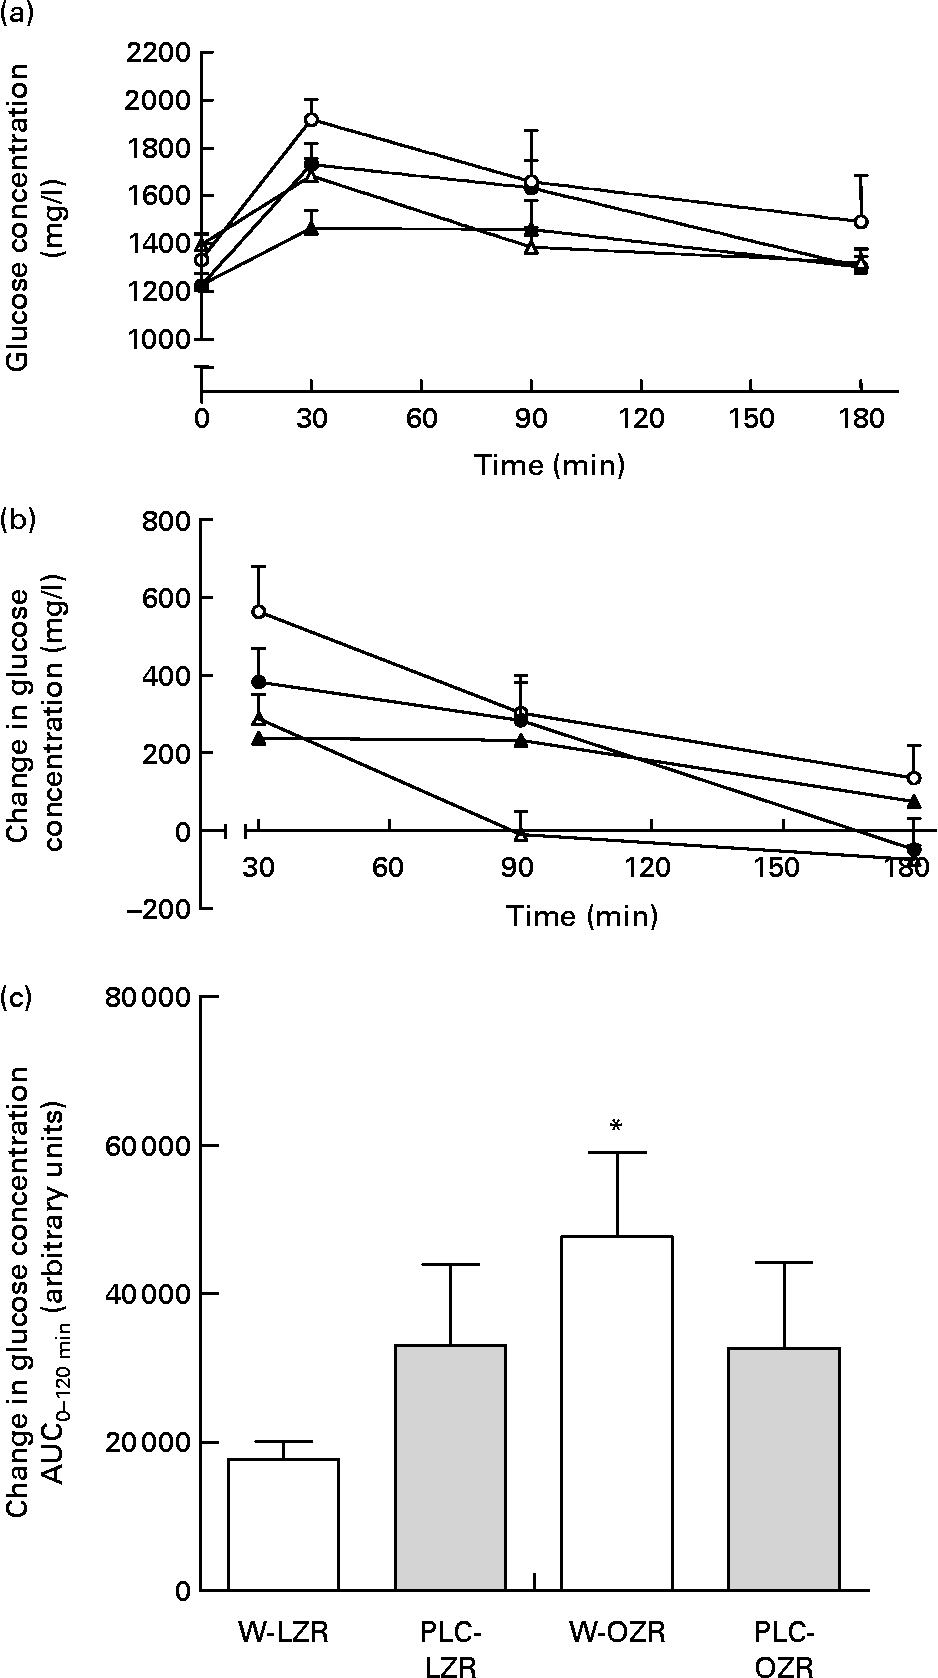
OZR receiving either vehicle or PLC showed higher systolic blood pressure and lower heart rate than W-LZR and PLC-LZR (Table 1; P < 0·001). As shown in Table 2, fasting glucose concentrations of PLC-OZR and W-OZR were slightly higher than those found in PLC-LZR and W-LZR. However, treated and non-treated OZR showed much more increased insulin and HOMA-IR values than the lean groups (P < 0·05 and P < 0·001). As a result, an insulin-resistant state may be indicated in the obese animals. After the chronic administration of PLC, both the insulin and the HOMA-IR were lower compared with the OZR receiving the vehicle (Table 2; P < 0·05). This effect was not observed in the PLC-LZR (Table 2). Plasma glucose concentrations obtained in the oral glucose tolerance test were not significantly different between the lean and obese or treated and non-treated animals (Fig. 2(a)). However, the analysis of the area under the plasma glucose curve revealed that W-OZR presented a deteriorated glucose assimilation capacity compared with W-LZR (Fig. 2(c); P < 0·05). This capacity was recovered after receiving PLC for 20 weeks (Fig. 2(c)).
(Mean values with their standard errors)
W-LZR, water (vehicle)-treated lean Zucker rats; PLC-LZR, propionyl-l-carnitine-treated lean Zucker rats; W-OZR, water (vehicle)-treated obese Zucker rats; PLC-OZR, PLC-treated obese Zucker rats; HOMA-IR, homeostasis model assessment of insulin resistance.
Mean value was significantly different from those of the W-LZR and PLC-LZR: * P < 0·05, ** P < 0·01, *** P < 0·001.
† Mean value was significantly different from that of the W-OZR (P < 0·05).
(a) Plasma glucose concentrations of starved lean Zucker rats receiving water (vehicle) only (△; W-LZR), obese Zucker rats receiving water only (○; W-OZR), propionyl-l-carnitine (PLC)-treated LZR (▲; PLC-LZR) and PLC-treated OZR (●; PLC-OZR) after administration of glucose. (b) Change in plasma glucose concentration during oral glucose tolerance test – baseline plasma glucose concentration at time zero. (c) Areas under the curves (AUC) of the change in plasma glucose concentration. Data are means for five animals per group, with standard errors represented by vertical bars. * Mean value was significantly different from that of the W-LZR (P < 0·05).
Serum analysis revealed higher concentrations of TAG, NEFA, total cholesterol and HDL-cholesterol and a higher total cholesterol:HDL-cholesterol ratio in PLC-OZR and W-OZR compared with the LZR groups (Table 2; P < 0·01 and P < 0·001). An identical lipid profile was found in PLC-treated LZR and OZR when compared with the lean and the obese control groups, respectively. As expected in an insulin-resistant state, a more elevated liver TAG content in treated and non-treated OZR was also found than in lean animals (Table 2; P < 0·05). This lipid liver fraction was reduced in OZR, but not in LZR, by PLC-supplemented drinking water (Table 2; P < 0·05). Both PLC-OZR and W-OZR showed lower plasma levels of adiponectin (Table 2; P < 0·001), which was not affected by PLC administration.
Effect of propionyl-l-carnitine on vascular and endothelial functions of obese Zucker rats
Since metabolic effects were not observed in the PLC-LZR group, vascular reactivity experiments only from the W-LZR, W-OZR and PLC-OZR groups are described.
ACh induced concentration-dependent relaxation of both aortae and SMA with intact endothelium (Fig. 3), but failed to induce relaxation in endothelium-denuded arteries (data not shown). W-OZR showed a deteriorated endothelial function in the aorta, since a decreased response induced by ACh was observed in this group when compared with W-LZR (Fig. 3(a); P < 0·05; pD2 = 6·76 (sem 0·04) and 7·14 (sem 0·05), respectively). PLC supplementation was not able to restore this dysfunction (Fig. 3(a); pD2 = 6·80 (sem 0·06)). As for SMA, neither obesity nor chronic PLC administration affected the vasorelaxant response induced by this muscarinic agonist (Fig. 3(c)).
Concentration–response curves to acetylcholine (ACh; a and c) and to sodium nitroprusside (SNP; b and d) of aortae (a and b) and small mesenteric arteries (SMA) (c and d) from obese Zucker rats receiving water (vehicle) only (○; W-OZR), lean Zucker rats receiving water only (△; W-LZR) or propionyl-l-carnitine-treated OZR (●; PLC-OZR). Data are means for five animals per group, with standard errors represented by vertical bars. * Significantly different from W-LZR (P < 0·05). † Significantly different from W-OZR (P < 0·05).
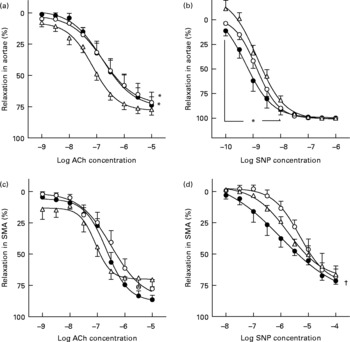
The experiments developed with the NO donor sodium nitroprusside revealed that endothelium-independent relaxation was not different between W-LZR and W-OZR both in aortic rings (Fig. 3(b); pD2 = 8·85 (sem 0·07) and 8·87 (sem 0·01), respectively) and in SMA (Fig. 3(d); pD2 = 5·73 (sem 0·07) and 5·31 (sem 0·05), respectively). Interestingly, OZR receiving PLC showed an enhanced response induced by sodium nitroprusside both in aortae (Fig. 3(b); pD2 = 9·25 (sem 0·06); P < 0·05 v. W-LZR) and SMA, in particular, when lower concentrations of sodium nitroprusside were used (Fig. 3(d); pD2 = 6·00 (sem 0·14); P < 0·05 v. W-OZR).
Both W-OZR and PLC-OZR showed a diminished response to Phe (Fig. 4(b) and (c); maximal contraction effect (Emax) = 1·38 (sem 0·11) and 1·28 (sem 0·10), respectively) when compared with W-LZR (Fig. 4(a); Emax = 1·62 (sem 0·12); P < 0·05). PLC administration did not exert any change in the Phe-induced contraction in obese animals.
Concentration–response curves to phenylephrine (Phe) of aortae from (a) lean Zucker rats receiving water (vehicle) only (W-LZR), (b) obese Zucker rats receiving water only (W-OZR) and (c) propionyl-l-carnitine-treated OZR (PLC-OZR). Curves were done in the absence of functional endothelium (●; PheE( − )) or in the presence of functional endothelium (○; PheE(+)). Curves in the presence of functional endothelium were taken as the control. Significantly different from the control: * P < 0·05, ** P < 0·01, *** P < 0·001. † Significantly lower response compared with that of W-LZR in (a) (P < 0·05). (d) Contribution of the endothelium to the effect of Phe, calculated as the difference among areas under curves (AUC) to Phe in the absence and in the presence of functional endothelium. † Mean value was significantly different from that of the W-OZR (P < 0·05). All data are means for five animals per group, with standard errors represented by vertical bars.
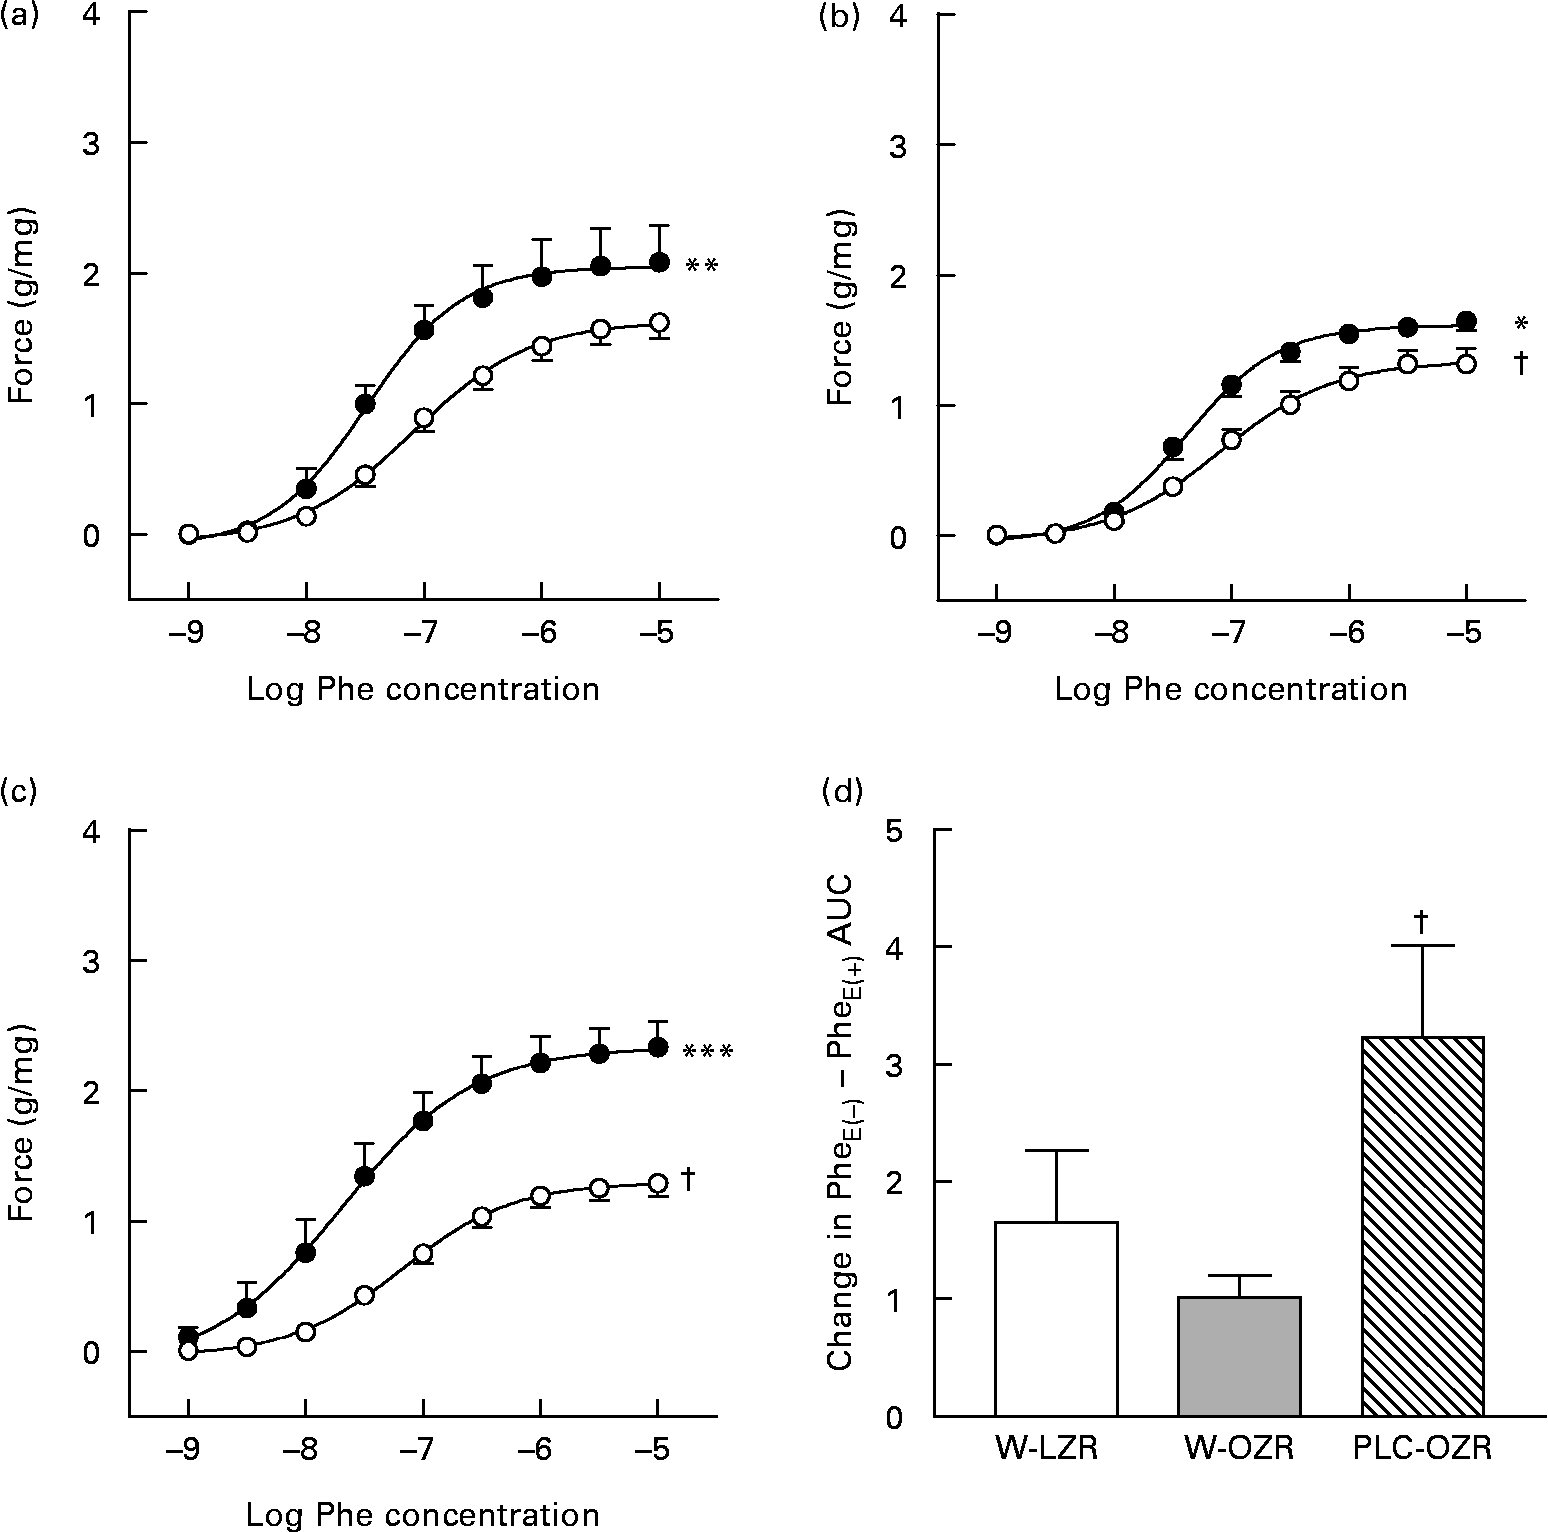
As shown in Fig. 4, when functional endothelium was removed, the contractile response induced by Phe increased in all the groups, which indicates the participation of endothelium-derived factors in the vascular function. If the difference between the areas under the curves in the presence or in the absence of endothelium is calculated, the extent of the participation of endothelium-derived factors in every group can be ascertained. After analysing the difference between areas under the curves in the presence or in the absence of endothelium for each group, the highest endothelium-derived factor participation was found in the PLC-treated obese animals (Fig. 4(d); P < 0·05).
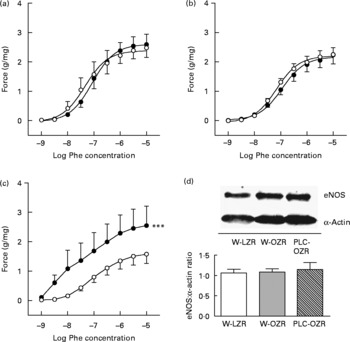
Accordingly, pre-incubation with the NOS inhibitor N G-nitro-l-arginine methyl ester (l-NAME) induced an enhanced contraction to Phe in aortic rings from OZR (Fig. 5(c); P < 0·001) receiving PLC, but not in untreated obese animals (Fig. 5(b)) or W-LZR (Fig. 5(a)), revealing an enhanced participation of NO in the vascular response of arteries from PLC-treated obese rats. Nevertheless, this effect was not associated with changes in the endothelial NOS protein expression in the aortae of these animals (Fig. 5(d)).
Concentration–response curves to phenylephrine (Phe) of aortae from (a) lean Zucker rats receiving water (vehicle) only (W-LZR), (b) obese Zucker rats receiving water only (W-OZR) and (c) propionyl-l-carnitine-treated OZR (PLC-OZR). Curves were done in the presence (●) or in the absence (○) of the NO synthase (NOS) inhibitor N G-nitro-l-arginine methyl ester (l-NAME). Curves in the absence of l-NAME were taken as the control. *** Significantly different from the control (P < 0·001). (d) Endothelial NOS (eNOS) protein expression analysed by Western blotting in aortic rings. All data are means for five animals per group, with standard errors represented by vertical bars.
Discussion
The present study demonstrates that PLC (200 mg/kg) supplementation administered to obese and insulin-resistant animals is able to reduce body-weight gain, adiposity and food intake. Furthermore, hyperinsulinaemia, liver TAG content and, therefore, the insulin-resistant state were partially corrected by the treatment. On the contrary, neither TAG nor cholesterol nor NEFA plasma concentrations were affected by the ingestion of PLC. These effects were not observed in lean animals. The present results suggest that adjunct therapy with this compound may be useful for the treatment of patients with the metabolic syndrome.
The metabolic syndrome is characterised by the simultaneous occurrence of metabolic abnormalities including obesity, glucose intolerance, dyslipidaemia and hypertension that results in an increase of cardiovascular morbidity and mortality(Reference Alberti, Zimmet and Shaw4). The OZR is a common animal model for the study of obesity and the metabolic syndrome. These animals are characterised by overweight, hyperlipidaemia, hyperphagia and hyperinsulinaemia(Reference Zucker and Antoniades15) and several studies have found that they develop mild hypertension at age 22–25 weeks(Reference Arvola, Wu and Kahonen16–Reference Subramanian and MacLeod18). In addition, these animals exhibit impairment of endothelium-dependent vasodilatation(Reference Subramanian and MacLeod18, Reference Galisteo, Sanchez and Vera19) and enhancement of adrenergic tone(Reference Frisbee and Delp20).
The present results confirmed the presence of endothelial dysfunction and the development of hypertension at the age of 32 weeks. In contrast to that found in hypertensive animals(Reference Bueno, Alvarez de Sotomayor and Perez-Guerrero9–Reference de Sotomayor, Mingorance and Rodriguez-Rodriguez11), PLC administration was not able to restore ACh-induced relaxation, which is a common tool to evaluate the capacity of endothelial cells to release vasoactive substances, such as NO or cyclo-oxygenase-derived products. Nevertheless, concentration–response curves to Phe revealed a greater difference among the contraction of endothelium-intact and denuded aortae in PLC-treated obese rats. This result suggests an enhancement in the release of endothelial vasodilator factors upon adrenergic stimulation. In addition, an enhanced response to low concentrations of the NO donor was found. Similar findings were reported in hypertensive rats, being then associated with the increase in NO participation in Phe-induced contraction(Reference Bueno, Alvarez de Sotomayor and Perez-Guerrero9, Reference Alvarez de Sotomayor, Bueno and Pérez-Guerrero10). In fact, an enhanced participation of this important endothelium-derived vasodilator factor was exclusively shown by OZR after receiving PLC-supplemented drinking water.
Adiponectin is an abundant plasma protein secreted from adipocytes that elicits protective effects in the vasculature and myocardium. In obesity and insulin-resistant states, adiponectin levels are reduced and loss of its protective effects might contribute to the excess cardiovascular risk observed in these conditions. Some of the described mechanisms by which adiponectin exerts its protective action are the enhancement of NO production and the suppression of reactive oxygen species production in endothelial cells and the protection of these cells from inflammation(Reference Goldstein, Scalia and Ma21). Nevertheless, PLC administration was not able to improve the adiponectin secretion by adipocytes in obese animals, being the improvement of endothelial function found after PLC treatment non-related to the changes in this adipokine.
Other facts, such as antioxidant properties of PLC(Reference Gómez-Amores, Mate and Revilla22), may be more likely to be involved in the enhancement of NO participation found after administration of this compound. PLC is able to reduce superoxide production in arteries, linked to the increase of Cu/Zn-superoxide dismutase expression(Reference de Sotomayor, Mingorance and Rodriguez-Rodriguez11), which may contribute to prevent NO degradation by superoxide anions. In addition, several studies have confirmed that PLC was able to increase endothelial NOS expression as found in both in vitro (Reference Calo, Pagnin and Davis23) and in vivo (Reference Alvarez de Sotomayor, Bueno and Pérez-Guerrero10, Reference de Sotomayor, Mingorance and Rodriguez-Rodriguez11) experiments. In contrast, as revealed by the results of the present study, PLC did not exert any effect on this enzyme protein expression in obese animals. A possible increase of endothelial NOS activity may be considered, even though further studies would be necessary to test this hypothesis.
Both the antioxidant properties and the enhancement of NO bioavailability have been also put forward as part of the mechanism underlying the beneficial effects of PLC on peripheral vascular disease(Reference Loffredo, Pignatelli and Cangemi24). Clinical trials have shown that PLC improves exercise performance and functional status in patients with claudication without notable adverse events(Reference Hiatt, Regensteiner and Creager25). This compound has also shown some benefits in the cardiac function of patients with congestive heart failure(Reference Ferrari, Merli and Cicchitelli26). Its benefits to those pathologies have been related to the previously described endothelial effects, but also to its metabolic properties. In this sense, PLC was able to enhance rates of glucose and palmitate oxidation in diabetic hearts(Reference Broderick, Driedzic and Paulson27).
Altogether, these findings suggest that PLC may be beneficial in obesity, insulin resistance and the metabolic syndrome. In spite of these antecedents, there are not many studies evaluating the effects of l-carnitine and its derivates on this pathology. The most relevant finding was carried out in obese mice and revealed that l-carnitine supplementation relieves lipid overload and glucose intolerance by enhancing mitochondrial efflux of excess acyl groups from insulin-responsive tissues(Reference Power, Hulver and Zhang28). The effects of PLC treatment could be well related to the l-carnitine part of the compound, since oral PLC administration led to the enhancement of l-carnitine concentration in plasma(Reference Gómez-Amores, Mate and Revilla22). Nevertheless, we cannot exclude those effects related to the propionylic part of the molecule. Insulin resistance is not only an impaired ability to promote glucose utilisation in insulin-sensitive tissues, but also a deterioration of other insulin effects, such as the stimulation of lipogenesis by the adipose tissue and the inhibition of lipolysis. The main manifestations of this situation are increased plasma glucose and insulin levels, as well as higher plasma concentrations of NEFA that finally are stored as TAG in the liver. The present results confirmed the reversal of glucose intolerance and the prevention of insulin resistance, as the improvement of hyperinsulinaemia and the decreased HOMA-IR value found in obese animals receiving PLC revealed. In addition, although no changes in the concentration of NEFA were found, PLC administration was able to diminish the liver TAG content in obese animals. Finally, a decrease in the daily food intake and likely consequent decreases in body weight and visceral adiposity were found in fatty animals receiving PLC, which may be directly related to the reduction of hyperinsulinaemia, since the latter and hyperphagia are associated situations(Reference Durham and Truett29).
In summary, we have shown that PLC treatment improved insulin resistance, decreased body weight and adiposity and protected vascular function in an animal model of the metabolic syndrome. These and previous(Reference Power, Hulver and Zhang28) outcomes support the necessity of clinical trials showing the effect of l-carnitine supplements on insulin-resistant and obesity states.
Acknowledgements
The present study was supported by funds obtained from the Andalusian Regional Government (CTS-178). C. M. is a fellow of the Spanish Government, Ministry of Science and Technology.
M. A. S. and C. M. performed the experiments. M. A. S. and M. D. H. designed the study. All the authors participated actively in writing the manuscript.
There are no conflicts of interest to report.


