


Introduction
Karanis is a Greco-Roman farming village in the Fayum Oasis, Egypt, with a long history of scholarly attention (Figure 1). The site was already known to nineteenth-century archaeologists for the sheer number of papyri that were retrieved from the sand (Haug Reference Haug2021); a team from the University of Michigan, led by Francis Kelsey and Enoch Peterson, conducted large-scale excavations from 1924 until 1935, exposing residential areas, production facilities, granaries, temples and a bath complex (Boak & Peterson Reference Boak and Peterson1931; Peterson Reference Peterson1973; Husselman Reference Husselman1979). Subsequent field projects include the investigation of the bath-house by Cairo University and Institut Français d'Archéologie Orientale (El-Nassery et al. Reference El-Nassery, Wagner and Castel1976), the more recent URU Fayum Project (a collaboration between the Universities of California-Los Angeles, Groningen and Auckland; Cappers et al. Reference Cappers, Cole, Jones, Holdaway, Wendrich, Arl and Stadler2013; Barnard et al. Reference Barnard, Wendrich, Nigra, Simpson and Cappers2015) and the new excavations under the direction of B. Simpson, Virginia Commonwealth University, Qatar.
Location of Karanis and nearby settlements (map data ©2015 Google; vector data by the Digital Atlas of the Roman Empire (DARE), under CC BY 4.0; figure by authors).

Karanis offers one of the most extensive datasets available for the study of everyday Roman life and is often presented as a case study alongside Pompeii (Wilburn Reference Wilburn, Parker and McKie2018). It has been used both implicitly and explicitly as a type-site for Roman domestic architecture and Greco-Roman urban development in Egypt (Davoli Reference Davoli, Subías, Azara, Carruesco, Fiz and Cuesta2011; Boozer Reference Boozer, Chapman and Wylie2014), and the settlement figures prominently in historical narratives (e.g. Bagnall Reference Bagnall1993). Papyri and coins from Karanis inform syntheses on Roman economy (Bowman Reference Bowman, Bowman and Wilson2013; Haug Reference Haug, Hollander and Howe2020), demography and the Antonine Plague (Bagnall & Fryer Reference Bagnall and Frier1994; Nevett Reference Nevett and Rawson2011), the collapse of the Roman Empire (Harper Reference Harper2017) and environmental change (Huebner Reference Huebner2020). Most archaeological research has focused either on architecture and urban planning or various classes of material (see for example Haatvedt & Peterson Reference Haatvedt and Peterson1964; Shier Reference Shier1978; Whitehouse Reference Whitehouse1999; Wilfong Reference Wilfong2021), with only a few studies attempting to contextualise different types of evidence (Van Minnen Reference van Minnen1994; Wendrich et al. Reference Wendrich, Simpson and Elgewely2014; Wilburn et al. Reference Wilburn, Gates-Foster, Cook, Wilfong and Ferrara2014; Claytor & Verhoogt Reference Claytor and Verhoogt2018). Despite the volume of research and publications, and the site's key role in historical reconstructions, the chronological framework for the development of the town remains poorly defined. The earliest settlement has barely been explored and its ultimate abandonment is widely debated, with some indication that the current mid-fifth century AD date for this event is too early.
The timing of the ‘decline and fall’ of Karanis has wider significance for the understanding of the socioeconomic history of late antiquity and for the environmental changes affecting the Fayum region at the end of the Roman Climatic Optimum (often situated in the third–fourth centuries AD). To address the crucial question of chronology, we selected 13 archaeobotanical specimens for radiocarbon dating. The organic remains pertain to the material excavated in the 1920s that was granted to the University of Michigan through an agreement with the Egyptian government and is conserved at the Kelsey Museum of Archaeology.
The dates discussed here are the first secure absolute dates from a Greco-Roman settlement in Egypt. Though there is a long-standing relationship between radiocarbon dating and Egyptian historical chronology (Shortland & Bronk Ramsey Reference Shortland and Bronk Ramsey2013), the first millennium AD is almost never represented, with only one burial site—also in the Fayum region—reported for this period (Evans et al. Reference Evans, Whitchurch and Muhlestein2015). Previous radiocarbon (14C) analysis on a sample of structural wood from the north baths at Karanis provided an unreliable conventional age of 1340±230 BP (213–1165 AD; Castel Reference Castel, Boussac, Fournet and Redon2009).
The issue of chronology
The chronological framework for the site was established by the first excavators through papyrological and numismatic evidence. Pottery was considered less useful because of the lack of dated comparative material (Boak Reference Boak1955; Haatvedt & Peterson Reference Haatvedt and Peterson1964; Husselman Reference Husselman1979). As was customary research practice at the time, only a selection of complete vessels was collected and sherds were discarded.
Not much is known about Karanis in the Ptolemaic period (305–30 BC). The first textual source mentioning the site is dated to the mid-third century BC (Alston Reference Alston2002: 228). Sparse remnants of the pre-Roman period are associated with the south temple and a few other small areas (Husselman Reference Husselman1979: 10) and the town saw a marked expansion northward during the first and early second century AD (Gazda Reference Gazda2004: 9). While the chronology of the founding of the settlement and the early Roman period are not considered problematic, disagreement and uncertainty surround the end date of occupation at Karanis.
Papyrological evidence indicates that Karanis was still flourishing in AD 170, but the progressive scarcity of coins and papyri datable to the late fourth and early fifth centuries, along with the absence of coins after about AD 460, led the excavators to conclude that the site was notably depopulated in the early fourth century (Boak Reference Boak1955) and no longer inhabited in the fifth century (Boak & Peterson Reference Boak and Peterson1931: 5). In her volume, Husselman (Reference Husselman1979: 9–29) reinforces the narrative of a late-second-century downturn in the prosperity of the settlement, possibly affected by the Antonine Plague (AD 165–180), followed by a phase of revival in the third century, serious economic and population decline in the fourth century and complete abandonment in the middle of the fifth century.
Most subsequent scholarship has accepted this chronology (most recently Bagnall Reference Bagnall2021: 143–9) with some variations. For example, van Minnen (Reference van Minnen1995) suggests a revival in the later part of the third century and beginning of the fourth century AD, before Karanis became deserted in the fifth century. Nevertheless, more studies have begun to question the timing of Karanis's decline and abandonment. A few discordant voices propose that the village continued in some form until the seventh, or possibly even the eighth century, on account of coins and documentary sources that had been overlooked (Whitehouse Reference Whitehouse1999; Wilfong Reference Wilfong and Bard1999; Keenan Reference Keenan and Bagnall2007: 227–8). Meanwhile, new archaeological work in the eastern and western areas of the settlement has shown that a substantial expansion of Karanis occurred in the fourth century AD followed by continuous remodelling and reconstruction during the fifth, including a new granary (Cappers et al. Reference Cappers, Cole, Jones, Holdaway, Wendrich, Arl and Stadler2013; Barnard et al. Reference Barnard, Wendrich, Nigra, Simpson and Cappers2015). Re-evaluation of the late Roman and Byzantine ceramics in the Kelsey collections supports a later date for the final occupation—at least into the sixth century (Pollard Reference Pollard1998). Amphorae and African Red Slipware, once dismissed as lost objects or the result of squatting episodes, seem to indicate a continuous participation in Mediterranean trade networks long after the traditional date of the settlement's decline (Johnson Reference Johnson1981; Pollard Reference Pollard1998; Gupta-Agarwal Reference Gupta-Agarwal2011).
The full results of the most recent investigations have yet to be published (preliminary data in Cappers et al. Reference Cappers, Cole, Jones, Holdaway, Wendrich, Arl and Stadler2013; Simpson Reference Simpson2014; Barnard et al. Reference Barnard, Wendrich, Nigra, Simpson and Cappers2015), but the image that emerges is one of a complex asynchronous patchwork of urban blocks and neighbourhoods that were progressively modified, reorganised, abandoned and sometimes reinhabited.
The level system of the Michigan excavations
The excavation recording system employed in the 1920s–1930s used ‘levels’ to document the vertical accretion of the mound and the structures within them, with the aim of tracing both the diachronic and horizontal development of the settlement. As the excavation proceeded, five discrete levels of occupation and construction were distinguished; from A, the uppermost and most recent, through to E/F, the oldest. Accurate plans and sections were made for every level in each grid area (Figure 2). Inside each level, structures and their individual rooms were given unique identifiers, establishing a naming convention used to record the findspots of individual artefacts.
North-south (top) and west-east (bottom) sections of the F10 quadrant showing the A-B-C levels, the superimposition of houses and the windblown sand deposit between levels B and A (adapted from KMA drawer 16, no. 71/no. 86; figure by authors).

While differing from modern excavation standards (Landvatter Reference Landvatter, Wilfong and Ferrara2014), Michigan's recording system was unparalleled for the time and was marked by an impressive degree of photographic and topographic documentation (Gazda Reference Gazda2004: 4–5; Wilburn Reference Wilburn and Gagos2010; Wilfong Reference Wilfong and Riggs2012), representing an unprecedented attempt to understand a very complex urban stratigraphy and to correlate structures in different areas. The Michigan levels have been used ever since as the framework for interpreting the site.
The publications of the Michigan expeditions provided an approximate chronological range for the five levels (Peterson Reference Peterson1973; see also online supplementary material (OSM) Figure S1). According to Husselman's revision (Reference Husselman1979: 10), levels D and E/F denote the Ptolemaic period, from the foundation of the village to the Roman conquest, with D ending in the early first century AD. Level C is the rapid expansion of the settlement between the mid-first century and the mid-second century AD. Level B constitutes the continuous vertical accretion of the settlement as organic debris, refuse and windblown sand accumulated in open areas. Structures were modified, floors and doorways raised and new houses eventually rebuilt on top. There is no break in occupation, and the date of level B varies from the late second/early third century to late third/early fourth century AD. Level A is the topmost level, and is less well preserved than C and B. It ranges from the late third/early fourth century to the mid-fifth century AD. In contrast to level B, A represents a conspicuous discontinuity in the urban layout and architectural traditions from the previous phases (Simpson Reference Simpson2014: 166–72) and it is often separated from level B by a layer of windblown sand (Figure 2).
From the beginning, the Michigan excavators acknowledged that the reality of the stratification and the chronology of the layers was not easy to define. Indeed, they recognised the difficulties in correlating the same level in different excavation areas since the continuous transformation, abandonment and reconstruction of standing structures occurred simultaneously with the building of new ones (Boak & Peterson Reference Boak and Peterson1931: 39–40; Husselman Reference Husselman1979: 9–30; Gazda Reference Gazda2004: 22).
Materials and methods
The dry environment and the encroaching desert preserved architectural structures and an enormous wealth of perishable artefacts and ecofacts at Karanis. Thanks to Kelsey's modern vision to provide a “reconstruction of the environment of life in the Graeco-Roman period” (Gazda Reference Gazda2004: 4), not only were papyri collected, but so were wooden furniture and implements, basketry, textiles and, importantly, crop remains (see Boak Reference Boak1933 for a preliminary report). The excavators retrieved a wide range of both desiccated and charred plant materials, from crops found in storage containers, to gourds, bundles of garlic and single fruit stones.
These remains were meticulously excavated, documented, assigned a field number denoting their recovery context and then added to the Record of Objects—a catalogue of individual finds reporting the structure and the room in which they were found (Landvatter Reference Landvatter, Wilfong and Ferrara2014). Objects granted to the University of Michigan and curated at the Kelsey Museum are also identified by an accession number.
The selection of samples for 14C analysis from the Kelsey legacy collection required a particular awareness of some recurring issues in radiocarbon dating: the type of material, its provenance and potential contamination. The extensive and exceptionally well-preserved collections offer a huge range of suitable organic artefacts, but such artefacts could be, and indeed were, reused over a long period. This is especially true for wood and structural timber that needed to be imported into the region and was often reclaimed (Vermeeren Reference Vermeeren and Thanheiser2016). Karanis is characterised by a deep urban stratigraphy of vertically superimposed structures that were irregularly remodelled, reused and gradually abandoned. The intensive occupation and extended use of the same location increases the probability of the mixing of material from different time periods, and thus of different radiocarbon ages. Fragments of artefacts made of desiccated plant material (e.g. baskets, sandals and ropes) are also light and, transported by the wind, are easily incorporated in the accumulating sand. It is therefore important to understand not only the provenance but also what each specimen represents in its context (Dee et al. Reference Dee, Rowland, Higham, Shortland, Brock, Harris and Ramsey2012; Davoli Reference Davoli, Caputo and Lougovaya2020). In addition, the organic remains were collected before the development of radiocarbon sampling protocols and might have been treated for consolidation without proper recording (Dee et al. Reference Dee, Rowland, Higham, Shortland, Brock, Harris and Ramsey2012).
With these issues in mind, we selected the seeds of short-lived plants that had not previously been studied or chemically treated. These were annual crops collected during the 1924–25 and 1927 excavation seasons, often still in their original vessel. For clarity, we use either the last five or the last four digits of the museum catalogue accession number (without the initial zeros) as our sample numbers (Table 1). The excavation recording system allows for the contextualisation of the specimens in the structures and rooms from which they were retrieved (Figure 3; see OSM and Figure S2 for detailed descriptions). About half of the samples were excavated in houses assigned to level A, two belong to one level-B house, and three to level C. Levels D and E/F are not represented in this study. Two samples do not have context information: sample 3700 was recorded as a ‘surface find’ during the 1925 field season and sample 9.2905 does not appear in the Record of Objects.
Specimens selected for radiocarbon dating and their provenance (Kelsey Museum of Archaeology).

Composite map of A-B-C-level structures at Karanis showing the location of samples taken for 14C dating (vector data for Karanis structures by the Karanis Housing Project; figure by authors).

The position of the specimens in the structures and/or their density and amount in the findspot (frequently several kilograms; Figure 4) in each case exclude the possibility that they are from mixed deposits or are intrusive. Instead, the crops were either left behind during the abandonment of the house in which they were found or represent an intentional deposition of waste in disused structures. Samples 9.2905 and 3700 are exceptions, but they were included to ascertain their antiquity since surface-find field numbers were occasionally given to modern objects mixed with excavated materials (see Wilfong Reference Wilfong2021 for a discussion of notable examples).
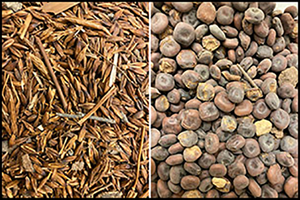
Left) sample 3706, six-row hulled barley; right) sample 3699, lupin seeds (figure by authors).

Each specimen was identified to the lowest possible taxonomic level using a stereomicroscope and botanical reference collections (Figure 5). AMS radiocarbon dating was conducted at the 14CHRONO Centre, Queen's University Belfast. Sample preparation and the acid-alkali-acid chemical pre-treatment followed the lab's standard protocols (Reimer et al. Reference Reimer, Hoper, Macdonald, Reimer and Thompson2015). Correction for isotopic fractionation was based on δ13C values measured by the accelerator mass spectrometer. The calibrated age ranges were generated with CALIB v.8.2 (Stuiver & Reimer Reference Stuiver and Reimer1993) using the IntCal20 dataset (Reimer et al. Reference Reimer2020).
Dated specimens. For taxonomic information see Table 2 (photographs by A.M. Hansen & A.J. Bronkhorst).

Radiocarbon dates with calibrated age ranges from CALIB 8.2 and IntCal20 calibration curve. The 14C/12C ratio of the sample relative to that expected from AD 1950 (F14C) is also reported.

Results
We analysed 13 samples from 10 different houses. The results are reported in Table 2; the full laboratory report is available in the OSM and Table S1. The 14C ages are younger than expected and place the samples in the middle of the first millennium AD. The calibrated dates have a wide chronological range due to the shape of the calibration curve for this time period. The earliest sample (3705) dates from the late fourth to the beginning of the fifth century AD, while most samples span from the beginning of the fifth century to the second half of the sixth century AD. The latest samples (2.3214 and 3700) show similar dates, reaching into the middle of the seventh century, the period of the Islamic conquest. None of the crops can be attributed to the Ptolemaic period or to the expansion of the settlement during the early Roman period.
A phase model with outlier analysis (OxCal 4.4.4 Bronk Ramsey Reference Bronk Ramsey2009; calibrated with IntCal20) was developed to define the chronological range for levels A, B and C (Figure 6; model code available in Figure S3). Several of the dates have poor agreement and the overall agreement index is 15.6 per cent. An agreement below 60 per cent indicates that the model is not likely given the data. In addition, the model shows considerable overlap in the boundaries between levels A/B and B/C.
OxCal (version 4.4.4) phase model with the radiocarbon dates constraining the assigned levels. Outlier probability was set to five per cent for all samples (figure by authors).

Dating the late occupation of Karanis
All the analysed materials date later than the established chronology for the abandonment of the structures from which they were retrieved (information from Peterson Reference Peterson1973; see OSM). For example, the original excavators dated House 120 to the first half of the fourth century AD based on the most recent papyri recovered from the building. The date range of a pot containing lupin seeds from room B2 (sample 3699; Figure 7) instead extends from the mid-fifth to the sixth century AD. Fourth-century papyri also mark the abandonment of the long-lived House C53, while the wheat (sample 2.3214) left behind in its storage area dates from two to three centuries later.
House 120, Room B during excavation and the pot that contained lupin seeds (sample 3699) (KMA Karanis Archives photograph 5.1689; 005; figure by authors).

This trend becomes more evident when the 14C results are plotted in relation to the level assigned to the house in which the crops were found (Figure 8). As expected, there is less discrepancy with the houses assigned to level A since they typically represent the later phase of occupation of the site. On the other hand, the dates of level-C structures appear to be off by several centuries. It is notable that there is no correspondence between the assigned level and the chronology of the finds, not even in relative terms: level-C dates should be earlier than those from level B, and those from level B earlier than those from level A. Indeed, the OxCal phase model (Figure 6) indicates that the radiocarbon dates do not support the existence of discrete levels and strongly suggests that the level system cannot even provide broader relative phases.
Time-level model. Probability distribution of calibrated dates plotted versus the level to which their contexts were assigned. Darker-coloured blocks in each level represent the expected chronological range for comparison. Samples 3705 and 3959 have been placed in level A since they were excavated during the first season in contexts not covered by other structures (figure by authors).

The complex life histories and instances of reuse observed in each structure undermine the effectiveness of the level system in accurately reflecting the development of the town and its true chronology (Landvatter Reference Landvatter, Wilfong and Ferrara2014; Claytor & Verhoogt Reference Claytor and Verhoogt2018). Yet, the levels can be used as a coarse internal stratigraphy and combined with radiocarbon dates to create a sequence of ‘before and after’ in a single structure or lot. House 5083 (B561) clearly demonstrates the potential of this combined approach. This is a level-B structure above a level-C house (C461) that was replaced in level A by House 657. Two pots containing crops (samples 3697 and 3698) in room B represent either the last moment of use or the abandonment of the level-B house. In either case, the chronology of the crops provides a terminus ante quem for the earlier house C461, and a terminus post quem for the level-A house 657. Even more suggestive is the case of House 5036, a long-lived level-C structure that reuses some walls from the previous, and poorly attested, level E. The house was abandoned and covered by a layer of sand before being rebuilt as two different houses (B156 and B157) in level B, followed by additional construction in level A (Houses A167 and A155). Sample 3702 provides a date of cal AD 427–560 (at 95.4% probability; Table 2) and was found below, or embedded in, the layer of sand. This distinct hiatus in the life of House 5036 indicates that the following two phases of construction and remodelling must have been in the sixth century or possibly later. House C51 also had a long lifespan. In this case, the level-B house B227 served as the second floor of the level-C C51 structure after its underground space and first floor were filled with sand and its main stairway closed (Figure 9). A ceramic vessel filled with seeds (sample 9.2904) dates the abandonment of the first floor to between the mid-fourth and mid-fifth century AD. It follows that the life and subsequent abandonment of the structure (as House B227) should be placed after the middle of the fifth century AD. Nearby, another example of a long-lived house (C53) was abandoned prior to the level-B phase of occupation in the area according to Peterson (House B108; Peterson Reference Peterson1973: 457). Sample 2.3214 provides a much later date, in the late sixth to mid-seventh century, and should be the terminus post quem for the overlying level-A structure (House 225), unless the first floor of C53 was still usable as underground storage for B108 and 225.
Top row) House C51, Room B before (left) and after (right) excavation of its abandonment fill—the layer of sand is visible below the collapse of the second floor; lower left) plans and sections of the house in its original configuration; lower right) section showing the second floor as House B227 and the layer of sand in Room C51B (KMA Karanis Archives photographs 5.2553; 5.2756; 5.7817; 5.8218; figure by authors).

The excavators themselves acknowledged the limitations of the level system, as it was often revealed that houses with significantly different chronologies coexisted within the same area (Husselman Reference Husselman1979: 9–30). Houses C51 and C53 illustrate this issue. Located in front of each other across street CS 52, the two houses, as we have seen, were remodelled several times and adjusted to match rising street levels. Thus, they were in use simultaneously with later structures assigned to levels B and A in the same neighbourhood (Figure 2). Finally, C51 was abandoned and repurposed at least one century before C53.
The 14C results reported here support the broader revision of Karanis's chronology suggested by a diverse body of artefacts, including lamps (Shier Reference Shier1978), glass (Whitehouse Reference Whitehouse1999) and imported vessels. Among the African Red Slipware forms found during the excavation, Hayes 91 and 93 can be dated through the fifth century but Hayes 99, 103 and 104 become common in the mid-sixth century. Most of the late Roman amphorae recovered from Karanis are types that remained in use until the mid-seventh century and some variants of the LRA7 type, the second most frequent type at Karanis, might reach into the eighth century (Pollard Reference Pollard1998; see also Caputo & Davoli Reference Caputo, Davoli, Caminneci, Giannitrapani, Concetta Parello and Serena Rizzo2023). The radiocarbon results also provide new perspectives on the significant number of coins from the sixth and seventh centuries AD recovered from the settlement and originally dismissed as items lost by sporadic visitors (see Keenan Reference Keenan2003 for a discussion). The new dates for the central area of the settlement, integrated with the evidence of expansion and continuous habitation up to the sixth century in the east and west suburbs (Cappers et al. Reference Cappers, Cole, Jones, Holdaway, Wendrich, Arl and Stadler2013; Barnard et al. Reference Barnard, Wendrich, Nigra, Simpson and Cappers2015), suggest that Karanis continued to exist as a settlement of considerable size well after the mid-fifth century AD.
Conclusion
This article represents the first attempt to define an absolute chronology of Karanis through radiocarbon dating, using museum collections and legacy data. Our results suggest that Karanis was not in complete decline during the fourth century AD and neither was it a “sporadic settlement … virtually abandoned” (Haatvedt & Peterson Reference Haatvedt and Peterson1964: 2–4), nor in its “final spasm of life” by the beginning of the fifth century (Bagnall Reference Bagnall1993: 111). Instead, the settlement remained consistently inhabited in the sixth century and appears to have survived in some form at least up to the period of the Islamic conquest in the seventh century AD. To what extent it retained its prosperity is difficult to assess with the current data and without a better understanding of its changing urban fabric. It also remains unclear precisely when Karanis was ultimately abandoned and in what fashion; the absence of papyri and coins cannot be taken as an indication of the absence of people. The presence of urban debris and waste in disused structures attests to human activities and points to progressive abandonment of some neighbourhoods, or parts of neighbourhoods, with new or continued habitation in nearby areas. As recent work shows, refuse management is as much a sign of continued life as it is of vacant places, settlement decline and population reduction (Bar-Oz et al. Reference Bar-Oz2019; McCormick Reference McCormick2019; Emmerson Reference Emmerson2020: 92–124). The dated crops presented here should therefore be interpreted as goods left behind at the end of the use of a structure or garbage intentionally dumped inside disused or partially vacant buildings and they are precious evidence of persistent frequentation.
The implications of our findings are far reaching. The Fayum depression, with its villages and canals, was an artificial landscape, an interdependent anthropic ecological system that relied on a variable equilibrium between Nile levels, state power and the agency of local communities (Heinrich & Hansen Reference Heinrich, Hansen, Erdkamp, Manning and Verboven2021; Haug Reference Haug2024). Multiple settlements depended on shared public canals. Common knowledge of the landscape and practical understanding of the rhythms of the Nile allowed the management and exploitation of this delicate anthropic environment (Bunbury Reference Bunbury, Altaweel and Zhuang2018). The documentary record indicates that a portion of the previously flourishing and prosperous farming villages, in the most environmentally vulnerable north-eastern and north-western margins of the depression, were already reduced to hamlets coping with water issues, desertification and a decreasing population in the third century AD. It remains to be determined how the final abandonment of these villages (Huebner Reference Huebner2020; Haug Reference Haug2024) relates to the expansion and revival of Karanis. It has been suggested that a long series of lower-than-expected Nile floods during the third century, attributed to climatic deterioration, reduced water availability in the Fayum canals and produced a drastic drop in the level of lake Qarun, triggering migration from the impacted villages to Karanis (Huebner Reference Huebner2020). Alternatively, Barnard and colleagues (Reference Barnard, Wendrich, Nigra, Simpson and Cappers2015) argue that catastrophic flooding pushed the neighbouring population to Karanis's higher ground. Both hypotheses assume unexpected and unmanageable changes in the cyclical patterns of the Nile's behaviours (Bunbury Reference Bunbury, Altaweel and Zhuang2018) that affected the depression.
It is a complex task to disentangle political instability, economic processes, unsustainable agricultural practices, population dynamics and adaptation strategies from the environmental factors that shaped the history of the Fayum and, ultimately, the fate of Karanis in the sixth and seventh centuries. Our dates place the abandonment of the settlement within the Late Antique Little Ice Age (mid-sixth to the mid-seventh century AD) and during a period of political transitions, such as the Sasanian conquest of Egypt, the Byzantine reconquest and the following Arab conquest. The causes of the abandonment of Karanis and the decline of the region thus resonate with broader debates on the fall of the Roman Empire and on the socioeconomic transformations at the onset of the Middle Ages, the absolute chronology of which gains new insight from the dates presented here.
Acknowledgements
This work is indebted to S. Herbert and E. Gazda who introduced L. Motta to the organic material from Karanis conserved at the Kelsey Museum of Archaeology. We would like to thank the collection managers, S. Encina and M. Fontenot, for facilitating the study of the collections, and the museum's curators for allowing destructive analysis. D. Wilburn has graciously allowed us to use the Karanis Housing Project GIS vector data. Our gratitude goes to A. Hansen for helping with the botanical identifications, to A. Verhoogt and T. Wilfong for commenting on the draft. All remaining errors are our own.
Funding statement
This research was supported by the Research Foundation-Flanders (FWO) award FWOAL860 ‘Rethinking Roman Nutrition: Nutritional biochemistry and stable isotope chemistry of cereals and pulses from Roman Egypt’.
Data availability
All the data are reported in the main text and in the OSM. The Kelsey Museum open access catalogue is available at https://quod.lib.umich.edu/cgi/i/image/image-idx?c=kelsey;page=index;sid=6fe32576d13b06cc5fdee933ecde5ab0;g=um-ic
Supplementary material
To view supplementary material for this article, please visit https://doi.org/10.15184/aqy.2024.69.


 Open access