Studies in Ireland (Hannon et al. Reference Hannon, Kiely, Harrington, Robson, Strain and Flynn2001; O'Brien et al. Reference O'Brien, Kiely, Harrington, Robson, Strain and Flynn2001) and in other European countries (Scientific Co-operation Task 7.1.1 Working Group, 1997; Brussard et al. Reference Brussard, Russ, Fletcher, Moreiras and Van den Berg1998) have indicated a significant prevalence of inadequate intakes or poor nutritional status for some micronutrients in several population subgroups.
The voluntary addition of vitamins and minerals to foods is one way that micronutrient intakes can be increased and the risk of inadequate intakes can be reduced. The practice of such addition varies widely among EU countries, partly due to varied regulatory environments in the member states. The EC has published a proposal for a regulation on the addition of vitamins and minerals to foods with a view to harmonising legislation throughout member states of the EU (Commission of the European Communities, 2003), which is expected to be adopted in 2006. This has stimulated wide-ranging debate on the benefits, and possible risks, of voluntary fortification.
There are few studies on the impact of voluntary fortification of foods on micronutrient intakes. Sichert-Hellert et al. (Reference Sichert-Hellert, Kersting, Alexy and Manz2000) investigated 10-year trends (from 1987 to 1996) in vitamin and mineral intakes from fortified foods (FF) in children aged 2–13 years in Germany. FF included all products to which one or more vitamins were added, including mandatory additions, such as vitamins A and D added to margarines (for the purposes of restoration) and vitamins and minerals added to children's foods under EU regulations. Over the 10-year period, the mean energy intake from FF increased from 6 to 9 % total energy and the percentage contribution of FF to total intakes of vitamins B1, B2 and B6, folate, vitamin C and niacin increased from 8–19 in 1987 to 20–32 in 1995. There was little change in the contribution to vitamin E intake (about 27–30 %). A follow-up study (Sichert-Hellert et al. Reference Sichert-Hellert, Kersting and Manz2001) showed that the contribution of FF to energy and micronutrient intakes reached a plateau or decreased between 1994–1996 and 2000. These studies also showed that FF contributed a significant proportion of the total intakes of a number of vitamins for which mean intakes would otherwise have been 20–80 % of that recommended, including folate and vitamins A, B1, C and E, suggesting that FF may make an important contribution to adequacy of intakes of these nutrients.
Berner et al. (Reference Berner, Clydesdale and Douglass2001) reported on the contribution of voluntary fortification to vitamin and mineral intakes in the United States between 1989 and 1991. For those aged >1 year, and excluding intakes from nutritional supplements, fortification increased the median intakes of vitamin A (by 21 %), vitamin C (25 %), thiamin (12 %), riboflavin (11 %), niacin (12 %), folate (23 %), Fe (14 %) and Zn (6 %), but did not affect intake of Ca. Increases were observed in all age and gender subgroups, especially in children. Although the effect of fortification on adequacy of nutrient intakes (relative to requirements) was not examined, in many cases, the added nutrients boosted the 25th percentile or median intakes from below to above the RDA.
Studies in a number of countries have shown that added nutrients in fortified ready to eat (RTE) breakfast cereals contribute significantly to the intakes of several micronutrients in different population groups (Crawley, Reference Crawley1993; Sommerville & O'Reagan, Reference Sommerville and O'Reagan1993; McNulty et al. Reference McNulty, Eaton Evans, Woulahan and Strain1994, Reference McNulty, Eaton Evans, Cran, Woulahan, Boreham, Savage, Fletcher and Strain1996; Gibson & O'Sullivan, Reference Gibson and O'Sullivan1995; Ortega et al. Reference Ortega, Requejo, Redondo, Lopez-Sobaler, Andres, Ortega, Gaspar, Quintas and Navia1996; Ruxton et al. Reference Ruxton, O'Sullivan, Kirk and Belton1996; Preziosi et al. Reference Preziosi, Galan, Deheeger, Yacoub, Drewnowski and Hercberg1999; Galvin et al. Reference Galvin, Kiely and Flynn2003; Gibson, Reference Gibson2003). For example, McNulty et al. (Reference McNulty, Eaton Evans, Woulahan and Strain1994) showed that the added nutrients in RTE breakfast cereals made a significant contribution to mean daily intakes (MDI) of thiamin, riboflavin, niacin, vitamins B6, B12, C, D, folic acid and Fe in British adults aged 18–64 years.
McNulty et al. (Reference McNulty, Eaton Evans, Cran, Woulahan, Boreham, Savage, Fletcher and Strain1996) reported that lower proportions of school children aged 12–15 years, who consumed fortified RTE breakfast cereals, had intakes of several B-vitamins and Fe less than the lower reference nutrient intake, compared with non-consumers.
In Ireland and the UK, the voluntary addition of vitamins and minerals to foods has been permitted for many years and a significant number of foods and beverages are now fortified (British Nutrition Foundation, 1994; Richardson, Reference Richardson1997). However, the impact of such fortification on micronutrient intakes and adequacy of intakes has not been assessed adequately. In the present paper, the contribution of FF to MDI of macronutrients and micronutrients is reported and the effect of voluntary fortification of foods on micronutrient intakes, adequacy of intakes and the risk of excessive intakes in 18–64 year old Irish adults is also reported.
Methods
The food consumption and nutrient intake database
This analysis was performed using data from the North/South Ireland Food Consumption Survey (Irish Universities Nutrition Alliance, 2001), which collected food intake data in a representative sample of 18–64 year old adults (n 1379: 662 men; 717 women) in the Republic of Ireland and Northern Ireland from 1997 to 1999. Pregnant and lactating women were excluded. A 7-d estimated food diary was used to measure food intake and a database of habitual food and drink consumption was established. A more detailed account of the methodology of the survey (Harrington et al. Reference Harrington, Robson, Kiely, Livingstone, Lambe, Cran and Gibney2001) and the sampling procedure (Kiely et al. Reference Kiely, Flynn, Harrington, Robson, O'Connor, Hannon, O'Brien, Bell and Strain2001) is provided elsewhere.
Food records were analysed using WISP© (Tinuviel Software, Warrington, UK). WISP© uses McCance and Widdowson's Composition of Foods, 5th edition (Holland et al. Reference Holland, Welch, Unwin, Buss, Paul and Southgate1995) and supplemental volumes (Holland et al. Reference Holland, Unwin and Buss1988, Reference Holland, Unwin and Buss1989, Reference Holland, Unwin and Buss1991, Reference Holland, Unwin and Buss1992, Reference Holland, Brown and Buss1993, Reference Holland, Welch and Buss1996; Chan et al. Reference Chan, Brown and Buss1994, Reference Chan, Brown, Lee and Buss1995, Reference Chan, Brown, Church and Buss1996), food and nutrient database, along with additional data (including analysed recipes of composite dishes, manufacturers' data on generic Irish foods, new products that were commonly consumed and nutritional supplements) to determine nutrient intakes. The data handling, processing and quality control procedures used in the construction of the food consumption and nutrient intake database have been described in detail elsewhere (Harrington et al. Reference Harrington, Robson, Kiely, Livingstone, Lambe, Cran and Gibney2001).
Identification of fortified foods
Foods contained in the database that are fortified were identified from the presence of vitamins and/or minerals in the ingredient list on the label. For the purposes of this paper ‘fortification’ refers to the voluntary addition of micronutrients by food manufacturers, which is identified in product labelling and excludes (semi) mandatory addition of micronutrients to foods (e.g. vitamins A and D to fat spreads and low-fat milk) to ensure ‘nutritional equivalence’ and vitamins and minerals added to flour for the purposes of ‘restoration’. These are considered ‘indigenous’ for the purposes of this discussion. The nutrient composition data were revised for many FF (e.g. many of the RTE breakfast cereals) using up-to-date manufacturers' data. New FF were assigned new food codes with corresponding nutrient composition data from manufacturers.
Pre-fortification levels of micronutrients in FF were obtained from: (a) manufacturers, (e.g. many of the RTE breakfast cereals); (b) compositional data for an unfortified equivalent of the food contained in the database (e.g. breads, milks, carbonated beverages).
The quantity of each micronutrient in FF products per typical serving was estimated and expressed as % of the EC RDA, i.e. the reference value used for nutrition labelling (European Commission, 1990). Typical servings were obtained from manufacturers' typical serving sizes as indicated on food labels or, if these were not present, from published typical weights and portion sizes (Ministry of Agriculture, Fisheries & Food, 1993).
The food consumption database generated from the survey listed each individual food item as consumed by each respondent, together with the nutrient composition for the quantity of each food consumed. Respondents who consumed a FF at any time during the 7 d of recording were classified as consumers of FF.
Adequacy of micronutrient intakes
The average requirement (AR), as estimated by the EC Scientific Committee for Food (1993) was used as a cut-point to estimate the proportion of a population subgroup with inadequate micronutrient intakes and this method has been shown to be effective in obtaining a realistic estimate of the prevalence of dietary inadequacy (Carriquiry, Reference Carriquiry1999). The AR is the daily intake value that is estimated to meet the requirement, as defined by a specified indicator of adequacy, in 50 % of a life stage or gender group (Food and Nutrition Board, 1997). The percentage of the population with a mean daily nutrient intake that is lower than the AR is taken as an estimate of the percentage of the population with inadequate intakes.
For any nutrient, the estimation of the level of inadequacy by this method is most accurate if intakes and requirements of the nutrient are independent of each other, if the standard deviation of intakes is at least twice as large as the standard deviation of requirements, and if the requirements are symmetrically (but not necessarily normally) distributed. The estimate of nutrient intake should represent habitual intake. Misreporting of food consumption can influence the accuracy of the estimate of adequacy, resulting in an underestimate or an overestimate depending on the direction of the bias (Carriquiry, Reference Carriquiry1999). Hannon et al. (Reference Hannon, Kiely, Harrington, Robson, Strain and Flynn2001) and O'Brien et al. (Reference O'Brien, Kiely, Harrington, Robson, Strain and Flynn2001) reported that the standard deviation of the mean intakes of vitamins and minerals in this population sample were greater than the commonly assumed standard deviation of requirement of 15 % of the mean (Scientific Committee for Food, 1993). It is generally assumed that for vitamins and minerals the intakes are independent of requirements and that the requirements for vitamins and minerals are symmetrically distributed, except for Fe in menstruating women (Hannon et al. Reference Hannon, Kiely, Harrington, Robson, Strain and Flynn2001). The skewed distribution of Fe requirements in menstruating women results in an underestimate of the prevalence of inadequate Fe intakes using the cut-point method (Food and Nutrition Board, 2000). Bingham et al. (Reference Bingham, Gill, Welch, Day, Cassidy, Khaw, Sneyd, Key, Roe and Day1994) compared a number of dietary assessment methods to 16-d weighed records. With a 7-d estimated food diary, as used in this survey, individual values of nutrients were most closely associated with those obtained from the weighed record. It is a useful means of measuring habitual intake with regard to most vitamins and minerals except for nutrients, for which a significant contribution to the MDI is made by rich dietary sources that are consumed on an irregular basis (e.g. retinol). The prevalence of inadequate intakes of micronutrients was calculated both including and excluding under-reporters of energy intake, identified as having a ratio of energy intake:BMR of < 1·05 (Black, Reference Black2000). Under-reporting leads to an overestimate of the prevalence of inadequate intakes. The data presented include under-reporters (20 % of total sample), as removal of under-reporters did not change the overall trends observed.
A range of recommended intakes has been established for vitamin D (0–10 μg) depending on sunlight exposure (Food Safety Authority of Ireland, 1999). In the absence of an AR, the percentage with MDI of vitamin D < 5 μg was reported. In the absence of an AR for vitamin E, the lowest threshold intake was used as a cut off value, i.e. the intake level below which nearly all individuals will be unable to maintain metabolic integrity according to the criterion used for each nutrient (Scientific Committee for Food, 1993). The lowest threshold intake can be used to identify individuals with a very high probability of inadequate intakes. While it is of limited value for assessing the prevalence of nutrient inadequacy in populations, a high proportion of individuals with MDI of a nutrient below the lowest threshold intake would indicate that the prevalence of inadequacy in the population is significant.
Folate and risk of neural tube defects
The potential impact of increased folic acid intake from FF on reduction of risk of neural tube defects (NTD) in infants was estimated using the method of Daly et al. (Reference Daly, Kirke, Molloy, Weir and Scott1995, Reference Daly, Mills, Molloy, Conley, Lee, Kirke, Weir and Scott1997). These data describe: (a) the relationship between maternal folate status (as determined by red cell folate measurement) and the risk of NTD (Daly et al. Reference Daly, Kirke, Molloy, Weir and Scott1995); (b) the relationship between additional intake of folic acid (100 μg, 200 μg and 400 μg as supplements) and median red cell folate in women. The effect of additional folic acid intake from FF on red cell folate was estimated by linear extrapolation from the median red cell folate values provided by 100 μg, 200 μg and 400 μg supplements of folic acid used by Daly et al. (Reference Daly, Mills, Molloy, Conley, Lee, Kirke, Weir and Scott1997). The percentage reduction in the risk of NTD was then estimated with reference to the data of Daly et al. (Reference Daly, Kirke, Molloy, Weir and Scott1995).
Excessive micronutrient intakes
The risk of excessive intake of a micronutrient was evaluated by expressing the 95th percentile of intake (P95) as a percentage of the tolerable upper intake level (UL). The UL is defined as the maximum level of total chronic daily intake of a nutrient (from all sources) judged to be unlikely to pose a risk of adverse health effects to man (European Food Safety Authority, 2006). The UL for adults (recently published by the European Food Safety Authority (2006)) for retinol (3000 μg), vitamin D (50 μg), vitamin E (300 mg), vitamin B6 (25 mg), folic acid (1000 μg), Ca (2500 mg) and Zn (25 mg) were used. For pre-formed niacin, the UL for nicotinamide (900 mg) was used, since this is the form generally added to foods. No UL were established for vitamins B1, B2, B12, pantothenic acid or biotin due to lack of evidence of adverse effects associated with high levels of intake. For Fe and vitamin C, the available data were considered insufficient to establish a UL (European Food Safety Authority, 2006).
Data analysis
Data analysis was conducted using SPSS® for Windows™ Version 11.0 (SPSS Inc., Chicago, IL, USA). Data were analysed both including and excluding the fortification component.
Results
Micronutrient content of fortified foods
The survey database contained 2914 food codes that were recorded as consumed, as well as 146 nutritional supplements. Fifty-four products were fortified at the time of the present study (1·9 % of those consumed). The main categories of foods that were fortified were cereals, mainly RTE breakfast cereals, and drinks (Table 1). Thiamine, riboflavin, Fe, niacin, folic acid, vitamins B12, B6, D and pantothenate were the nutrients most commonly added to foods, while Ca, vitamin C, vitamin E, retinol, Zn and biotin were added to few foods (Table 1).
Food groups containing fortified foods (FF), number of foods per food group that were fortified, nutrients added and number of foods these nutrients were added to

* Includes squashes, fruit juice drinks, carbonated and powdered beverages.
The percentage of the EC RDA of different micronutrients per typical serving of FF products is presented in Fig. 1. The median value for percentage of the EC RDA per typical serving of FF varied from between 18 and 19 % (P25 16–18 %; P75 20–25 %) for Fe, vitamin D, Zn and biotin to 28 % for vitamin C (P25 25 %; P75 50 %) and 33 % for Ca (P25 17 %; P75 44 %).
Micronutrient content (% EC recommended daily amount (RDA)) in an average serving of fortified food.

Table 2 shows that 65 % of men and 68 % of women consumed one or more FF; 61 % of men and 63 % of women consumed fortified RTE breakfast cereals. In the total population, MDI of energy from FF was 283 kJ (P95 1017 kJ) in men and 256 kJ (P95 843 kJ) in women, corresponding to 2·6 % (P95 8·8 %) of the total MDI of energy in men and 3·4 % (P95 11·7 %) in women. In consumers of FF, the percentage of the total MDI of energy from FF was 3·9 % (P95 10·1 %) in men and 5·0 % (P95 13·3 %) in women. In consumers, fortified RTE breakfast cereals contributed 3·8 % (P95 9·3 %) of the MDI of energy in men and 4·8 % (P95 12·6 %) in women.
Mean daily energy intake and % energy from fortified foods (FF) in men and women consumers of FF (Mean values and standard deviations)

* Includes squashes, fruit juice drinks, carbonated and powdered beverages.
P95, 95th percentile of intake.
Contribution of fortified foods to energy and macronutrient intakes
The percentage contribution of FF to MDI of energy and macronutrients is shown in Table 3. Relative to their contribution to MDI of energy, FF contribute less to MDI of protein (men 2·7 %; women 3·8 %) and fat (men 0·7 %; women 1·1 %) and more to MDI of carbohydrate (men 6·9 %; women 8·2 %), total sugars (men 4·0 %; women 5·3 %) and starch (men 8·8 %; women 10·2 %) (Table 3).
Percentage contribution of fortified foods to mean daily intakes of macronutrients, in consumers of fortified foods, by gender

Contribution of fortified foods to micronutrient intakes
Among consumers, FF make significant contributions to MDI of Fe, folate, vitamin B2, thiamin, vitamin B6, vitamin D, niacin and vitamin B12. Most of this contribution was attributable to the added micronutrients (Table 4).
Percent contribution of fortified foods to mean daily intakes of micronutrients from all sources, in consumers of fortified foods, by gender

The effect of fortification on the MDI of micronutrients was examined at the 5th, 50th and 95th percentiles. As Zn, biotin, carotene and I are infrequently added to foods, additions of these nutrients were found to have little or no impact on MDI in the current analysis. Table 5 shows that, in male consumers of FF, the median intakes (when added nutrients in FF were not included) of folate, vitamins B2, B1 and B6 were 82 %, 86 %, 86 % and 88 %, respectively, of the median intakes when these nutrients were included. Similarly, in female consumers of FF, the median intakes (when added nutrients in FF were not included) of vitamin D, folate, vitamins B1 and B2, Fe and vitamin B6 were 81 %, 83 %, 84 %, 84 %, 85 % and 85 %, respectively, of the median intakes when the added nutrients were included. In both men and women, increases in MDI of nutrients at the 5th and 95th percentiles of intake were of a similar magnitude to the increases observed at the median.
Effect of nutrient addition on intakes of micronutrients from all sources at the 5th (P5), 50th (P50) and 95th (P95) percentiles in men and women consumers of fortified foods

Effect of fortification on adequacy of micronutrient intakes
We previously showed that intakes of several nutrients were inadequate in Irish adults, particularly Ca, Fe, vitamin D and folate in women and riboflavin and vitamin D in men and women (Hannon et al. Reference Hannon, Kiely, Harrington, Robson, Strain and Flynn2001; O'Brien et al. Reference O'Brien, Kiely, Harrington, Robson, Strain and Flynn2001). Table 6 shows that, in consumers of FF, the addition of riboflavin, folic acid and Fe reduced the proportion of men and women with inadequate intakes of these nutrients, as defined by the percentage of individuals whose MDI was less than the AR. The addition of Ca and vitamin C to foods had little impact on the prevalence of inadequate intakes. The proportion of consumers of FF with a MDI of riboflavin below the AR decreased from 16 to 7 % in men and from 26 to 12 % in women, when added riboflavin was included. The percentage of women with inadequate Fe intakes decreased from 49 to 31 (from 59 to 38 % in 18–50 year old women) when added Fe was included.
Effect of fortification on percentage of consumers with inadequate micronutrient intakes (i.e. % with mean daily intakes less than the average requirement*) from all sources

* EC Scientific Committee for Food, 1993; values for women are shown in parentheses.
† Menstruating
‡ Postmenopausal women.
Similarly, fortification reduced the proportion of women (18–64 years) with a MDI of folate below the AR from 12 to 3 % and by a similar amount in 18–50 year old women only. However the AR for 18–50 year old women does not include the additional folate recommended for prevention of NTD (Committee on Medical Aspects of Food & Nutrition Policy, 2000) and it was estimated that the mean additional folic acid intake from fortification in this group (49 μg) would achieve a reduction of about 12 % in risk of NTD.
In the absence of an AR for vitamin D, the percentage with MDI less than 5 μg (the midpoint of the recommended range for adults of 0–10 μg/d) was obtained including added vitamin D (80 % and 79 % in men and women, respectively) and excluding added vitamin D (78 % and 76 % in men and women, respectively). Added vitamin E had little effect on the proportion of consumers of FF with mean daily vitamin E intakes below the lowest threshold intake (15 % and 9 % in men and women, respectively).
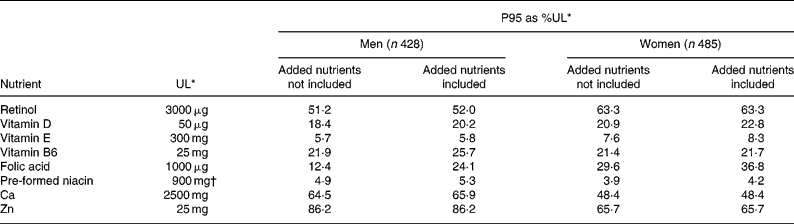
Risk of excessive intakes
Table 7 shows the effect of fortification on P95 of micronutrients as percentage of the UL. The P95 as percentage of the UL including fortification did not approach 100 % for any micronutrient and removing the added nutrient had little impact. A small proportion (0·1–2·2 %) of FF consumers had MDI of folic acid, vitamin B6, retinol, Ca, Zn and vitamin E that exceeded the UL but this was not affected by exclusion of added nutrient from the analysis.

Discussion
In Ireland and the UK, the addition of nutrients to foods is not restricted in terms of the types of food, nutrients or levels of nutrients and is permitted provided it is not injurious to health and labelling does not mislead (Scientific Co-operation Task 7.1.1 Working Group, 1997). Almost 2 % of foods recorded as consumed in the North/South Ireland Food Consumption Survey of 18–64 year old adults were voluntarily fortified, 72 % of which were breakfast cereals and 20 % of which were drinks of different varieties, including milks, squashes, fruit juice drinks, carbonated and powdered beverages. The micronutrients most commonly added to foods were vitamins (riboflavin, thiamin, folic acid, niacin, vitamins B12 and B6) and Fe, which were added to between 76 and 87 % of all FF. Fewer FF (11–33 %) contained vitamin D, pantothenic acid, Ca, vitamin C, retinol and vitamin E, while Zn, biotin, carotene and I were rarely added (less than 6 % of FF). FF contained moderate, but nutritionally significant amounts of micronutrients with the median content (as percentage of the EC RDA in an average serving) ranging from 18 % (Fe) to 33 % (Ca), while the P75 ranged from 20 % (biotin) to 50 % (vitamin C).
Among consumers (67 % of adults), FF contributed on average 4·5 % (P95 11·7 %) of total energy intake. Few estimates of the percentage energy from FF in populations have been made. The mean daily percentage energy from voluntarily FF in the total population was estimated at 3 % in the UK, based on household intake data from the National Food Survey 1999 (Ministry of Agriculture, Fisheries and Food, 200; Flynn et al. Reference Flynn, Moreiras, Stehle, Fletcher, Muller and Rolland2003). Sichert-Hellert et al. (Reference Sichert-Hellert, Kersting, Alexy and Manz2000, Reference Sichert-Hellert, Kersting and Manz2001) reported that the mean daily percentage energy from FF in German children and adolescents ranged from 6 to 9 %. However, this estimate includes foods with mandatory additions, e.g. margarines and children's foods fortified under EU regulation, as well as foods voluntarily fortified.
Among consumers, FF contributed a significant proportion (10–21 %) of the total intake of micronutrients more frequently added to foods, i.e. vitamins B1, B2, B6, folate, niacin and Fe, and vitamin D in women, due mainly to the added micronutrients. For some micronutrients, the intake from FF reduced the prevalence of inadequate intakes, e.g. vitamin B2 in men and women and folate, Fe and vitamin D in women only.
For folate, in women between the ages of 18–50 years fortification reduced the proportion with intakes less than the AR from 14 to 4 %. This AR (140 μg) does not take into account recommendations for an extra daily intake of 400 μg folic acid in addition to diet for women of reproductive years for the prevention of NTD in newborn infants (Food Safety Advisory Board, 1998; Committee on Medical Aspects of Food & Nutrition Policy, 2000). The mean additional folic acid intake from fortification in this group (49 μg) would achieve a reduction of about 12 % in risk of NTD-affected births, as estimated with reference to the data of Daly et al. (1995, 1997).
While the additional folic acid derived from FF in men and women (about 40–60 μg/d increases in median intake) is sufficient to improve folate status (Cuskelly et al. Reference Cuskelly, McNulty and Scott1999), it is probably not sufficient to significantly reduce plasma homocysteine (Malinow et al. Reference Malinow, Duell, Hess, Anderson, Kruger, Phillipson, Gluckman, Block and Upson1998), which is a risk factor for CHD (Boushey et al. Reference Boushey, Beresford, Omenn and Motulsky1995), dementia and Alzheimer's disease (Seshadri et al. Reference Seshadri, Beiser, Selhub, Jacques, Rosenberg, D'Agostino, Wilson and Wolf2002).
In the case of Fe, fortification reduced the proportion of women aged 18–50 years with intakes less than the AR from 60 to 40 %. These values may be underestimates since the skewed distribution of Fe requirements in menstruating women results in an underestimate of the prevalence of inadequate Fe intakes using the cut-point method (Food and Nutrition Board, 2000). Low Fe status is prevalent among women in developed countries. One in three Irish women have inadequate Fe stores and about one in thirty have Fe-deficiency anaemia, which exists when the blood haemoglobin levels are reduced below optimal levels (Cahill, Reference Cahill1995). In women aged 18 to 64 years, 26 % and 13 % had borderline Fe stores and anaemia, respectively (Gibson, Reference Gibson2003), as measured in the Dietary and Nutrition Survey of British Adults (Gregory et al. Reference Gregory, Foster, Tyler and Wiseman1990). In the USA NHANES III (1988–1994), the prevalence of Fe deficiency and anaemia were 9–11 % and 2–5 %, respectively, in women of childbearing age (Looker et al. Reference Looker, Dallman, Carroll, Gunter and Johnson1997).
For vitamin D, fortification contributed 11 % of total vitamin D intake and increased the median daily intake by 23 % from 1·9 to 2·3 μg in women. This contribution from fortification may be important given the low median intakes of vitamin D in women relative to the acceptable range of intake of 0–10 μg/d (Food Safety Authority of Ireland, 1999). Significant proportions (34 to 64 %) of Irish adults have inadequate vitamin D status (defined as serum 25 (OH) D levels < 50 nmol/l) (Hill et al. Reference Hill, Flynn, Kiely and Cashman2006), a finding that is in agreement with evidence of a significant prevalence of low vitamin D status in adults in other European countries, e.g. 14 % in France (Chapuy et al. Reference Chapuy, Preziosi, Maamer, Arnaud, Galan, Hereberg and Meunier1997), 39 % in Spain (Mezquita-Raya et al. Reference Mezquita-Raya, Munoz-Torres, Luna, Luna, Lopez-Rodriguez, Torres-Vela and Escobar-Jimenez2001) and 26–29 % in Finland (Lamberg-Allardt et al. Reference Lamberg-Allardt, Outila, Karkkainen, Rita and Valsta2001).
The contribution of FF to intakes of vitamins B1, B6, B12 and niacin, although significant in relation to total intake, appears to be of little public health importance since dietary intake of these nutrients is already adequate in this population group. However, other population groups may benefit from the inclusion of some of these micronutrients in FF, e.g. low status for vitamins B6 (Bailey et al. Reference Bailey, Maisey, Southon, Wright, Finglas and Fulcher1997; Pentieva et al. Reference Pentieva, Bates, Prentice and Cole1999) and B12 (Hin et al. Reference Hin, Clarke and Sherliker2006) have been reported in UK elderly. Fortification had little impact on the intake or prevalence of inadequate intakes of Ca, vitamin C or vitamin E, as these nutrients were added to foods less frequently.
The estimates of the prevalence of inadequate intakes of micronutrients in the present study do not take account of the effect of under-reporting food intake. However, while removal of under-reporters (15 % of men and 24 % of women) from the analysis resulted in a decrease in the percentage with inadequate intakes of micronutrients, it did not change the overall trends observed with regard to the impact of fortification on the prevalence of inadequacy. For example, in women aged 18–64 years, fortification reduced the prevalence of inadequate intakes from 49 to 31 % when under-reporters were included and from 43 to 23 % when under-reporters were excluded from the analysis.
The present study did not examine the effect of FF on micronutrient status. However, a number of studies have reported a positive association between intakes of a number of B-vitamins (e.g. folate, riboflavin, vitamin B12) from FF and status (Preziosi et al. 1999; Cuskelly et al. Reference Cuskelly, McNulty and Scott1996, Reference Cuskelly, McNulty and Scott1999; Gibson, Reference Gibson2003), but this was not observed for Fe, possibly due to lower meat consumption in those consuming higher levels of Fe from FF (Gibson, Reference Gibson2003). Work with stable isotopes has quantified the bioavailability of Fe from breakfast cereals at around 3 %, although this is doubled if a source of ascorbic acid is consumed at the same meal (Fairweather-Tait et al. Reference Fairweather-Tait, Fox, Wharf and Eagles1995).
FF consumption was not associated with increased risk of adverse effects for any micronutrient. The 95th percentile of intake of micronutrients (as %UL) from all sources in men and women did not exceed, or even approach, the UL for any micronutrient, with or without the inclusion of fortification in the estimate of intakes. This indicates a very low risk of adverse effects from excessive intakes of micronutrients in the population. A small proportion (0·1–2·2 %) of FF consumers had MDI of folic acid, vitamin B6, retinol, Ca, Zn, and vitamin E that exceeded the UL but this was mainly associated with the use of nutritional supplements (Kiely et al. Reference Kiely, Harrington, Robson, Flynn and Cran2001) or, in the case of retinol, of high liver consumption and was not affected by fortification, which contributed only small amounts to the intakes of these micronutrients relative to their UL. For example, 1·2 % of FF consumers (mainly women) exceeded the UL for vitamin B6 (25 mg) with average daily intakes ranging from 30–62 mg, mainly from supplements, while one FF consumer (male) exceeded the UL for Ca (2500 mg) with an average daily intake of 2929 mg, mainly from milk.
The results presented in this paper serve to inform the debate on the benefits, and possible risks, of voluntary fortification of foods. Analysis of data on food and nutrient intakes in a nationally representative sample of 18–64 year old adults living in Ireland, where the voluntary fortification of foods with micronutrients is freely permitted, has shown that voluntary fortification of foods makes a significant contribution to the intakes of a range of micronutrients in the population and improves the adequacy of intake of some micronutrients, particularly of riboflavin, folate, vitamin D and Fe in women. While addition of some frequently added nutrients, e.g. niacin, is of little relevance for public health, more frequent addition of nutrients such as Ca and vitamin D would be beneficial for this population group. Fortification does not contribute to an increased risk of adverse effects from excessive intake of any micronutrient.
Acknowledgements
The project was funded by the Irish Government under the National Development Plan 2000–2006.