

Non-alcoholic fatty liver disease (NAFLD) has the highest incidence among liver diseases and exhibits a younger trend(Reference Rinella and Sanyal1,Reference Petta, Muratore and Craxì2) . Several drugs aimed at oxidative stress, insulin resistance, the inflammatory response and fibrosis are used to treat NAFLD(Reference Ibrahim, Kelleni and Geddawy3). However, these drugs are associated with side effects(Reference Takahashi, Sugimoto and Inui4). Scientific studies have shown that NAFLD was associated with intestinal microbiota. This evidence provided new targets for NAFLD intervention and treatment in terms of diet and nutrition(Reference Musso, Cassader and Rosina5).
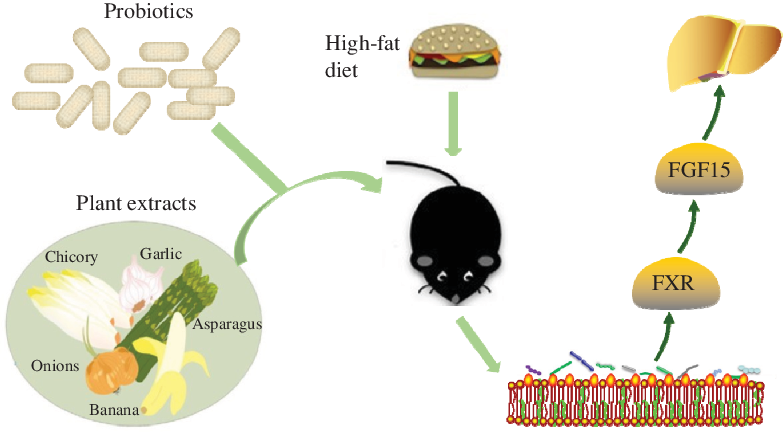
Evidence indicates that the intestinal microbiota is associated with the occurrence and development of NAFLD. NAFLD is accompanied by changes in the number and structure of the intestinal microbiota, which affects bile acids’ metabolism(Reference Abu-Shanab and Quigley6,Reference Wieland, Frank and Harnke7) . Probiotics are a new approach for the prevention and treatment of NAFLD via changing reabsorption of the bile acids and affecting the farnesoid X receptor (FXR)–fibroblast growth factor-15 (FGF15) pathway(Reference Xue, He and Gao8). Bifidobacteria and lactobacilli genera have reportedly shown efficacy with NAFLD(Reference Ritze, Bárdos and Claus9–Reference Everard, Belzer and Geurts11).
In vivo and in vitro studies showed that multiple plant extracts had been used to control NAFLD without side effects(Reference Sun Kim, Kung and Grewal12). Studies have shown that the tea polyphenols (TP) have reduced liver lipid content and have provided a certain theoretical basis for reducing liver damage(Reference Tan, Kim and Cheng13). Dietary plant extracts such as soya isoflavones (SI) and resveratrol (RES) have prevented and improved NAFLD via various mechanisms(Reference Pan, Lai and Tsai14).
There are many studies on the hypolipidemic effect of probiotics and plant extracts, respectively. However, the effect of probiotics combined with natural products on NAFLD in vivo has not yet been investigated. However, other studies have shown that polyphenols improve the antioxidant capacity via Lactobacillus fermentation(Reference Macedo, Battestin and Ribeiro15); and catechins improve the antioxidant activity via microbial transformation(Reference Lacey, Pérez-Santín and López-Caballero16). These findings have prompted the authors to evaluate the potential effects between probiotics and plant extracts.
The present study evaluated plant extracts which had a beneficial effect on alleviating lipid accumulation in HepG2 cells. Then, we used plant extracts with Lactobacillus paracasei X11 and L. casei YRL577 to interfere a NAFLD mouse model. Furthermore, the potential mechanism involved in the efficacy of these combinations of probiotics and plant extracts on the NAFLD was investigated.
Experimental methods
HepG2 cells culture and toxicity detection
HepG2 cells (Cell Bank of CAS) were cultured on ninety-six-well plates containing 10 % fetal bovine serum (Biological Industries) and 1 % penicillin/streptomycin (Beyotime) in Dulbecco’s modified Eagle’s medium (DMEM) (HyClone). The Cell Counting Kit-8 (CCK8) (Beyotime, China) toxicity of the RES, SI and TP (Shanghai Yuanye) were trialled to determine the optimal concentration. Then, 0·5 mm oleic acid (Sigma) was added to the model group and the administration group and incubated at 37°C and 5 % CO2 for 24 h. The plant extracts were added to each administration group and incubated at 37°C and 5 % CO2 for 24 h.
Determination of the intracellular lipid content in the HepG2 cells
Oil red O staining solution (Solarbio) was used to determine the intracellular lipid content according to a method described previously(Reference Lin, Huang and Lin17). Oil red O staining was performed 24 h after the intervention, and the morphology of the fatty liver cells was observed with a microscope (Olympus). The Oil Red O-stained pictures were analysed with Image-Pro Plus 6.0 image analysis software. Each group randomly selected three representative high-power fields. The red integrated optical density (IOD) values expressed by the lipid droplets were calculated, and the resultant values were compared.
Experimental culture strains
The strains of L. paracasei X11 and L. casei YRL577 were stored in the Functional Dairy and Probiotic Engineering Laboratory of Ocean University of China. Prior to the experiment, the strains were inoculated into MRS broth and cultured in a 37°C incubator for 48 h. Then, 2 % (v/v) was inoculated into the MRS broth medium and cultivated for 24 h as an activated strain for use in the experiments. The concentration of the strains was 108 colony-forming units (CFU)/ml.
Effects of different concentrations of plant extracts on the growth of strains in vitro
The plant extracts were, respectively, formulated into four concentrations of plant extract culture media with 0·05, 0·1, 1 and 10 mg/ml. The strains were inoculated into a plant extract culture media, and the basic medium was used as a control. The strains were cultured in a constant temperature incubator at 37°C, and the optical density at 600 nm (OD600) value was measured every 2 h during 28 h.
Effects of different kinds of plant extracts on the growth of the strains in vitro
The strains were inoculated into a liquid basic medium and a liquid plant extract medium with 1 mg/ml. The medium without the corresponding plant extract was used as control. The strain was cultured in a 37°C incubator, and the OD600 value was measured every 2 h during 28 h.
Animal models and experimental groups
Because of the prevalence and severity, NAFLD was higher in male than in female(Reference Lonardo, Nascimbeni and Ballestri18). The experimental mice, 6-week-old male C57BL/6 mice, were purchased from Pengyue Co. Ltd and were adaptively fed for 7 d. All mice were kept in a specific-pathogen free (SPF) facility under a 12-h light–dark cycle. The temperature was 20–24°C, and the relative humidity was 40–60 %. They had ad libitum access to feed and water. Seven weight-matched groups were randomly assigned to the mice (n 10 per group) control (CON) group, high-fat control group, positive control group (simvastatin (SV): positive control for inhibition of cholesterol biosynthesis), L. paracasei X11 + RES group, L. paracasei X11 + TP group, L. casei YRL577 + RES group, and L. casei YRL577 + TP group. The construction of the NAFLD model was referred to the method described(Reference Wang, Cao and Fu19,Reference De Minicis, Rychlicki and Agostinelli20) . The control group was fed a normal diet, and the other groups were fed a high-fat diet (20 % protein composed of casein and l-cystine; 35 % carbohydrate composed of maize starch, maltodextrin and sucrose; 45 % fat composed of soyabean oil and lard) for 8 weeks. The mouse was injected intraperitoneally with carbon tetrachloride (CCl4)–vegetable oil (v/v) solution at a dose of 0·72 ml/100 g for the first week, and then 40 % CCl4 solution was injected intraperitoneally at a dose of 0·42 ml/100 g for 3 weeks. From week 9 to week 17, mice in the intervention group began to receive the corresponding reagent. The probiotics were administered at a dose of 109 CFU/kg body weight, TP was 200 mg/kg body weight, RES was 100 mg/kg body weight and SV was 3 mg/kg body weight. Each experimental group was gavaged with the specific treatments once a day. We used the following formula to determine the human equivalent dose: plant extracts (mg/kg = animal NOAEL mg/kg) × (weight animal (kg)/weight human (kg))(1–0·67). Factor method for body surface area was applied to calculate the dose converting between animals and humans. Thus, TP = 200 mg/kg × (0·022/70 kg)0·33 = 13·96 mg/kg or 0·976 g for a 70-kg human; and RES =100 mg/kg × (0·022/70 kg)0·33 = 6·98 mg/kg or 0·488 g for a 70-kg human. At the same time, mice in the control group and the high-fat control group were given the same amount of PBS buffer. The investigators were blinded to the treatment groups. Mice were killed after they were gavaged for 8 weeks. The mice were anaesthetised using isoflurane in chambers. The blood was collected from the eyeball veins of the mice, and then the liver and intestinal tissues were collected and stored at −80°C until they were used. The experiments were performed in accordance with the British Animals (Scientific Procedures) Act 1986 (PPL 70/7652) and were approved by the Laboratory Animal Ethics Committee of College of Food Science and Engineering of Ocean University of China (permission number: SPXY2019051501).
Measurement of the body weight and liver index
The mice were weighed weekly, and the weight changes of each group of mice were monitored. The weight of the mice and the whole liver were recorded. Moreover, the liver index of the mice was calculated according to the following formula.
 $${\rm{Liver}}\;{\rm{index}}\;(\% ){\mkern 1mu} {\rm{ = }}{{{\rm{Liver}}\;{\rm{weight}}} \over {{\rm{Body}}\;{\rm{weight}}}} \times {\rm{100}}\;\% $$
Detection of blood lipid levels
The mouse blood samples were centrifuged at 1500 rpm for 15 min at 4°C. The upper serum was collected and placed in a refrigerator at −20°C until use. The levels of TAG, total cholesterol (TC), HDL-cholesterol and LDL-cholesterol levels were detected using commercial kits (Nanjing Jiancheng) according to the manufacturer’s instructions.
Histopathological analysis of the liver
Mice livers were excised 5 × 5 mm and fixed in 4 % paraformaldehyde fixative solution and then embedded in paraffin. A piece was cut from paraffin block (thickness 4 μm) and then haematoxylin and eosin-stained. The pathological sections were observed under an optical microscope (E100, Nikon), and photos were taken. The histological assessments were carried out by an independent researcher.
Detection of the serum biochemical indicators
Aspartate aminotransferase (AST), alanine aminotransferase (ALT), superoxide dismutase, glutathione peroxidase (GSH-PX) and malondialdehyde (MDA) levels in the serum were measured with a commercial kit (Nanjing Jiancheng) according to the manufacturer’s instructions.
Determination of the SCFA in the faeces
Before the mice were killed, the faecal samples of the mice were collected for three consecutive days and stored in a –80°C. Pre-treatment of the faecal samples was performed according to Tao et al.(Reference Tao, Duan and Jiang21). Diethyl butyric acid was added to the samples as an internal standard for GC analysis (Agilent) and calculated according to the following formula.
 $$\displaylines{
{\rm{SCFA}}{\mkern 1mu} \left( {\mu {\rm{mol/g}}} \right) = {{{\rm{SCFA}}\;{\rm{peak}}\;{\rm{area}}} \over {{\rm{Internal}}\;{\rm{standard}}\;{\rm{peak}}\;{\rm{area}}}} \cr
\times {{{\rm{Internal}}\;{\rm{standard}}\;{\rm{concentration}}} \over {{\rm{SCFA}}\;{\rm{molar}}\;{\rm{mass}}}} \cr
\times {{1000000} \over {{\rm{Sample}}\;{\rm{quality}}}} \cr} $$
$$\displaylines{
{\rm{SCFA}}{\mkern 1mu} \left( {\mu {\rm{mol/g}}} \right) = {{{\rm{SCFA}}\;{\rm{peak}}\;{\rm{area}}} \over {{\rm{Internal}}\;{\rm{standard}}\;{\rm{peak}}\;{\rm{area}}}} \cr
\times {{{\rm{Internal}}\;{\rm{standard}}\;{\rm{concentration}}} \over {{\rm{SCFA}}\;{\rm{molar}}\;{\rm{mass}}}} \cr
\times {{1000000} \over {{\rm{Sample}}\;{\rm{quality}}}} \cr} $$
RT-PCR assay
The mRNA expression of the FXR, FGF15 and apical Na-dependent bile acid transporter (ASBT) were evaluated by RT-PCR. Total RNA of the ileum tissue was extracted with Trizol (Invitrogen) according to the manufacturer’s instructions, and cDNA was synthesised using the ReverTra Ace qPCR RT Master Mix (TOYOBO) reverse transcription reaction kit. The sequences of the forward and reverse primers are shown in Table 1. Following the addition of SYBR Green, the reaction was performed in a Real-Time PCR instrument (ABI). The ratio of the detection value of each target gene to glyceraldehyde 3-phosphate dehydrogenase represents the expression level of each target gene. The fold of gene expression was calculated by ΔΔCt.
Target gene primer sequence

FXR, farnesoid X receptor; FGF15, fibroblast growth factor 15; ASBT, apical Na-dependent bile acid transporter; GAPDH, glyceraldehyde 3-phosphate dehydrogenase.
Statistical analysis
All data were expressed as mean values and standard deviations. Statistical differences in data between groups were determined using one-way ANOVA and S-N-K ANOVA using SPSS 22.0 software. P < 0·05 was considered statistically significant. The mice were sequenced by weight and randomly allocated to weight-matched groups by SPSS 22.0. The sample size was chosen based on our previous preliminary experiment. The levels of TC and TAG in the liver are important indicators for NAFLD. We mainly analysed the TC and TAG in the liver using one-way ANOVA, for detecting a significant difference between groups. The F values of TC and TAG are 7·118 and 30·668, and the effect sizes of TC and TAG are 0·476 and 0·777, respectively. We have done an analysis using G*Power (version 3.1.9.4). With a P = 0·05 and a power of 0·80, we got a total sample size of seventy and thirty-five. So we chose ten mice in each group to obtain more valid statistical data.
Results
Effects of the different plant extracts on the toxic effects and lipid droplet accumulation in the HepG2 cells
As depicted in Fig. 1, cytotoxicity and cell inhibition were not affected by the SI concentration, and the lowest concentration was found to be for RES and TP (20 μmol/l) in the range of 0–50 μmol/l. Therefore, 20 μmol/l was selected as the final concentration of the active substance intervention.
(A) Effects of resveratrol concentrations of 0, 10, 20, 30, 40 and 50 μmol/l on HepG2 cell growth. (B) Effects of soya isoflavone concentrations of 0, 10, 20, 30, 40 and 50 μmol/l on HepG2 cell growth. (C) Effects of tea polyphenol concentrations of 0, 10, 20, 30, 40 and 50 μmol/l on HepG2 cell growth. Values are means, with standard deviations represented by vertical bars. a,b,c Unlike letters represent significant differences (P < 0·05). OD450, optical density at 450 nm.

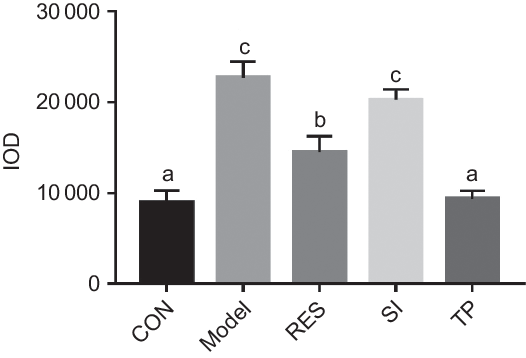
The degree of lipid droplets was reflected by the red IOD value. The higher the value, the more serious the accumulation is. Following the oleic acid intervention, the IOD value for the model group had increased significantly (P < 0·05), and the accumulation of lipid droplets was relieved after supplementation with different plant extracts (Fig. 2). Compared with the model group, the IOD value of the RES group decreased by 36·01 %, and the IOD value of the TP group decreased by 60·39 % (P < 0·05). There was no significant difference found between the SI group and the model group. The results showed that RES and TP produced the effect of reducing lipid droplet accumulation in the HepG2 cells, and therefore, they were selected for the subsequent screening experiments.
Effects of different plant extracts on oleic acid-stimulated lipid droplet expression in the HepG2 cell steatosis model. Values are means, with standard deviations represented by vertical bars. a,b,c Unlike letters represent significant differences (P < 0·05). IOD, integrated optical density; CON, control; RES, resveratrol; SI, soya isoflavones; TP, tea polyphenols.
Effects of the plant extracts on the growth of probiotics in vitro
Effects of the different concentrations of plant extracts on the growth of the strains in vitro
The effect of the active substances on the growth of the strain in vitro was depicted in Fig. 3. The strains of L. casei YRL577, L. paracasei X11 and L. casei YRL577 with RES and TP, and L. paracasei X11 with RES and TP all reached a stable period at about 22 h. When the concentration of RES and TP reached 10 mg/ml, the growth of L. casei YRL577 and L. paracasei X11 exhibited significant inhibitory effects (P < 0·05). When the concentration of RES and TP were less than 1 mg/ml, compared with the single strain, the addition of RES and TP failed to produce a significant effect or to inhibit the growth of L. casei YRL577 and L. paracasei X11.
(A) Effects of different concentrations of resveratrol (RES) on the growth of Lactobacillus casei YRL577. (B) Effects of different concentrations of tea polyphenols (TP) on the growth of L. casei YRL577. (C) Effects of different concentrations of RES on the growth of L. paracasei X11. (D) Effect of different concentrations of TP on the growth of L. paracasei X11. Values are means, with standard deviations represented by vertical bars. a,b Unlike letters represent significant differences (P < 0·05). (A) ![]() , YRL577-RES (0·05 mg/ml);
, YRL577-RES (0·05 mg/ml); ![]() , YRL577-RES (0·1 mg/ml);
, YRL577-RES (0·1 mg/ml); ![]() , YRL577-RES (1 mg/ml);
, YRL577-RES (1 mg/ml); ![]() , YRL577-RES (10 mg/ml);
, YRL577-RES (10 mg/ml); ![]() , YRL577; (B)
, YRL577; (B) ![]() , YRL577-TP (0·05 mg/ml);
, YRL577-TP (0·05 mg/ml); ![]() , YRL577-TP (0·1 mg/ml);
, YRL577-TP (0·1 mg/ml); ![]() , YRL577-TP (1 mg/ml);
, YRL577-TP (1 mg/ml); ![]() , YRL577-TP (10 mg/ml);
, YRL577-TP (10 mg/ml); ![]() , YRL577; (C)
, YRL577; (C) ![]() , X11-RES (0·05 mg/ml);
, X11-RES (0·05 mg/ml); ![]() , X11-RES (0·1 mg/ml);
, X11-RES (0·1 mg/ml); ![]() , X11-RES (1 mg/ml);
, X11-RES (1 mg/ml); ![]() , X11-RES (10 mg/ml);
, X11-RES (10 mg/ml); ![]() , X11; (D)
, X11; (D) ![]() , X11-TP (0·05 mg/ml);
, X11-TP (0·05 mg/ml); ![]() , X11-TP (0·1 mg/ml);
, X11-TP (0·1 mg/ml); ![]() , X11-TP (1 mg/ml);
, X11-TP (1 mg/ml); ![]() , X11-TP (10 mg/ml);
, X11-TP (10 mg/ml); ![]() , X11. OD600, optical density at 600 nm.
, X11. OD600, optical density at 600 nm.

Effects of the different plant extracts on the in vitro growth of the probiotic strains
The effects of RES and TP on the growth of L. casei YRL577 and L. paracasei X11 were shown in Fig. 4. It can be seen from the figure that the L. casei YRL577, L. paracasei X11, L. casei YRL577 with RES and TP, and L. paracasei X11 with RES and TP all reached a stable stage at about 22 h. Co-cultivation of the RES and TP at 1 mg/ml with L. casei YRL577 and L. paracasei X11 failed to produce a significant effect on the growth status of the two strains.
(A) Effects of different plant extracts on the growth of Lactobacillus casei YRL577. (B) Effects of different plant extracts on the growth of L. paracasei X11. Values are means, with standard deviations represented by vertical bars. a Unlike letters represent significant differences (P < 0·05). (A) ![]() , YRL577-RES (1 mg/ml);
, YRL577-RES (1 mg/ml); ![]() , YRL577-TP (1 mg/ml);
, YRL577-TP (1 mg/ml); ![]() , YRL577; (B)
, YRL577; (B) ![]() , X11-RES (0·1 mg/ml);
, X11-RES (0·1 mg/ml); ![]() , X11-TP (0·1 mg/ml);
, X11-TP (0·1 mg/ml); ![]() , X11. RES, resveratrol; TP, tea polyphenols; OD600, optical density at 600 nm.
, X11. RES, resveratrol; TP, tea polyphenols; OD600, optical density at 600 nm.

Effects of probiotics and plant extracts on the body weight, liver weight and liver index in mice
The weight of the CON group exhibited a steady state following the start of gavage, and the weight of the HFD group continued to increase (P < 0·05) (Fig. 5). The weight of the mice in the treatment groups showed a tendency to slow down in the last 3 weeks (P < 0·05). However, no significant differences were found between the SV group and the treatment groups in the body weight of the mice.
Changes in body weight of mice in the different treatment groups. Values are means, with standard deviations represented by vertical bars. a,b,c,d Unlike letters represent significant differences (P < 0·05). ![]() , Control;
, Control; ![]() , high-fat diet;
, high-fat diet; ![]() , simvastatin;
, simvastatin; ![]() , Lactobacillus paracasei X11 + resveratrol;
, Lactobacillus paracasei X11 + resveratrol; ![]() , L. paracasei X11 + tea polyphenols;
, L. paracasei X11 + tea polyphenols; ![]() , L. casei YRL577 + resveratrol;
, L. casei YRL577 + resveratrol; ![]() , L. casei YRL577 + tea polyphenols.
, L. casei YRL577 + tea polyphenols.

Table 2 results showed that the mouse liver index was statistically increased in the HFD group, compared with the CON group (P < 0·05). Compared with the HFD group, the liver index of the L. paracasei X11 + RES group, L. paracasei X11 + TP group, L. casei YRL577 + RES group and L. casei YRL577 + TP group had decreased by 12·76, 17·97, 17·71 and 19·27 %, respectively (P < 0·05). The L. paracasei X11 + TP group, L. casei YRL577 + RES group and L. casei YRL577 + TP group exhibited similar liver index effects to the SV group.
Body weight, liver weight and liver index of the mice with non-alcoholic fatty liver disease
(Mean values and standard deviations)
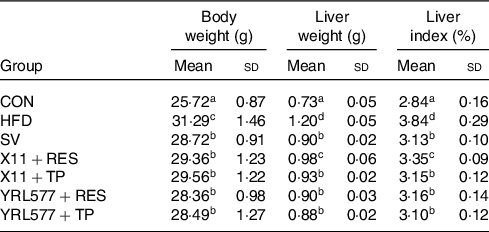
CON, control; HFD, high-fat diet; SV, simvastatin; RES, resveratrol; TP, tea polyphenols.
a,b,c,d Unlike letters in the same column represent significant differences (P < 0·05).
Effects of the probiotics and plant extracts on the lipids in mice
Biochemical parameters of the lipid metabolism in mice
According to an analysis of the mouse lipid-related indicators in Table 3, compared with the CON groups, serum TAG, TC and LDL-cholesterol reached the higher levels and the lower level of serum HDL-cholesterol in the HFD group (P < 0·05). Compared with the HFD group, L. paracasei X11 and L. casei YRL577 combined with RES and TP decreased the serum levels of TAG, TC and LDL-cholesterol levels and had increased the HDL-cholesterol levels. The results showed that the effect of L. casei YRL577 with TP was higher than that of the other treatment groups (P < 0·05).
Biochemical parameters of lipid metabolism for non-alcoholic fatty liver disease in the serum (mmol/l)
(Mean values and standard deviations)
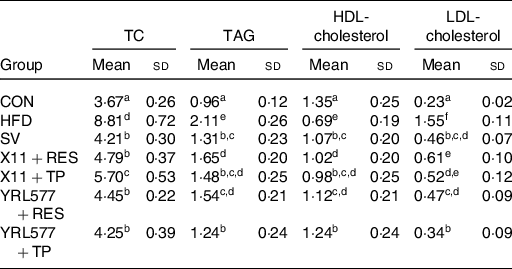
TC, total cholesterol; CON, control; HFD, high-fat diet; SV, simvastatin; RES, resveratrol; TP, tea polyphenols.
a,b,c,d,e,f Unlike letters in the same column represent significant differences (P < 0·05).
Following 8 weeks of continuous intervention, the TC and TAG in the liver of the mice were measured. The highest TC and TAG content in the HFD group were found in Table 4. All of the applications reduced the content of the two to varying degrees, and the L. casei YRL577 + TP group exhibited the most significant effect (P < 0·05). Compared with the HFD group, the liver TC concentration in the L. casei YRL577 + TP group had decreased by 18·81 %, and the TAG decreased by 45·55 %, which was not different compared with the SV group.
Contents of total cholesterol (TC) and TAG in the liver
(Mean values and standard deviations)
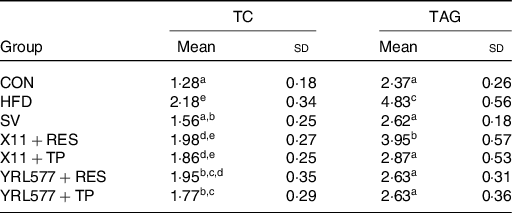
CON, control; HFD, high-fat diet; SV, simvastatin; RES, resveratrol; TP, tea polyphenols.
a,b,c,d,e Unlike lowercase letters in the same column represent significant differences (P < 0·05).
Histopathological analysis of the liver
Fig. 6 depicted the histopathological sections of the liver, and the liver cells in the CON group exhibited normal morphology and no fat vacuoles. In the HFD group, the lipid infiltration was severe, and the fat vacuoles were the most apparent. The fat vacuole phenomenon in the intervention groups was improved to varying degrees. The effects of the L. casei YRL577 + RES group and the L. casei YRL577 + TP group were higher than that of the L. paracasei X11 + RES group and the L. paracasei X11 + TP group, which was consistent with the results of the lipid-related indicators.
Mouse histopathology liver sections (haematoxylin and eosin staining). Arrows indicate where fat accumulation occurs. CON, control; HFD, high-fat diet; SV, simvastatin; RES, resveratrol; TP, tea polyphenols.

Effects of the probiotics and plant extracts on the serum biochemical parameters
Compared with the CON group, the serum AST level in the HFD group had increased a significant 2·87-fold and ALT 2·47-fold as it increased in Table 5 (P < 0·05). The AST and ALT levels of the supplemented L. paracasei X11 and L. casei YRL577 with the plant extracts had significantly reduced (P < 0·05). Among them, the L. casei YRL577 + TP group exhibited the most significant effect. Compared with the HFD group, the serum AST level was reduced by 56·01 %, and the serum ALT level was decreased by 54·20 % (P < 0·05), similar to that of the SV group.
Serum aspartate aminotransferase (AST) and alanine aminotransferase (ALT) content of the mice
(Mean values and standard deviations)
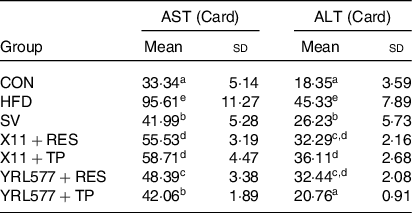
CON, control; HFD, high-fat diet; SV, simvastatin; RES, resveratrol; TP, tea polyphenols.
a,b,c,d,e Unlike letters in the same column represent significant differences (P < 0·05).
The analysis of the serum biochemical indicators in Table 6 showed that compared with the CON group, the superoxide dismutase and GSH in the serum of the HFD group were reduced and the serum MDA content had increased (P < 0·05). L. casei YRL577 + RES had increased the levels of serum of superoxide dismutase and the GSH and decreased the levels of MDA. The L. paracasei X11 + RES only reduced the level of MDA. L. paracasei X11 + TP had effects on the levels of superoxide dismutase and MDA. The L. casei YRL577 + TP group exhibited favourable effects on the levels of GSH and MDA.
Biochemical parameters of the antioxidant properties in the serum (nmol/ml)
(Mean values and standard deviations)
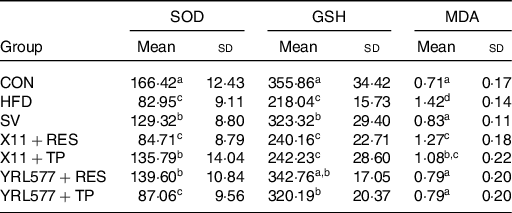
SOD, superoxide dismutase; GSH, glutathione; MDA, malondialdehyde; CON, control; HFD, high-fat diet; SV, simvastatin; RES, resveratrol; TP, tea polyphenols.
a,b,c,d Unlike letters in the same column represent significant differences (P < 0·05).
Effects of the probiotics and plant extracts on the SCFA in the faeces
Compared with the HFD group, there was no significant change in the acetic acid content in the faeces of the experimental groups (Fig. 7). The content of the propionic acid in the HFD group was significantly decreased, and the treatment groups had increased the content of propionic acid (P < 0·05). The butyric acid content in the L. casei YRL577 + RES group and the L. casei YRL577 + TP group was 2·01-fold and 2·29-fold that of the HFD group and higher than that of the other treatment groups (P < 0·05). Futhermore, compared with the other groups, L. casei YRL577 + TP group also increased the content of the valeric acid (P < 0·05).
Mouse faeces results: (A) content of acetic acid, (B) content of propionic acid, (C) content of butyric acid, (D) content of isovaleric acid and (E) content of valeric acid. Values are means, with standard deviations represented by vertical bars. a,b,c,d Unlike letters represent significant differences (P < 0·05). CON, control; HFD, high-fat diet; SV, simvastatin; RES, resveratrol; TP, tea polyphenols.

Effects of probiotics and plant extracts on the genes in the intestinal bile acid pathway
Following 8 weeks of intervention, the levels of FXR in the SV group and treatment groups were increased by almost 2-fold compared with the controls, and the effect of the L. casei YRL577 + TP group was most significant, with an increase of 2·5-fold (Fig. 8(A)). There was no significant change found between the CON and HFD groups. Similarly, the levels of FGF15 in the SV group and L. casei YRL577 + RES group were increased by almost 2-fold, and the effect of the L. casei YRL577 + TP group was most significant, with an increase of 2·8-fold (Fig. 8(B)). However, the ASBT level in the HFD group also increased significantly and exhibited a 2·3-fold increase compared with the control group. No significant changes were found in the CON, SV, L. casei YRL577 + RES and L. casei YRL577 + TP groups (Fig. 8(C)).
(A) Intestinal mRNA expression level of farnesoid X receptor (FXR). (B) Intestinal mRNA expression level of fibroblast growth factor 15 (FGF15). (C) Intestinal mRNA expression level of apical sodium-dependent bile acid transporter (ASBT). Values are means, with standard deviations represented by vertical bars. a,b,c,d Unlike letters represent significant differences (P < 0·05). CON, control; HFD, high-fat diet; SV, simvastatin; RES, resveratrol; TP, tea polyphenols.

Discussion
In the present study, probiotics with plant extracts were used to ameliorate the effects of NAFLD. The plant extracts were screened, for those with a beneficial effect on alleviating lipid deposition in the HepG2 cells. Then, we confirmed that no inhibitory effect was found on the growth of the strains in vitro. Next, the effect of L. casei YRL577 with TP was found to exhibit a potential reparative effect on NAFLD in the mice than other three treatment groups. In addition, the supplement of L. casei YRL577 with RES or TP also increased the content of the SCFA, particularly butyric acid in the faeces. The relieve effect for the markers of NAFLD action could be attributed to the activation of bile acid-associated genes.
Lipid metabolism disorders were one of the main factors associated with NAFLD(Reference Buzzetti, Pinzani and Tsochatzis22). Probiotics regulated liver lipid metabolism disorders and played a therapeutic role in NAFLD(Reference Federico, Dallio and Godos23). Many dietary natural compounds isolated from fruits, vegetables and edible plants were reported to prevent the development of NAFLD(Reference Pan, Lai and Tsai14). However, there were few studies on the effects of the probiotics and plant extracts on NAFLD. Reportedly, abnormal lipid metabolism was a major cause of NAFLD(Reference Chen, Liu and Chiu24). In the present study, two plant extracts, RES and TP, were screened in vitro. They were found to alleviate the accumulation of lipid droplets in the HepG2 cells. The co-culture results indicated that RES and TP at a concentration below 1 mg/ml had no significant effect on the growth of L. paracasei X11 and L. casei YRL577. Thus, in order to reduce certain factors stemming from the in vitro fermentation, a combination of probiotics and plant extracts was used in the NAFLD mice.
SV primarily inhibited the synthesis of endogenous cholesterol so as to lower blood lipids. Therefore, it was selected for the positive drug control. The present study found that high-fat diets increased the levels of the TC, TAG and LDH-C and decreased the level of HDL-cholesterol in the serum, as well as increased the levels of TC and TAG in the liver. L. paracasei X11 and L. casei YRL577 intervention with RES or TP had decreased the serum levels of TC, TAG, LDH-C, and the hepatic levels of TC and TAG and increased the serum levels of HDL-cholesterol. It suggested that L. casei YRL577 with TP might have a better effect on improving lipid metabolism than the other three groups. The effect was similar to that of the SV group and could be close to the CON group level. The haematoxylin and eosin stains also showed that fat vacuoles in the L. casei YRL577 + TP groups were improved, which was consistent with the hepatic lipid results. In addition, abnormal lipid metabolism usually produced a reactive oxygen species, which led to hepatocyte apoptosis(Reference Haas, Francque and Staels25). L. casei YRL577 with TP had increased the levels of GSH and reduced the levels of AST, ALT and MDA. This result showed that the application of L. casei YRL577 + TP prevented the liver injury and maintained the normal development and homoeostasis of the liver tissues. Although L. casei YRL577 + TP could not be restored to the CON group levels, the effect was not different from that of the SV group. Studies have reported that supplementation with probiotics and plant extracts could improve lipid metabolism, which was consistent with the results of the present study(Reference Lye, Kato and Low26,Reference Kim, Park and Sin27) .
Studies have shown that supplementation with probiotics and plant extracts increased the concentration of the SCFA in the faeces(Reference Nagpal, Wang and Ahmadi28). Probiotics produced these SCFA by directly decomposing the plant extracts or regulating the intestinal microbiota to use the plant extracts(Reference Lin, Frassetto and Kowalik29). In the present study, the application of L. casei YRL577 with TP increased the content of butyric acid in the faeces. Studies have shown that when the FXR receptor-deficient mice were fed a high-fat diet, the abundance of butyrate-producing bacteria decreased and levels of the β-muricholic acid and deoxycholic acid increased significantly. Ampho cholic acid and deoxycholic acid could be up-regulated via the expression of inflammatory genes (CCL17, CCL20, CCL2 and TIMP1) to trigger NAFLD(Reference Sheng, Jena and Hu30). This suggested that the therapeutic effect of probiotics and plant extracts on NAFLD might be related to the bile acid receptor FXR.
FXR was highly expressed in the intestine and was a natural receptor for bile acids(Reference Vavassori, Mencarelli and Renga31). When FXR was down-regulated, the FXR-mediated Wnt/B-catenin signal was weakened and unable to induce the bile acid transporter gene expression. Accumulated bile acids form lipid metabolism disorders(Reference Abdelkarim, Caron and Duhem32). The regulated FXR stimulated FGF15 synthesis(Reference Walters, Johnston and Nolan33), which accelerated lipid metabolism and regulated the synthesis of the bile segment(Reference Gao, Fu and Wang34,Reference Park, Kim and Ko35) . ASBT expression levels were related to the intestinal bile acid transport and homoeostasis maintenance(Reference Miyata, Yamakawa and Hamatsu36), which was beneficial for lipid metabolism. Numerous studies have confirmed that the activation of genes in the intestinal bile acid pathway reduces liver steatosis caused by a high-fat diet(Reference Fang, Suh and Reilly37,Reference Bai, Zheng and Zhang38) . The present study found that a high-fat diet increased the expression of ASBT and decreased the expression of FXR and FGF15. The application of L. casei YRL577 with RES or TP up-regulated the expression of FXR and FGF15 and inhibited ASBT expression. This result might suggest that the combined application of L. casei YRL577 with TP improved markers of NAFLD by regulating genes in the intestinal bile acid pathway.
Conclusion
The present study screened plant extracts that exhibited a beneficial effect on alleviating the lipid deposition in HepG2 cells. Furthermore, in vitro studies had confirmed that no inhibitory effect on the growth of the strain was observed. The combinationof L. casei YRL577 with TP exhibited a potential reparative effect on the NAFLD in the mice. In addition, L. casei YRL577 with TP also increased the content of the SCFA, particularly the butyric acid in the faeces. These effects of improving markers of NAFLD might be attributed to the activation of the bile acid-associated genes in the intestine. However, the related mechanism that involved has not yet been elucidated and will require future research.
Acknowledgements
Marine Bioactive Substances Laboratory of Ocean University of China, Qingdao, Shandong, China.
The present study was financially supported by National Key R&D of China (2018YFC0311201) and Heilongjiang province Key Sci.&Techn. Plan (GA16B201-2).
L. Z. designed and guided the experiments; Z. Z. and H. Z. wrote the original draft; Z. Z., H. Z., M. G., X. Z. and J. W. performed the experiments; X. L., Y. L., L. B. and J. Z. analysed the data. P. G., T. L. and H. Y. revised the manuscript.
No conflict of interest exists in the submission of this manuscript, and the manuscript was approved by all authors for publication.


