


1. Introduction
Tissue engineering aims to grow functional tissue in vitro [Reference Shafiee and Atala30]. Cells are typically grown in a bioreactor reactor chamber which monitors and controls the thermal, mechanical and biochemical environment of the cells. For three-dimensional constructs, a scaffold provides support for the growing tissue which generally aims to mimic the function of the extracellular matrix in the target tissue [Reference Lee, Cuddihy and Kotov19]. In vivo, the extracellular matrix acts to provide mechanical support to the tissue, as well as regulate cellular activity via mechanical and biochemical cues. Scaffolds are designed to mirror the mechanical properties of native tissue, with surface properties that facilitate cell adhesion, and can be supplemented with chemical agents that further support cell growth, for example the inclusion of growth or signalling factors [Reference Chung and King6]. The scaffold geometry must facilitate mass transport of nutrients and metabolite to cells throughout the tissue construct to avoid a necrotic core associated with insufficient oxygen supply [Reference Malda, Klein and Upton21]. While purely diffusive transport may be sufficient for constructs of up to $\sim 100\mu m$
in depth, it becomes inadequate for larger constructs, driving the development of porous scaffolds which facilitate advective transport by allowing perfusion of fluid throughout the scaffold [Reference Papenburg, Liu, Higuera, Barradas, de Boer, van Blitterswijk, Wessling and Stamatialis25]. Mathematical modelling can provide insight into the distribution of metabolites within a bioreactor scaffold, linking the dominant transport processes with the experimental operating parameters and the scaffold geometry.
$\sim 100\mu m$
in depth, it becomes inadequate for larger constructs, driving the development of porous scaffolds which facilitate advective transport by allowing perfusion of fluid throughout the scaffold [Reference Papenburg, Liu, Higuera, Barradas, de Boer, van Blitterswijk, Wessling and Stamatialis25]. Mathematical modelling can provide insight into the distribution of metabolites within a bioreactor scaffold, linking the dominant transport processes with the experimental operating parameters and the scaffold geometry.
The modelling we will present in this paper is motivated by a fibrous scaffold developed for a humanoid robotic bioreactor with a tendon tissue engineering application [Reference Mouthuy, Snelling, Hostettler, Kharchenko, Salmon, Wainman, Mimpen, Paul and Carr22]. This scaffold, shown in figure 1c, consists of 200 fibres attached at each end to a flexible outer casing. The dimensions of the bioreactor and its components are listed in the appendix, table A3. Each filament is manufactured from a biodegradable polymer (polycaprolactone) using electrospinning, and so the scaffold also has a fibrous microstructure. The open pore structure is designed to mimic collagen fibril structures in native tendon and to facilitate perfusion throughout the scaffold.
a. Humanoid robotic bioreactor described in [Reference Mouthuy, Snelling, Hostettler, Kharchenko, Salmon, Wainman, Mimpen, Paul and Carr22]. An additively manufactured shoulder joint is actuated by string ‘muscles’ to provide mechanical forcing to the bioreactor chamber which is placed in the position of the rotator cuff tendon. b. Bioreactor scaffold shown inside the bioreactor chamber. c. Micro CT image of fibre bundles that constitute the scaffold. Images are with thanks to Pierre-Alexis Mouthuy.

Mathematical modelling has been applied previously to nutrient transport in various bioreactor systems. For uniformly porous bioreactor scaffolds, Darcy’s law is often used to describe the fluid flow which relates pressure gradients across the bioreactor scaffold to the fluid velocity, see for example [Reference Osiecki, McElwain, Lott and Makinde24, Reference Shipley and Waters33, Reference Whittaker, Booth, Dyson, Bailey, Parsons Chini, Naire, Payvandi, Rong, Woollard, Cummings, Waters, Mawasse, Chaudhuri, Ellis, Michael, Kuiper and Cartmell35]. The fluid flow influences transport via the fluid velocity in the advection-diffusion-reaction equation which governs nutrient concentration. The coupling can become two-way when the effects of cell proliferation are taken into account; in [Reference Shakeel, Matthews, Graham and Waters31] for example, the scaffold permeability changes with cell number, which has a growth rate related to fluid shear stress and nutrient concentration, meaning that the fluid and nutrient problems are fully coupled. The permeability in effective continuum equations such as Darcy’s law must be specified, normally via empirical measurements. An alternative approach which calculates the scaffold permeability during the derivation of a macroscale model is homogenisation via multiscale asymptotics, which has been applied to modelling transport processes when growing tissue in vitro [Reference O’Dea, Nelson, El Haj, Waters and Byrne23].
Beyond bioreactor systems, homogenisation via multiscale asymptotics has been applied to many problems involving transport in porous media, for example in modelling filtration, biofilm formation and drug transport [Reference Dalwadi, Bruna and Griffiths9, Reference Schulz and Knabner29, Reference Shipley and Chapman32]. The homogenisation method relies on the separation of lengthscales characterising the typical dimension of the whole material $L$
, and the pore scale
$L$
, and the pore scale $\delta L$
, where
$\delta L$
, where $\delta \ll 1.$
The standard method considers materials with an exactly periodic microstructure and introduces multiple scales expansions for the dependent variables [Reference Auriault and Adler1, Reference Shipley and Chapman32]. The analysis results in a macroscale problem which gives an effective model for the composite, which may be coupled to a microscale problem which describes transport processes on the pore scale.
$\delta \ll 1.$
The standard method considers materials with an exactly periodic microstructure and introduces multiple scales expansions for the dependent variables [Reference Auriault and Adler1, Reference Shipley and Chapman32]. The analysis results in a macroscale problem which gives an effective model for the composite, which may be coupled to a microscale problem which describes transport processes on the pore scale.
The standard method can be extended to treat materials with a microstructure which is slowly varying or time dependent [Reference Dalwadi10]. Slow variation in the microstructure can give rise to a different macroscale model, for example porosity gradients in materials not subject to flow result in an advection-type term in the diffusion equation which biases transport towards regions of high porosity [Reference Bruna and Chapman4]. Changes in filter blocking behaviour result when the microstructure slowly varies, with adsorption modelled using Robin boundary conditions at the filter boundary [Reference Dalwadi, Bruna and Griffiths9]. Homogenised models of tissue growth have considered spatiotemporal evolution of the microstructure. In [Reference O’Dea, Nelson, El Haj, Waters and Byrne23], surface growth of biological tissue was modelled in a similar manner to phase change, specifying a growth rate that depended on the local concentration. Homogenised models including surface accretion have also been applied to avascular tumour growth and the response to chemotherapy [Reference Collis, Hubbard and O’Dea8]. More complex features of tissue growth such as cell-cell interaction can be accounted for in a multiphase model which allows mass transfer between phases [Reference Holden, Collis, Brook and O’Dea12, Reference Holden, Chapman, Brook and O’Dea13]. For the papers referenced above, where the microstructure has a fixed unit cell size, the microstructural evolution can be modelled using a function with level sets defining the microscale boundaries. To treat more general microstructural variation, such as volumetric growth, a mapping can be used from the current configuration to an exactly periodic reference configuration, see for example [Reference Collis, Brown, Hubbard and O’Dea7, Reference Peter and Böhm26, Reference Richardson and Chapman28].
To make progress analysing the problem with volumetric growth, the timescale characterising growth was assumed to be much slower than that characterising the deformation [Reference Collis, Brown, Hubbard and O’Dea7]. Analysis of problems that have multiple spatial and temporal scales has been conducted for applications in reactive decontamination [Reference Luckins, Breward, Griffiths and Wilmott20], modelling thermal dissipation in an elastic-viscoelastic composite [Reference Boutin and Wong3], wave propogation in heterogeneous media [Reference Chen and Fish5] and transport in rigid porous media [Reference Auriault and Adler1]. Typically periodicity in the fast timescale is assumed, which may be motivated by oscillatory boundary conditions, providing an extra condition to close the problem. An average is then taken over the fast timescale to obtain a problem which describes evolution of the system on the slow spatial and temporal scales.
For advection, diffusion and absorption processes in porous media, several characteristic timescales exist. The timescales in balance reflect the dominant modes of transport on both the microscale and macroscale, thereby dictating the form of the effective model via the size of dimensionless parameters in the problem. The analysis of the effective models of transport that arise in rigid porous media is given in [Reference Auriault and Adler1]. In this paper, we obtain a homogenised model of nutrient transport for various parameter regimes in a fibrous scaffold where the fibres move in response to the flow. The scaffold is modelled as a bundle of aligned strings saturated with viscous, incompressible fluid. We consider fluid-string interaction which gives rise to a slowly varying microstructure. For this work, we consider the early stages of bioreactor operation where the cell volume is negligible compared with the scaffold volume, focusing on modelling the simpler case of a fluid-saturated fibrous scaffold in the absence of tissue growth. Multiple temporal scales are required to treat the regime where macroscale diffusion balances macroscale advection, that is when the global Péclet number $Pe = O(1)$
, when flow is driven by time-harmonic string motion. The microscale problem is solved to obtain the anisotropic effective diffusion coefficient and analytical solutions to the model are presented in each regime to illustrate the role of parameters present in the macroscale problem.
$Pe = O(1)$
, when flow is driven by time-harmonic string motion. The microscale problem is solved to obtain the anisotropic effective diffusion coefficient and analytical solutions to the model are presented in each regime to illustrate the role of parameters present in the macroscale problem.
2. Review of the fluid-structure problem
In this section, we review the methodology presented in [Reference Kent, Waters, Oliver and Chapman16] for the derivation of a reduced model for fluid-string interaction within the bioreactor scaffold, presenting the equations at each order which are relevant for the nutrient transport problem. A summary of symbols and their definitions is given in Tables A1 and A2 in appendix A.
We consider a fibrous scaffold which consists of a fluid region $\Omega _f$
surrounding
$\Omega _f$
surrounding $N$
strings with radius
$N$
strings with radius $b$
, the
$b$
, the $i$
th string occupying the region
$i$
th string occupying the region $\Omega _s^i$
for
$\Omega _s^i$
for $i = 1, \cdots, N$
. We assume that the strings have a reference configuration aligned with the
$i = 1, \cdots, N$
. We assume that the strings have a reference configuration aligned with the $z$
-axis as illustrated in figure 2, with endpoints
$z$
-axis as illustrated in figure 2, with endpoints $\textbf{x}_0^i$
that lay on a square, periodic array (figure 2b). The separation between adjacent strings
$\textbf{x}_0^i$
that lay on a square, periodic array (figure 2b). The separation between adjacent strings $l$
is much less than the characteristic dimension of the chamber
$l$
is much less than the characteristic dimension of the chamber $L$
. Thus, the ratio of these two lengthscales
$L$
. Thus, the ratio of these two lengthscales $\delta = l/L \ll 1$
provides a small parameter which underpins the multiscale approach. We take the chamber enclosing the scaffold to be a rigid cylinder of length
$\delta = l/L \ll 1$
provides a small parameter which underpins the multiscale approach. We take the chamber enclosing the scaffold to be a rigid cylinder of length $L$
and radius
$L$
and radius $R$
with curved, outer boundary
$R$
with curved, outer boundary $\partial \Omega _e$
(see figure 2.a), although the effective models of the fibrous scaffold and transport within it that we obtain may be incorporated into different chamber geometries.
$\partial \Omega _e$
(see figure 2.a), although the effective models of the fibrous scaffold and transport within it that we obtain may be incorporated into different chamber geometries.
Schematic of the model geometry. a. The bioreactor is modelled as a cylinder with length $L$
and radius
$L$
and radius $R$
. Strings are represented in grey and blue represents fluid. The origin of Cartesian coordinates
$R$
. Strings are represented in grey and blue represents fluid. The origin of Cartesian coordinates $(x, y, z)$
is chosen to be centre of the cylinder base. The fluid domain of the bioreactor is denoted
$(x, y, z)$
is chosen to be centre of the cylinder base. The fluid domain of the bioreactor is denoted $\Omega _f$
and the exterior curved boundary is denoted
$\Omega _f$
and the exterior curved boundary is denoted $\partial \Omega _e$
. b. A cross-section of the bioreactor. Strings are assumed to have equilibrium positions which lie on a square lattice with spacing
$\partial \Omega _e$
. b. A cross-section of the bioreactor. Strings are assumed to have equilibrium positions which lie on a square lattice with spacing $l$
. c. The unit cell which constitutes the lattice. The strings have radius
$l$
. c. The unit cell which constitutes the lattice. The strings have radius $b$
and displacement from equilibrium
$b$
and displacement from equilibrium $\textbf{s}$
. The domain of the string cross-section is denoted
$\textbf{s}$
. The domain of the string cross-section is denoted $D_s$
, its boundary is
$D_s$
, its boundary is $\partial D_s$
and the outward normal is
$\partial D_s$
and the outward normal is ${\hat {\textbf{n}}}_s$
. Dimensional scales of these parameters for the humanoid robotic bioreactor are listed in the appendix, table A3.
${\hat {\textbf{n}}}_s$
. Dimensional scales of these parameters for the humanoid robotic bioreactor are listed in the appendix, table A3.

We model the cell media as a slowly flowing, viscous, incompressible, Newtonian fluid with pressure $p$
, velocity
$p$
, velocity $\textbf{u}$
and dynamic viscosity
$\textbf{u}$
and dynamic viscosity $\mu$
, governed by the Stokes equations
$\mu$
, governed by the Stokes equations
 \begin{align} -\delta ^2 \unicode {x25BD} ^2 \textbf{u} + \unicode {x25BD} p &= \boldsymbol {0}, \end{align}
 \begin{align} \unicode {x25BD} \cdotp \textbf{u} &= 0, \end{align}
where $\textbf{u} = (u, v, w)$
is the dimensionless fluid velocity and
$\textbf{u} = (u, v, w)$
is the dimensionless fluid velocity and $p$
the dimensionless fluid pressure. Throughout this section we work with dimensionless quantities, nondimensionalised according to the scales listed in the appendix A. The same scales will be listed in (4.1) where they are used to nondimensionalise the nutrient transport problem. We balance hydrodynamic stress and the restoring force due to the string tension, which gives
$p$
the dimensionless fluid pressure. Throughout this section we work with dimensionless quantities, nondimensionalised according to the scales listed in the appendix A. The same scales will be listed in (4.1) where they are used to nondimensionalise the nutrient transport problem. We balance hydrodynamic stress and the restoring force due to the string tension, which gives
 \begin{equation} \int _{\partial D_s^{i}} \boldsymbol {\sigma }_{\perp } \cdotp {\hat {\textbf{n}}}_s dl +\frac {\partial ^2 \textbf{s}^i}{\partial z^2} = \boldsymbol {0}, \end{equation}
for the $i$
th string where
$i$
th string where $D_s^i$
is the domain of the string cross-section in the transverse plane, which we assume to be a diskFootnote
1
centred at
$D_s^i$
is the domain of the string cross-section in the transverse plane, which we assume to be a diskFootnote
1
centred at $\textbf{x}_0^i + \textbf{s}^i$
. Here
$\textbf{x}_0^i + \textbf{s}^i$
. Here $\sigma _{\perp }$
represents the transverse components of the fluid stress tensor, that is
$\sigma _{\perp }$
represents the transverse components of the fluid stress tensor, that is $\sigma _{\perp, ij} = - p \delta _{ij}/\delta ^2 + \partial _i u_j + \partial _j u_i$
for
$\sigma _{\perp, ij} = - p \delta _{ij}/\delta ^2 + \partial _i u_j + \partial _j u_i$
for $i, j = 1, 2$
, the outward-facing normal to the string boundary is denoted
$i, j = 1, 2$
, the outward-facing normal to the string boundary is denoted ${\hat {\textbf{n}}}_s$
and
${\hat {\textbf{n}}}_s$
and $\textbf{s}^i = (s_x^i, s_y^i)$
is the transverse displacement of the string centreline. Further details as to the assumptions underpinning the derivation of (2.3) are given in appendix B. We introduce a continuum function
$\textbf{s}^i = (s_x^i, s_y^i)$
is the transverse displacement of the string centreline. Further details as to the assumptions underpinning the derivation of (2.3) are given in appendix B. We introduce a continuum function $\textbf{s}$
defined within the region of all strings such that
$\textbf{s}$
defined within the region of all strings such that $\textbf{s}=\textbf{s}^i$
within
$\textbf{s}=\textbf{s}^i$
within $D_s^i$
;
$D_s^i$
; $\textbf{s}$
will vary from string to string, but will be constant on each string cross-section. Thus
$\textbf{s}$
will vary from string to string, but will be constant on each string cross-section. Thus
 \begin{equation} \unicode {x25BD}_\perp \textbf{s} = 0 \qquad \mbox { in } D_s^i, \end{equation}
where $\unicode {x25BD} _\perp = (\partial _x, \partial _y)$
.
$\unicode {x25BD} _\perp = (\partial _x, \partial _y)$
.
A no-slip condition is imposed at the fluid-string boundaries $\partial D_s^i$
, that is
$\partial D_s^i$
, that is
 \begin{equation} \textbf{v} = \frac {\partial \textbf{s}^i}{\partial t} \quad \text {and} \quad w = 0 \quad \text {on} \quad \partial D_s^i, \end{equation}
where we have decomposed the fluid velocity into transverse and axial components as $\textbf{u} = \textbf{v} + w {\hat {\textbf{e}}}_z$
.
$\textbf{u} = \textbf{v} + w {\hat {\textbf{e}}}_z$
.
2.1. Multiple scales analysis
We introduce a slow scale $\textbf{x}$
, which gives the variation across the whole scaffold, and a fast scale
$\textbf{x}$
, which gives the variation across the whole scaffold, and a fast scale $\textbf{X} = (x, y)/\delta$
, which describes the variation on the scale of separation between adjacent strings. Treating the slow and fast scales independently, the transverse gradient transforms into multiple scales form as
$\textbf{X} = (x, y)/\delta$
, which describes the variation on the scale of separation between adjacent strings. Treating the slow and fast scales independently, the transverse gradient transforms into multiple scales form as $\unicode {x25BD} _{\perp } \to \delta ^{-1} \unicode {x25BD} _{\textbf{X}} +\unicode {x25BD} _{\textbf{x}}$
, where
$\unicode {x25BD} _{\perp } \to \delta ^{-1} \unicode {x25BD} _{\textbf{X}} +\unicode {x25BD} _{\textbf{x}}$
, where $\unicode {x25BD} _{\textbf{X}} = (\partial _X, \partial _Y)$
and
$\unicode {x25BD} _{\textbf{X}} = (\partial _X, \partial _Y)$
and $\unicode {x25BD} _{\textbf{x}} = (\partial _x, \partial _y)$
denote the gradient with respect to fast and slow coordinates respectively. We require only slow
$\unicode {x25BD} _{\textbf{x}} = (\partial _x, \partial _y)$
denote the gradient with respect to fast and slow coordinates respectively. We require only slow $z$
-coordinates as the tangents to the strings are approximately in the
$z$
-coordinates as the tangents to the strings are approximately in the $z$
-direction; any fast variation in the microstructure occurs in the transverse directions. We pose multiple-scales expansions for the fluid pressure, velocity and string displacement in the form
$z$
-direction; any fast variation in the microstructure occurs in the transverse directions. We pose multiple-scales expansions for the fluid pressure, velocity and string displacement in the form
 \begin{equation} p = p_0(\textbf{x}, \textbf{X}) + \delta p_1(\textbf{x}, \textbf{X}) + O(\delta ^2) \quad \textit {etc.} \end{equation}
Substituting these expansions into the multiple scales form of (2.1)–(2.5), and comparing coefficients at each order of $\delta$
, we find at leading order that
$\delta$
, we find at leading order that
 \begin{align} \unicode {x25BD} _X p_0 &= \boldsymbol {0} \quad \text {in} \quad D_f, \end{align}
 \begin{align} \unicode {x25BD} _X \cdotp \textbf{v}_{0} & = 0 \quad \text {in} \quad D_f, \end{align}
 \begin{align} \unicode {x25BD} _{X} \textbf{s}_0 &= 0 \quad \text {in} \quad D_{s_0}, \end{align}
 \begin{align} \int _{\partial D_{s_0}} p_0 {\hat {\textbf{n}}} dl_X &= 0, \end{align}
 \begin{align} \textbf{v}_0 &= \frac {\partial \textbf{s}_0 }{\partial t} \quad \text {on} \quad \partial D_{s_0}, \end{align}
 \begin{align} w_0 &= 0 \quad \text {on} \quad \partial D_{s_0}, \end{align}
where $D_f$
is the fluid region,
$D_f$
is the fluid region, ${\hat {\textbf{n}}}$
is the normal to the boundary of the leading-order string cross-section
${\hat {\textbf{n}}}$
is the normal to the boundary of the leading-order string cross-section $\partial D_{s_0}$
,
$\partial D_{s_0}$
, $dl_X$
is the line element in fast coordinates, and we have used the decomposed fluid velocity defined after equation (2.5). Thus, we have the leading-order pressure and string displacement independent of the fast scale. At next order, we find
$dl_X$
is the line element in fast coordinates, and we have used the decomposed fluid velocity defined after equation (2.5). Thus, we have the leading-order pressure and string displacement independent of the fast scale. At next order, we find
 \begin{align} - \unicode {x25BD} ^2_X \textbf{v}_0 + \unicode {x25BD} _x p_0 + \unicode {x25BD} _X p_1 = \boldsymbol {0} \quad \text {in} \quad D_f, \end{align}
 \begin{align} - \unicode {x25BD} ^2_X w_0 + \frac {\partial p_0}{\partial z} = 0 \quad \text {in} \quad D_f, \end{align}
 \begin{align} \unicode {x25BD} _X \cdotp \textbf{v}_{ 1} + \unicode {x25BD} _x \cdotp \textbf{v}_{0} + \frac {\partial w_0}{\partial z}= 0 \quad \text {in} \quad D_f, \end{align}
 \begin{align} \unicode {x25BD} _{x} \textbf{s}_0 + \unicode {x25BD} _{X} \textbf{s}_1 = 0 \quad \text {in} \quad D_s, \end{align}
 \begin{align} \int _{\partial D_{s_0}} [{-}p_1I_2 + \unicode {x25BD} _X \textbf{v}_0 + (\unicode {x25BD} _X \textbf{v}_0)^T]\cdotp {\hat {\textbf{n}} dl_X - \int _{\partial D_{s_0}} \textbf{X} \cdotp \unicode {x25BD} _x p_0 \cdotp {\hat {\textbf{n}}}} dl_X + \frac {\partial ^2 \textbf{s}_0}{\partial z^2} = 0, \end{align}
 \begin{align} \textbf{v}_1 = \frac {\partial \textbf{s}_1}{\partial t} - (\textbf{s}_1 + \textbf{X} \cdotp \unicode {x25BD} _x \textbf{s}_0) \cdotp \unicode {x25BD} _X \textbf{v}_0 \quad \text {on} \quad \partial D_{s_0}, \end{align}
 \begin{align} w_1 = 0 \quad \text {on}\quad \partial D_{s_0}, \end{align}
where $I_2 = \text {diag}(1, 1).$
Integrating (2.16), we find an expression for
$I_2 = \text {diag}(1, 1).$
Integrating (2.16), we find an expression for $\textbf{s}_1$
which will prove useful in homogenisation of the nutrient transport problem, namely
$\textbf{s}_1$
which will prove useful in homogenisation of the nutrient transport problem, namely $\textbf{s}_1 = - \textbf{X} \cdot \unicode {x25BD} _{\textbf{x}} \textbf{s}_0 + \textbf{d}_0$
, where
$\textbf{s}_1 = - \textbf{X} \cdot \unicode {x25BD} _{\textbf{x}} \textbf{s}_0 + \textbf{d}_0$
, where $\textbf{d}_0$
is a function independent of the fast scale. The solution of (2.8), (2.13), (2.14) and boundary conditions (2.11)–(2.12) for
$\textbf{d}_0$
is a function independent of the fast scale. The solution of (2.8), (2.13), (2.14) and boundary conditions (2.11)–(2.12) for $\textbf{u}_0$
and
$\textbf{u}_0$
and $p_1$
comprises microscale cell-functions modulated by macroscale pressure gradients. The microscale problems characterise the microscale shear stress and, when averaged, the permeability of the effective material.
$p_1$
comprises microscale cell-functions modulated by macroscale pressure gradients. The microscale problems characterise the microscale shear stress and, when averaged, the permeability of the effective material.
2.2. Homogenised fluid-structure problem
After averaging (2.15) and the form for $\textbf{u}_0$
(from the microscale analysis) over the unit cell, we obtain the following equations governing fluid flow in the scaffold
$\textbf{u}_0$
(from the microscale analysis) over the unit cell, we obtain the following equations governing fluid flow in the scaffold
 \begin{align} \unicode {x25BD} \cdotp {\langle \textbf{u}_0\rangle } &= 0, \end{align}
 \begin{align} {\langle \textbf{v}_0\rangle }&= - \mathcal {K}_{\perp } \unicode {x25BD} _{\perp } p + \frac {\partial \textbf{s}}{\partial t}, \end{align}
 \begin{align} {\langle w_0 \rangle } &= -\kappa _3 \frac {\partial p_0}{\partial z}, \end{align}
 \begin{align} - \unicode {x25BD} _{\perp } p_0 + \frac {\partial ^2 \textbf{s}_0}{\partial z^2} &= \boldsymbol {0}, \end{align}
where $\mathcal {K}_\perp$
is the transverse scaffold permeability and
$\mathcal {K}_\perp$
is the transverse scaffold permeability and $\kappa _3$
is the axial permeability. The permeabilities are obtained by averaging the solutions to microscale problems, that is
$\kappa _3$
is the axial permeability. The permeabilities are obtained by averaging the solutions to microscale problems, that is
 \begin{equation} \mathcal {K}_\perp = \frac {1}{\phi _f} \int _{D_f} \Psi _\perp dS_X \quad \text {and} \quad \kappa _3 = \frac {1}{\phi _f} \int _{D_f} \Psi _{33} dS_X \end{equation}
where $\Psi _\perp$
is a
$\Psi _\perp$
is a $2\times 2$
tensor satisfying
$2\times 2$
tensor satisfying
 \begin{align} - \unicode {x25BD} _X^2 \Psi _\perp + \unicode {x25BD} _X \boldsymbol {\Phi } + I &= 0 \quad \text {in}\quad D_f, \end{align}
 \begin{align} \unicode {x25BD} _X \cdotp \Psi _\perp &= 0 \quad \text {in}\quad D_f, \end{align}
 \begin{align} \Psi _\perp \text { and } \Phi \text { periodic and } \Psi _{\perp } &= 0 \quad \text {on} \quad \partial D_{s_0}. \end{align}
and $\Psi _{33}$
is a scalar function which satisfies
$\Psi _{33}$
is a scalar function which satisfies
 \begin{align} \unicode {x25BD} ^2_X \Psi _{33} &= 1 \quad \text {in} \quad D_f, \end{align}
 \begin{align} \Psi _{33} &= 0 \quad \text {on} \quad \partial D_{s_0}, \end{align}
 \begin{align} \Psi _{33} &\text { periodic.} \end{align}
Note that we have written the flow problem in terms of the intrinsic (phase-averaged) velocity $\langle \textbf{u}_0 \rangle$
. More common is to use the superficial or Darcy velocity
$\langle \textbf{u}_0 \rangle$
. More common is to use the superficial or Darcy velocity
 \begin{equation*} \textbf{U} = \frac {1}{|D|}\int _{D_f}\textbf{u}_0\, dS_X \end{equation*}
where $D = D_f \cup D_{s_0}$
is the whole unit cell (so
$D = D_f \cup D_{s_0}$
is the whole unit cell (so $|D| = 1$
in our case). These are related by
$|D| = 1$
in our case). These are related by $ \textbf{U} = \phi _f \langle \textbf{u}_0 \rangle$
. Since
$ \textbf{U} = \phi _f \langle \textbf{u}_0 \rangle$
. Since $\phi _f$
is constant in our case, the difference is a simple scale factor (which appears in the permeabilities (2.24)—using the Darcy velocity the factors of
$\phi _f$
is constant in our case, the difference is a simple scale factor (which appears in the permeabilities (2.24)—using the Darcy velocity the factors of $\phi _f$
would not be present in the denominators). In cases where
$\phi _f$
would not be present in the denominators). In cases where $\phi _f$
varies with position the difference is more significant.
$\phi _f$
varies with position the difference is more significant.
Equations (2.20)–(2.23) are supplemented with boundary conditions specifying the fluid flux or pressure and string displacements at $z = 0, 1$
. We specify no fluid flux through the curved boundary of the chamber
$z = 0, 1$
. We specify no fluid flux through the curved boundary of the chamber
 \begin{equation} \textbf{u} \cdot {\hat {\textbf{n}}} = 0 \quad \text {on} \quad \partial \Omega _e, \end{equation}
reflecting the assumption of impermeable outer walls; this translates to $\langle \textbf{u}_0\rangle \cdot {\hat {\textbf{n}}} = 0$
on
$\langle \textbf{u}_0\rangle \cdot {\hat {\textbf{n}}} = 0$
on $\partial \Omega _e$
. Having outlined the nature of the multiple scales analysis of the fluid-string problem, we are now well placed to begin the derivation of the homogenised model governing transport processes in the same domain.
$\partial \Omega _e$
. Having outlined the nature of the multiple scales analysis of the fluid-string problem, we are now well placed to begin the derivation of the homogenised model governing transport processes in the same domain.
3. Transport model setup
Nutrients and metabolites with concentration $c$
can diffuse and advect through the cell media according to the advection-diffusion equation
$c$
can diffuse and advect through the cell media according to the advection-diffusion equation
 \begin{equation} \frac {{\partial } c}{{\partial } t} + \textbf{u} \cdot \unicode {x25BD} c = D \unicode {x25BD} ^2 c \quad \text {in} \quad \Omega _f, \end{equation}
where $D$
is the diffusion of the nutrient in the cell media. We assume that there is no flow of nutrient through the outer wall of the chamber, which implies that
$D$
is the diffusion of the nutrient in the cell media. We assume that there is no flow of nutrient through the outer wall of the chamber, which implies that
 \begin{equation} {\hat {\textbf{n}}} \cdot \unicode {x25BD} c = 0 \quad \text {on} \quad \partial \Omega _e, \end{equation}
where ${\hat {\textbf{n}}}$
is the outward-facing normal to the outward surface of the domain and we have used the condition of no fluid flux on
${\hat {\textbf{n}}}$
is the outward-facing normal to the outward surface of the domain and we have used the condition of no fluid flux on $\partial \Omega _e$
(see equation (2.31)). We assume that cells fixed on the string boundaries uptake nutrient at a rate
$\partial \Omega _e$
(see equation (2.31)). We assume that cells fixed on the string boundaries uptake nutrient at a rate $\overline {A}$
per unit area,
$\overline {A}$
per unit area,
 \begin{equation} {\hat {\textbf{n}}}_s \cdot \left ( \left ( \textbf{u}- \frac {\partial \textbf{s}}{\partial t} \right )c - D \unicode {x25BD} c \right ) = - \overline {A} \quad \text {on}\quad \partial \Omega _s, \end{equation}
where ${\hat {\textbf{n}}}_s$
is the outward-facing normal to the string surface
${\hat {\textbf{n}}}_s$
is the outward-facing normal to the string surface $\partial \Omega _s$
, and we have used the fluid velocity relative to the boundary in specification of the nutrient flux. Using the no-slip conditions (equation (2.5)) at the string surface, (3.3) reduces to
$\partial \Omega _s$
, and we have used the fluid velocity relative to the boundary in specification of the nutrient flux. Using the no-slip conditions (equation (2.5)) at the string surface, (3.3) reduces to
 \begin{equation} {\hat {\textbf{n}}}_s \cdot \left ( D \unicode {x25BD} c \right ) = \overline {A} \quad \text {on}\quad \partial \Omega _s. \end{equation}
A known concentration of the nutrient enters the chamber at the inlet
 \begin{equation} c = c_{in} \quad \text {at} \quad z = 0, \end{equation}
where $c_{in} = c_{in}(x, y)$
is given for
$c_{in} = c_{in}(x, y)$
is given for $(x, y) \in \Omega _f \cap \{z= 0\}$
. We make the assumption of zero diffusive flux at the outflow
$(x, y) \in \Omega _f \cap \{z= 0\}$
. We make the assumption of zero diffusive flux at the outflow
 \begin{equation} \frac {\partial c }{\partial z} = 0 \quad \text {at} \quad z = L, \end{equation}
for $(x, y) \in \Omega _f \cap \{z= L\}$
. We also prescribe the initial nutrient concentration, imposing
$(x, y) \in \Omega _f \cap \{z= L\}$
. We also prescribe the initial nutrient concentration, imposing
 \begin{equation} c = c_0 \quad \text {at} \quad t = 0 \quad \text {in} \quad \Omega _f. \end{equation}
4. Nondimensionalisation
We nondimensionalise (3.1)–(3.7) using the following scales
 \begin{equation} c = c_{in} \hat {c}, \quad (x, y,z) = L(\hat {x}, \hat {y}, \hat {z}), \quad (u, v, w) = U(\hat {u}, \hat {u}, \hat {w}), \quad t = \frac {\delta L}{U} \hat {t}, \end{equation}
where hats denote nondimensional quantities, $L$
is the characteristic scaffold dimension and
$L$
is the characteristic scaffold dimension and $U = \delta T/ \mu L$
is the characteristic fluid velocity for a given string tension
$U = \delta T/ \mu L$
is the characteristic fluid velocity for a given string tension $T$
and fluid dynamic viscosity
$T$
and fluid dynamic viscosity $\mu$
. We have chosen to nondimensionalise on the same timescale as the fluid-string problem, namely the timescale for microscale advection.
$\mu$
. We have chosen to nondimensionalise on the same timescale as the fluid-string problem, namely the timescale for microscale advection.
After dropping hats, the nondimensionalised advection-diffusion equation (3.1) becomes
 \begin{equation} \frac {\partial c}{\partial t} + \delta \textbf{u}\cdot \unicode {x25BD} c = \frac {\delta }{Pe}\unicode {x25BD} ^2 c \quad \text {in} \quad \Omega _f, \end{equation}
where $Pe = UL/D$
is the Péclet number which characterises the relative strength of advection to diffusion. The no-flux condition (3.2) in dimensionless form is
$Pe = UL/D$
is the Péclet number which characterises the relative strength of advection to diffusion. The no-flux condition (3.2) in dimensionless form is
 \begin{equation} {\hat {\textbf{n}}} \cdot \unicode {x25BD} c = 0 \quad \text {on} \quad \partial \Omega _e, \end{equation}
and the uptake condition becomes
 \begin{equation} \frac {1}{Pe} {\hat {\textbf{n}}}_s \cdot \unicode {x25BD} c = Da \: \quad \text {on}\quad \partial \Omega ^i_s, \end{equation}
where $Da = \overline {A} / U c_{in}$
is the Damköhler number, which gives the relative strength of uptake to advection. The condition on concentration at the inflow (3.5) becomes
$Da = \overline {A} / U c_{in}$
is the Damköhler number, which gives the relative strength of uptake to advection. The condition on concentration at the inflow (3.5) becomes
 \begin{equation} c = 1 \quad \text {at} \quad z = 0 \quad \forall (x, y) \in \Omega _f \cap \{z= 0\}, \end{equation}
and the outflow condition (3.6) becomes
 \begin{equation} \frac {\partial c}{\partial z} = 0 \quad \text {at} \quad z=1 \quad \forall (x, y) \in \Omega _f \cap \{z= 1\}. \end{equation}
Finally, we have the initial condition
 \begin{equation} c = c_0 \quad \text {at} \quad t = 0 \quad \forall (x, y) \in \Omega _f . \end{equation}
Advection, diffusion and reaction processes in porous media are characterised by timescales summarised in table 1. The timescales give the characteristic time to travel an order one distance on either the macroscale or microscale by the transport process listed, for example $t_d$
, the timescale of macroscale diffusion is the time taken to diffuse an order 1 distance on the macroscale. Modifying the Péclet number of the system, for example by modifying the velocity scale, alters the physical processes (or timescales) which are in balance. In sections 5.1 – 5.4, we consider the different macroscale models that arise for Péclet numbers of different magnitudes, as summarised in table 2.
$t_d$
, the timescale of macroscale diffusion is the time taken to diffuse an order 1 distance on the macroscale. Modifying the Péclet number of the system, for example by modifying the velocity scale, alters the physical processes (or timescales) which are in balance. In sections 5.1 – 5.4, we consider the different macroscale models that arise for Péclet numbers of different magnitudes, as summarised in table 2.
Problem timescales. $U$
is the fluid velocity scale,
$U$
is the fluid velocity scale, $L$
the characteristic macroscale lengthscale,
$L$
the characteristic macroscale lengthscale, $\overline {A}$
is rate of uptake and
$\overline {A}$
is rate of uptake and $\delta$
the ratio between microscale and macroscale lengthscales
$\delta$
the ratio between microscale and macroscale lengthscales

Summary of the regimes considered in this paper

5. Homogenisation
In this section, we derive effective models for nutrient transport within the fluid-string composite using homogenisation via multiscale asymptotics. We introduce a slow scale $\textbf{x}$
and a fast scale
$\textbf{x}$
and a fast scale $\textbf{X}$
as defined in section 2.1. We assume these scales are independent so that derivatives transform as
$\textbf{X}$
as defined in section 2.1. We assume these scales are independent so that derivatives transform as $\unicode {x25BD} \to \delta ^{-1}\unicode {x25BD} _{{X}} + \unicode {x25BD} _{{x}}$
. In multiple scales form (4.2) becomes
$\unicode {x25BD} \to \delta ^{-1}\unicode {x25BD} _{{X}} + \unicode {x25BD} _{{x}}$
. In multiple scales form (4.2) becomes
 \begin{equation} \frac {\partial c}{\partial t} + \textbf{u}\cdot ( \unicode {x25BD} _{{X}} c + \delta \unicode {x25BD} _{\textbf{x}} c) = \frac {1}{\delta Pe} \left ( \unicode {x25BD} _{{X}}^2 c + 2 \delta \unicode {x25BD} _{{x}} \cdot \unicode {x25BD} _{{X}} c + \delta ^2\unicode {x25BD} _{{x}}^2 c \right ). \end{equation}
To write the uptake condition at the string surface (4.4) in multiple scales form, we must expand the normal in multiple scales form addition to transforming the derivatives using the chain rule, i.e.
 \begin{equation} \left ( {\hat {\textbf{n}}}_0 + \delta {\hat {\textbf{n}}}_1 + \cdots \right ) \cdotp \left ( \frac {1}{\delta } \unicode {x25BD} _{{X}} c + \unicode {x25BD} _{{x}} c \right ) = Da \end{equation}
To derive the normal expansion and identify the form of the governing equations at each order, we introduce multiple scales expansion for the concentration, string displacement and fluid velocity,
 \begin{align} c &\sim c_0 (\textbf{x}, \textbf{X}, t) + \delta c_1 (\textbf{x}, \textbf{X}, t) + \cdots, \end{align}
 \begin{align} \textbf{s} &\sim \textbf{s}_0(\textbf{x}, t) + \delta \textbf{s}_1 (\textbf{x}, \textbf{X}, t) + \cdots, \end{align}
 \begin{align} \textbf{u} &\sim \textbf{u}_0 (\textbf{x}, \textbf{X}, t) + \delta \textbf{u}_1 (\textbf{x}, \textbf{X}, t) + \cdots, \end{align}
as $\delta \to 0.$
As in [Reference Kent, Waters, Oliver and Chapman16], we introduce a function
$\delta \to 0.$
As in [Reference Kent, Waters, Oliver and Chapman16], we introduce a function $h$
with level sets that define the leading-order position of the string boundary
$h$
with level sets that define the leading-order position of the string boundary $\partial D_{s_0}$
 \begin{equation} h = |\textbf{X} - \textbf{X}_0 - \textbf{s}_0 | - B, \end{equation}
where $\textbf{X}_0$
is the equilibrium position of the string and
$\textbf{X}_0$
is the equilibrium position of the string and $B$
is the string radius in fast coordinates. Formally, we should define
$B$
is the string radius in fast coordinates. Formally, we should define $h$
to include the whole expansion of
$h$
to include the whole expansion of $\textbf{s}$
, expand
$\textbf{s}$
, expand $h$
in
$h$
in $\delta$
and then expand all of the governing equations about the leading-order domain. In the appendix of [Reference Kent, Waters, Oliver and Chapman17], it is shown that the homogenised problem is unchanged by
$\delta$
and then expand all of the governing equations about the leading-order domain. In the appendix of [Reference Kent, Waters, Oliver and Chapman17], it is shown that the homogenised problem is unchanged by $O(\delta )$
perturbations to the domain and thus we should recover the same homogenised model using (5.6). The outward, unit normal to the leading-order string boundary is given by the gradient of the level set function defining the boundary, namely
$O(\delta )$
perturbations to the domain and thus we should recover the same homogenised model using (5.6). The outward, unit normal to the leading-order string boundary is given by the gradient of the level set function defining the boundary, namely
 \begin{equation} {\hat {\textbf{n}}} = \frac {\unicode {x25BD} _{\textbf{X}} h + \delta \unicode {x25BD} _{\textbf{x}} h}{|\unicode {x25BD} _{\textbf{X}} h + \delta \unicode {x25BD} _{\textbf{x}} h|} = {\hat {\textbf{n}}}_0 + \delta {\hat {\textbf{n}}}_1 + O(\delta ^2). \end{equation}
Note that when the geometry of the unit cell varies with macroscale position it is crucial to expand the normal in powers of $\delta$
, whether the boundary is defined parametrically or implicitly using a level set function. Many authors fail to make this expansion, which can result in the incorrect homogenised equations. For a more thorough discussion of this point see [Reference Kent, Waters, Oliver and Chapman17].
$\delta$
, whether the boundary is defined parametrically or implicitly using a level set function. Many authors fail to make this expansion, which can result in the incorrect homogenised equations. For a more thorough discussion of this point see [Reference Kent, Waters, Oliver and Chapman17].
We can use (5.4) and (5.6) to calculate the expansion coefficients explicitly, which gives
 \begin{equation} {\hat {\textbf{n}}}_0 = \frac {\textbf{X} - \textbf{X}_0 - \textbf{s}_0 }{|\textbf{X} - \textbf{X}_0 - \textbf{s}_0|} \end{equation}
and
 \begin{equation} {\hat {\textbf{n}}}_1 = -\frac {1}{2}({\hat {\textbf{n}}}_0 \cdot \unicode {x25BD} _{\textbf{x}} \textbf{s}_0 + \unicode {x25BD} _{\textbf{x}} \textbf{s}_0 \cdot {\hat {\textbf{n}}}_0) = -\frac {1}{2}( (\unicode {x25BD} _{\textbf{x}} \textbf{s}_0)^T + \unicode {x25BD} _{\textbf{x}} \textbf{s}_0 )\cdot {\hat {\textbf{n}}}_0. \end{equation}
Having established the first two terms in the expansion of the normal to the leading-order boundary, we write (4.4) in multiple-scales form by expanding the concentration gradient about this position and transforming the gradient operators into multiple-scales form. We expand in both the slow and fast variables about a fixed slow position on the leading-order position of the string boundary, $({\hat {\textbf{x}}}, \textbf{X}^b + \textbf{s}_0)$
, for example,
$({\hat {\textbf{x}}}, \textbf{X}^b + \textbf{s}_0)$
, for example,
 \begin{align}\unicode {x25BD} _{{X}} c_0(\hat {\textbf{x}} &+ \delta \textbf{X}, \textbf{X}^b + \textbf{s}_0({\hat {\textbf{x}}} + \delta \textbf{X} ) + \delta \textbf{s}_1({\hat {\textbf{x}}} + \delta \textbf{X}, \textbf{X}) + \ldots )\\ & = \unicode {x25BD} _{\textbf{X}} c_0 + \delta \textbf{X} \cdot \unicode {x25BD} _{\textbf{x}} \unicode {x25BD} _{\textbf{X}} c_0 + \delta (\textbf{s}_1 + \textbf{X} \cdot \unicode {x25BD} _{\textbf{x}} \textbf{s}_0) \cdot \unicode {x25BD} _{\textbf{X}} \unicode {x25BD} _{\textbf{X}} c_0 + O(\delta ^2) .\end{align}
This expansion is required as the leading-order position of the string varies with the slow position. If we did not include this expansion, instead taking the standard approach where the slow scale is assumed to be fixed throughout a given unit cell, we would miss terms at $O(\delta ^2)$
which account for the changes in flux as we move around the string boundary. The normal expansion (5.7) can then be combined with (5.9) to write (4.4) in multiple-scales form. The full expansion of (4.4) is given in appendix C, which greatly simplifies due to the fast-scale independence of the concentration at leading order in the multiple scales analysis.
$O(\delta ^2)$
which account for the changes in flux as we move around the string boundary. The normal expansion (5.7) can then be combined with (5.9) to write (4.4) in multiple-scales form. The full expansion of (4.4) is given in appendix C, which greatly simplifies due to the fast-scale independence of the concentration at leading order in the multiple scales analysis.
We postpone a discussion of boundary and initial conditions required for the macroscale problem until the form of the effective model has been identified. In sections 5.1– 5.2, we conduct multiple scales analysis for the parameter combinations listed in table 2, identifying the form of the effective model in each case.
5.1. Diffusion-reaction
In this section, we look to homogenise (4.2) and (4.4) in the limit of strong diffusion. We introduce the reduced Péclet number $\overline {Pe} = Pe/\delta$
, which we assume to be of order unity in this section.
$\overline {Pe} = Pe/\delta$
, which we assume to be of order unity in this section.
Substituting (5.3)–(5.5) into (5.1) and (C.2), we obtain the following at leading order
 \begin{align} \unicode {x25BD} _{\textbf{X}}^2 c_0 &= 0 \quad \text {in} \quad D_f, \end{align}
 \begin{align} {\hat {\textbf{n}}}_0 \cdot \unicode {x25BD} _{\textbf{X}} c_0 &= 0 \quad \text {on} \quad \partial D_{s_0}, \end{align}
with $c_0$
$c_0$ $\boldsymbol {1}$
-periodic in
$\boldsymbol {1}$
-periodic in $\textbf{X}$
. Here
$\textbf{X}$
. Here $\partial D_{s_0}$
denotes the boundary to the leading-order string position and
$\partial D_{s_0}$
denotes the boundary to the leading-order string position and $D_f$
the corresponding fluid domain. Thus, we have a leading-order solution where the concentration is independent of the fast scale. At
$D_f$
the corresponding fluid domain. Thus, we have a leading-order solution where the concentration is independent of the fast scale. At $O(\delta )$
, we have
$O(\delta )$
, we have
 \begin{align} \unicode {x25BD} _{\textbf{X}}^2 c_1 &= 0 \quad \text {in} \quad D_f, \end{align}
 \begin{align} {\hat {\textbf{n}}}_0 \cdot \unicode {x25BD} _{\textbf{X}} c_1 &= - {\hat {\textbf{n}}}_0 \cdot \unicode {x25BD} _{\textbf{x}} c_0 \quad \text {on} \quad \partial D_{s_0}, \end{align}
with $c_1$
$c_1$ $\boldsymbol {1}$
-periodic in
$\boldsymbol {1}$
-periodic in $\textbf{X}$
, where we have used the fast-scale independence of the leading-order concentration to cancel terms. Further using the fast-scale independence of
$\textbf{X}$
, where we have used the fast-scale independence of the leading-order concentration to cancel terms. Further using the fast-scale independence of $c_0$
, we decompose the fast scale dependence of
$c_0$
, we decompose the fast scale dependence of $c_1$
by writing
$c_1$
by writing
 \begin{equation} c_1 = - \boldsymbol {\Lambda } \cdot \unicode {x25BD} _{\textbf{x}} c_0 + \overline {\lambda }, \end{equation}
where $\overline {\lambda } = \overline {\lambda }(\textbf{x}, t)$
is a function of time and the slow scale determined by the solution to a higher-order problem. The cell function
$\overline {\lambda } = \overline {\lambda }(\textbf{x}, t)$
is a function of time and the slow scale determined by the solution to a higher-order problem. The cell function $\boldsymbol {\Lambda } = (\Lambda _1, \Lambda _2)$
satisfies the following cell problem:
$\boldsymbol {\Lambda } = (\Lambda _1, \Lambda _2)$
satisfies the following cell problem:
 \begin{align} \unicode {x25BD} _{\textbf{X}}^2 \boldsymbol {\Lambda } &= \boldsymbol {0} \quad \text {in} \quad D_f, \end{align}
 \begin{align} {\hat {\textbf{n}}}_0 \cdot \unicode {x25BD} _{\textbf{X}} \boldsymbol {\Lambda } &= {\hat {\textbf n} }_0 \quad \text {on} \quad \partial D_{s_0}, \end{align}
with $\boldsymbol {\Lambda }$
periodic in
$\boldsymbol {\Lambda }$
periodic in $\textbf{X}$
. We also impose
$\textbf{X}$
. We also impose
 \begin{equation} \int _{D_f} \boldsymbol {\Lambda } dS_X = \boldsymbol {0}, \end{equation}
which fixes the arbitrary constant in the solution of (5.16)–(5.17). For this Péclet number, the timescale of microscale diffusion is much faster than advection, resulting in a steady diffusion problem for microscale variations in nutrient concentration.
At $O(\delta ^2)$
, we have
$O(\delta ^2)$
, we have
 \begin{equation} \overline {Pe} \, \frac {\partial c_0}{\partial t} = \unicode {x25BD} _{\textbf{X}} \cdot \left ( \unicode {x25BD} _{\textbf{X}} c_2 + \unicode {x25BD} _{\textbf{x}} c_1 \right ) + \unicode {x25BD} _{\textbf{x}} \cdot \left ( \unicode {x25BD} _{\textbf{X}} c_1 + \unicode {x25BD} _{\textbf{x}} c_0 \right ) + \frac {\partial ^2 c_0}{\partial z^2} \quad \text {in} \quad D_f, \end{equation}
with
 \begin{align} {\hat {\textbf{n}}}_0 \cdot (\unicode {x25BD} _{\textbf{X}} c_2 + \unicode {x25BD} _{\textbf{x}} c_1) + {\hat {\textbf{n}}}_1 \cdot (\unicode {x25BD} _{\textbf{X}} c_1 + \unicode {x25BD} _{\textbf{x}} c_0) + &{\hat {\textbf{n}}}_0 \cdot \left ( \textbf{X} \cdot \unicode {x25BD} _{\textbf{x}} (\unicode {x25BD} _{\textbf{X}} c_1 + \unicode {x25BD} _{\textbf{x}} c_0)\right ) \\+ {\hat {\textbf{n}}}_0 \cdot \left ( \textbf{d}_0\cdot \unicode {x25BD} _{\textbf{X}} (\unicode {x25BD} _{\textbf{X}} c_1 + \unicode {x25BD} _{\textbf{x}} c_0)\right ) &= Da \, \overline {Pe} \, \quad \text {on} \quad \partial D_{s_0}, \end{align}
and $c_2$
periodic in
$c_2$
periodic in $\textbf{X}.$
Here we have substituted the solution for
$\textbf{X}.$
Here we have substituted the solution for $\textbf{s}_1$
from the homogenisation of the fluid-string problem in (5.20), that is
$\textbf{s}_1$
from the homogenisation of the fluid-string problem in (5.20), that is $\textbf{s}_1 = - \textbf{X} \cdot \unicode {x25BD} _{\textbf{x}} \textbf{s}_0 + \textbf{d}_0$
. Here
$\textbf{s}_1 = - \textbf{X} \cdot \unicode {x25BD} _{\textbf{x}} \textbf{s}_0 + \textbf{d}_0$
. Here $\textbf{d}_0$
is only a function of the slow scale and so this eliminates some fast-scale dependence in the expansion of the uptake boundary condition. To obtain the macroscale problem, we average (5.19) over the fluid region of the unit cell, which gives
$\textbf{d}_0$
is only a function of the slow scale and so this eliminates some fast-scale dependence in the expansion of the uptake boundary condition. To obtain the macroscale problem, we average (5.19) over the fluid region of the unit cell, which gives
 \begin{equation} \begin{split} \overline {Pe} \, \phi _f \, \frac {\partial c_0 }{\partial t } &= \int _{D_f }\unicode {x25BD} _{\textbf{X}} \cdot ( \unicode {x25BD} _{\textbf{X}} c_2 + \unicode {x25BD} _{\textbf{x}} c_1) dS_X\\ & \quad + \int _{D_f} \unicode {x25BD} _{\textbf{x}} \cdot ( \unicode {x25BD} _{\textbf{X}} c_1 + \unicode {x25BD} _{\textbf{x}} c_0 ) dS_X + \phi _f \, \frac {\partial ^2 c_0}{\partial z^2}, \end{split} \end{equation}
where the fluid volume fraction $\phi _f$
is equivalent to the area of
$\phi _f$
is equivalent to the area of $D_f$
. Applying the divergence theorem to the first integral substituting (5.20), we have
$D_f$
. Applying the divergence theorem to the first integral substituting (5.20), we have
 \begin{equation} \begin{split} \overline {Pe} \phi _f \frac {\partial c_0}{\partial t} & = -\int _{\partial D_{s_0}} (\unicode {x25BD} _{\textbf{X}} c_1 + \unicode {x25BD} _{\textbf{x}} c_0)\cdot {\hat {\textbf{n}}}_1 dl_X - \overline {Pe} \int _{\partial D_{s_0}} Da \, dl_X \\ & \quad + \int _{\partial D_{s_0}} \left ( \textbf{X} \cdot \unicode {x25BD} _{\textbf{x}} (\unicode {x25BD} _{\textbf{X}} c_1 + \unicode {x25BD} _{\textbf{x}} c_0)\right ) \cdot {\hat {\textbf{n}}}_0dl_X \\ &\quad + \int _{\partial D_{s_0}} \left ( \textbf{d}_0\cdot \unicode {x25BD} _{\textbf{X}} (\unicode {x25BD} _{\textbf{X}} c_1 + \unicode {x25BD} _{\textbf{x}} c_0)\right )\cdot {\hat {\textbf{n}}}_0 dl_X \\ &\quad + \int _{D_f} \unicode {x25BD} _{\textbf{x}} \cdot (\unicode {x25BD} _{\textbf{X}} c_1 + \unicode {x25BD} _{\textbf{x}} c_0) dS_X+ \phi _f \frac {\partial ^2 c_0}{\partial z^2}, \end{split} \end{equation}
where we have used the fast-scale independence of $c_0$
in evaluating the average of the time derivative. The third and fourth integrals give no contribution to the macroscale model as shown in appendix D. Applying Reynolds transport theorem to the final integral, we show in appendix D that the boundary integrals evaluate to zero, which leaves
$c_0$
in evaluating the average of the time derivative. The third and fourth integrals give no contribution to the macroscale model as shown in appendix D. Applying Reynolds transport theorem to the final integral, we show in appendix D that the boundary integrals evaluate to zero, which leaves
 \begin{equation} \overline {Pe}\, \phi _f \frac {\partial c_0}{\partial t} = - 2 \pi B \, \overline {Pe} \, Da + \unicode {x25BD} _{\textbf{x}} \cdot \int _{D_f} (I_2 - \unicode {x25BD} _{\textbf{X}} \boldsymbol {\Lambda }) \cdot \unicode {x25BD} _{\textbf{x}} c_0 dS_X +\phi _f \frac {\partial ^2 c_0}{\partial z^2}, \end{equation}
where we have used the fast-scale independence of $c_0$
to evaluate the integral around the string boundary. We introduce the effective diffusion tensor
$c_0$
to evaluate the integral around the string boundary. We introduce the effective diffusion tensor
 \begin{equation} \mathcal {D}_{m {m {eff}}} = \overline {Pe}^{-1}\begin{pmatrix} \langle I_2 - \unicode {x25BD} _{\textbf{X}} \boldsymbol {\Lambda }\rangle _{11} & \quad \langle I_2 - \unicode {x25BD} _{\textbf{X}} \boldsymbol {\Lambda }\rangle _{12} & \quad 0 \\ \langle I_2 - \unicode {x25BD} _{\textbf{X}} \boldsymbol {\Lambda }\rangle _{21} & \quad \langle I_2 - \unicode {x25BD} _{\textbf{X}} \boldsymbol {\Lambda }\rangle _{22} & \quad 0 \\ 0 & \quad 0 & \quad 1 \end{pmatrix}, \end{equation}
where $I_2 = {diag}(1, 1)$
and
$I_2 = {diag}(1, 1)$
and $\langle \cdot \rangle$
denotes the average of the enclosed quantity over the fluid region of the unit cell, defined as
$\langle \cdot \rangle$
denotes the average of the enclosed quantity over the fluid region of the unit cell, defined as
 \begin{equation} \langle g \rangle = \frac {1}{\phi _f} \int _{D_f} g dS_X. \end{equation}
Hence, we obtain the following homogenised problem:
 \begin{equation} \frac {\partial c_0}{\partial t} = \unicode {x25BD} \cdot (\mathcal {D}_{{eff}} \unicode {x25BD} c_0 ) - \alpha _{ {eff}}, \end{equation}
where the effective uptake coefficient is given by
 \begin{equation} \alpha _{ {eff}} = \frac {2 \pi B Da}{\phi _f}, \end{equation}
and we have written $\unicode {x25BD} = (\partial _x, \partial _y, \partial _z)$
. Thus, for
$\unicode {x25BD} = (\partial _x, \partial _y, \partial _z)$
. Thus, for $Pe = O(\delta )$
, we obtain a reaction-diffusion equation on the macroscale. The arrangement of the strings results in an anisotropic effective diffusion tensor (5.24), characterised by the solution to the cell problem (5.16)-(5.18), which we present in the next section.
$Pe = O(\delta )$
, we obtain a reaction-diffusion equation on the macroscale. The arrangement of the strings results in an anisotropic effective diffusion tensor (5.24), characterised by the solution to the cell problem (5.16)-(5.18), which we present in the next section.
5.1.1 Cell problem solution
In this section we describe the results of our numerical simulations of (5.16)–(5.18) which, when averaged, gives the effective diffusion tensor in the macroscale problem via (5.24)–(5.25). As the leading-order string displacement depends only on the slow scale, and periodic boundary conditions are imposed on the outer boundary of the unit cell, we can consider the string to be centred at the origin of fast scale coordinates without loss of generality. By considering the symmetries of (5.16)–(5.18) (see appendix E for details), we find that the effective diffusion tensor is diagonal, with form $\mathcal {D}_{ {eff}} = Pe^{-1} \text {diag}(D, D, 1)$
. We solve for
$\mathcal {D}_{ {eff}} = Pe^{-1} \text {diag}(D, D, 1)$
. We solve for $D$
by solving (5.16)–(5.18) using the finite element method using FEniCS [Reference Alnæs, Blechta, Hake, Johansson, Kehlet, Logg, Richardson, Ring, Rognes and Wells11]. The values of
$D$
by solving (5.16)–(5.18) using the finite element method using FEniCS [Reference Alnæs, Blechta, Hake, Johansson, Kehlet, Logg, Richardson, Ring, Rognes and Wells11]. The values of $D$
calculated by averaging the finite element solution are shown in figure 3, where they are compared with the analytical expression obtained by Rayleigh using the multipole approach [Reference Bruna and Chapman4, Reference Jóhannesson and Halle14, Reference Rayleigh27], namely
$D$
calculated by averaging the finite element solution are shown in figure 3, where they are compared with the analytical expression obtained by Rayleigh using the multipole approach [Reference Bruna and Chapman4, Reference Jóhannesson and Halle14, Reference Rayleigh27], namely
 \begin{equation} D = \frac {1}{1- \phi _s} \left ( 1 - \frac {2 \phi _s}{1+ \phi _s - 0.3058 \phi _s^4}\right ). \end{equation}
The cell problem (5.16)–(5.18) is identical to one case discussed in [Reference Bruna and Chapman4], where homogenised models of diffusion in spatially varying media were derived.
The effective diffusion coefficient decreases with increasing solid fraction. Finite element solutions calculated from the averaged gradient of the solution to (5.16)
–(5.18) are shown as purple dots and agree with Rayleigh’s analytical result [Reference Rayleigh27]. The leading-order asymptotic behaviour in the limit of small solid volume fraction $\phi _s$
is also shown.
$\phi _s$
is also shown.

We see in figure 3 that the components of the diffusion tensor characterising transport in the transverse plane are less than those for the axial direction; we have faster diffusive transport in the direction parallel to the string as expected given the anisotropy of the fluid-string composite. The presence of fibres acts to hinder diffusion in the transverse direction with a more marked effect at higher solid volume fractions. This result highlights the need to account for scaffold anisotropy when modelling solely diffusive transport within the bioreactor scaffold to avoid overestimation of the diffusive transport rate in the transverse direction.
5.1.2 Macroscale problem solution
In this section, we solve the macroscale diffusion-reaction problem given by (5.26) in the cylindrical domain shown in figure 2a. To reduce the number of independent parameters in the macroscale problem, we rescale time in (5.26), setting $t' = t/Pe$
, which gives
$t' = t/Pe$
, which gives
 \begin{equation} \frac {\partial c}{\partial t'} = D \unicode {x25BD} _{{\perp }}^2 c + \frac {\partial ^2 c}{\partial z^2} - Da_2, \end{equation}
where we have introduced the modified Damköhler number $Da_2$
, which characterises the relative importance of uptake and diffusive transport,
$Da_2$
, which characterises the relative importance of uptake and diffusive transport,
 \begin{equation} Da_2 = Pe \, \alpha _{ {eff}} = \frac {2 \pi B \overline {A} L }{\delta \phi _f D}. \end{equation}
Seeking separable solutions to (5.29) subject to the boundary conditions (4.3), (4.5) and (4.6), and the initial condition (4.7), we find
 \begin{equation} c = c_s + \sum _{m = 0}^\infty b_m \sin \left ( \left ( m + \frac {1}{2} \right ) \pi z \right ) \exp \left ({-}\left (m + \frac {1}{2}\right )^2 \pi ^2 t\right ), \end{equation}
where $b_m = 16 Da_2 / (\pi ^3(1+ 2m)^3)$
and
$b_m = 16 Da_2 / (\pi ^3(1+ 2m)^3)$
and $c_s$
is the concentration profile reached at steady state, that is
$c_s$
is the concentration profile reached at steady state, that is
 \begin{equation} c_s = 1 + \frac {Da_2 z(z - 2)}{2}. \end{equation}
Solutions to the macroscale diffusion-reaction equation (5.31).

The time evolution of (5.31) is plotted in figure 4a, where we see that the nutrient decays from an initially constant concentration to a steady state profile where the nutrient concentration decreases with increasing distance from the inlet. Increasing $Da_2$
decreases the nutrient available to cells near the outlet, as shown in figure 4b. For
$Da_2$
decreases the nutrient available to cells near the outlet, as shown in figure 4b. For $Pe = O(\delta )$
diffusive transport limits the distance along the chamber that the incoming nutrient can travel; at higher
$Pe = O(\delta )$
diffusive transport limits the distance along the chamber that the incoming nutrient can travel; at higher $Da_2$
, we increase the uptake for a fixed diffusive transport rate causing the decrease in the steady state nutrient concentration attained.
$Da_2$
, we increase the uptake for a fixed diffusive transport rate causing the decrease in the steady state nutrient concentration attained.
5.2. Uptake
In this section, we consider the regime where $Pe = O(\delta )$
and
$Pe = O(\delta )$
and $Da = O(1/\delta ),$
defining
$Da = O(1/\delta ),$
defining $\overline {Pe} = Pe / \delta = O(1)$
and
$\overline {Pe} = Pe / \delta = O(1)$
and $\widehat {Da} = \delta Da = O(1)$
. In this limit, the timescale characterising uptake,
$\widehat {Da} = \delta Da = O(1)$
. In this limit, the timescale characterising uptake, $t_u$
is much faster than the timescale characterising microscale advection
$t_u$
is much faster than the timescale characterising microscale advection $t_A$
, as
$t_A$
, as $t_u = t_A / Da$
. Thus, we introduce a fast timescale
$t_u = t_A / Da$
. Thus, we introduce a fast timescale $\tau ' = t/\delta$
which characterises the system dynamics (the timescale of uptake), as we expect the system will have reached a steady-state on the timescale of microscale advection used to nondimensionalise the problem in previous section. The governing equation in this regime can be obtained as a sublimit of the homogenised model developed in section 5.1. Considering the limit of (5.26) where
$\tau ' = t/\delta$
which characterises the system dynamics (the timescale of uptake), as we expect the system will have reached a steady-state on the timescale of microscale advection used to nondimensionalise the problem in previous section. The governing equation in this regime can be obtained as a sublimit of the homogenised model developed in section 5.1. Considering the limit of (5.26) where $\widehat {Da}$
and
$\widehat {Da}$
and $\tau '$
are order unity, we find
$\tau '$
are order unity, we find
 \begin{equation} \frac {\partial c_0}{\partial \tau '} = - \frac {2 \pi B \widehat {Da}}{\phi _f} \, . \end{equation}
Thus, for large uptake and small Péclet number, we have concentration which decays linearly in time. The nutrient is taken up by the cells before it can diffuse or advect on the macroscale. As discussed in the introduction, we anticipate (5.33) to hold when uptake per unit time is small compared with the initial concentration of nutrient in the cell media. As the nutrient uptake and the local concentration becomes comparable, we anticipate that the uptake rate will have a nonlinear dependence on concentration before transitioning to a linear dependence on the local concentration when the nutrient concentration becomes rate-limiting.
5.3. Advection-diffusion-reaction
In this section, we consider the macroscale problem that arises when advection balances diffusion on the macroscale, i.e. we have $Pe = O(1)$
. We rescale the Damköhler number to
$Pe = O(1)$
. We rescale the Damköhler number to $\overline {Da} = Da/\delta$
, which we assume is
$\overline {Da} = Da/\delta$
, which we assume is $O(1)$
to ensure that the reaction term features in the leading-order macroscale model. If the Damköhler number is not rescaled, uptake terms would appear at
$O(1)$
to ensure that the reaction term features in the leading-order macroscale model. If the Damköhler number is not rescaled, uptake terms would appear at $O(\delta )$
in the microscale problem. We consider nutrient transport when the flow is driven by a time harmonic motion of the string ends
$O(\delta )$
in the microscale problem. We consider nutrient transport when the flow is driven by a time harmonic motion of the string ends
 \begin{align} \textbf{s} &= {\textbf{a}}(x, y) \sin (\omega t) \quad \text {at} \quad z = 1, \end{align}
 \begin{align} \textbf{s} &= \boldsymbol {0} \qquad \qquad \text {at} \quad z = 0, \end{align}
and there is no pressure drop across the chamber and no flux through the sides. We will make use of the time-harmonic solutions to the resulting fluid problem found in [Reference Kent, Waters, Oliver and Chapman16].
5.3.1 Multiple timescales
In section 4, we nondimensionalised on the timescale of microscale advection $t_A = \delta L/U$
. As we assume
$t_A = \delta L/U$
. As we assume $Pe =O(1)$
in this section, macroscale advection and diffusion occur on a comparable timescale which we write as
$Pe =O(1)$
in this section, macroscale advection and diffusion occur on a comparable timescale which we write as $\tau = \delta t$
, i.e. a slow timescale. Henceforth, we assume these two timescales are independent, transforming time derivatives into multiple-scales form as follows
$\tau = \delta t$
, i.e. a slow timescale. Henceforth, we assume these two timescales are independent, transforming time derivatives into multiple-scales form as follows
 \begin{equation} \frac {\partial }{\partial t} \to \frac {\partial }{\partial t} + \delta \frac {\partial }{\partial \tau }, \end{equation}
introducing multiple-scales expansions in both space and time
 \begin{align} c &\sim c_0 (\textbf{x}, \textbf{X}, t, \tau ) + \delta c_1 (\textbf{x}, \textbf{X}, t, \tau ) + \cdots, \end{align}
 \begin{align} \textbf{s} &\sim \textbf{s}_0(\textbf{x}, t, \tau ) + \delta \textbf{s}_1 (\textbf{x}, \textbf{X}, t, \tau ) + \cdots, \end{align}
 \begin{align} \textbf{v} &\sim \textbf{v}_0 (\textbf{x}, \textbf{X}, t, \tau ) + \delta \textbf{v}_1 (\textbf{x}, \textbf{X}, t, \tau ) + \cdots, \end{align}
 \begin{align} w &\sim w_0 (\textbf{x}, \textbf{X}, t, \tau ) + \delta w_1 (\textbf{x}, \textbf{X}, t, \tau ) + \cdots . \end{align}
Motivated by the time-harmonic imposed displacements (5.34), we assume that the coefficients are periodic in the fast timescale with period $P = 2 \pi /\omega$
in addition to being periodic in the fast spatial scale.
$P = 2 \pi /\omega$
in addition to being periodic in the fast spatial scale.
5.3.2 No-slip for multiple spatio-temporal scales
Before deriving the homogenised problem, we consider the form of the no-slip condition on the string boundary when there are multiple-scales in both space and time. In the multiscale analysis of the fluid-string problem, the no-slip condition on fluid velocity is given by
 \begin{equation} \textbf{v} = \frac {\partial \textbf{s}}{\partial t} \quad \text {and} \quad w = 0 \quad \text {on} \quad \partial D_{s_0}. \end{equation}
Combining the expansion of spatial multiple-scales in (5.41) with multiple time scales given by (5.36), we find
 \begin{align*} \textbf{v}_0 + \delta \textbf{X} \cdot \unicode {x25BD} _{\textbf{x}} \textbf{v}_0 + & \delta (\textbf{s}_1 + \textbf{X}\cdot \unicode {x25BD} _{\textbf{x}} \textbf{s}_0) \cdot \unicode {x25BD} _{\textbf{X}} \textbf{v}_0 + \delta \textbf{v}_1 = \\ &\frac {\partial \textbf{s}_0}{\partial t} + \delta \frac {\partial \textbf{s}_0}{\partial \tau } +\delta \textbf{X}\cdot \unicode {x25BD} _{\textbf{x}} \left (\frac {\partial \textbf{s}_0}{\partial t} \right ) + \delta \frac {\partial \textbf{s}_1}{\partial t} + O(\delta ^2) \quad \text {on} \quad \partial D_{s_0}. \end{align*}
Thus, at leading order we have
 \begin{equation} \textbf{v}_0 = \frac {\partial \textbf{s}_0}{\partial t} \quad \text {on} \quad \partial D_{s_0}. \end{equation}
At next order, we find
 \begin{equation} \textbf{v}_1 = \frac {\partial \textbf{s}_0}{\partial \tau } + \frac {\partial \textbf{s}_1}{\partial t} - \textbf{d}_0 \cdot \unicode {x25BD} _{\textbf{X}} \textbf{v}_0 \quad \text {on} \quad \partial D_{s_0}, \end{equation}
where we have used $\textbf{s}_1 = - \textbf{X} \cdot \unicode {x25BD} _{\textbf{x}} \textbf{s}_0 + \textbf{d}_0$
. Repeating the process for the axial velocity, we obtain
$\textbf{s}_1 = - \textbf{X} \cdot \unicode {x25BD} _{\textbf{x}} \textbf{s}_0 + \textbf{d}_0$
. Repeating the process for the axial velocity, we obtain
 \begin{equation} w_0 = w_1 = 0 \quad \text {on} \quad \partial D_{s_0}. \end{equation}
5.3.3 Homogenisation
Writing the equation governing nutrient concentration (4.2) in multiple-scales form, we find
 \begin{equation} \delta \left ( \frac {\partial }{\partial t} + \delta \frac {\partial }{\partial \tau } \right ) c+ \delta \textbf{v} \cdot (\unicode {x25BD} _{\textbf{X}} + \delta \unicode {x25BD} _{\textbf{x}})c + \delta ^2 w \frac {\partial c}{\partial z} = \frac {1}{Pe} (\unicode {x25BD} _{\textbf{X}}^2 + 2\delta \unicode {x25BD} _{\textbf{x}} \cdot \unicode {x25BD} _{\textbf{X}} + \delta ^2 \unicode {x25BD} _{\textbf{x}}^2) c . \end{equation}
We substitute (5.37)–(5.40) into (5.45) and the uptake boundary condition (4.4) before comparing coefficients at each order of $\delta$
. At leading order, we find
$\delta$
. At leading order, we find
 \begin{align} \unicode {x25BD} _{\textbf{X}}^2 c_0 &= 0 \quad \text {in} \quad D_f, \end{align}
 \begin{align} {\hat {\textbf{n}}}_0 \cdot \unicode {x25BD} _{\textbf{X}} c_0 &= 0 \quad \text {on} \quad \partial D_{s_0}, \end{align}
with $c_0$
$c_0$ $\boldsymbol {1}$
-periodic in
$\boldsymbol {1}$
-periodic in $\textbf{X}$
. Hence, we have
$\textbf{X}$
. Hence, we have $c_0 = c_0(\textbf{x}, t, \tau )$
. At next order, we have
$c_0 = c_0(\textbf{x}, t, \tau )$
. At next order, we have
 \begin{align} \frac {\partial c_0}{\partial t} - \frac {1}{Pe} \unicode {x25BD} _{\textbf{X}}^2 c_1 &= 0 \quad \text {in} \quad D_f,\\[-5pt] \end{align}
 \begin{align} {\hat {\textbf{n}}}_0 \cdot (\unicode {x25BD} _{\textbf{X}} c_1 + \unicode {x25BD} _{\textbf{x}} c_0) &= 0 \quad \text {on} \quad \partial D_{s_0}, \end{align}
with $c_1$
$c_1$ $\boldsymbol {1}$
-periodic in
$\boldsymbol {1}$
-periodic in $\textbf{X}.$
Given the spatial fast-scale independence of
$\textbf{X}.$
Given the spatial fast-scale independence of $c_0$
, we can view (5.48)–(5.49) as Poisson’s equation with Neumann boundary conditions. The solvability condition is imposed by integrating (5.48) over the fluid domain, which gives
$c_0$
, we can view (5.48)–(5.49) as Poisson’s equation with Neumann boundary conditions. The solvability condition is imposed by integrating (5.48) over the fluid domain, which gives
 \begin{equation} \frac {\partial c_0}{\partial t} - \frac {1}{Pe \, \phi _f} \int _{\partial D_{s_0}} \unicode {x25BD} _{\textbf{x}} c_0 \cdot {\hat {\textbf{n}}}_0 dl_X = 0, \end{equation}
where we have used the divergence theorem and (5.49). Applying the divergence theorem again, we find the integral evaluates to zero and hence we find the leading-order concentration is independent of the fast timescale i.e. $c_0 = c_0(\textbf{x}, \tau )$
. In this limit, the microscale nutrient transport is dominated by diffusive processes characterised by the timescale
$c_0 = c_0(\textbf{x}, \tau )$
. In this limit, the microscale nutrient transport is dominated by diffusive processes characterised by the timescale $t = \delta ^2 L^2/D$
. As we nondimensionalised on the timescale of microscale advection, for
$t = \delta ^2 L^2/D$
. As we nondimensionalised on the timescale of microscale advection, for $Pe = O(1)$
, we have the timescale for microscale diffusion being relatively quick as
$Pe = O(1)$
, we have the timescale for microscale diffusion being relatively quick as $t_D/t_A = O(\delta )$
. Thus, the concentration equilibrates on this faster timescale, leaving a steady microscale problem. We write
$t_D/t_A = O(\delta )$
. Thus, the concentration equilibrates on this faster timescale, leaving a steady microscale problem. We write
 \begin{equation} c_1 = -\boldsymbol {\Lambda }\cdot \unicode {x25BD} _{\textbf{x}} c_0 + \overline {\lambda }, \end{equation}
where $\boldsymbol {\Lambda } = \boldsymbol {\Lambda }(\textbf{X})$
, and
$\boldsymbol {\Lambda } = \boldsymbol {\Lambda }(\textbf{X})$
, and $\overline {\lambda } = \overline {\lambda }(\textbf{x}, t, \tau )$
is a function of the slow scale and time, determined by the solution to a higher-order problem. Substituting (5.51) into (5.48)–(5.49), we obtain the same cell problem as for the diffusion-dominated limit, namely (5.16)–(5.18). At next order in the multiple-scales analysis, we find
$\overline {\lambda } = \overline {\lambda }(\textbf{x}, t, \tau )$
is a function of the slow scale and time, determined by the solution to a higher-order problem. Substituting (5.51) into (5.48)–(5.49), we obtain the same cell problem as for the diffusion-dominated limit, namely (5.16)–(5.18). At next order in the multiple-scales analysis, we find
 \begin{align} \frac {\partial c_1}{\partial t} &+ \frac {\partial c_0}{\partial \tau } + \textbf{v}_0 \cdot (\unicode {x25BD} _{\textbf{X}} c_1 + \unicode {x25BD} _{\textbf{x}} c_0) + w_0 \frac {\partial c_0}{\partial z} - \frac {1}{Pe} \unicode {x25BD} _{\textbf{X}} \cdot ( \unicode {x25BD} _{\textbf{X}} c_2 + \unicode {x25BD} _{\textbf{x}} c_1) \\ & \quad - \frac {1}{Pe} \unicode {x25BD} _{\textbf{x}} \cdot ( \unicode {x25BD} _{\textbf{X}} c_1 + \unicode {x25BD} _{\textbf{x}} c_0) - \frac {1}{Pe} \frac {\partial ^2 c_0}{\partial z^2}= 0 \quad \text {in} \quad D_f, \end{align}
subject to
 \begin{align} & {\hat {\textbf{n}}}_0 \cdot (\unicode {x25BD} _{\textbf{X}} c_2 + \unicode {x25BD} _{\textbf{x}} c_1) + {\hat {\textbf{n}}}_1 \cdot (\unicode {x25BD} _{\textbf{X}} c_1 + \unicode {x25BD} _{\textbf{x}} c_0) + {\hat {\textbf{n}}}_0 \cdot \left ( \textbf{X} \cdot \unicode {x25BD} _{\textbf{x}} (\unicode {x25BD} _{\textbf{X}} c_1 + \unicode {x25BD} _{\textbf{x}} c_0)\right ) \\& \quad + {\hat {\textbf{n}}}_0 \cdot \left ( \textbf{d}_0\cdot \unicode {x25BD} _{\textbf{X}} (\unicode {x25BD} _{\textbf{X}} c_1 + \unicode {x25BD} _{\textbf{x}} c_0)\right ) = \overline {Da} \, Pe \quad \text {on} \quad \partial D_{s_0}, \end{align}
with $c_2$
$c_2$ $\boldsymbol {1}$
-periodic in
$\boldsymbol {1}$
-periodic in $\textbf{X}.$
We can appeal to the multiple-scales expansion of fluid incompressibility at leading- and first-order, given by equations (2.8) and (2.15), to simplify the analysis, namely
$\textbf{X}.$
We can appeal to the multiple-scales expansion of fluid incompressibility at leading- and first-order, given by equations (2.8) and (2.15), to simplify the analysis, namely
 \begin{align} \textbf{v}_0 \cdot \unicode {x25BD} _{\textbf{X}} c_1 &= \unicode {x25BD} _{\textbf{X}} \cdot (\textbf{v}_0 c_1), \end{align}
 \begin{align} \textbf{v}_0 \cdot \unicode {x25BD} _{\textbf{x}} c_0 + w_0 \frac {\partial c_0}{\partial z} &= \unicode {x25BD} _{\textbf{x}} \cdot (c_0 \textbf{v}_0) - c_0 \unicode {x25BD} _{\textbf{x}} \cdot \textbf{v}_0 + \frac {\partial }{\partial z}(c_0 w_0) - c_0 \frac {\partial w_0}{\partial z} \\ &= \unicode {x25BD} _{\textbf{x}} \cdot (c_0 \textbf{v}_0) + \frac {\partial }{\partial z} (c_0 w_0)+ \unicode {x25BD} _{\textbf{X}} \cdot (c_0 \textbf{v}_1) . \end{align}
To group terms involving the fast and slow divergence, we substitute (5.54)–(5.55) into (5.52) which gives
 \begin{align} \frac {\partial c_1}{\partial t} & + \frac {\partial c_0}{\partial \tau } + \frac {\partial }{\partial z} (c_0 w_0) + \unicode {x25BD} _{\textbf{x}} \cdot \left ( \textbf{v}_0 c_0 - \frac {1}{Pe} (\unicode {x25BD} _{\textbf{X}} c_1 + \unicode {x25BD} _{\textbf{x}} c_0 ) \right ) \\[4pt]& \quad + \unicode {x25BD} _{\textbf{X}} \cdot \left (\textbf{v}_0 c_1 + \textbf{v}_1 c_0 - \frac {1}{Pe} (\unicode {x25BD} _{\textbf{X}} c_2 + \unicode {x25BD} _{\textbf{x}} c_1) \right ) - \frac {1}{Pe} \frac {\partial ^2 c_0}{\partial z^2}= 0 . \end{align}
The effective model is derived by integrating (5.56) over the unit cell and applying Reynolds transport theorem to the first two terms, which gives
 \begin{align} \frac {\partial \langle c_1 \rangle }{\partial t} & + \frac {1}{\phi _f} \int _{\partial D_{s_0}} c_1 \frac {\partial \textbf{s}_0}{\partial t} \cdot {\hat {\textbf{n}}} dl_X + \frac {\partial c_0}{\partial \tau } + \frac {1}{\phi _f} \int _{D_f} \frac {\partial }{\partial z} (c_0 w_0) dS_X \\[4pt]& + \frac {1}{\phi _f} \int _{D_f} \unicode {x25BD} _{\textbf{X}} \cdot \left (\textbf{v}_0 c_1 + \textbf{v}_1 c_0 - \frac {1}{Pe} (\unicode {x25BD} _{\textbf{X}} c_2 + \unicode {x25BD} _{\textbf{x}} c_1) \right )dS_X \\[4pt]& + \frac {1}{\phi _f}\int _{D_f} \unicode {x25BD} _{\textbf{x}} \cdot \left ( \textbf{v}_0 c_0 - \frac {1}{Pe} (\unicode {x25BD} _{\textbf{X}} c_1 + \unicode {x25BD} _{\textbf{x}} c_0 ) \right )dS_X - \frac {1}{Pe} \frac {\partial ^2 c_0}{\partial z^2} = 0, \end{align}
where we have used the $\textbf{X}$
independence of
$\textbf{X}$
independence of $c_0$
and
$c_0$
and $\textbf{s}_0$
in evaluating the boundary terms involving derivatives with respect to the slow timescale. We apply the divergence theorem, and substitute (5.53) into the fifth term to eliminate
$\textbf{s}_0$
in evaluating the boundary terms involving derivatives with respect to the slow timescale. We apply the divergence theorem, and substitute (5.53) into the fifth term to eliminate $c_2$
, use (D.2) and (D.4) to evaluate the terms involving
$c_2$
, use (D.2) and (D.4) to evaluate the terms involving $\textbf{d}_0$
and
$\textbf{d}_0$
and $\textbf{X}$
which result from application of the boundary condition, and use (5.42) to cancel terms involving the leading-order string velocity. We consider
$\textbf{X}$
which result from application of the boundary condition, and use (5.42) to cancel terms involving the leading-order string velocity. We consider
 \begin{equation} \begin{split} \int _{\partial D_{s_0}}c_0 \textbf{v}_1 \cdot {\hat {\textbf{n}}}_0 dl_X &= c_0 \int _{\partial D_{s_0}} \left ( \frac {\partial \textbf{s}_0}{\partial \tau } + \frac {\partial \textbf{s}_1}{\partial t} - \textbf{d}_0 \cdot \unicode {x25BD} _{\textbf{X}} \textbf{v}_0 \right ) \cdot {\hat {\textbf{n}}}_0 dl_X\\[5pt] &= c_0 \int _{\partial D_{s_0}} \frac {\partial \textbf{s}_1}{\partial t} \cdot {\hat {\textbf{n}}}_0 dl_X \\[5pt] & = -c_0 \int _{D_{s_0}} \unicode {x25BD} _{\textbf{x}} \cdot \left ( \frac {\partial \textbf{s}_0}{\partial t}\right ) dS_X, \end{split} \end{equation}
where we have used the fast-scale independence of $\textbf{s}_0$
and (5.43) in the first line, the leading-order fluid incompressibility in the second line and combined the divergence theorem with the trace of the first-order string equation in the final line. Both the incompressibility condition and the string equation hold in the multi-temporal scales analysis as they are unchanged with the introduction of two timescales. Returning to (5.57), we use (5.58) to eliminate
$\textbf{s}_0$
and (5.43) in the first line, the leading-order fluid incompressibility in the second line and combined the divergence theorem with the trace of the first-order string equation in the final line. Both the incompressibility condition and the string equation hold in the multi-temporal scales analysis as they are unchanged with the introduction of two timescales. Returning to (5.57), we use (5.58) to eliminate $\textbf{v}_1$
, (5.42) to eliminate
$\textbf{v}_1$
, (5.42) to eliminate $\textbf{v}_0$
and apply the Reynolds transport theorem to remove slow derivatives from inside the integrals, which gives
$\textbf{v}_0$
and apply the Reynolds transport theorem to remove slow derivatives from inside the integrals, which gives
 \begin{align} \frac {\partial \langle c_1 \rangle }{\partial t} &+ \frac {\partial c_0}{\partial \tau } + \frac {1}{\phi _f} \frac {\partial }{\partial z} \int _{D_f} c_0 w_0 dS_X + \frac {1}{\phi _f} c_0 \int _{ D_{s_0}} \unicode {x25BD} _{\textbf{x}} \cdot \left ( \frac {\partial \textbf{s}_0}{\partial t} \right ) dS_X \\[3pt] &- \frac {1}{Pe \, \phi _f}\int _{\partial D_{s_0}}\left ( \unicode {x25BD} _{\textbf{X}} c_1 + \unicode {x25BD} _{\textbf{x}} c_0 \right ) \cdot {\hat {\textbf{n}}}_1 dl_X + \frac {1}{\phi _f}\int _{\partial D_{s_0}} \overline {Da} \, dl_X\\[3pt] & + \frac {1}{\phi _f} \unicode {x25BD} _{\textbf{x}} \cdot \int _{D_f} \left ( \textbf{v}_0 c_0 - \frac {1}{Pe} (\unicode {x25BD} _{\textbf{X}} c_1 + \unicode {x25BD} _{\textbf{x}} c_0 ) \right )dS_X - \frac {1}{Pe} \frac {\partial ^2 c_0}{\partial z^2} \\[3pt] &+ \frac {1}{\phi _f} \int _{\partial D_{s_0}}\left ( c_0 \frac {\partial \textbf{s}_0}{\partial t} - \frac {1}{Pe} (\unicode {x25BD} _{\textbf{X}} c_1 + \unicode {x25BD} _{\textbf{x}} c_0 ) \right )\cdot (\unicode {x25BD} _{\textbf{x}} \textbf{s}_0) \cdot {\hat {\textbf{n}}}_0 dl_X = 0, \end{align}
The product of the leading-order string velocity and concentration integrates to zero around the string boundary as these variables depend only on the slow scale. Boundary terms from applying Reynolds transport theorem cancel with those from the normal correction using (D.5)–(D.7) which leaves
 \begin{align} \frac {\partial \langle c_1 \rangle }{\partial t} & + \frac {\partial c_0}{\partial \tau } + \frac {1}{\phi _f} \unicode {x25BD} \cdot \int _{D_f} c_0 \textbf{u}_0 dS_X +\frac {c_0}{\phi _f} \int _{D_{s_0}} \unicode {x25BD} _{\textbf{x}} \cdot \left ( \frac {\partial \textbf{s}_0}{\partial t}\right ) dS_X \\& + \frac {1}{\phi _f}\int _{\partial D_{s_0}} \overline {Da} \, dl_X - \frac {1}{Pe \, \phi _f} \unicode {x25BD} _{\textbf{x}} \cdot \int _{D_f} (\unicode {x25BD} _{\textbf{X}} c_1 + \unicode {x25BD} _{\textbf{x}} c_0 ) dS_X - \frac {1}{Pe} \frac {\partial ^2 c_0}{\partial z^2} = 0, \end{align}
where we have grouped the velocity components, using $\unicode {x25BD} = (\partial _x, \partial _y, \partial _z)$
. We substitute for
$\unicode {x25BD} = (\partial _x, \partial _y, \partial _z)$
. We substitute for $c_1$
in the volume integral, using (5.51), to obtain
$c_1$
in the volume integral, using (5.51), to obtain
 \begin{equation} \begin{split} \frac {\partial \langle c_1 \rangle }{\partial t} + \frac {\partial c_0}{\partial \tau } +\unicode {x25BD} \cdot (c_0 \langle \textbf{u}_0 \rangle ) + \frac {\phi _s}{\phi _f} \unicode {x25BD} _{\textbf{x}} \cdot \left ( \frac {\partial \textbf{s}_0}{\partial t}\right ) + \alpha _{ {eff}} - \unicode {x25BD} \cdot (\mathcal {D}_{ {eff}} \unicode {x25BD} c_0 ) = 0, \end{split} \end{equation}
where we have evaluated the remaining integrals, and have introduced the effective uptake
 \begin{equation} \alpha _{ { {eff}}} = \frac {2 \pi B \overline {Da}}{\phi _f}. \end{equation}
The effective diffusion coefficient $\mathcal {D}_{ { {eff}}}$
is given by (5.24). Again we note that
$\mathcal {D}_{ { {eff}}}$
is given by (5.24). Again we note that $\langle \textbf{u}_0 \rangle$
is the intrinsic (phase-averaged) velocity rather than the superficial (Darcy) velocity.
$\langle \textbf{u}_0 \rangle$
is the intrinsic (phase-averaged) velocity rather than the superficial (Darcy) velocity.
In (5.61) we have obtained an equation that depends on both the fast and slow timescale. Our aim is to derive an averaged equation which describes the diffusion and advection of the leading-order concentration over the whole scaffold. To achieve this, we must average over the period of fast oscillation as is typical in multiple scales problems. We define the average over the fast timescale as
 \begin{equation} \overline {g} = \frac {1}{P} \int _0^P g \, dt, \end{equation}
where $P = 2\pi /\omega$
is the period characterising the fast oscillation. Averaging (5.61) over the fast timescale, we obtain the homogenised problem
$P = 2\pi /\omega$
is the period characterising the fast oscillation. Averaging (5.61) over the fast timescale, we obtain the homogenised problem
 \begin{equation} \frac {\partial c_0}{\partial \tau } + \unicode {x25BD} \cdot ( c_0 \langle \overline {\textbf{u}_0}\rangle ) - \unicode {x25BD} \cdot (\mathcal {D}_{ {eff}}\unicode {x25BD} c_0) + \alpha _{ {eff}} = 0, \end{equation}
where we have used periodicity of the coefficients on the fast timescale. We have also used the time average of the homogenised incompressibility condition, which gives $\unicode {x25BD} \cdot \langle {\overline{\textbf{u}}}_0 \rangle = 0.$
Thus, on the macroscale, we find the nutrient concentration is governed by an advection-diffusion-reaction equation. The nutrient is advected with velocity
$\unicode {x25BD} \cdot \langle {\overline{\textbf{u}}}_0 \rangle = 0.$
Thus, on the macroscale, we find the nutrient concentration is governed by an advection-diffusion-reaction equation. The nutrient is advected with velocity $\langle \overline {\textbf{u}}_0 \rangle$
meaning that the time harmonic string motions do not cause advection of the nutrient across the whole domain, only local transport within a given unit cell.
$\langle \overline {\textbf{u}}_0 \rangle$
meaning that the time harmonic string motions do not cause advection of the nutrient across the whole domain, only local transport within a given unit cell.
5.3.4 Macroscale problem solution
In this section we obtain solutions to (5.64) in the cylindrical domain shown in figure 2a. We consider the flow resulting from a pressure drop imposed vertically across the cylinder.
Uniform pressure drop
Imposing a uniform pressure drop $p_{in}$
vertically across the cylinder with no fluid flux through the curved walls of the cylinder results in the flow field
$p_{in}$
vertically across the cylinder with no fluid flux through the curved walls of the cylinder results in the flow field $\langle {\overline{\textbf{u}}} _0\rangle = (0, 0, \kappa _3 p_{in})$
. We consider the same boundary and initial conditions on nutrient concentration as for the diffusion-reaction macroscale problem, i.e. (4.3) and (4.5)–(4.7). As in section 5.1.2, we rescale time to reduce the number of parameters in the final solution, introducing
$\langle {\overline{\textbf{u}}} _0\rangle = (0, 0, \kappa _3 p_{in})$
. We consider the same boundary and initial conditions on nutrient concentration as for the diffusion-reaction macroscale problem, i.e. (4.3) and (4.5)–(4.7). As in section 5.1.2, we rescale time to reduce the number of parameters in the final solution, introducing $\tau ' = \tau /Pe$
, which gives
$\tau ' = \tau /Pe$
, which gives
 \begin{equation} \frac {\partial c}{\partial \tau '} = - Da_2 + D \unicode {x25BD} ^2_{\perp } c + \frac {\partial ^2c}{\partial z^2} - v \frac {\partial c}{\partial z}, \end{equation}
where $Da_2$
is defined in (5.30) and
$Da_2$
is defined in (5.30) and $v = Pe \, \kappa _3 \, p_{in} .$
We can obtain a separable solution to (5.65) subject to (4.3) and (4.5)–(4.7) of the form
$v = Pe \, \kappa _3 \, p_{in} .$
We can obtain a separable solution to (5.65) subject to (4.3) and (4.5)–(4.7) of the form
 \begin{equation} c = c_e + \sum _{m = 0}^\infty b_m e^{u z/2} \sin (\lambda _m z) e^{-(\lambda _m^2 + v ^2/4 )\tau '}, \end{equation}
where $c_e$
is the steady solution,
$c_e$
is the steady solution,
 \begin{equation} c_e = 1 + \frac {Da_2}{v } \left ( e^{v (z -1)} - e^{- v } - z v \right ), \end{equation}
and $\lambda _m$
are the ordered positive solutions of
$\lambda _m$
are the ordered positive solutions of
 \begin{equation} \tan (\lambda _m) = - \frac {2 \lambda _m}{u }. \end{equation}
The expansion coefficients $b_m$
are fixed by imposing the initial condition, which gives
$b_m$
are fixed by imposing the initial condition, which gives
 \begin{equation} b_m = - \frac { Da_2 \int _0^1 (e^{v (z-1)} - e^{-v } - v z)e^{- v z/2} \sin (\lambda _m z) dz}{v \int _0^1 \sin ^2(\lambda _m z) dz}. \end{equation}
The variation of the steady solution with $v$
and
$v$
and $Da_2$
is shown in figure 5. The steady state profile for the advection-diffusion-reaction equation with no radial variation induced by the boundary conditions is set by these two parameters. Increasing
$Da_2$
is shown in figure 5. The steady state profile for the advection-diffusion-reaction equation with no radial variation induced by the boundary conditions is set by these two parameters. Increasing $v$
, which may be achieved by increasing the inlet pressure, results in an increased steady state concentration, expected given this would increase the velocity of the inlet media thereby increasing the delivery rate of nutrients. Increasing
$v$
, which may be achieved by increasing the inlet pressure, results in an increased steady state concentration, expected given this would increase the velocity of the inlet media thereby increasing the delivery rate of nutrients. Increasing $Da_2$
, for example due to increased nutrient consumption rate results in a decreased steady nutrient profile.
$Da_2$
, for example due to increased nutrient consumption rate results in a decreased steady nutrient profile.
Steady solutions to the macroscale advection-diffusion-reaction equation (5.65), where flow is driven by an imposed pressure drop.

We note that, for time-independent flow fields such as that considered in this section, the multiple timescale analysis given in section 5.3.1 was unnecessary; we could have arrived at the required homogenised model by simply rescaling the timescale to that of interest. However, we presented the full development to illustrate the effects of an imposed time-harmonic string motion on nutrient transport.
5.4. Advection-reaction
We can identify the governing equations in the limit of strong advection by considering a sub-limit of (5.64). Taking the limit $Pe \to \infty$
in (5.64), we obtain
$Pe \to \infty$
in (5.64), we obtain
 \begin{equation} \frac {\partial c_0}{\partial \tau } + \unicode {x25BD} \cdot ( c_0 \langle \overline {\textbf{u}_0}\rangle ) + \alpha _{ {eff}} = 0. \end{equation}
Thus, we obtain an advection-reaction equation when we have $Da = O(\delta )$
and
$Da = O(\delta )$
and $Pe$
larger than
$Pe$
larger than $O(1)$
. We no longer require the solution to the microscale steady diffusion problem to obtain the form of the effective diffusion coefficient; in this regime we need only solve for/specify the fluid velocity and solve (5.70) for the nutrient distribution.
$O(1)$
. We no longer require the solution to the microscale steady diffusion problem to obtain the form of the effective diffusion coefficient; in this regime we need only solve for/specify the fluid velocity and solve (5.70) for the nutrient distribution.
5.4.1 Macroscale problem solution
We consider solutions to (5.70) in a cylinder of radius $1/2$
and length
$1/2$
and length $1$
as shown in figure 2, with fluid flow driven by an axial pressure drop. Imposing an axial pressure drop
$1$
as shown in figure 2, with fluid flow driven by an axial pressure drop. Imposing an axial pressure drop $p_{in}$
results in the flow field
$p_{in}$
results in the flow field $\langle \overline {\textbf{u}} \rangle = (0, 0, \kappa _3 p_{in})$
. For this flow, (5.70) reduces to the following partial differential equation
$\langle \overline {\textbf{u}} \rangle = (0, 0, \kappa _3 p_{in})$
. For this flow, (5.70) reduces to the following partial differential equation
 \begin{equation} \frac {\partial c}{\partial \tau } + \kappa _3 p_{in} \frac {\partial c}{\partial z} = - \alpha _{ {eff}} . \end{equation}
We suppose the initial concentration and the concentration at the inlet are known,
 \begin{align} c &= 1 \quad \text {on} \quad z = 0, \end{align}
 \begin{align} c&= 1 \quad \text {at}\quad t = 0, \end{align}
which provides the necessary initial data for the problem. We use the method of characteristics to obtain
 \begin{equation} c = \left\{\begin{array}{l@{\quad}l} 1 -\alpha _{ {eff}} \tau, & z - \kappa _3 p_{in} \tau \gt 0 \\[6pt] 1 - \dfrac {\alpha _{ {eff}} z}{\kappa _3 p_{in}}, & z - \kappa _3 p_{in} \tau \lt 0. \end{array}\right. \end{equation}
Time-evolution of the solution to the advection-reaction equation (5.74). The solution is plotted for $\kappa _3 = 0.1, \, \alpha _{eff} = 0.1,$
and
$\kappa _3 = 0.1, \, \alpha _{eff} = 0.1,$
and $p_{in} = 1.$
The dashed line is
$p_{in} = 1.$
The dashed line is $z = \kappa _3\, p_{in} \tau$
.
$z = \kappa _3\, p_{in} \tau$
.

As for the diffusion-reaction and advection-diffusion-reaction regimes, the rate of decay of nutrient concentration as we move away from the inlet increases with increasing absorption rate. Like the diffusion-advection-reaction case, we find that increasing the pressure drop, which in turn causes higher flow rates, results in a higher concentration at the outlet as there is a higher amount of nutrient supplied to the chamber. An example is plotted in figure 6 which shows that regions of nutrient deficiency can occur if the inlet supply of nutrient is insufficient to counterbalance nutrient uptake. Considering the solution (5.74) gives a condition for the concentration in the chamber to remain non-zero for all times, namely $\kappa _3 p_{in} \gt \alpha _{eff}$
. Throughout this paper, we have assumed that cells uptake nutrient at a constant rate. This assumption is valid in the limit where the concentration is much greater than the Michaelis constant; at lower the concentrations the uptake rate will have a nonlinear dependence on concentration and become proportional to the local concentration in the low nutrient limit. The transition to the different form of uptake terms ensures that the concentration never becomes negative.
$\kappa _3 p_{in} \gt \alpha _{eff}$
. Throughout this paper, we have assumed that cells uptake nutrient at a constant rate. This assumption is valid in the limit where the concentration is much greater than the Michaelis constant; at lower the concentrations the uptake rate will have a nonlinear dependence on concentration and become proportional to the local concentration in the low nutrient limit. The transition to the different form of uptake terms ensures that the concentration never becomes negative.
6. Discussion
In this paper, we have derived homogenised models governing nutrient transport in a fibrous bioreactor scaffold. The scaffold was modelled as an ensemble of aligned strings which deform in response to the surrounding viscous flow. The homogenised model was obtained for various parameter regimes as summarised in table 2, the macroscale models being diffusion-reaction, uptake, advection-diffusion-reaction and advection-reaction. The macroscale model obtained was determined by the scale of the Péclet number and Damköhler number relative to the separation of lengthscales of the scaffold. If the Damköhler number is an order smaller than that presented in table 2, uptake will no longer feature in the leading-order macroscale problem. If the Damköhler number is an order of magnitude larger, it will be promoted to the lower order microscale problem. In this case, it becomes difficult to obtain an effective model using homogenisation alone, and additional techniques such as matched asymptotics may be required to obtain a reduced model of transport. In each case, solutions to the macroscale problem were presented for a cylindrical geometry to illustrate the role of parameters in setting the form of the steady state concentration profile.
For the diffusion-dominated regime, with boundary and initial conditions independent of the transverse coordinates, we find that a single Damköhler number characterises the steady state nutrient profile. A sublimit of this model gives the uptake model, where concentrations are uniform in space and decay in time at a rate proportional to the uptake rate. For the advection-diffusion-reaction macroscale model, the steady state behaviour is set by two parameters when the boundary and initial conditions and flow are spatially independent: one parameter $v$
gives the relative strength of advection and the second, a Damköhler number, gives the relative strength of uptake to diffusion modulated by geometrical factors which are given by the microscale solutions. The final advection-reaction regime we consider can be obtained by the sub-limit of the advection-diffusion-reaction model.
$v$
gives the relative strength of advection and the second, a Damköhler number, gives the relative strength of uptake to diffusion modulated by geometrical factors which are given by the microscale solutions. The final advection-reaction regime we consider can be obtained by the sub-limit of the advection-diffusion-reaction model.
One limit we have not considered which might be important technologically is that of strong periodic advection, i.e. advection dominates diffusion but $\langle \overline {\textbf{u}_0} \rangle = {\textbf{0}}$
. In this case there is no macroscale advection but diffusion will be enhanced by dispersion.
$\langle \overline {\textbf{u}_0} \rangle = {\textbf{0}}$
. In this case there is no macroscale advection but diffusion will be enhanced by dispersion.
We have extended the multiple scales analysis of different regimes presented in [Reference Auriault and Adler1] to a deformable porous medium. Accounting for scaffold deformation complicates the analysis as the slow variation in the microscale geometry must be accounted for, here using a level set function. Due to the multiple scales expansion of the string boundary position, additional terms arise in the uptake condition due to the expansion of the boundary position.
The effective models we have presented form the foundation for modelling nutrient transport in the fibrous bioreactor scaffold. Given the bioreactor length scale, perfusion velocity, nutrient diffusion coefficient and uptake rate, the relevant effective model can be identified. It may be desirable to tune experimental operating parameters so that advection dominates and uptake is subdominant, so that nutrient is delivered to cells in the scaffold at the same concentration as inlet media. Coupled with the solution to the flow problem (2.20)–(2.23), areas within the scaffold which do not receive sufficient nutrient due to lack of perfusion locally can then be identified. Obtaining solutions to the macroscale model in a geometry more relevant to the humanoid bioreactor scaffold shown in figure 1 will form future work. In particular, coupling the macroscale to an outer membrane and considering more realistic inlet conditions will provide insight into spatial distributions of nutrient within the bioreactor chamber. Within this work, the radius of all strings was assumed constant across the whole domain. In this modelling framework, a macroscale change in string radius could be modelled following [Reference Dalwadi10], by introducing macroscale dependence in the radius in equation (5.6). If the string radius varied across the scaffold, this would introduce spatial dependence into the diffusion coefficient and permeability, necessitating knowledge of the microscale problem for different string radii [Reference Dalwadi10]. A further simplifying assumption used in this paper is that the string deformation is purely transverse. Leading order axial string deformation can be included to model a broader range of imposed deformations, which will result in a different macroscopic force balance as outlined in appendix B.
Throughout this paper, we have neglected cell growth, limiting the model applicability to the early stages of bioreactor operation when the volume occupied by cells is much less than the volume of the scaffold fibres. One approach that accounts for cell growth is to model surface growth at the string boundary, with a rate of accretion related to the local nutrient concentration as in [Reference O’Dea, Nelson, El Haj, Waters and Byrne23]. Assuming the growth of porous media was proportional to the local concentration, it was found that a first order uptake featured in the leading order equations governing fluid flow [Reference O’Dea, Nelson, El Haj, Waters and Byrne23]. It would be interesting to explore how growth would interact with string deformation in the macroscale governing equations. One approach that could be considered is a growing porous layer on the surface of each strings, although this approach would break down when cells proliferate to confluence. Homogenisation approaches have previously been applied to blocking filters [Reference Dalwadi, Bruna and Griffiths9]; an extension of previous work which considers a growing poroelastic material could be explored to model the latter phases of bioreactor operation. The modelling techniques presented could also be extended and applied to other systems. For example, replacing the strings model with a beam could enable modelling of fibre beds, with applications such as transport across the microvilli which are known to be coupled with their flow-dependent deformation [Reference Weinbaum, Duan, Satlin, Wang and Weinstein34].
Acknowledgements
The authors thank Pierre-Alexis Mouthuy and Nicole Dvorak (NDORMS, University of Oxford) whose experimental work provided motivation for the models developed.
Funding statement
A.K. acknowledges financial support from the BBSRC under grant BB/M011224/1.
Competing interests
The author(s) declare none.
Appendix A. Variables and parameters in the fluid-structure problem
Definition of variables in the fluid-structure problem. Carets denote nondimensional quantities

List of parameters

Experimental parameters

Appendix B. Details of the string force balance
In this appendix, we provide further details on the assumptions that lead to the string force balance, equation (2.3). A completely systematic treatment would involve a full geometrically-nonlinear elasticity model in the strings, coupling displacement and tractions on the fluid/solid interface. However, this seems unnecessarily complicated—the wave equation for thin elastic strings is much easier to derive from first principles than from three-dimensional geometrically-nonlinear elasticity. Note that a linear elasticity model in the strings (as would be usual in deriving poroelasticity for example) would not allow $O(\delta )$
displacements of the centrelines. Thus, we adopt the following approach. We treat the strings as standard thin elastic strings, but with a body force generated by the fluid interaction. For this last component the finite thickness of the string is crucial; we evaluate it as the integral of the fluid stress around the string circumference.
$O(\delta )$
displacements of the centrelines. Thus, we adopt the following approach. We treat the strings as standard thin elastic strings, but with a body force generated by the fluid interaction. For this last component the finite thickness of the string is crucial; we evaluate it as the integral of the fluid stress around the string circumference.
We adopt a similar approach to that used in [2], first defining the string kinematics before performing a force balance and posing the constitutive law to relate the mechanics to the string deformation. We consider $N$
strings, each with reference configuration aligned with the
$N$
strings, each with reference configuration aligned with the $z$
-axis, such that the centreline of the
$z$
-axis, such that the centreline of the $i$
th string has (unstretched) reference configuration
$i$
th string has (unstretched) reference configuration $\textbf{x}_0^i = \textbf{x}_0^i + Z{\hat {\textbf{e}}}_z$
for
$\textbf{x}_0^i = \textbf{x}_0^i + Z{\hat {\textbf{e}}}_z$
for $0\leqslant Z \leqslant L-\Delta L$
where the string is of length
$0\leqslant Z \leqslant L-\Delta L$
where the string is of length $L - \Delta L$
and the points
$L - \Delta L$
and the points $\textbf{x}_0^i = (x^i_0, y^i_0, 0)$
lie on a square periodic lattice. We then uniformly stretch (i.e. pre-tension) the strings to be of length
$\textbf{x}_0^i = (x^i_0, y^i_0, 0)$
lie on a square periodic lattice. We then uniformly stretch (i.e. pre-tension) the strings to be of length $L$
, so that the stretched initial state is
$L$
, so that the stretched initial state is
 \begin{equation} \textbf{r} = \textbf{x}_0 + \frac {L}{L-\Delta L} Z {\hat {\textbf{e}}}, \qquad 0\lt Z\lt L-\Delta L. \end{equation}
We then reparametrise to use current vertical position rather than initial vertical position to parametrise the centreline, so that when displaced a distance $\textbf{s} = (s_1,s_2,s_3)$
the centerline is described by
$\textbf{s} = (s_1,s_2,s_3)$
the centerline is described by
 \begin{equation} \textbf{r} = \textbf{x}_0 + z {\hat {\textbf{e}}} + \textbf{s}(z), \qquad 0\lt z\lt L, \end{equation}
where $z$
and
$z$
and $Z$
are related by
$Z$
are related by
 \begin{equation*} z = \frac {L}{L-\Delta L} Z.\end{equation*}
Neglecting string inertia, we now balance forces on a segment $\Delta z$
of the string,
$\Delta z$
of the string,
 \begin{equation} \textbf{N}^i(z+ \Delta z) - \textbf{N}^i(z) + \textbf{f}^i(z) \Delta z = \boldsymbol {0}, \end{equation}
where $\textbf{N}$
is contact force and
$\textbf{N}$
is contact force and $\textbf{f}^i$
is the body force on the string per unit length. As
$\textbf{f}^i$
is the body force on the string per unit length. As $\Delta z\rightarrow 0$
, we obtain
$\Delta z\rightarrow 0$
, we obtain
 \begin{equation} \frac {\partial \textbf{N}^i}{\partial z} + \textbf{f}^i = \boldsymbol {0}. \end{equation}
Assuming $|\frac {\partial \textbf{s}}{\partial {z}}|\ll 1$
, the body force is given by
$|\frac {\partial \textbf{s}}{\partial {z}}|\ll 1$
, the body force is given by
 \begin{equation} \textbf{f} = \int _{\partial D} {\sigma }\cdot \textbf{n} \, d l, \end{equation}
where
 \begin{equation*} \sigma = - p I + \mu (\unicode {x25BD} \textbf{u} + (\unicode {x25BD} \textbf{u})^\top )\end{equation*}
is the fluid stress tensor. With no bending moments
 \begin{equation} \textbf{N} = T \boldsymbol {\tau }, \end{equation}
where the tangent
 \begin{equation} \boldsymbol {\tau } = \frac {\partial \textbf{r}}{\partial {z}}\Big / \left |\frac {\partial \textbf{r}}{\partial {z}}\right |. \end{equation}
We suppose that tension is proportional to stretch, so that
 \begin{eqnarray*} T &=& \alpha \left (\left |\frac {\partial {\textbf{r}}}{\partial {Z}} \right |-1\right ) = \alpha \left | \frac {\partial \textbf{r}}{\partial {z}} \right |\left | \frac {\partial {z}}{\partial {Z}}\right | -\alpha \\ & = & \frac {\alpha L}{L - \Delta L} \left [\left (1 + \frac {\partial {s_3}}{\partial {z}}\right )^2 + \left (\left (\frac {\partial {s_1}}{\partial {z}}\right )^2+\left (\frac {\partial {s_2}}{\partial {z}}\right )^2\right ) \right ]^{1/2}-\alpha . \end{eqnarray*}
Assuming $|\frac {\partial \textbf{s}}{\partial {z}}|\ll 1$
,
$|\frac {\partial \textbf{s}}{\partial {z}}|\ll 1$
,
 \begin{eqnarray*} T &=& \frac {\alpha L}{L - \Delta L} \left ( 1 + \frac {\partial {s_3}}{\partial {z}} + \frac {1}{2} \left (\left (\frac {\partial {s_1}}{\partial {z}}\right )^2+\left (\frac {\partial {s_2}}{\partial {z}}\right )^2\right ) + \cdots \right )-\alpha \\ &=& \frac {\alpha L}{L - \Delta L} \left ( \frac {\Delta L}{L} + \frac {\partial {s_3}}{\partial {z}} + \frac {1}{2} \left (\left (\frac {\partial {s_1}}{\partial {z}}\right )^2+\left (\frac {\partial {s_2}}{\partial {z}}\right )^2\right ) + \cdots \right ) . \end{eqnarray*}
We suppose the pre-tension dominates any subsequently generated tension so that
 \begin{equation*} \frac {\partial {s_3}}{\partial {z}} \ll \frac {\Delta L}{L}, \qquad \left (\frac {\partial {s_1}}{\partial {z}}\right )^2+\left (\frac {\partial {s_2}}{\partial {z}}\right )^2 \ll \frac {\Delta L}{L}.\end{equation*}
and the tension is approximately constant. Now
 \begin{eqnarray*} \boldsymbol {\tau } &=&{\hat {\textbf{e}}} + \frac {\partial \textbf{s}_{\boldsymbol{\perp}}}{\partial {z}} + O(|\textbf{s}|^2), \end{eqnarray*}
where $\textbf{s}_{\boldsymbol{\perp}} = (s_1,s_2,0)$
. Thus,
$\textbf{s}_{\boldsymbol{\perp}} = (s_1,s_2,0)$
. Thus,
 \begin{equation*} \frac {\partial \textbf{N}}{\partial {z}} = T_0\frac {\partial ^2 \textbf{s}_{\boldsymbol{\perp}}}{\partial {z}^2} + T_0 \frac {L}{\Delta L} \frac {\partial ^2 {s_3}}{\partial {z}^2}{\hat {\textbf{e}}} + O(|\textbf{s}|^2),\end{equation*}
where
 \begin{equation*} T_0 = \frac {\alpha \Delta L}{L - \Delta L},\end{equation*}
is the initial tension. Thus, the force balance is
 \begin{eqnarray*} T_0\frac {\partial ^2 \textbf{s}_{\boldsymbol{\perp}}}{\partial {z}^2} + T_0 \frac {L}{\Delta L} \frac {\partial ^2 {s_3}}{\partial {z}^2}{\hat {\textbf{e}}} & = & \int _{\partial D} \sigma \cdot \textbf{n}\, \mathrm {d} l +O(|\textbf{s}|^2). \end{eqnarray*}
Equating in-plane and out-of-plane components gives
 \begin{eqnarray*} T_0\frac {\partial ^2 \textbf{s}_{\boldsymbol{\perp}}}{\partial {z}^2} & = & \int _{\partial D} \sigma _\perp \cdot \textbf{n}\, \mathrm {d} l +O(|\textbf{s}|^2),\\ T_0 \frac {L}{\Delta L} \frac {\partial ^2 {s_3}}{\partial {z}^2} & = & \int _{\partial D} \sigma _\parallel \cdot \textbf{n}\, \mathrm {d} l +O(|\textbf{s}|^2), \end{eqnarray*}
where $\sigma _\perp$
and
$\sigma _\perp$
and $\sigma _\parallel$
are the in-plane and out-of-plane components of the stress tensor. Nondimensionalising by setting
$\sigma _\parallel$
are the in-plane and out-of-plane components of the stress tensor. Nondimensionalising by setting
 \begin{equation*} \textbf{s} = \delta L \hat {\textbf{s}}, \qquad \textbf{x} = L \hat {\textbf{x}}, \qquad \textbf{u} = U \hat {\textbf{u}}, \qquad p = \frac {\mu U}{\delta ^2 L} \hat {p}, \qquad \sigma = \frac {\mu U}{L} \hat {\sigma }, \end{equation*}
as in the main text gives, dropping the hats,
 \begin{equation*} \sigma = - \frac {p}{\delta ^2} I + \unicode {x25BD} \textbf{u} + (\unicode {x25BD} \textbf{u})^\top, \end{equation*}
and
 \begin{eqnarray*} \frac {\partial ^2 \textbf{s}_{\boldsymbol{\perp}}}{\partial {z}^2} & = & \frac {\mu L U}{\delta T_0}\int _{\partial D} \sigma _\perp \cdot \textbf{n}\, \mathrm {d} l +O(\delta ^2),\\ \frac {\partial ^2 {s_3}}{\partial {z}^2} & = & \frac {\Delta L}{L} \frac { \mu L U}{\delta T_0} \int _{\partial D} \sigma _\parallel \cdot \textbf{n}\, \mathrm {d} l +O(\delta ^2). \end{eqnarray*}
The force balance $\unicode {x25BD} \cdot \sigma = 0$
gives (2.1), while choosing the velocity scale as
$\unicode {x25BD} \cdot \sigma = 0$
gives (2.1), while choosing the velocity scale as
 \begin{equation*} U = \frac {\delta T_0}{\mu L}\end{equation*}
gives
 \begin{eqnarray} \frac {\partial ^2 \textbf{s}_{\boldsymbol{\perp}}}{\partial {z}^2} & = & \int _{\partial D} \sigma _\perp \cdot \textbf{n}\, \mathrm {d} l +O(\delta ^2), \end{eqnarray}
 \begin{eqnarray} \frac {\partial ^2 {s_3}}{\partial {z}^2} & = & \frac {\Delta L}{L} \int _{\partial D} \sigma _\parallel \cdot \textbf{n}\, \mathrm {d} l +O(\delta ^2). \end{eqnarray}
We suppose that $\Delta L \ll L$
so that we can neglect
$\Delta L \ll L$
so that we can neglect $s_3$
, and need only worry about the lateral force balance (B.8).
$s_3$
, and need only worry about the lateral force balance (B.8).
Appendix C. Uptake condition
In this appendix, we write the uptake boundary condition (4.4) in multiple scales form. We transform spatial derivatives using (5.4) and expand the normal using (5.7). We expand onto the leading-order position of the string boundary $({\hat {\textbf{x}}}, \textbf{X}^b + \textbf{s}_0)$
as follows
$({\hat {\textbf{x}}}, \textbf{X}^b + \textbf{s}_0)$
as follows
 \begin{align} c({\hat {\textbf{x}}} & + \delta \textbf{X}, \textbf{X}^b + \textbf{s}_0({\hat {\textbf{x}}} + \delta \textbf{X} ) + \delta \textbf{s}_1 ({\hat {\textbf{x}}} + \delta \textbf{X}, \textbf{X} ) + \delta ^2 \textbf{s}_2 ({\hat {\textbf{x}}} + \delta \textbf{X}, \textbf{X} ) +\ldots . ) \\& = c({\hat {\textbf{x}}} + \delta \textbf{X}, \textbf{X}^b + \textbf{s}_0 + \delta (\textbf{s}_1 + \textbf{X}\cdot \unicode {x25BD} _{\textbf{x}} \textbf{s}_0 ) + \delta ^2 (\textbf{s}_2 + \textbf{X}\cdot \unicode {x25BD} _{\textbf{x}} \textbf{s}_1 + \textbf{X}\cdot \unicode {x25BD} _{\textbf{x}} \unicode {x25BD} _{\textbf{x}} \textbf{s}_0 \cdot \textbf{X} ) )\\ & = c + \delta \left [\textbf{X}\cdot \unicode {x25BD} _{\textbf{x}} c + (\textbf{s}_1 + \textbf{X} \cdot \unicode {x25BD} _{\textbf{x}} \textbf{s}_0) \cdot \unicode {x25BD} _{\textbf{X}} c \right ] +\delta ^2 [ \textbf{X} \cdot \unicode {x25BD} _{\textbf{x}} \unicode {x25BD} _{\textbf{x}} c \cdot \textbf{X} + \ldots \\ & \quad + (\textbf{s}_1 + \textbf{X} \cdot \unicode {x25BD} _{\textbf{x}} \textbf{s}_0) \cdot \unicode {x25BD} _{\textbf{X}} \unicode {x25BD} _{\textbf{X}} c \cdot (\textbf{s}_1 + \textbf{X} \cdot \unicode {x25BD} _{\textbf{x}} \textbf{s}_0) + \ldots \\ & \quad + (\textbf{s}_2 + \textbf{X}\cdot \unicode {x25BD} _{\textbf{x}} \textbf{s}_1 + \textbf{X} \cdot \unicode {x25BD} _{\textbf{x}} \unicode {x25BD} _{\textbf{x}} \textbf{s}_0 \cdot \textbf{X})\cdot \unicode {x25BD} _{\textbf{X}} c ] + O(\delta ^3). \end{align}
Substituting the multiple scales expansion (5.3), and performing the expansion (C.1) for all terms, we find
 <![CDATA[\begin{align} & \frac {1}{Pe} {\hat {\textbf{n}}}_0 \cdot \unicode {x25BD} _{\textbf{X}} c_0 + \delta \frac {1}{Pe} {\hat {\textbf{n}}}_0 \cdot [ \textbf{X} \cdot \unicode {x25BD} _{\textbf{x}} \unicode {x25BD} _{\textbf{X}} c_0 +(\textbf{s}_1 + \textbf{X} \cdot \unicode {x25BD} _{\textbf{x}} \textbf{s}_0 ) \cdot \unicode {x25BD} _{\textbf{X}} \unicode {x25BD} _{\textbf{X}} c_0 + \unicode {x25BD} _{\textbf{X}} c_1 + \unicode {x25BD} _{\textbf{x}} c_0] \\& \quad + \delta \frac {1}{Pe} {\hat {\textbf{n}}}_1 \cdot \unicode {x25BD} _{\textbf{X}} c_0 + \delta ^2 \frac {1}{Pe} {\hat {\textbf{n}}}_0 \cdot [ \textbf{X} \cdot \unicode {x25BD} _{\textbf{x}} \unicode {x25BD} _{\textbf{x}} \unicode {x25BD} _{\textbf{X}} c_0 \cdot \textbf{X} +\ldots \\& \quad + (\textbf{s}_1 + \textbf{X} \cdot \unicode {x25BD} _{\textbf{x}} \textbf{s}_0) \cdot \unicode {x25BD} _{\textbf{X}} \unicode {x25BD} _{\textbf{X}} \unicode {x25BD} _{\textbf{X}} c_0 \cdot (\textbf{s}_1 + \textbf{X} \cdot \unicode {x25BD} _{\textbf{x}} \textbf{s}_0) +\ldots \\& \quad +(\textbf{s}_2 + \textbf{X} \cdot \unicode {x25BD} _{\textbf{x}} \textbf{s}_1 + \textbf{X} \cdot \unicode {x25BD} _{\textbf{x}} \unicode {x25BD} _{\textbf{x}} \textbf{s}_0 \cdot \textbf{X})\cdot \unicode {x25BD} _{\textbf{X}} \unicode {x25BD} _{\textbf{X}} c_0 + \textbf{X} \cdot \unicode {x25BD} _{\textbf{x}} (\unicode {x25BD} _{\textbf{X}} c_1 + \unicode {x25BD} _{\textbf{x}} c_0 ) + \ldots \\& \quad + (\textbf{s}_1 + \textbf{X} \cdot \unicode {x25BD} _{\textbf{x}} \textbf{s}_0) \cdot \unicode {x25BD} _{\textbf{X}}(\unicode {x25BD} _{\textbf{X}} c_1 + \unicode {x25BD} _{\textbf{x}} c_0) + \unicode {x25BD} _{\textbf{X}} c_2 + \unicode {x25BD} _{\textbf{x}} c_1 ] +\ldots \\& \quad + \delta ^2 \frac {1}{Pe} {\hat {\textbf{n}}}_1 \cdot [\textbf{X} \cdot \unicode {x25BD} _{\textbf{x}} \unicode {x25BD} _{\textbf{X}} c_0 + (\textbf{s}_1 + \textbf{X} \cdot \unicode {x25BD} _{\textbf{x}} \textbf{s}_0 )\cdot \unicode {x25BD} _{\textbf{X}} \unicode {x25BD} _{\textbf{X}} c_0 + \unicode {x25BD} _{\textbf{X}} c_1 + \unicode {x25BD} _{\textbf{x}} c_0 ] +\ldots \\& \quad + \delta ^2 \frac {1}{Pe} {\hat {\textbf{n}}}_2 \cdot \unicode {x25BD} _{\textbf{X}} c_0 = \delta Da + O(\delta ^3). \end{align}
When $c_0$
is independent of the fast scale, as in sections 5.1
–5.2, (C.2) simplifies considerably to give
$c_0$
is independent of the fast scale, as in sections 5.1
–5.2, (C.2) simplifies considerably to give
 \begin{align} & \frac {1}{Pe} {\hat {\textbf{n}}}_0 \cdot \unicode {x25BD} _{\textbf{X}} c_0 + \delta \frac {1}{Pe} {\hat {\textbf{n}}}_0 \cdot [ \unicode {x25BD} _{\textbf{X}} c_1 + \unicode {x25BD} _{\textbf{x}} c_0] + \delta ^2 \frac {1}{Pe} {\hat {\textbf{n}}}_0 \cdot [ \textbf{X} \cdot \unicode {x25BD} _{\textbf{x}} (\unicode {x25BD} _{\textbf{X}} c_1 + \unicode {x25BD} _{\textbf{x}} c_0 ) + \ldots \\ & \qquad + (\textbf{s}_1 + \textbf{X} \cdot \unicode {x25BD} _{\textbf{x}} \textbf{s}_0) \cdot \unicode {x25BD} _{\textbf{X}} \unicode {x25BD} _{\textbf{X}} c_1 + \unicode {x25BD} _{\textbf{X}} c_2 + \unicode {x25BD} _{\textbf{x}} c_1 ] +\ldots \\ & \qquad + \delta ^2 \frac {1}{Pe} {\hat {\textbf{n}}}_1 \cdot [ \unicode {x25BD} _{\textbf{X}} c_1 + \unicode {x25BD} _{\textbf{x}} c_0 ] = \delta Da + O(\delta ^3). \end{align}
Appendix D. Boundary terms
In this section, we illustrate that the third and fourth integrals in (5.22) do not contribute to the homogenised model. Writing the third integral in (5.22) in index notation, we have
 \begin{equation} \begin{split} \int _{\partial D_{s_0}} \left ( \textbf{X} \cdot \unicode {x25BD} _{\textbf{x}} (\unicode {x25BD} _{\textbf{X}} c_1 + \unicode {x25BD} _{\textbf{x}} c_0)\right ) \cdot {\hat {\textbf{n}}}_0dl_X &= \int _{\partial D_{s_0}} X_i \partial _{x_i} (\partial _{X_j }c_1 + \partial _{x_j}c_0 ) \hat {n}_{0j} dl_X. \end{split} \end{equation}
We substitute (5.15) for $c_1$
which gives
$c_1$
which gives
 \begin{equation} \begin{split} \int _{\partial D_{s_0}} \left ( \textbf{X} \cdot \unicode {x25BD} _{\textbf{x}} (\unicode {x25BD} _{\textbf{X}} c_1 + \unicode {x25BD} _{\textbf{x}} c_0)\right ) \cdot {\hat {\textbf{n}}}_0dl_X &= \int _{\partial D_{s_0}} X_i \partial _{x_i} \left ( (\delta _{jk} - \partial _{X_j} \Lambda _{k} ) \partial _{x_k} c_0 \right ) n_{0j} dl_X \\ &= \partial _{x_i} \partial _{x_k} c_0 \int _{\partial D_{s_0}} X_i (\delta _{jk} - \partial _{X_j} \Lambda _{k} ) n_{0j} dl_X \\ &= \partial _{x_i} \partial _{x_k} c_0 \int _{\partial D_{s_0}} X_i (n_{0k} - n_{0k}) dl_X \\ &= 0, \end{split} \end{equation}
where we have used the slow scale independence of the cell problem and (5.17) in the second line to eliminate $\boldsymbol {\Lambda }$
.
$\boldsymbol {\Lambda }$
.
We now consider the fourth integral in equation (5.22), writing it in index notation,
 \begin{equation} \int _{\partial D_{s_0}} \left ( \textbf{d}_0\cdot \unicode {x25BD} _{\textbf{X}} (\unicode {x25BD} _{\textbf{X}} c_1 + \unicode {x25BD} _{\textbf{x}} c_0)\right )\cdot {\hat {\textbf{n}}}_0 dl_X = \int _{\partial D_{s_0}} \left ( d_{0i} \partial _{X_i} (\partial _{X_j} c_1 + \partial _{x_j }c_0)\right ) n_{0j} dl_X. \end{equation}
Applying the divergence theorem and using the fast-scale independence of $\textbf{d}_0$
, we find
$\textbf{d}_0$
, we find
 \begin{equation} \begin{split} \int _{\partial D_{s_0}} \left ( \textbf{d}_0\cdot \unicode {x25BD} _{\textbf{X}} (\unicode {x25BD} _{\textbf{X}} c_1 + \unicode {x25BD} _{\textbf{x}} c_0)\right )\cdot {\hat {\textbf{n}}}_0 dl_X &= - \int _{ D_f} \partial _{X_j}\left ( d_{0i} \partial _{X_i} (\partial _{X_j} c_1 + \partial _{x_j }c_0)\right ) dS_X \\ &= - \int _{ D_f} d_{0i} \partial _{X_i} \partial _{Xj} (\partial _{X_j} c_1 + \partial _{x_j }c_0) dS_X \\ &=0, \end{split} \end{equation}
where the sign appears as ${\hat {\textbf{n}}}_0$
points from the string into the fluid domain. We have also used (5.15), (5.16) and the fast-scale independence of
${\hat {\textbf{n}}}_0$
points from the string into the fluid domain. We have also used (5.15), (5.16) and the fast-scale independence of $c_0.$
Applying the Reynolds transport theorem to the final integral in (5.22) gives rise to boundary integrals of the form
 \begin{equation} \int _{\partial D_{s_0}} (\unicode {x25BD} _{\textbf{X}} c_1 + \unicode {x25BD} _{\textbf{x}} c_0 ) \cdot (( \unicode {x25BD} _{\textbf{x}} \textbf{s}_0 ) \cdot {\hat {\textbf{n}}}_0 + {\hat {\textbf{n}}}_1)dl_X . \end{equation}
Substituting (5.9) for ${\hat {\textbf{n}}}_1$
gives
${\hat {\textbf{n}}}_1$
gives
 \begin{equation} \frac {1}{2}\int _{\partial D_{s_0}} ( \unicode {x25BD} _{\textbf{X}} c_1 + \unicode {x25BD} _{\textbf{x}} c_0 ) \cdot (\unicode {x25BD} _{\textbf{x}} \textbf{s}_0 - (\unicode {x25BD} _{\textbf{x}} \textbf{s}_0)^T )\cdot {\hat {\textbf{n}}}_0 dl_X. \end{equation}
Quantities that depend only on the slow scale will vanish upon integration round a closed loop, leaving
 \begin{equation} \begin{split} \frac {1}{2} \int _{\partial D} \unicode {x25BD} _{\textbf{X}} c_1 \cdot (\unicode {x25BD} _{\textbf{x}} \textbf{s}_0 - (\unicode {x25BD} _{\textbf{x}} \textbf{s}_0)^T )\cdot {\hat {\textbf{n}}}_0 dl_X &= (\partial _{xj} s_{0i} - \partial _{xi} s_{0j} ) \int _{\partial D_{s_0}} \partial _{X i } c_1 \hat {n} _j dl_X, \\ &= (\partial _{xj} s_{0i} - \partial _{xi} s_{0j} ) \int _{D_f} \partial _{X i } \partial _{X j } c_1 dS_X, \\ &= (\partial _{xj} s_{0i} - \partial _{xj} s_{0i} ) \int _{D_f} \partial _{X i } \partial _{X j } c_1 dS_X,\\ &= 0, \end{split} \end{equation}
where we have applied the divergence theorem to the first line and relabelled dummy indices in the second.
Appendix E. Cell problem symmetries
By considering the symmetries of the cell problem, we can deduce the form of the effective diffusion tensor as follows. We consider (5.16)–(5.18) under the transformation $X \to - X$
and
$X \to - X$
and $Y \to Y$
to deduce that
$Y \to Y$
to deduce that $\boldsymbol {\overline {\Lambda }} = \boldsymbol {\Lambda }({-}X, Y)$
must satisfy
$\boldsymbol {\overline {\Lambda }} = \boldsymbol {\Lambda }({-}X, Y)$
must satisfy
 \begin{align} \unicode {x25BD} _{\textbf{X}}^2 \boldsymbol {\overline {\Lambda }} &= \boldsymbol {0} \quad \text {in}\quad D_f, \end{align}
 \begin{align} n_{X} \frac {\partial \overline {\Lambda }_1}{\partial X} + n_{Y} \frac {\partial \overline {\Lambda }_1}{\partial Y} &= -n_X \quad \text {on} \quad \partial D_{s_0}, \end{align}
 \begin{align} n_{X} \frac {\partial \overline {\Lambda }_2}{\partial X} + n_{Y} \frac {\partial \overline {\Lambda }_2}{\partial Y} &= n_Y \quad \text {on} \quad \partial D_{s_0}, \end{align}
 \begin{align} \int _{D_f} \boldsymbol {\overline {\Lambda }} dS_X &= \boldsymbol {0}, \end{align}
with $\boldsymbol {\Lambda }$
periodic in
$\boldsymbol {\Lambda }$
periodic in $\textbf{X}$
and
$\textbf{X}$
and ${\hat {\textbf{n}}}_0 = (n_X, n_Y)$
is the leading-order normal to the domain in the original problem for
${\hat {\textbf{n}}}_0 = (n_X, n_Y)$
is the leading-order normal to the domain in the original problem for $\boldsymbol {\Lambda }$
. Thus, given that the domain and governing equation are unchanged under this transformation, and we expect
$\boldsymbol {\Lambda }$
. Thus, given that the domain and governing equation are unchanged under this transformation, and we expect $\overline {\boldsymbol {\Lambda }}$
to satisfy (5.16)–(5.18), we have
$\overline {\boldsymbol {\Lambda }}$
to satisfy (5.16)–(5.18), we have $\Lambda _1$
antisymmetric in
$\Lambda _1$
antisymmetric in $X$
. Performing similar analysis for the transformation
$X$
. Performing similar analysis for the transformation $Y \to -Y$
, we find that
$Y \to -Y$
, we find that $\Lambda _2$
is antisymmetric in
$\Lambda _2$
is antisymmetric in $Y$
. In (5.24), we take the gradient of
$Y$
. In (5.24), we take the gradient of $\boldsymbol {\Lambda }$
giving diagonal components that are symmetric in
$\boldsymbol {\Lambda }$
giving diagonal components that are symmetric in $(X, Y)$
and off-diagonal components that are antisymmetric. The average of the antisymmetric components will then be zero due to the symmetry of the domain, leaving a diagonal effective diffusion tensor. By considering the transformation
$(X, Y)$
and off-diagonal components that are antisymmetric. The average of the antisymmetric components will then be zero due to the symmetry of the domain, leaving a diagonal effective diffusion tensor. By considering the transformation $(X, Y) \to (Y, X)$
, we can deduce that the two in-plane components must be equal. Specifically, we introduce
$(X, Y) \to (Y, X)$
, we can deduce that the two in-plane components must be equal. Specifically, we introduce $\boldsymbol {\tilde {\Lambda }} = \boldsymbol {\tilde {\Lambda }} (X, Y) = \boldsymbol {\Lambda }(Y, X).$
Then, we have
$\boldsymbol {\tilde {\Lambda }} = \boldsymbol {\tilde {\Lambda }} (X, Y) = \boldsymbol {\Lambda }(Y, X).$
Then, we have
 \begin{equation} \partial _X \boldsymbol {\tilde {\Lambda }} = \partial _Y \boldsymbol {\Lambda } \quad \text {and} \quad \partial _Y \boldsymbol {\tilde {\Lambda }} = \partial _X \boldsymbol {\Lambda } . \end{equation}
We write the normal in the transformed coordinates as ${\tilde{\textbf{n}}} = (\tilde {n}_X, \tilde {n}_Y) = (n_Y, n_X)$
. Using (5.16)–(5.18), we deduce
${\tilde{\textbf{n}}} = (\tilde {n}_X, \tilde {n}_Y) = (n_Y, n_X)$
. Using (5.16)–(5.18), we deduce
 \begin{align} \unicode {x25BD} _X^2 \boldsymbol {\tilde {\Lambda }} &= 0 \quad \text {in} \quad D_f, \end{align}
 \begin{align} \tilde {n}_X \frac {\partial \tilde {\Lambda }_1}{ \partial X} + \tilde {n}_Y \frac {\partial \tilde {\Lambda }_1}{\partial Y} &= \tilde {n}_Y \quad \text {on} \quad D_{s_0}, \end{align}
 \begin{align} \tilde {n}_X \frac {\partial \tilde {\Lambda }_2}{ \partial X} + \tilde {n}_Y \frac {\partial \tilde {\Lambda }_2}{\partial Y} &= \tilde {n}_X \quad \text {on} \quad D_{s_0}, \end{align}
 \begin{align} \int _{D_f} \boldsymbol {\tilde {\Lambda }} dS_X &= 0. \end{align}
Thus, $\boldsymbol {\tilde {\Lambda }}$
must satisfy
$\boldsymbol {\tilde {\Lambda }}$
must satisfy
 \begin{equation} \tilde {\Lambda }_2 = \Lambda _1 \quad \text {and} \quad \tilde {\Lambda }_2 = \Lambda _1. \end{equation}
Combining (E.5) and (E.10), we must have $\partial _X \Lambda _1 = \partial _Y \Lambda _2$
, and so the effective diffusion tensor must be of the form
$\partial _X \Lambda _1 = \partial _Y \Lambda _2$
, and so the effective diffusion tensor must be of the form $\mathcal {D}_{m {eff}} = Pe^{-1} \text {diag}(D, D, 1)$
.
$\mathcal {D}_{m {eff}} = Pe^{-1} \text {diag}(D, D, 1)$
.


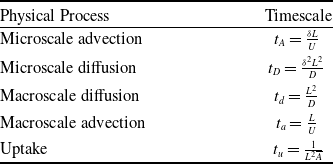


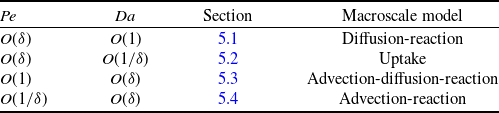


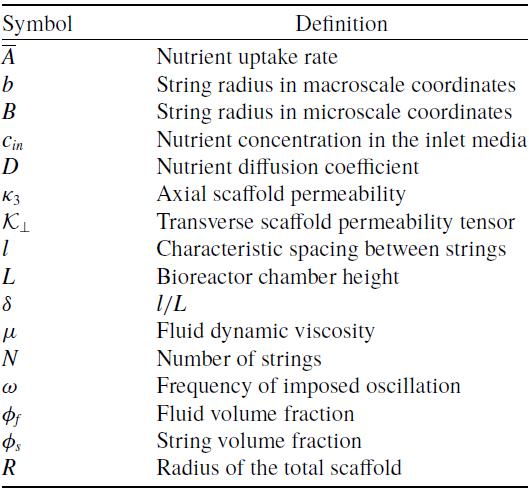
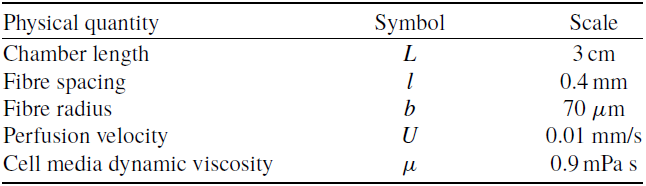

 Open access