





1. Introduction
Ablating thermal protection systems are used to shield hypersonic vehicles from the thermal loads experienced during flight. As the surface ablates, the vehicle surface changes shape and can develop surface patterns. Both flight and ground testing have shown that ablating materials can exhibit macroscale surface patterns of different types, including streamwise grooves, wedges, crosshatching and scallops (Grabow & White Reference Grabow and White1975). These patterns can occur for melting, sublimating and charring processes, and are observed on a wide range of materials including phenolics, plastics and wood (Stock & Ginoux Reference Stock and Ginoux1973). Examples of sublimation-induced surface patterns are shown in figure 1. The crosshatched surface (figure 1 c) has received the most attention in the literature and it has been shown that the crosshatch pattern angles correlate well with the local Mach angle (Swigart Reference Swigart1974).
Ablation patterns showing streamwise grooves (a), turbulent wedges (b) and crosshatching (c). Images taken from figure 1 of Stock & Goddard (Reference Stock and Godard1973).

Experiments have shown that surface patterns can develop on ablating materials when the flow is both supersonic and turbulent. Such patterns have not been observed under laminar supersonic or turbulent subsonic conditions. In addition, all tests have been performed under adiabatic ( $T_w=T_{\textit{ad}}$
) or cold-wall (
$T_w=T_{\textit{ad}}$
) or cold-wall ( $T_w\lt T_{\textit{ad}}$
) conditions as a result of high stagnation temperatures and long exposure times (Stock & Goddard Reference Stock and Godard1973). A summary of these experimental results is provided in table 1.
$T_w\lt T_{\textit{ad}}$
) conditions as a result of high stagnation temperatures and long exposure times (Stock & Goddard Reference Stock and Godard1973). A summary of these experimental results is provided in table 1.
Summary of experimental surface pattern observations.

While surface patterns have only been observed under turbulent flow conditions, an exploration of surface stability under laminar conditions serves as a useful foundation for future study and may reveal new surface patterns and mechanisms. We reiterate that while the observed patterns shown in figure 1 provide the initial motivation for studying linear surface instabilities, our study of surface stability goes beyond these observations to investigate general linear periodic surface patterns. In addition to laminar flows, the study of hot-wall conditions is warranted not only to fully characterise the behaviour of ablating surfaces and improve the understanding of surface stability mechanisms, but also because hot walls may occur during reentry. For example, as a vehicle decelerates, the stagnation temperature decreases with Mach number, which can create a condition in which the surface temperature remains greater than the surrounding flow. If the conditions for surface pattern formation are well understood, they can be used to design vehicles and trajectories that prevent their formation.
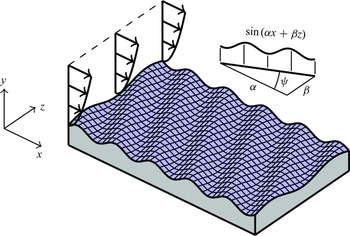
The mechanism by which surface patterns emerge on ablating materials remains unknown. Swigart (Reference Swigart1974) reviewed several proposed explanations for crosshatching, including differential ablation, inelastic deformation, and liquid-layer models. While some of these mechanisms could account for some of the observed patterns, the authors concluded that further investigation is needed. The present work focuses on the differential ablation of pure sublimators using a local linear stability approach. A schematic of the system is shown in figure 2. The framework and methodology presented here may be readily extended to porous ablators and inelastic deformation models to study alternative mechanisms.
Schematic of local linear stability of an ablating surface.

The differential ablation mechanism was studied by Lees, Kubota & Ko (Reference Lees, Kubota and Ko1972), where a simplified linear stability analysis of the coupled fluid–sublimation system was performed on a mean turbulent baseflow. The simplifying assumptions include steady fluid perturbations, isothermal boundary conditions, single-species chemistry and non-sublimating baseflows. The use of an isothermal wall boundary condition means that sublimation is not appropriately accounted for, and the sublimation rate was instead found by the energy balance that produces an isothermal wall. The linear analysis by Lees et al. (Reference Lees, Kubota and Ko1972) identified an oblique surface mode as the most unstable, demonstrating that differential ablation can produce surface instabilities. However, Swigart (Reference Swigart1974) reported another result from Lane and Ruger (unpublished) that contradicted the results of Lees et al. (Reference Lees, Kubota and Ko1972), claiming to show no such instability. The Lane and Ruger results do not appear to be published, and it is still unknown whether differential ablation is a viable mechanism for surface pattern formation.
This paper presents a more complete formulation of differential ablation stability than that of Lees et al. (Reference Lees, Kubota and Ko1972) by considering the full unsteady system with sublimation models and conjugate heat transfer within the solid. The surface stability of supersonic laminar flow over a flat camphor surface is analysed at varying wall-temperature ratios. The surface is found to be unstable for wall temperatures sufficiently greater than the adiabatic temperature, $T_w \gt 1.05\, T_{\textit{ad}}$
, and stable otherwise. These findings are consistent with experimental observations where patterns do not develop for laminar cold-wall conditions, and the analysis predicts that hot-wall experiments – which to our knowledge have not yet been performed – will produce a laminar instability. The governing equations for the fluid, solid and interface sublimation are presented in § 2. Section 3 presents the linearisation procedure and § 4 contains the linear stability results.
$T_w \gt 1.05\, T_{\textit{ad}}$
, and stable otherwise. These findings are consistent with experimental observations where patterns do not develop for laminar cold-wall conditions, and the analysis predicts that hot-wall experiments – which to our knowledge have not yet been performed – will produce a laminar instability. The governing equations for the fluid, solid and interface sublimation are presented in § 2. Section 3 presents the linearisation procedure and § 4 contains the linear stability results.
2. Governing equations and material models
2.1. Fluid
The fluid is governed by the frozen-flow multi-species compressible Navier–Stokes equations, written in compact form as
 \begin{equation} \frac {\partial \boldsymbol{Q}}{\partial t} + \frac {\partial \boldsymbol{F}_i}{\partial x_i} + \frac {\partial \boldsymbol{G}_i}{\partial x_i} = 0, \end{equation}
where $t$
is time,
$t$
is time, $x_i$
are the spatial coordinates,
$x_i$
are the spatial coordinates, $\boldsymbol{Q}$
is the vector of conservative flow variables,
$\boldsymbol{Q}$
is the vector of conservative flow variables, $\boldsymbol{F}$
denotes the inviscid fluxes and
$\boldsymbol{F}$
denotes the inviscid fluxes and $\boldsymbol{G}$
denotes the viscous fluxes:
$\boldsymbol{G}$
denotes the viscous fluxes:
 \begin{equation} \boldsymbol{Q} = \left [ \begin{array}{ccccc} \rho \\ \rho u_1 \\ \rho u_2 \\ \rho u_3 \\ \rho E \\ \rho _1 \\ \vdots \\ \rho _{n-1} \end{array} \right ]\! , \quad \boldsymbol{F}_i = \left [ \begin{array}{ccccc} \rho u_i \\ \rho u_1 u_i + p \delta _{1i} \\ \rho u_2 u_i + p \delta _{2i} \\ \rho u_3 u_i + p \delta _{3i} \\ \left ( \rho E + p \right ) u_i \\ \rho _1 u_i \\ \vdots \\ \rho _{n-1} u_i \end{array} \right ]\! , \quad \boldsymbol{G}_i = \left [ \begin{array}{ccccc} 0 \\ -\tau _{1i} \\ -\tau _{2i} \\ -\tau _{3i} \\ -u_{\!j} \tau _{\textit{ij}} + q_i \\ \rho _1 w_{1i} \\ \vdots \\ \rho _{n-1} w_{(n-1)i} \end{array} \right ]\!. \end{equation}
Here, $\rho$
is density,
$\rho$
is density, $u_i$
are the Cartesian velocity components,
$u_i$
are the Cartesian velocity components, $E$
is the total energy,
$E$
is the total energy, $p$
is the pressure, and
$p$
is the pressure, and $\rho _k$
and
$\rho _k$
and $w_{ki}$
are mass-density and
$w_{ki}$
are mass-density and $i$
th velocity for each chemical species
$i$
th velocity for each chemical species $k \in \{1,2,\ldots ,n\}$
. The viscous stress tensor
$k \in \{1,2,\ldots ,n\}$
. The viscous stress tensor $\tau _{\textit{ij}}$
, heat-flux vector
$\tau _{\textit{ij}}$
, heat-flux vector $q_i$
and species velocities are defined as
$q_i$
and species velocities are defined as
 \begin{equation} \tau _{\textit{ij}} = \mu \left (\frac {\partial u_i}{\partial x_{\!j}} + \frac {\partial u_{\!j}}{\partial x_i} \right ) + \lambda \frac {\partial u_i}{\partial x_i} \delta _{\textit{ij}}, \quad q_i = -\kappa \frac {\partial T}{\partial x_i} + \sum _{k=1}^n \rho _k h_k w_{ki}, \quad w_{ki} = -\frac {D_k}{c_k} \frac {\partial c_k}{\partial x_i}, \end{equation}
where $T$
is the fluid temperature,
$T$
is the fluid temperature, $h_k$
is the species enthalpy and
$h_k$
is the species enthalpy and $c_k = \rho _k /\rho$
are the species mass fractions. The total energy per unit volume is given by
$c_k = \rho _k /\rho$
are the species mass fractions. The total energy per unit volume is given by
 \begin{equation} \rho E = \frac {p}{\gamma -1} + \frac {1}{2}\rho \sum _{i=1}^3 u_i^2 + \sum _{k=1}^n \rho _k h_k^{0}, \end{equation}
where $h_k^0$
is the enthalpy of formation. The ideal gas law is used for the mixture:
$h_k^0$
is the enthalpy of formation. The ideal gas law is used for the mixture:
 \begin{equation} p = \sum _{k=1}^n \rho _k \textit{RT} , \end{equation}
where $R$
is the mixture gas constant.
$R$
is the mixture gas constant.
The transport coefficients ( $\mu _k$
,
$\mu _k$
, $\kappa _k$
and
$\kappa _k$
and $D_k$
) for a single species are given by kinetic theory (Hirschfelder, Curtiss & Bird Reference Hirschfelder, Curtiss and Bird1964). The mixture transport coefficients are found using the Wilke mixing rule with Eucken correction for conductivity. Specific model details are provided in Appendix A.
$D_k$
) for a single species are given by kinetic theory (Hirschfelder, Curtiss & Bird Reference Hirschfelder, Curtiss and Bird1964). The mixture transport coefficients are found using the Wilke mixing rule with Eucken correction for conductivity. Specific model details are provided in Appendix A.
2.2. Solid
For the solid phase, a non-porous sublimator comprised of a single material with spatially homogeneous isotropic thermal conductivity is considered. The solid is governed by the heat equation:
 \begin{equation} \frac {\partial T_s}{\partial t} = \alpha _s {\nabla} ^2 T_s , \end{equation}
where $T_s$
is the temperature of the solid and
$T_s$
is the temperature of the solid and $\alpha _s$
the thermal diffusivity.
$\alpha _s$
the thermal diffusivity.
2.3. Interface
The interface between the fluid and sublimator is governed by mass and energy balances across the surface. These interface conditions can be derived formally from the governing equations on either side of the interface as done by Padovan et al. (Reference Padovan, Vollmer, Panerai, Panesi, Stephani and Bodony2024). For an $x_2$
-normal interface that does not accumulate mass, the interface conditions for mass conservation reduce to
$x_2$
-normal interface that does not accumulate mass, the interface conditions for mass conservation reduce to
 \begin{equation} \left (\rho _k v \right )_{\!f} + \left (\rho _k w_{k2} \right )_{\!f} = \dot {m}_k, \end{equation}
where $v_{\!f}=u_{2,f}$
is the vertical velocity component at the wall and
$v_{\!f}=u_{2,f}$
is the vertical velocity component at the wall and $\dot {m}_k$
is the species mass flux produced by the surface reaction. Subscript ‘
$\dot {m}_k$
is the species mass flux produced by the surface reaction. Subscript ‘ $f$
’ refers to the external fluid. Summing over all species we find
$f$
’ refers to the external fluid. Summing over all species we find
 \begin{equation} \dot {m} = \left (\rho v \right )_{\!f}. \end{equation}
Similarly, the surface energy balance gives
 \begin{equation} \left (-\kappa \frac {\partial T}{\partial y} \right )_{\!f} + \left (\rho v h \right )_{\!f} + \left ( \sum _{k=1}^n \rho _k w_{k2} h_k \right )_{\!f} = \left (-\kappa \frac {\partial T}{\partial y} \right )_s + \dot {m}h_s, \end{equation}
where $h_s$
is the enthalpy of the solid sublimator, which accounts for surface reactions. For a binary mixture, with
$h_s$
is the enthalpy of the solid sublimator, which accounts for surface reactions. For a binary mixture, with $k=1$
as the sublimator, this can be simplified to
$k=1$
as the sublimator, this can be simplified to
 \begin{equation} \left (-\kappa \frac {\partial T}{\partial y} \right )_{\!f} = \left (-\kappa \frac {\partial T}{\partial y} \right )_s - \dot {m}h_{\textit{sg}}, \end{equation}
where $h_{\textit{sg}}$
is the enthalpy of sublimation (solid to gas). The rate of surface recession is found by the rate of mass lost to sublimation:
$h_{\textit{sg}}$
is the enthalpy of sublimation (solid to gas). The rate of surface recession is found by the rate of mass lost to sublimation:
 \begin{equation} \dot {m} = -\rho _s v_s, \end{equation}
where $\rho _s$
is the density of the solid and
$\rho _s$
is the density of the solid and $v_s$
is the velocity of the surface. The sublimation rate is found from the Knudsen–Langmuir model in combination with the Clausius–Clapeyron relation for saturation pressure using the triple point:
$v_s$
is the velocity of the surface. The sublimation rate is found from the Knudsen–Langmuir model in combination with the Clausius–Clapeyron relation for saturation pressure using the triple point:
 \begin{equation} \dot {m} = a_1 \frac {p_1^{\textit{sat}} - p_1}{\sqrt {2 \pi R_1 T_w}}, \quad \ln \left (\frac {p_1^{\textit{sat}}}{p_{\textit{TP},1}} \right ) = \frac {h_{\textit{sg}}}{R_1}\left (\frac {1}{T_{\textit{TP},1}} - \frac {1}{T_w} \right )\!, \end{equation}
where $a_1$
is the accommodation coefficient and
$a_1$
is the accommodation coefficient and $p_1$
is the partial pressure of the sublimating material. The superscript ‘
$p_1$
is the partial pressure of the sublimating material. The superscript ‘ $sat$
’ refers to the saturation pressure and the subscript ‘
$sat$
’ refers to the saturation pressure and the subscript ‘ $\textit{TP}$
’ refers to the triple point.
$\textit{TP}$
’ refers to the triple point.
2.3.1. Receding surface
The governing equations are applied to the uniformly receding baseflow coordinate system, while perturbations to the surface are handled by linearised boundary conditions. The governing equations are transformed from the stationary reference frame $x_i$
to a coordinate system translating with the receding surface,
$x_i$
to a coordinate system translating with the receding surface, $\bar {x}_i$
. The time derivative in (2.1) transforms to
$\bar {x}_i$
. The time derivative in (2.1) transforms to
 \begin{equation} \frac {\partial \boldsymbol{Q}}{\partial t}\bigg \rvert _{x_i} = \frac {\partial \boldsymbol{Q}}{\partial t}\bigg \rvert _{\bar {x}_i} - v_s \frac {\partial \boldsymbol{Q}}{\partial x_2}, \end{equation}
where $v_s$
is the surface velocity in the vertical direction,
$v_s$
is the surface velocity in the vertical direction, $x_2$
. Since
$x_2$
. Since $v_s$
is constant for the uniformly receding baseflow, the moving coordinate term is combined with the convective fluxes to convert the
$v_s$
is constant for the uniformly receding baseflow, the moving coordinate term is combined with the convective fluxes to convert the $u_2$
velocity to the relative velocity
$u_2$
velocity to the relative velocity $u_2 - v_s$
. To analyse this effect, (2.8) and (2.11) are combined to give
$u_2 - v_s$
. To analyse this effect, (2.8) and (2.11) are combined to give
 \begin{equation} v_{\!f} = -v_s \left ( \rho _s / \rho _{\!f} + 1 \right )\!, \end{equation}
where $\rho _{\!f}$
and
$\rho _{\!f}$
and $v_{\!f}$
are the fluid density and velocity at the wall. Sublimators typically have a density much larger than that of the fluid such that
$v_{\!f}$
are the fluid density and velocity at the wall. Sublimators typically have a density much larger than that of the fluid such that $\rho _s \gg \rho _{\!f}$
, which gives
$\rho _s \gg \rho _{\!f}$
, which gives $v_{\!f} \gg v_s$
, and the relative velocity terms can be neglected. The assumption of negligible recession rate on the fluid system is used throughout this work.
$v_{\!f} \gg v_s$
, and the relative velocity terms can be neglected. The assumption of negligible recession rate on the fluid system is used throughout this work.
Equation (2.6) for the solid is transformed similarly:
 \begin{equation} \frac {\partial T_s}{\partial t} - v_s \frac {\partial T_s}{\partial x_2} = \alpha _s {\nabla} ^2 T_s .\end{equation}
No simplifying assumption is made for the solid to remove the surface velocity.
3. Linearisation
The governing equations, in the uniformly receding coordinate frame, $\bar {x}_i$
, are linearised about a time-invariant parallel baseflow. In general, a given quantity
$\bar {x}_i$
, are linearised about a time-invariant parallel baseflow. In general, a given quantity $\boldsymbol{\phi }(\bar {x}_i,t)$
is represented as
$\boldsymbol{\phi }(\bar {x}_i,t)$
is represented as
 \begin{equation} \boldsymbol{\phi }(\bar {x}_i,t) = \overline {\boldsymbol{\phi }}(\bar {x}_i) + {\boldsymbol{\phi }}^\prime (\bar {x}_i,t), \end{equation}
where $\overline {\boldsymbol{\phi }}$
denotes the baseflow and
$\overline {\boldsymbol{\phi }}$
denotes the baseflow and ${\boldsymbol{\phi }}^\prime (\bar {x}_i,t)$
is a fluctuation. Here, we re-label the Cartesian coordinate system
${\boldsymbol{\phi }}^\prime (\bar {x}_i,t)$
is a fluctuation. Here, we re-label the Cartesian coordinate system $\bar {x}_i = (\bar {x}_1, \bar {x}_2, \bar {x}_3)$
to
$\bar {x}_i = (\bar {x}_1, \bar {x}_2, \bar {x}_3)$
to $\bar {x}_i = (x, y, z)$
for notational convenience. For the local stability analysis considered herein, the baseflow depends only on
$\bar {x}_i = (x, y, z)$
for notational convenience. For the local stability analysis considered herein, the baseflow depends only on $y$
, while the fluctuations take the form
$y$
, while the fluctuations take the form
 \begin{equation} {\boldsymbol{\phi }}^\prime (\bar{x}_i,t) = \hat {\boldsymbol{\phi }}(y) {\rm e}^{{\rm i}\left (\alpha x + \beta z - \omega t\right )}, \end{equation}
where $\alpha$
and
$\alpha$
and $\beta$
are the wavenumbers in the streamwise and spanwise directions, respectively, and
$\beta$
are the wavenumbers in the streamwise and spanwise directions, respectively, and $\omega$
is the frequency. The orientation of the perturbation is illustrated graphically in the schematic provided in figure 2.
$\omega$
is the frequency. The orientation of the perturbation is illustrated graphically in the schematic provided in figure 2.
3.1. Fluid
The governing fluid equations in (2.1) can be written compactly as $\partial _t\boldsymbol{Q} = \boldsymbol{f}(\boldsymbol{Q})$
. By expanding this equation about a steady-state solution
$\partial _t\boldsymbol{Q} = \boldsymbol{f}(\boldsymbol{Q})$
. By expanding this equation about a steady-state solution $\overline {\boldsymbol{Q}}$
and neglecting higher-order terms, a linear time-invariant system is obtained:
$\overline {\boldsymbol{Q}}$
and neglecting higher-order terms, a linear time-invariant system is obtained:
 \begin{equation} \frac {\partial \boldsymbol{Q}'}{\partial t} = \underbrace {D\!\boldsymbol{f}(\overline {\boldsymbol{Q}})}_{ := A(\overline {\boldsymbol{Q}})}\!{\boldsymbol{Q}}^\prime , \end{equation}
where ${\boldsymbol{Q}}^\prime$
denotes a fluctuation around
${\boldsymbol{Q}}^\prime$
denotes a fluctuation around $\overline {\boldsymbol{Q}}$
. Applying the modal ansatz to the linearised system (3.3) gives
$\overline {\boldsymbol{Q}}$
. Applying the modal ansatz to the linearised system (3.3) gives
 \begin{equation} -{\rm i}\omega \hat {q} = \widetilde A\left (\overline {\boldsymbol{Q}},\alpha ,\beta \right ) \hat {q}, \end{equation}
where the linear operator $\widetilde {A}$
is defined implicitly by means of the Fréchet derivative and the Fourier transform in Appendix B.
$\widetilde {A}$
is defined implicitly by means of the Fréchet derivative and the Fourier transform in Appendix B.
3.1.1. Baseflow
The baseflow is a self-similar compressible boundary layer with a non-reacting binary gas mixture. The equations are provided by Lysenko et al. (Reference Lysenko, Smorodsky, Kosinov and Yaroslavtsev2021) and are repeated here for completeness. In particular,
 \begin{equation} \frac {\rm d}{{\rm d}y}\left (\mu \frac {{\rm d}U}{{\rm d}y} \right ) + F \frac {{\rm d}U}{{\rm d}y} = 0 , \quad \frac {{\rm d}q}{{\rm d}y} = F \frac {{\rm d}h}{{\rm d}y} + \left (\gamma _e-1\right ) M_e^2 \mu \left (\frac {{\rm d}U}{{\rm d}y} \right )^2 , \quad \frac {{\rm d}j_1}{{\rm d}y} = F\frac {{\rm d}c_1}{{\rm d}y}, \end{equation}
where $2 ({{\rm d}F}/{{\rm d}y}) = \rho U$
,
$2 ({{\rm d}F}/{{\rm d}y}) = \rho U$
, $q=\kappa ({{\rm d}T}/{{\rm d}y}) + j_1 (h_1 - h_2 )$
and
$q=\kappa ({{\rm d}T}/{{\rm d}y}) + j_1 (h_1 - h_2 )$
and $j_1 = -\rho D_{12} ({{\rm d}c_1}/{{\rm d}y})$
. The equations have been non-dimensionalised by the boundary-layer edge quantities, with the Blasius length scale as the reference length
$j_1 = -\rho D_{12} ({{\rm d}c_1}/{{\rm d}y})$
. The equations have been non-dimensionalised by the boundary-layer edge quantities, with the Blasius length scale as the reference length $\delta _{Bl} = \sqrt {x \mu _e/U_e \rho _e}$
. The slow-recession assumption discussed in § 2.3.1 is present in these equations. The boundary conditions are found from the no-slip wall and the surface balances from (2.8) and (2.9). With
$\delta _{Bl} = \sqrt {x \mu _e/U_e \rho _e}$
. The slow-recession assumption discussed in § 2.3.1 is present in these equations. The boundary conditions are found from the no-slip wall and the surface balances from (2.8) and (2.9). With $c_1$
representing the sublimating species mass fraction, the surface boundary conditions in non-dimensional form are
$c_1$
representing the sublimating species mass fraction, the surface boundary conditions in non-dimensional form are
 \begin{align} U(0) = 0 , \quad F(0) &= -f_w = \frac {(\rho v)_{\!f}}{\rho _e u_e} \textit{Re}, \nonumber\\ f_w h_{\textit{sg}} + \left (-\kappa \frac {{\rm d}T}{{\rm d}y}\right )_{\! f} = \left (- \kappa \frac {{\rm d}T}{{\rm d}y} \right )_{\! s} , \quad &f_w \left (1-c_{1} \right ) = -\rho D_{12}\frac {{\rm d}c_1}{{\rm d}y} , \end{align}
where ${\textit{Re}} = \rho _e u_e \delta _{Bl}/\mu _e$
and all quantities are evaluated at the wall. The far-field conditions are
${\textit{Re}} = \rho _e u_e \delta _{Bl}/\mu _e$
and all quantities are evaluated at the wall. The far-field conditions are $U(\infty ) \to 1$
,
$U(\infty ) \to 1$
, $T(\infty ) \to 1$
and
$T(\infty ) \to 1$
and $c_1(\infty ) \to 0$
. The equations are solved using a shooting method with iterations on the undetermined wall boundary conditions.
$c_1(\infty ) \to 0$
. The equations are solved using a shooting method with iterations on the undetermined wall boundary conditions.
3.1.2. Boundary conditions
Since the governing equations are solved on the nominally receding surface $\overline {v}_s$
, the effects of perturbations to the surface resulting from
$\overline {v}_s$
, the effects of perturbations to the surface resulting from $v_s^\prime$
must be accounted for. Taking the surface position to be at
$v_s^\prime$
must be accounted for. Taking the surface position to be at $y=\eta ^\prime$
, where the nominal surface is at
$y=\eta ^\prime$
, where the nominal surface is at $y=0$
, the full interface boundary conditions resulting from no slip, zero pressure gradient and the interface mass/energy balances are
$y=0$
, the full interface boundary conditions resulting from no slip, zero pressure gradient and the interface mass/energy balances are
 \begin{align} \begin{aligned} u(\eta ^\prime ) &= w(\eta ^\prime ) = 0,\quad v(\eta ^\prime ) = -\dot {m} / \rho _s ,\\[5pt] \frac {\partial p}{\partial y}(\eta ') = 0,\quad \frac {\partial T}{\partial y}(\eta ') &= \frac {1}{\kappa _{\!f}}\left (\dot {m} h_{\textit{sg}} + \kappa _s \frac {\partial T_s}{\partial y} (\eta ') \right )\enspace \text{and} \enspace \frac {\partial c_1}{\partial y} (\eta ')=\frac {\dot {m}(1-c_1)}{-\rho D}. \end{aligned} \end{align}
Note that the fluid boundary conditions are coupled to both the interface and the solid state through the interface balances. These conditions can be transformed from the unknown interface position, $y=\eta '$
, to the nominal surface,
$y=\eta '$
, to the nominal surface, $y=0$
, through a first-order Taylor expansion:
$y=0$
, through a first-order Taylor expansion:
 \begin{equation} \phi (\eta ^\prime ) = \phi (0) + \frac {\partial \overline {\phi }}{\partial y} \bigg \rvert _0 \eta ^\prime . \end{equation}
Utilising this transformation, the boundary conditions are then numerically enforced at the nominal surface, $y=0$
, as
$y=0$
, as
 \begin{align} \begin{aligned} u(0) = &- \frac {\partial \bar {u}}{\partial y} \bigg |_0\eta ', \quad v(0) = -\dot {m}^\prime / \rho _s, \quad w(0) = 0,\\ p(0) = p(\eta '), \enspace \frac {\partial T}{\partial y}(0) &= \frac {\partial T}{\partial y}(\eta ') - \frac {\partial ^2 \bar {T}}{\partial y^2} \bigg |_0 \eta ' \enspace \text{and} \enspace \frac {\partial c_n}{\partial y}(0) = \frac {\partial c_n}{\partial y}(\eta ') - \frac {\partial ^2 \bar {c}_n}{\partial y^2} \bigg |_0 \eta '. \end{aligned} \end{align}
This method of applying boundary conditions to the nominal surface position by linear expansion has been used on similar problems (Lees et al. Reference Lees, Kubota and Ko1972; Lekoudis, Nayfeh & Saric Reference Lekoudis, Nayfeh and Saric1976). The far-field is treated with a sponge region and zero-gradient boundary conditions to eliminate reflections (Bodony Reference Bodony2006). To verify the far-field treatment, the domain geometry and sponge strength were varied and the eigenvalues and eigenvectors are analysed in Appendix C.
3.2. Solid
The linearisation and modal ansatz are applied to the solid equation (2.15), giving
 \begin{equation} \frac {{\rm d}^2 \hat {T}_s}{{\rm d}y^2} + \frac {\overline {v}_s}{\alpha _s}\frac {{\rm d}\hat {T}_s}{{\rm d}y} + \left (\frac {{\rm i} \omega }{\alpha _s} - \chi ^2 \right )\hat {T}_s = 0, \end{equation}
where $\chi ^2=\alpha ^2 + \beta ^2$
. This is a second-order ordinary differential equation with constant coefficients. The analytical solution is
$\chi ^2=\alpha ^2 + \beta ^2$
. This is a second-order ordinary differential equation with constant coefficients. The analytical solution is
 \begin{equation} \hat {T}_s = c_1 {\rm e}^{m_1 y} + c_2 {\rm e}^{m_2 y}, \quad m_{1,2} = \frac {1}{2}\left [ -\frac {\overline {v}_s}{\alpha _s} \pm \sqrt {\left ( \frac {\overline {v}_s}{\alpha _s} \right )^2 - 4\left (\frac {{\rm i} \omega }{\alpha _s} - \chi ^2 \right )} \right ] := q \pm r .\end{equation}
Considering a solid of thickness $h$
, an isothermal far-field boundary condition at
$h$
, an isothermal far-field boundary condition at $y=-h$
gives
$y=-h$
gives
 \begin{equation} \frac {{\rm d} \hat {T}_s}{{\rm d} y}(\hat {\eta }) = \left (q + \frac {r}{\tanh \left (rh\right )} \right ) \hat {T}_s(\hat {\eta }). \end{equation}
The total solid temperature gradient on the deformed surface is obtained using the expansion in (3.8):
 \begin{equation} \frac {{\rm d} T_s}{{\rm d}y}(\eta ') = \left ( \frac {{\rm d} \bar {T}_s}{{\rm d}y}\bigg |_0 + \frac {{\rm d}^2 \bar {T}_s}{{\rm d}y^2} \bigg |_0 \eta ' \right ) + \left (q + \frac {r}{\tanh \left (rh\right )} \right ) \left [ T_s(\eta ') - \bar {T}_s(0) - \frac {{\rm d} \bar {T}_s}{{\rm d}y} \bigg |_0 \eta ' \right ]\!. \end{equation}
3.2.1. Baseflow
Evaluation of (3.13) requires the first and second derivatives of $\bar {T}_{s}$
at the surface. For a baseflow with an isothermal wall condition, the surface temperature gradients in the solid are readily found from the energy balance in (2.10) and steady solution from (2.15).
$\bar {T}_{s}$
at the surface. For a baseflow with an isothermal wall condition, the surface temperature gradients in the solid are readily found from the energy balance in (2.10) and steady solution from (2.15).
3.2.2. Boundary conditions
The analytical boundary condition for ${\rm d}\hat {T}_s / {\rm d}y$
given by (3.12) would lead to a nonlinear eigenvalue problem, where the eigenvalues are nonlinear functions of
${\rm d}\hat {T}_s / {\rm d}y$
given by (3.12) would lead to a nonlinear eigenvalue problem, where the eigenvalues are nonlinear functions of $\alpha$
,
$\alpha$
, $\beta$
and
$\beta$
and $\omega$
. To simplify, a quasi-steady assumption is made where the solid response occurs much faster than the surface response, and the solid is approximately at a steady state. Consequently, both
$\omega$
. To simplify, a quasi-steady assumption is made where the solid response occurs much faster than the surface response, and the solid is approximately at a steady state. Consequently, both $\overline {v}_s/\alpha _s$
and
$\overline {v}_s/\alpha _s$
and $\omega /\alpha _s$
are assumed much smaller than
$\omega /\alpha _s$
are assumed much smaller than $\chi$
, and taking
$\chi$
, and taking $h \to \infty$
, (3.12) simplifies to
$h \to \infty$
, (3.12) simplifies to
 \begin{equation} \frac {{\rm d}\hat {T}_s}{{\rm d}y}(\hat {\eta }) = \chi \hat {T}_s(\hat {\eta }). \end{equation}
This boundary condition is now linear for a fixed oblique angle, $\psi$
, as
$\psi$
, as $\chi = \alpha \sqrt {1+\tan ^2 (\psi )}$
.
$\chi = \alpha \sqrt {1+\tan ^2 (\psi )}$
.
4. Results
Self-similar baseflows of a binary mixture boundary layer over a sublimating surface are computed for a range of freestream and wall-temperature conditions. The freestream condition ranges are $M=[2,3,4]$
,
$M=[2,3,4]$
, ${\textit{Re}}=[500, 785, 5000]$
,
${\textit{Re}}=[500, 785, 5000]$
, $\tilde {T}_0=T_0/T_{\textit{TP}}=[0.65, 0.88, 1.10]$
and
$\tilde {T}_0=T_0/T_{\textit{TP}}=[0.65, 0.88, 1.10]$
and $\tilde {p}_0=p_0/p_{\textit{TP}}=[0.2,2,20]$
. The freestream gas consists of air with
$\tilde {p}_0=p_0/p_{\textit{TP}}=[0.2,2,20]$
. The freestream gas consists of air with $\gamma =1.4$
and
$\gamma =1.4$
and $R=287\,\mathrm{J\,kg^{-1}\,K^{-1}}$
. The wall temperature is chosen relative to the adiabatic temperature,
$R=287\,\mathrm{J\,kg^{-1}\,K^{-1}}$
. The wall temperature is chosen relative to the adiabatic temperature, $T_{\textit{ad}}$
, defined as the temperature at which the solid interface is adiabatic,
$T_{\textit{ad}}$
, defined as the temperature at which the solid interface is adiabatic, ${\rm d}\bar {T}_s/{\rm d}y=0$
. The wall-temperature ratio is then defined as
${\rm d}\bar {T}_s/{\rm d}y=0$
. The wall-temperature ratio is then defined as $T_r = T_w/T_{\textit{ad}}$
. The sublimating material is camphor (
$T_r = T_w/T_{\textit{ad}}$
. The sublimating material is camphor ( $\mathrm{C_{10}H_{16}O}$
) with molar mass
$\mathrm{C_{10}H_{16}O}$
) with molar mass $\text{MW}=152.23\,\mathrm{g\,mol}^{-1}$
. The relevant properties of camphor were presented in Zibitsker et al. (Reference Zibitsker, McQuaid, Brehm and Martin2024) and are repeated here for completeness. The solid properties are
$\text{MW}=152.23\,\mathrm{g\,mol}^{-1}$
. The relevant properties of camphor were presented in Zibitsker et al. (Reference Zibitsker, McQuaid, Brehm and Martin2024) and are repeated here for completeness. The solid properties are $\rho _s=990\,\mathrm{kg\,m}^{-3}$
,
$\rho _s=990\,\mathrm{kg\,m}^{-3}$
, $\kappa _s=0.2\,\mathrm{W\,m^{-1}\,K^{-1}}$
and
$\kappa _s=0.2\,\mathrm{W\,m^{-1}\,K^{-1}}$
and $c_{p,s}=271.2\,\mathrm{J\,mol^{-1}\,K^{-1}}$
. The vapour and transport properties are
$c_{p,s}=271.2\,\mathrm{J\,mol^{-1}\,K^{-1}}$
. The vapour and transport properties are $T_{\textit{TP}}=453.1\,\mathrm{K}$
,
$T_{\textit{TP}}=453.1\,\mathrm{K}$
, $p_{\textit{TP}}=0.514\,\mathrm{bar}$
,
$p_{\textit{TP}}=0.514\,\mathrm{bar}$
, $\sigma =6.87$
Å,
$\sigma =6.87$
Å, $\varepsilon /k_B=562\,\mathrm{K}$
and
$\varepsilon /k_B=562\,\mathrm{K}$
and $c_{p,g}=192\,\mathrm{J\,mol^{-1}\,K^{-1}}$
. The specific heat of the gas is treated as constant and was obtained from the NASA-7 polynomial in Zibitsker et al. (Reference Zibitsker, McQuaid, Brehm and Martin2024) at
$c_{p,g}=192\,\mathrm{J\,mol^{-1}\,K^{-1}}$
. The specific heat of the gas is treated as constant and was obtained from the NASA-7 polynomial in Zibitsker et al. (Reference Zibitsker, McQuaid, Brehm and Martin2024) at $T=300\,\mathrm{K}$
. The accommodation coefficient is
$T=300\,\mathrm{K}$
. The accommodation coefficient is $a_1=0.18$
and the enthalpy of sublimation is
$a_1=0.18$
and the enthalpy of sublimation is $h_{\textit{sg}}=51.9\,\mathrm{kJ\,mol^{-1}\,K^{-1}}$
.
$h_{\textit{sg}}=51.9\,\mathrm{kJ\,mol^{-1}\,K^{-1}}$
.
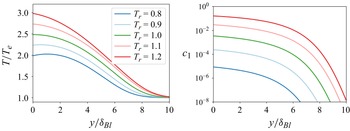
Baseflow temperature and mass fraction profiles are shown in figure 3 at $M=3$
,
$M=3$
, ${\textit{Re}}=785$
,
${\textit{Re}}=785$
, $\tilde {T}_0=0.65$
and
$\tilde {T}_0=0.65$
and $\tilde {p}_0=2$
for a range of wall-temperature ratios from
$\tilde {p}_0=2$
for a range of wall-temperature ratios from $T_r=0.8\ \text{to}\ 1.2$
. The profiles in figure 3 show that for increasing wall temperature, the boundary-layer thickness increases due to sublimation blowing. The amount of sublimation occurring for each case is illustrated by the vapour mass fraction
$T_r=0.8\ \text{to}\ 1.2$
. The profiles in figure 3 show that for increasing wall temperature, the boundary-layer thickness increases due to sublimation blowing. The amount of sublimation occurring for each case is illustrated by the vapour mass fraction $c_1$
, with the
$c_1$
, with the $T_r=1.2$
case consisting of
$T_r=1.2$
case consisting of $16 \,\%$
sublimated vapour at the wall. The case of
$16 \,\%$
sublimated vapour at the wall. The case of $T_r=1.0$
corresponds to an adiabatic solid.
$T_r=1.0$
corresponds to an adiabatic solid.
Self-similar baseflows with binary sublimation of camphor at $M=3$
,
$M=3$
, ${\textit{Re}}=785$
,
${\textit{Re}}=785$
, $\tilde {T}_0=0.65$
and
$\tilde {T}_0=0.65$
and $\tilde {p}_0=2$
.
$\tilde {p}_0=2$
.

4.1. Surface mode identification
The linearised governing equations with the quasi-steady conduction model are obtained for a given baseflow and the resulting temporal eigenvalue problem is solved. The eigenvalues near the origin for the case of $M=3$
,
$M=3$
, ${\textit{Re}}=5000$
,
${\textit{Re}}=5000$
, $\tilde {T}_0=0.65$
,
$\tilde {T}_0=0.65$
, $\tilde {p}_0=2$
and
$\tilde {p}_0=2$
and $T_r=1.0$
are shown as black circles in figure 4 for a wavenumber of
$T_r=1.0$
are shown as black circles in figure 4 for a wavenumber of $\alpha \delta _{Bl}=0.05$
.
$\alpha \delta _{Bl}=0.05$
.
Eigenvalues for a sublimating (black circles) and non-sublimating (red triangles) interface (a) and pressure component of eigenmodes (b). The baseflow conditions are $M=3$
,
$M=3$
, ${\textit{Re}}=5000$
,
${\textit{Re}}=5000$
, $\tilde {T}_0=0.65$
,
$\tilde {T}_0=0.65$
, $\tilde {p}_0=2$
and
$\tilde {p}_0=2$
and $T_r=1.0$
.
$T_r=1.0$
.

Observe from figure 4 the presence of a first Mack mode instability, positioned between the slow acoustic and the entropy branches. This mode is also referred to as the Tollmien–Schlichting mode in incompressible flows. Figure 4 also shows a single mode near the origin, labelled as the surface mode, which appears only when recession effects are included in the linear system. Under the conditions shown, this surface mode is stable ( $\omega _i\lt 0$
). To demonstrate the connection of this mode with surface recession, the eigenvalues were computed for the same problem without surface recession and are displayed in figure 4 with red triangles, where the surface mode is now absent.
$\omega _i\lt 0$
). To demonstrate the connection of this mode with surface recession, the eigenvalues were computed for the same problem without surface recession and are displayed in figure 4 with red triangles, where the surface mode is now absent.
To further illustrate the characteristics of the surface mode, the Jacobian is transformed to primitive variables and the real part of the pressure component of the eigenvectors is shown in figure 4(b). An overlay of the phase-aligned eigenvector for the surface mode using the uniform freestream linear system is included for comparison, along with the first Mack mode. The freestream system is provided in (3.15) of Özgen & Kırcalı (Reference Özgen and Kırcalı2008). The surface mode exhibits oscillations in the freestream that are consistent with the freestream eigenmode and can be interpreted as Mach waves emanating from a wavy surface. The wavenumber for Mach waves is computed geometrically as
 \begin{equation} \alpha _y = \chi \cot \left (\sin ^{-1}(1/M_n) \right )\!, \end{equation}
where $M_n=M\cos (\psi )$
is the Mach number normal to the perturbed surface. For the case analysed in figure 4, the Mach wave analysis predicts a wavenumber of
$M_n=M\cos (\psi )$
is the Mach number normal to the perturbed surface. For the case analysed in figure 4, the Mach wave analysis predicts a wavenumber of $\alpha _y \delta _{Bl}=0.14142$
and the freestream eigenvalues predict a wavenumber of
$\alpha _y \delta _{Bl}=0.14142$
and the freestream eigenvalues predict a wavenumber of $\alpha _y \delta _{Bl}=0.14142$
with a decay rate of
$\alpha _y \delta _{Bl}=0.14142$
with a decay rate of $1.37 \times 10^{-5}$
.
$1.37 \times 10^{-5}$
.
Finally, to justify the use of the quasi-steady conduction model in this analysis, an a posteriori comparison is made between the terms in (3.11). The surface mode in figure 4 is located at $\omega =(6.85-72.20{\rm i}) \times 10^{-7}{\rm rad\,s}^{-1}$
. Evaluating the terms in (3.11) gives
$\omega =(6.85-72.20{\rm i}) \times 10^{-7}{\rm rad\,s}^{-1}$
. Evaluating the terms in (3.11) gives $m_{1,2}/\alpha = 0.0004 \pm ( 1.005 - 0.0005 {\rm i} )$
, validating the quasi-steady assumption that
$m_{1,2}/\alpha = 0.0004 \pm ( 1.005 - 0.0005 {\rm i} )$
, validating the quasi-steady assumption that $m_{1,2}\approx \alpha$
.
$m_{1,2}\approx \alpha$
.
4.2. Two-dimensional surface modes
To study the effect of baseflow conditions on the surface mode, temporal growth rates for streamwise two-dimensional perturbations ( $\beta =0$
) are computed for variations in the baseflows with respect to a common condition of
$\beta =0$
) are computed for variations in the baseflows with respect to a common condition of $M=3$
,
$M=3$
, ${\textit{Re}}=785$
,
${\textit{Re}}=785$
, $\tilde {T}_0=0.65$
,
$\tilde {T}_0=0.65$
, $\tilde {p}_0=2$
and
$\tilde {p}_0=2$
and $T_r=1.0$
. The resulting growth rates as a function of wavenumber are shown in figure 5. The results in figure 5 show that variations in
$T_r=1.0$
. The resulting growth rates as a function of wavenumber are shown in figure 5. The results in figure 5 show that variations in $M$
,
$M$
, ${\textit{Re}}$
,
${\textit{Re}}$
, $\tilde {T}_0$
and
$\tilde {T}_0$
and $\tilde {p}_0$
about the base condition do not destabilise the surface. The effect of increasing
$\tilde {p}_0$
about the base condition do not destabilise the surface. The effect of increasing $M$
trends towards instability, but an
$M$
trends towards instability, but an $M=5$
result cannot be obtained under the transport model due to the low freestream temperatures (Kim & Monroe Reference Kim and Monroe2014). The results in the bottom panel of figure 5 show that the surface is unstable for wall temperatures exceeding the adiabatic case (
$M=5$
result cannot be obtained under the transport model due to the low freestream temperatures (Kim & Monroe Reference Kim and Monroe2014). The results in the bottom panel of figure 5 show that the surface is unstable for wall temperatures exceeding the adiabatic case ( $T_r \gt 1.0$
). A critical wavenumber exists at which the temporal growth rate reaches a maximum for all cases, meaning a surface pattern with a specific wavelength may emerge on sublimating plates.
$T_r \gt 1.0$
). A critical wavenumber exists at which the temporal growth rate reaches a maximum for all cases, meaning a surface pattern with a specific wavelength may emerge on sublimating plates.
Growth rates for two-dimensional surface modes for variations in the baseflow conditions with respect to a common condition of $M=3$
,
$M=3$
, ${\textit{Re}}=785$
,
${\textit{Re}}=785$
, $\tilde {T}_0=0.65$
,
$\tilde {T}_0=0.65$
, $\tilde {p}_0=2$
and
$\tilde {p}_0=2$
and $T_r=1.0$
. The single condition varied is indicated in the legend of each panel. The black lines mark neutral stability.
$T_r=1.0$
. The single condition varied is indicated in the legend of each panel. The black lines mark neutral stability.

4.2.1. Neutral stability
To further explore the range of flow conditions that result in an unstable surface, the critical temperature ratio, $T_{r,{\textit{crit}}}$
, that gives a neutrally stable surface is computed for a range of
$T_{r,{\textit{crit}}}$
, that gives a neutrally stable surface is computed for a range of $\tilde {T}_0$
and
$\tilde {T}_0$
and ${\textit{Re}}$
. The results for
${\textit{Re}}$
. The results for $M=3$
and
$M=3$
and $M=4$
are shown in figure 6. Note that
$M=4$
are shown in figure 6. Note that $\tilde {p}_0=2$
is held constant due to the insensitivity observed in figure 5.
$\tilde {p}_0=2$
is held constant due to the insensitivity observed in figure 5.
Neutral stability maps of $T_{r,{\textit{crit}}}$
for
$T_{r,{\textit{crit}}}$
for $M=3$
(a) and
$M=3$
(a) and $M=4$
(b).
$M=4$
(b).

Oblique surface growth rates at $\chi _{\textit{max}}$
for
$\chi _{\textit{max}}$
for $T_r=1.05{-}1.2$
at
$T_r=1.05{-}1.2$
at $M=3$
(a) and
$M=3$
(a) and $M=4$
(b). The dashed lines mark the sonic angle,
$M=4$
(b). The dashed lines mark the sonic angle, $\psi _s$
. The thick solid black line marks neutral stability, while the thin black lines are iso-contours in 0.01 increments. The green circles mark the location of peak growth rate for each
$\psi _s$
. The thick solid black line marks neutral stability, while the thin black lines are iso-contours in 0.01 increments. The green circles mark the location of peak growth rate for each $T_r$
, in 0.01 increments.
$T_r$
, in 0.01 increments.

From figure 6 it is observed that, consistent with the trends in figure 5, increasing ${\textit{Re}}$
and
${\textit{Re}}$
and $M$
have a slight destabilising effect, resulting in decreased
$M$
have a slight destabilising effect, resulting in decreased $T_{r, crit}$
needed to destabilise the surface. The neutral stability maps also show that an island of relative stability exists for
$T_{r, crit}$
needed to destabilise the surface. The neutral stability maps also show that an island of relative stability exists for $0.7 \leqslant \tilde {T}_0 \leqslant 0.8$
, where the
$0.7 \leqslant \tilde {T}_0 \leqslant 0.8$
, where the $T_{r,{\textit{crit}}}$
needed to destabilise the surface increases. The cause of this stabilising effect is not known and further investigation of the mechanisms is needed. Given that a
$T_{r,{\textit{crit}}}$
needed to destabilise the surface increases. The cause of this stabilising effect is not known and further investigation of the mechanisms is needed. Given that a $T_{r,{\textit{crit}}}$
exists for a wide range of freestream conditions, and
$T_{r,{\textit{crit}}}$
exists for a wide range of freestream conditions, and $T_{r,{\textit{crit}}}\gt 1$
for each case, a hot-wall condition appears to be required to destabilise the surface.
$T_{r,{\textit{crit}}}\gt 1$
for each case, a hot-wall condition appears to be required to destabilise the surface.
The results in figures 5 and 6 confirm the existence of a surface instability due to differential ablation in flow over a sublimating surface, consistent with the findings of Lees et al. (Reference Lees, Kubota and Ko1972). However, this is the first time such an instability has been identified in a laminar boundary layer, with the necessary condition of a hot wall ( $T_r\gt 1.0$
). Furthermore, these laminar stability results are consistent with the experimental observations (summarised in table 1) where laminar cold walls (
$T_r\gt 1.0$
). Furthermore, these laminar stability results are consistent with the experimental observations (summarised in table 1) where laminar cold walls ( $T_r\leqslant 1.0$
) are found to be stable.
$T_r\leqslant 1.0$
) are found to be stable.
4.3. Oblique surface modes
Surface modes for oblique ( $\beta \neq 0$
) perturbations were computed across a range of oblique angles, defined as
$\beta \neq 0$
) perturbations were computed across a range of oblique angles, defined as $\psi = \tan ^{-1}(\beta /\alpha )$
, at the streamwise wavenumbers corresponding to the maximum two-dimensional growth rate,
$\psi = \tan ^{-1}(\beta /\alpha )$
, at the streamwise wavenumbers corresponding to the maximum two-dimensional growth rate, $\chi _{\textit{max}}$
. The temporal growth rates for both
$\chi _{\textit{max}}$
. The temporal growth rates for both $M=3$
and
$M=3$
and $M=4$
conditions are presented in figure 7. The angle at which the normal Mach number reaches the sonic condition is indicated by the vertical dashed lines in figure 7, and is given by
$M=4$
conditions are presented in figure 7. The angle at which the normal Mach number reaches the sonic condition is indicated by the vertical dashed lines in figure 7, and is given by $\psi _s = \cos ^{-1}(1/M_e)$
. This angle is also the complement of the Mach angle. The results in figure 7 show that the streamwise two-dimensional mode is the most unstable for both conditions until
$\psi _s = \cos ^{-1}(1/M_e)$
. This angle is also the complement of the Mach angle. The results in figure 7 show that the streamwise two-dimensional mode is the most unstable for both conditions until $T_r \gt 1.14$
, beyond which an oblique mode near the sonic angle becomes more unstable. Further increases in
$T_r \gt 1.14$
, beyond which an oblique mode near the sonic angle becomes more unstable. Further increases in $T_r$
reveal a third unstable orientation of a spanwise mode near
$T_r$
reveal a third unstable orientation of a spanwise mode near $\psi =90^{\circ }$
under the
$\psi =90^{\circ }$
under the $M=4$
condition. The rapid transition of the most unstable orientation from streamwise two-dimensional to oblique to spanwise-two-dimensional suggests that distinct instability mechanisms are present. The importance of supersonic flow on surface instabilities is highlighted by the presence of the unstable sonic angle orientation, where as the oblique angle increases across the sonic angle, the flow normal to the surface perturbation transitions from supersonic to subsonic.
$M=4$
condition. The rapid transition of the most unstable orientation from streamwise two-dimensional to oblique to spanwise-two-dimensional suggests that distinct instability mechanisms are present. The importance of supersonic flow on surface instabilities is highlighted by the presence of the unstable sonic angle orientation, where as the oblique angle increases across the sonic angle, the flow normal to the surface perturbation transitions from supersonic to subsonic.
The presence of an instability at an oblique angle provides an intriguing connection to observed crosshatching patterns. If linear differential ablation is the primary mechanism driving surface pattern formation, these results indicate that a single dominant wavelength and orientation will emerge, determined by the most unstable mode. Accordingly, sublimating materials exposed to supersonic, laminar, hot-wall conditions are predicted to develop surface patterns at one of three preferred orientations: $\psi =0$
,
$\psi =0$
, $\psi _s$
or
$\psi _s$
or $90^{\circ }$
. If crosshatching patterns are caused by linear instability mechanisms in turbulent flows, the sonic instability is a viable candidate as it contains a critical wavenumber and orientation, consistent with experimental observations.
$90^{\circ }$
. If crosshatching patterns are caused by linear instability mechanisms in turbulent flows, the sonic instability is a viable candidate as it contains a critical wavenumber and orientation, consistent with experimental observations.
5. Conclusion
The formulation for local linear stability analysis of ablating surfaces is presented and applied to a compressible boundary layer over a sublimating plate. Temporal stability analysis is performed on sublimating baseflows, where hot-walls are found to destabilise the laminar surface mode. The unstable surface mode contains a critical wavenumber and orientation, aligning with experimental observations of crosshatching patterns in turbulent flows. While the comparison between laminar and turbulent flows is not conclusive, it may suggest a common underlying mechanism and motivates continued study through linear stability methods. The three-dimensional analysis reveals a transition in the dominant mode orientation from streamwise, to sonic, to spanwise as the temperature ratio $T_r$
increases. The presented linear framework can be used to further investigate surface instabilities under more conditions, including turbulent flows, and to explore additional mechanisms, such as inelastic deformation or liquid-layer models. The analysis can also be extended to study non-modal effects and assess whether transient growth contributes to surface pattern formation.
$T_r$
increases. The presented linear framework can be used to further investigate surface instabilities under more conditions, including turbulent flows, and to explore additional mechanisms, such as inelastic deformation or liquid-layer models. The analysis can also be extended to study non-modal effects and assess whether transient growth contributes to surface pattern formation.
Funding
This work was supported by the LDRD Program at Sandia National Laboratories. Sandia is managed and operated by NTESS under DOE NNSA contract DE-NA0003525.
Declaration of interests
The authors report no conflict of interest.
Appendix A. Transport model
The single-species transport quantities are given by
 \begin{equation} \begin{array}{c} \mu _i = 2.6693 \times 10^{-6} \dfrac {\sqrt {T M_i}}{d_i^2 \varOmega ^{(2,2)}} , \quad \kappa _i = 0.0833 \dfrac {\sqrt {T/M_i}}{d_i^2 \varOmega ^{(2,2)}} , \\ \quad \\ D_{12} = 1.858 \times 10^{-7} \dfrac {\sqrt {T^3 \left (1/M_1 + 1/M_2 \right ) }}{p d_{12}^2 \varOmega ^{(1,1)}}, \end{array} \end{equation}
where all terms are given in dimensional units as described in Hirschfelder et al. (Reference Hirschfelder, Curtiss and Bird1964). The mixture transport coefficients are found using the Wilke mixing rule with Eucken correction for conductivity. For a binary mixture we have
 \begin{align} \mu &= \frac {\mu _1}{1 + G_{12}(x_2/x_1)} + \frac {\mu _2}{1 + G_{21}(x_1/x_2)} , \nonumber\\ \kappa &= \frac {\tilde {\kappa }_1}{1 + 1.065\tilde {G}_{12}(x_2/x_1)} + \frac {\tilde {\kappa }_2}{1 + 1.065\tilde {G}_{21}(x_1/x_2)}, \end{align}
where
 \begin{equation} \begin{array}{c} G_{\textit{ij}} = \dfrac {\left [1 + \sqrt {\mu _i/\mu _{\!j}} \left (m_{\!j}/m_i \right )^{1/4}\right ]^2}{2^{3/2}\sqrt {1+ m_i/m_{\!j}}} , \quad \tilde {G}_{\textit{ij}} = \dfrac {\left [1 + \sqrt {\kappa _i/\kappa _{\!j}} \left (m_{\!j}/m_i \right )^{1/4}\right ]^2}{2^{3/2}\sqrt {1+ m_i/m_{\!j}}} \end{array} \end{equation}
and the Eucken correction factor:
 \begin{equation} \tilde {\kappa }_i = \textit{Eu} \kappa _i , \quad \textit{Eu} = 0.115 + 0.354\frac {C_{\!pi}}{R_i}, \end{equation}
where $x_i=(c_i/m_i)/(c_1/m_1 + c_2/m_2)$
are the mass fractions. Additional details are found in Chapter 10 of Dorrance (Reference Dorrance1962). The collision integrals for the kinetic theory are evaluated using the high-order curve fit provided by Kim & Monroe (Reference Kim and Monroe2014).
$x_i=(c_i/m_i)/(c_1/m_1 + c_2/m_2)$
are the mass fractions. Additional details are found in Chapter 10 of Dorrance (Reference Dorrance1962). The collision integrals for the kinetic theory are evaluated using the high-order curve fit provided by Kim & Monroe (Reference Kim and Monroe2014).
Appendix B. Linearised system
Letting $\varPsi _{\alpha ,\beta } := \mathcal{F}_{\alpha ,\beta }(\psi )$
denote the
$\varPsi _{\alpha ,\beta } := \mathcal{F}_{\alpha ,\beta }(\psi )$
denote the $(\alpha ,\beta )$
-Fourier coefficient of some spatially dependent function
$(\alpha ,\beta )$
-Fourier coefficient of some spatially dependent function $\psi$
, the Jacobian is numerically approximated from a nonlinear solver using the Fréchet derivative:
$\psi$
, the Jacobian is numerically approximated from a nonlinear solver using the Fréchet derivative:
 \begin{equation} \widetilde {A} \varPsi _{\alpha , \beta } \approx \mathcal{F}_{\alpha ,\beta } \left ( \frac {\boldsymbol{f}\left(\overline {\boldsymbol{Q}} + \varepsilon \psi \right) - \boldsymbol{f}\left(\overline {\boldsymbol{Q}} - \varepsilon \psi \right)}{2 \varepsilon } \right )\!, \end{equation}
where $\boldsymbol{f}$
is the right-hand side of the nonlinear governing equations.
$\boldsymbol{f}$
is the right-hand side of the nonlinear governing equations.
The Jacobian $\widetilde {A}$
obtained from the nonlinear solver is directly applicable to temporal eigenvalue analysis, but it requires recomputing the Jacobian for each new wavenumber. Observe that the governing equations are at most second-order in space, with cross-derivatives. The Jacobian can be explicitly expressed in the form
$\widetilde {A}$
obtained from the nonlinear solver is directly applicable to temporal eigenvalue analysis, but it requires recomputing the Jacobian for each new wavenumber. Observe that the governing equations are at most second-order in space, with cross-derivatives. The Jacobian can be explicitly expressed in the form
 \begin{equation} -{\rm i}\omega \hat {q} = \left ( \alpha A_1 + \alpha ^2 A_2 + A_3 + \beta A_4 + \beta ^2 A_5 + \alpha \beta A_6 \right ) \hat {q}. \end{equation}
The individual complex matrices $A_i$
can be extracted by obtaining the full Jacobian,
$A_i$
can be extracted by obtaining the full Jacobian, $\tilde {A}$
, at six linearly independent combinations of wavenumbers. Using this form, the Jacobian can be computed efficiently for all wavenumbers and be used for spatial stability analysis.
$\tilde {A}$
, at six linearly independent combinations of wavenumbers. Using this form, the Jacobian can be computed efficiently for all wavenumbers and be used for spatial stability analysis.
To verify this method, a spatial stability analysis of an $M=4.8$
boundary layer with blowing is performed and compared with the results of Ghaffari et al. (Reference Ghaffari, Marxen, Iaccarino and Shaqfeh2010) in figure 8.
$M=4.8$
boundary layer with blowing is performed and compared with the results of Ghaffari et al. (Reference Ghaffari, Marxen, Iaccarino and Shaqfeh2010) in figure 8.
Spatial stability of compressible boundary layer with blowing. Symbols represent results from Ghaffari et al. (Reference Ghaffari, Marxen, Iaccarino and Shaqfeh2010).

Appendix C. Far-field verification
To verify that the far-field boundary conditions are not influencing the surface stability results, a two-dimensional temporal stability analysis was computed for varying far-field domain length $y_{\!f}$
and quadratic sponge strength
$y_{\!f}$
and quadratic sponge strength $\sigma$
. To illustrate the decay of the surface mode in the freestream, the conditions were chosen as
$\sigma$
. To illustrate the decay of the surface mode in the freestream, the conditions were chosen as $M=3.0$
,
$M=3.0$
, ${\textit{Re}}=785$
,
${\textit{Re}}=785$
, $\tilde {T}_0=0.65$
,
$\tilde {T}_0=0.65$
, $\tilde {p}_0=2$
,
$\tilde {p}_0=2$
, $T_r=1.0$
and
$T_r=1.0$
and $\alpha \delta =0.5$
. The resulting eigenvalues and surface mode eigenvectors are shown in figure 9. The results demonstrate that changing the domain and sponge properties has an influence on the eigenvalue spectra due to the changing resolution and numerical dissipation. However, a closer inspection of the surface mode finds a deviation of less than
$\alpha \delta =0.5$
. The resulting eigenvalues and surface mode eigenvectors are shown in figure 9. The results demonstrate that changing the domain and sponge properties has an influence on the eigenvalue spectra due to the changing resolution and numerical dissipation. However, a closer inspection of the surface mode finds a deviation of less than $0.1\,\%$
in the eigenvalue. Similarly, the eigenvectors show excellent agreement between the surface and the beginning of the sponge region (beginning at
$0.1\,\%$
in the eigenvalue. Similarly, the eigenvectors show excellent agreement between the surface and the beginning of the sponge region (beginning at $y=40$
when
$y=40$
when $y_{\!f}=50$
). Once inside the sponge region, the amplitudes decay according to their sponge strengths,
$y_{\!f}=50$
). Once inside the sponge region, the amplitudes decay according to their sponge strengths, $\sigma$
.
$\sigma$
.
Eigenvalues (a) and eigenmode pressure (b).




 Open access

