





1. Introduction
Converging shock waves (SWs) are physical phenomena capable of creating extreme thermodynamic conditions in matter. These processes appear in a broad range of fields, such as extracorporeal SW lithotripsy (Lingeman et al. Reference Lingeman, McAteer, Gnessin and Evan2009; Zhong Reference Zhong2013), inertial-confinement fusion (Shcherbakov Reference Shcherbakov1983; Theobald et al. Reference Theobald2008), microscopic bubble cavitation (Reisman, Wang & Brennen Reference Reisman, Wang and Brennen1998; Kodama & Tomita Reference Kodama and Tomita2000) and macroscopic stellar-core collapse (van Riper Reference van Riper1982; Takiwaki et al. Reference Takiwaki, Kotake, Nagataki and Sato2004). Unlike diverging SWs, converging shocks in gas are strongly unstable (Apazidis & Eliasson Reference Apazidis and Eliasson2019). Although they initially accelerate and retain their shape, they eventually lose their symmetry due to curvature-induced amplification of shock front corrugations (Gardner, Book & Bernstein Reference Gardner, Book and Bernstein1982). In contrast, analogous converging shocks in water seem to be weakly unstable, retaining their symmetry up to very close to the focus (Bland et al. Reference Bland, Krasik, Yanuka, Gardner, MacDonald, Virozub, Efimov, Gleizer and Chaturvedi2017; Yanuka et al. Reference Yanuka, Rososhek, Bland and Krasik2017; Rososhek, Nouzman & Krasik Reference Rososhek, Nouzman and Krasik2021; Rojas Mata, Hernández Garcia & Liverts Reference Rojas Mata, Hernández Garcia and Liverts2026). Producing shock–bubble experiments with converging cylindrical shock fronts is experimentally challenging, particularly in achieving precise coaxial alignment and ensuring reproducible cylindrical bubble geometry. These interactions are of particular interest because shock curvature fundamentally alters pressure amplification and the collapse dynamics, compared with the extensively studied planar shock–bubble interactions. In this work, we experimentally and numerically explore two different configurations: (i) an azimuthally symmetric, cylindrically converging SW impacting a coaxial cylindrical bubble (referred to as cylindrical-to-cylindrical case); and (ii) a semicylindrical converging SW, essentially half of the cylindrical front, interacting with the same target (referred to as semicylindrical-to-cylindrical case).
Shock–bubble interactions are fundamentally governed by the acoustic impedance mismatch between the involved media, quantified by the Atwood number $A$
, defined as
$A$
, defined as $A = (\rho _{2}-\rho _{1})/(\rho _{2}+\rho _{1})$
, where
$A = (\rho _{2}-\rho _{1})/(\rho _{2}+\rho _{1})$
, where $\rho _{1}$
and
$\rho _{1}$
and $\rho _{2}$
are the densities of the surrounding medium and the bubble, respectively. In planar shock light-to-heavy configurations (
$\rho _{2}$
are the densities of the surrounding medium and the bubble, respectively. In planar shock light-to-heavy configurations ( ${A} \gt 0$
), the bubble acts like a converging lens, focusing the transmitted shock and producing a strong reflected shock; conversely, in heavy-to-light configurations (
${A} \gt 0$
), the bubble acts like a converging lens, focusing the transmitted shock and producing a strong reflected shock; conversely, in heavy-to-light configurations ( ${A} \lt 0$
), the bubble behaves as a diverging lens, transmitting a slower shock and generating a reflected rarefaction wave. The consequent dynamics of the bubble interface is complex, involving its compression and unstable collapse. When a denser fluid penetrates into a lighter fluid, high-speed jet spikes may be generated primarily through Richtmyer–Meshkov instability (RMI). This has been investigated in planar shock–bubble collapse experiments using shock tubes (Zhai et al. Reference Zhai, Zou, Wu and Luo2018), and by underwater electrical explosions of wire arrays (Maler et al. Reference Maler2022; Strucka et al. Reference Strucka2023), among other approaches. Rayleigh (Reference Rayleigh1917) was the first to consider the bubble collapse problem, providing a mathematical description of the spherical collapse of a vacuum cavity in an incompressible, inviscid liquid and predicting collapse velocities tending to infinity at the focal point. Building on Rayleigh’s work, Plesset (Reference Plesset1949) incorporated viscosity and surface tension effects to derive the Rayleigh–Plesset equation for incompressible liquids. Later models introduced compressibility effects: Gilmore (Reference Gilmore1952) derived a fully compressible, enthalpy-based formulation for high Mach number shock conditions, whereas Keller & Miksis (Reference Keller and Miksis1980) developed a weakly compressible model based on the wave and Bernoulli equations. Recent work by Zhang et al. (Reference Zhang, Li, Cui, Li and Liu2023) succeeded in creating a single unified theory that integrates the Rayleigh–Plesset equation, the Gilmore equation and the Keller–Miksis equation.
${A} \lt 0$
), the bubble behaves as a diverging lens, transmitting a slower shock and generating a reflected rarefaction wave. The consequent dynamics of the bubble interface is complex, involving its compression and unstable collapse. When a denser fluid penetrates into a lighter fluid, high-speed jet spikes may be generated primarily through Richtmyer–Meshkov instability (RMI). This has been investigated in planar shock–bubble collapse experiments using shock tubes (Zhai et al. Reference Zhai, Zou, Wu and Luo2018), and by underwater electrical explosions of wire arrays (Maler et al. Reference Maler2022; Strucka et al. Reference Strucka2023), among other approaches. Rayleigh (Reference Rayleigh1917) was the first to consider the bubble collapse problem, providing a mathematical description of the spherical collapse of a vacuum cavity in an incompressible, inviscid liquid and predicting collapse velocities tending to infinity at the focal point. Building on Rayleigh’s work, Plesset (Reference Plesset1949) incorporated viscosity and surface tension effects to derive the Rayleigh–Plesset equation for incompressible liquids. Later models introduced compressibility effects: Gilmore (Reference Gilmore1952) derived a fully compressible, enthalpy-based formulation for high Mach number shock conditions, whereas Keller & Miksis (Reference Keller and Miksis1980) developed a weakly compressible model based on the wave and Bernoulli equations. Recent work by Zhang et al. (Reference Zhang, Li, Cui, Li and Liu2023) succeeded in creating a single unified theory that integrates the Rayleigh–Plesset equation, the Gilmore equation and the Keller–Miksis equation.
In parallel with this analytical work, Kornfeld & Suvorov (Reference Kornfeld and Suvorov1944) were among the first to highlight the importance of asymmetric bubble collapse near solid boundaries, identifying the resulting high-speed microjets as a primary mechanism behind cavitation erosion. Plesset & Chapman (Reference Plesset and Chapman1971) developed a theoretical and numerical model for the asymmetric collapse of vapour bubbles near solid surfaces, predicting the conditions under which microjets form, their direction towards the boundary and the resulting localised pressures responsible for cavitation damage. Later, Blake & Gibson (Reference Blake and Gibson1987) used experimental high-speed photography to classify collapse regimes, measure jet velocities and SW emissions and link this dynamics to observed erosion patterns, thereby extending the theoretical framework with detailed experimental evidence. Dear, Field & Walton (Reference Dear, Field and Walton1988) and Bourne & Field (Reference Bourne and Field1992, Reference Bourne and Field1999) experimentally investigated the shock-induced collapse of gas-filled cylindrical cavities subjected to planar SWs generated within gelatine. They demonstrated that water–gelatine solutions with gelatine concentrations below 12 % produce bubble deformations closely resembling those observed in the water-to-gas configuration. Dear et al. (Reference Dear, Field and Walton1988) showed experimentally that cavity wall velocities can reach approximately twice the particle velocity behind the shock. They reached jet velocities of approximately 400 m s−1 at incident SW pressures of 0.26 GPa, surpassing the theoretical prediction due to nonlinear convergence effects, and producing localised pressures approaching 1 GPa at the impacted surfaces. Bourne & Field (Reference Bourne and Field1992) showed that jet velocity increases with shock pressure and decreases with cavity size, sometimes even exceeding the shock velocity itself, and observed a linear decrease in cavity volume during collapse. In Bourne & Field (Reference Bourne and Field1999), they further confirmed the nonlinear dependence of jet velocity on shock pressure and cavity diameter and showed that the high temperatures generated inside collapsing cavities produce luminescence and can ignite reactive media, particularly near the jet impact zones. Weir, Chandler & Goodwin (Reference Weir, Chandler and Goodwin1998) used 6 % water–gelatine cylinders imploded by cylindrically convergent shocks in gas, with sinusoidal interface perturbations introduced to trigger RMI and to study the growth and inversion of these perturbations during implosion. Since then, many experimental and numerical studies have been carried out to characterise the physics of such processes; see the review by Ranjan, Oakley & Bonazza (Reference Ranjan, Oakley and Bonazza2011).
Previous work (Sembian et al. Reference Sembian, Liverts, Tillmark and Apazidis2016) investigated the light-to-heavy interaction of planar SWs in air with a water droplet at $A \approx 1$
, detailing the evolution of the shock as it transmitted across the droplet interface. Building on this, the present study focuses on a complementary heavy-to-light scenario: SWs propagating in a water–gelatine solution interacting with an air bubble at
$A \approx 1$
, detailing the evolution of the shock as it transmitted across the droplet interface. Building on this, the present study focuses on a complementary heavy-to-light scenario: SWs propagating in a water–gelatine solution interacting with an air bubble at $A \approx -1$
. Following a similar approach to Dear et al. (Reference Dear, Field and Walton1988), we use a 4 % in mass water–gelatine solution, which maintains a density close to that of water but enhances stiffness sufficiently to create stable cylindrical gas cavities for controlled experiments. To generate cylindrical and semicylindrical SWs, we employ a high-voltage pulsed power driver (PPD) capable of delivering high currents to copper wire array loads. The rapid explosion of these wires produces converging shocks with the same initial geometry as the wire array. We visualise the shock propagation through gelatine using X-ray radiography, as conventional shadowgraphy is ineffective due to the low optical transmittance of gelatine to visible light. The X-rays are converted into visible light via scintillators, and the resulting emission is recorded with two high-speed cameras. To complement and interpret the experimental observations, compressible multiphase hydrodynamic (HD) numerical simulations are performed in two dimensions using the five-equation Navier–Stokes model. Additionally, a Gilmore-type analytical model for compressible cylindrical bubble pulsation is used to enable cross-validation of the experimental and numerical results and provide deeper insight into the underlying physics. Ultimately, this combination of approaches aims to establish a quasi-two-dimensional framework for systematically exploring cylindrical and semicylindrical shock–bubble interactions.
$A \approx -1$
. Following a similar approach to Dear et al. (Reference Dear, Field and Walton1988), we use a 4 % in mass water–gelatine solution, which maintains a density close to that of water but enhances stiffness sufficiently to create stable cylindrical gas cavities for controlled experiments. To generate cylindrical and semicylindrical SWs, we employ a high-voltage pulsed power driver (PPD) capable of delivering high currents to copper wire array loads. The rapid explosion of these wires produces converging shocks with the same initial geometry as the wire array. We visualise the shock propagation through gelatine using X-ray radiography, as conventional shadowgraphy is ineffective due to the low optical transmittance of gelatine to visible light. The X-rays are converted into visible light via scintillators, and the resulting emission is recorded with two high-speed cameras. To complement and interpret the experimental observations, compressible multiphase hydrodynamic (HD) numerical simulations are performed in two dimensions using the five-equation Navier–Stokes model. Additionally, a Gilmore-type analytical model for compressible cylindrical bubble pulsation is used to enable cross-validation of the experimental and numerical results and provide deeper insight into the underlying physics. Ultimately, this combination of approaches aims to establish a quasi-two-dimensional framework for systematically exploring cylindrical and semicylindrical shock–bubble interactions.
Diagram of the experimental set-up.

2. Methods
2.1. Experimental configuration
We include a sketch of the experimental set-up in figure 1. The SWs are generated at beamline ID19 of the European Synchrotron (ESRF) in Grenoble, France, and visualised using a polychromatic X-ray beam consisting of 60 ps pulses separated by 176 ns (equivalent to a pulse repetition rate of 5.68 MHz), with energies ranging between 20 and 50 keV and a mean of 30 keV (Rack et al. Reference Rack2024). The beam is produced by two axially aligned long-period U32 undulators (Weitkamp et al. Reference Weitkamp, Tafforeau, Boller, Cloetens, Valade, Bernard, Peyrin, Ludwig, Helfen and Baruchel2010). The X-rays are converted into visible light using a 250 $\unicode{x03BC}$
m-thick fast Hilger Crystals LYSO:Ce scintillator. The resulting light is split using a pellicle beam splitter and captured by two synchronised Shimadzu HPV-X2 high-speed cameras operating each at 5 million frames per second (Mfps). Both camera detectors record the visible scintillator emission and are positioned 11 m away from the samples. Each camera records 128 frames with an exposure time of 100 ns. The reason for using two cameras is to mitigate dark frames arising from the mismatch between the camera inter-frame time (200 ns) and the time between X-ray pulses (176 ns). The cameras are triggered with a relative offset of 100 ns so that their exposures sample different phases of the X-ray pulses. The final time-resolved image sequence is constructed by selecting, at each time, the brightest available frame (Strucka et al. Reference Strucka2023).
$\unicode{x03BC}$
m-thick fast Hilger Crystals LYSO:Ce scintillator. The resulting light is split using a pellicle beam splitter and captured by two synchronised Shimadzu HPV-X2 high-speed cameras operating each at 5 million frames per second (Mfps). Both camera detectors record the visible scintillator emission and are positioned 11 m away from the samples. Each camera records 128 frames with an exposure time of 100 ns. The reason for using two cameras is to mitigate dark frames arising from the mismatch between the camera inter-frame time (200 ns) and the time between X-ray pulses (176 ns). The cameras are triggered with a relative offset of 100 ns so that their exposures sample different phases of the X-ray pulses. The final time-resolved image sequence is constructed by selecting, at each time, the brightest available frame (Strucka et al. Reference Strucka2023).
Diagram of the test target sitting on the PPD, including view along the X-ray beam axis for the cylindrical (a) and semicylindrical (b) configurations.

The PPD consists of an Aerovox RTE model PX360E20 capacitor of 1.38 $\unicode{x03BC}$
F charged at an initial discharge voltage of 45 kV, yielding a stored energy of
$\unicode{x03BC}$
F charged at an initial discharge voltage of 45 kV, yielding a stored energy of $1.4$
kJ. A delay generator sends a synchronised voltage pulse to both cameras and a trigger unit, initiating the discharge of a dynamic high-voltage spike to the spark gaps of the PPD, which in turn causes the electrical discharge of the capacitor through the main electrode. This allows currents of up to 130 kA with rise times of
$1.4$
kJ. A delay generator sends a synchronised voltage pulse to both cameras and a trigger unit, initiating the discharge of a dynamic high-voltage spike to the spark gaps of the PPD, which in turn causes the electrical discharge of the capacitor through the main electrode. This allows currents of up to 130 kA with rise times of $0.35\,$
–
$0.35\,$
– $\,0.55\,\unicode{x03BC} \text{s}$
to be discharged into copper wire array loads, driving rapid phase transitions from solid to liquid, liquid to gas and gas to plasma on a sub-microsecond time scale. The explosion of the wires and their radial expansion generate individual SWs in the surrounding water, which overlap and lead to the formation of a converging cylindrical shock. The current is measured using a self-integrating Rogowski coil positioned between the spark gaps and the main electrode. The total voltage, accounting for both resistive and inductive components, is measured at the main electrode using a P6015A Tektronix high-voltage probe. Both current and voltage signals are recorded with a Lecroy WaveRunner 8404 M digital oscilloscope (Maler et al. Reference Maler2024).
$\,0.55\,\unicode{x03BC} \text{s}$
to be discharged into copper wire array loads, driving rapid phase transitions from solid to liquid, liquid to gas and gas to plasma on a sub-microsecond time scale. The explosion of the wires and their radial expansion generate individual SWs in the surrounding water, which overlap and lead to the formation of a converging cylindrical shock. The current is measured using a self-integrating Rogowski coil positioned between the spark gaps and the main electrode. The total voltage, accounting for both resistive and inductive components, is measured at the main electrode using a P6015A Tektronix high-voltage probe. Both current and voltage signals are recorded with a Lecroy WaveRunner 8404 M digital oscilloscope (Maler et al. Reference Maler2024).
The gelatine-filled test target, which contains the wire array and the bubble, is positioned on top of the main electrode inside a grounded stainless steel test chamber. It is electrically connected to the chamber’s top walls using a copper wire strip. A diagram of the target and wire load placed on the test chamber is shown in figure 2. The voltage is applied to a high-voltage (HV) electrode, which is connected through a wire array to a ground (GND) electrode. These electrodes have 16 mm holes through which the X-ray beam is directed horizontally. A 6 mm-diameter cylindrical air cavity is formed by inserting a rod coated with petroleum jelly along the target axis before casting the gelatine. After the gelatine cures, the rod is carefully withdrawn, leaving a smooth, cylindrically symmetric air channel. The gelatine target is enclosed in a 40 mm-diameter PVC tube. We use a 4 % in mass water–gelatine solution, which provides enough stiffness to maintain the shape of the cylindrical bubble. Two different experiments are performed, each of them exploding a different wire array. For the cylindrical configuration, 32 copper wires of 50 $\unicode{x03BC}$
m diameter are arranged in a cylindrical geometry (see figure 2
a), while 17 wires of 100
$\unicode{x03BC}$
m diameter are arranged in a cylindrical geometry (see figure 2
a), while 17 wires of 100 $\unicode{x03BC}$
m diameter are placed along the left half-circle for the semicylindrical case (see figure 2
b). Both wire arrays have length
$\unicode{x03BC}$
m diameter are placed along the left half-circle for the semicylindrical case (see figure 2
b). Both wire arrays have length $40\;\text{mm}$
and radius
$40\;\text{mm}$
and radius $8\;\text{mm}$
. The radiographs integrate along the finite axial extent of the target (40 mm). We assume that axial end effects are not dominant and that the shock–bubble interactions remain approximately quasi-two-dimensional. Residual three-dimensional end effects cannot be fully excluded and constitute a source of systematic uncertainty.
$8\;\text{mm}$
. The radiographs integrate along the finite axial extent of the target (40 mm). We assume that axial end effects are not dominant and that the shock–bubble interactions remain approximately quasi-two-dimensional. Residual three-dimensional end effects cannot be fully excluded and constitute a source of systematic uncertainty.
2.2. Numerical modelling
Numerical simulations are conducted to validate the experimental results and to unveil key physical mechanisms, particularly concerning the SW dynamics within the gas phase. This dynamics is not visible in the X-ray images because the density gradients are too small to generate sufficient contrast in air. The simulations employ a two-dimensional solver on a uniform Cartesian mesh, which solves the five-equation Navier–Stokes model (Perigaud & Saurel Reference Perigaud and Saurel2005), expressed as
 \begin{align} & \frac {\partial (\rho _1 \alpha _1)}{\partial t} + \boldsymbol{\nabla }\boldsymbol{\cdot }(\rho _1 \alpha _1 \boldsymbol{u}) = 0, \\[-28pt] \nonumber \end{align}
 \begin{align} & \frac {\partial (\rho _2 \alpha _2)}{\partial t} + \boldsymbol{\nabla }\boldsymbol{\cdot }(\rho _2 \alpha _2 \boldsymbol{u}) = 0, \\[-28pt] \nonumber \end{align}
 \begin{align} & \frac {\partial (\rho \boldsymbol{u})}{\partial t} + \boldsymbol{\nabla }\boldsymbol{\cdot }(\rho \boldsymbol{u} \boldsymbol{u} + p \boldsymbol{I}) - \boldsymbol{\nabla }\boldsymbol{\cdot }\boldsymbol{\tau } = 0, \\[-28pt] \nonumber \end{align}
 \begin{align} &\frac {\partial E}{\partial t} + \boldsymbol{\nabla }\boldsymbol{\cdot } [(E + p)\boldsymbol{u}] - \boldsymbol{\nabla }\boldsymbol{\cdot }(\boldsymbol{\tau } \boldsymbol{\cdot }\boldsymbol{u}) = 0, \\[-28pt] \nonumber \end{align}
 \begin{align} &\frac {\partial \alpha _1}{\partial t} + \boldsymbol{\nabla }\boldsymbol{\cdot }(\alpha _1 \boldsymbol{u}) - \alpha _1 \boldsymbol{\nabla }\boldsymbol{\cdot }\boldsymbol{u} = 0. \\[0pt] \nonumber \end{align}
Here, $\rho$
denotes the fluid density,
$\rho$
denotes the fluid density, $\alpha$
the volume fraction,
$\alpha$
the volume fraction, $\boldsymbol{u}$
the velocity vector,
$\boldsymbol{u}$
the velocity vector, $p$
the pressure field,
$p$
the pressure field, $\boldsymbol{I}$
the identity matrix,
$\boldsymbol{I}$
the identity matrix, $\boldsymbol{\tau }$
the stress tensor and
$\boldsymbol{\tau }$
the stress tensor and $E$
the total energy per unit volume. Subscripts 1 and 2 refer to water and air, respectively, while the absence of a subscript indicates mixture properties. For simplicity, the water–gelatine solution used in the experiments is modelled as pure water, since at the shock pressures applied, the viscoelastic properties of gelatine are negligible and the material effectively liquefies (Bakhrakh et al. Reference Bakhrakh1997). Small discrepancies are expected in the equation of state (EOS) of the gelatine solution compared with water, but these are assumed to be negligible due to the relatively low concentration (4 %) of gelatine (Nagayama et al. Reference Nagayama, Mori, Motegi and Nakahara2006; Gojani et al. Reference Gojani, Ohtani, Takayama and Hosseini2016). The total energy
$E$
the total energy per unit volume. Subscripts 1 and 2 refer to water and air, respectively, while the absence of a subscript indicates mixture properties. For simplicity, the water–gelatine solution used in the experiments is modelled as pure water, since at the shock pressures applied, the viscoelastic properties of gelatine are negligible and the material effectively liquefies (Bakhrakh et al. Reference Bakhrakh1997). Small discrepancies are expected in the equation of state (EOS) of the gelatine solution compared with water, but these are assumed to be negligible due to the relatively low concentration (4 %) of gelatine (Nagayama et al. Reference Nagayama, Mori, Motegi and Nakahara2006; Gojani et al. Reference Gojani, Ohtani, Takayama and Hosseini2016). The total energy $E$
is expressed as the sum of the specific internal energy
$E$
is expressed as the sum of the specific internal energy $e$
and the kinetic energy
$e$
and the kinetic energy
 \begin{align} E = \rho e + \frac {1}{2}\rho \boldsymbol{u}\boldsymbol{\cdot }\boldsymbol{u}. \end{align}
These equations incorporate viscous processes through the dynamic viscosity $\mu$
and spatial derivatives of the velocity field as
$\mu$
and spatial derivatives of the velocity field as
 \begin{gather} \tau _{xx} = 2 \mu u_x - \frac {2}{3} \mu \big (u_x + v_y \big ), \quad \tau _{yy} = 2 \mu v_y - \frac {2}{3} \mu \big (u_x + v_y \big ) \nonumber \\ \text{and}\quad \tau _{xy} = \mu \big ( u_y + v_x \big ), \end{gather}
with $\mu _1 = 8.9\times 10^{-4}\;\text{Pa}\, \text{s}$
for water, while for air Sutherland’s law is employed (White & Majdalani Reference White and Majdalani2006)
$\mu _1 = 8.9\times 10^{-4}\;\text{Pa}\, \text{s}$
for water, while for air Sutherland’s law is employed (White & Majdalani Reference White and Majdalani2006)
 \begin{align} \mu _2 = \mu _0 \left (\frac {T}{T_0}\right )^{3/2}\frac {T_0 + S}{T + S}. \end{align}
The constants above are $\mu _0 = 1.716\times 10^{-5}\,\rm {N s\,m}^{-2}$
,
$\mu _0 = 1.716\times 10^{-5}\,\rm {N s\,m}^{-2}$
, $T_0 = 273\,\text{K}$
and
$T_0 = 273\,\text{K}$
and $S = 111\,\text{K}$
for air. The system of equations is completed using the Tait EOS for compressible fluids (Apazidis Reference Apazidis2016)
$S = 111\,\text{K}$
for air. The system of equations is completed using the Tait EOS for compressible fluids (Apazidis Reference Apazidis2016)
 \begin{align} p(\rho ) = (p_{{0}} + B)\left (\frac {\rho }{\rho _{{0}}}\right )^\gamma - B, \end{align}
where $\gamma$
and
$\gamma$
and $B$
are the specific-heat ratio and stiffness parameter of the mixture, respectively. The initial pressure is
$B$
are the specific-heat ratio and stiffness parameter of the mixture, respectively. The initial pressure is $p_0 = 10^5 \;\text{Pa}$
, and the initial density
$p_0 = 10^5 \;\text{Pa}$
, and the initial density $\rho _{0}$
is 998.2 and 1.2 kg m−
$\rho _{0}$
is 998.2 and 1.2 kg m− $^3$
for water and air, respectively. The EOS can be rewritten into a function of density and internal energy (Shyue Reference Shyue2004)
$^3$
for water and air, respectively. The EOS can be rewritten into a function of density and internal energy (Shyue Reference Shyue2004)
 \begin{align} p(\rho ,e) = (\gamma -1)\rho \left (e+\frac {B}{\rho _0}\right )-\gamma B. \end{align}
The mixture $\gamma$
and
$\gamma$
and $B$
can be estimated using the mixture ratios as
$B$
can be estimated using the mixture ratios as
 \begin{align} \frac {1}{\gamma -1} & = \frac {\alpha _1}{\gamma _1-1} + \frac {\alpha _2}{\gamma _2-1} , \\[-9pt] \nonumber \end{align}
 \begin{align} \frac {\gamma B}{\gamma -1} & = \frac {\alpha _1 \gamma _1 B_1}{\gamma _1-1} + \frac {\alpha _2 \gamma _2 B_2}{\gamma _2-1}, \\[9pt] \nonumber \end{align}
with $\gamma _1 = 6.68$
,
$\gamma _1 = 6.68$
, $\gamma _2 = 1.40$
,
$\gamma _2 = 1.40$
, $B_1 = 4.05\times 10^8\,\text{Pa}$
and
$B_1 = 4.05\times 10^8\,\text{Pa}$
and $B_2 = 0\,\text{Pa}$
. Then, the total density and viscosity of the mixture are given as
$B_2 = 0\,\text{Pa}$
. Then, the total density and viscosity of the mixture are given as
 \begin{align} \rho & = \alpha _1\rho _1 + \alpha _2 \rho _2, \\[-9pt] \nonumber \end{align}
 \begin{align} \mu & = \alpha _1\mu _1 + \alpha _2 \mu _2, \\[9pt] \nonumber \end{align}
and its speed of sound as
 \begin{align} a = \sqrt {\frac {\gamma \left (p+B\right )}{\rho }}. \end{align}
The spatial discretisation employs a fifth-order incremental stencil weighted essentially non-oscillatory scheme for resolving flow structures, combined with the tangent of hyperbola for interface capture method to maintain sharp fluid interfaces (Zhang et al. Reference Zhang, Fleischmann, Adami and Adams2024). For the semicylindrical-to-cylindrical case, fluxes are computed within the finite volume framework using the Harten–Lax–van Leer contact (HLLC) approximate Riemann solver (Zhang et al. Reference Zhang, Fleischmann, Adami and Adams2024). In contrast, the cylindrical-to-cylindrical case uses the modified artificial upstream flux vector splitting scheme (AUFS) introduced by Sun & Takayama (Reference Sun and Takayama2003), which considers two artificial wave speeds into the flux decomposition to control the direction of wave propagation. This choice is motivated by the observation that AUFS yields more symmetrical interface deformations, making it preferable for nearly symmetric bubble collapse configurations, whereas HLLC is better suited to asymmetric cases. Time integration is performed using a sixth-order explicit Runge–Kutta method (Luther Reference Luther1968).
Selected frames from the experiments showing converging cylindrical (a) and semicylindrical (b) SWs interacting with cylindrical bubbles on a gelatine–air interface.

3. Results
3.1. X-ray images and electrical waveforms
We include selected frames of the two experiments in figure 3. The field of view is $12.8\,\times \,8\;\text{mm}$
, the spatial resolution is
$12.8\,\times \,8\;\text{mm}$
, the spatial resolution is $32 \;\unicode{x03BC} \text{m}\,\text{pixel}^{-1}$
and the zero time reference corresponds to the current initiation time. Note that the temporal resolution of the images is set by the 60 ps X-ray pulse and not by the 100 ns camera exposure.
$32 \;\unicode{x03BC} \text{m}\,\text{pixel}^{-1}$
and the zero time reference corresponds to the current initiation time. Note that the temporal resolution of the images is set by the 60 ps X-ray pulse and not by the 100 ns camera exposure.
The cylindrical-to-cylindrical case is shown in figure 3(a), i.e. an azimuthally symmetric, cylindrically converging SW impinging on a coaxial cylindrical bubble. The incident shock impingement on the bubble occurs at ${\sim}$
3.8
${\sim}$
3.8 $\unicode{x03BC}$
s with a Mach number of
$\unicode{x03BC}$
s with a Mach number of $1.35\pm 0.05$
(referenced to the speed of sound of water of 1498 m s−1). After impact, the bubble interface is driven inwards, and several RMI spikes appear. The emergence of these spikes may reflect weak experimental asymmetries in the incident shock, rather than being an intrinsic feature of the interaction. Converging cylindrical shocks are known to be highly sensitive to small departures from axisymmetry. A frequent low-order response is the formation of polygonal shock fronts, such as triangular (mode-3) and square-like (mode-4) shapes, which have been reported in converging shock experiments and attributed to weak asymmetries in the initial conditions (Takayama, Kleine & Grönig Reference Takayama, Kleine and Grönig1987). Such shock reshaping has been studied in air through dedicated polygonal reshaping experiments (Eliasson et al. Reference Eliasson, Apazidis and Tillmark2007a
,
Reference Eliasson, Kjellander and Apazidisb
; Apazidis & Eliasson Reference Apazidis and Eliasson2019), and the existence of analogous behaviour in liquids has been observed (Rojas Mata et al. Reference Rojas Mata, Hernández Garcia and Liverts2026). In the present experiment, the observed pattern is qualitatively consistent with a shock front that is weakly destabilised prior to impact, imprinting a dominant mode-4 component on the interface, possibly accompanied by a secondary mode-8 contribution. These components could arise from weak symmetry-breaking effects in the wire-driven driver, for example from a fourfold bias introduced by the electrode contact screws or from harmonics associated with the discrete number of wires. Once seeded, such azimuthal structures can remain coherent and be amplified during convergence, even for high-order perturbations (Apazidis & Eliasson Reference Apazidis and Eliasson2019; Sauppe et al. Reference Sauppe2020).
$1.35\pm 0.05$
(referenced to the speed of sound of water of 1498 m s−1). After impact, the bubble interface is driven inwards, and several RMI spikes appear. The emergence of these spikes may reflect weak experimental asymmetries in the incident shock, rather than being an intrinsic feature of the interaction. Converging cylindrical shocks are known to be highly sensitive to small departures from axisymmetry. A frequent low-order response is the formation of polygonal shock fronts, such as triangular (mode-3) and square-like (mode-4) shapes, which have been reported in converging shock experiments and attributed to weak asymmetries in the initial conditions (Takayama, Kleine & Grönig Reference Takayama, Kleine and Grönig1987). Such shock reshaping has been studied in air through dedicated polygonal reshaping experiments (Eliasson et al. Reference Eliasson, Apazidis and Tillmark2007a
,
Reference Eliasson, Kjellander and Apazidisb
; Apazidis & Eliasson Reference Apazidis and Eliasson2019), and the existence of analogous behaviour in liquids has been observed (Rojas Mata et al. Reference Rojas Mata, Hernández Garcia and Liverts2026). In the present experiment, the observed pattern is qualitatively consistent with a shock front that is weakly destabilised prior to impact, imprinting a dominant mode-4 component on the interface, possibly accompanied by a secondary mode-8 contribution. These components could arise from weak symmetry-breaking effects in the wire-driven driver, for example from a fourfold bias introduced by the electrode contact screws or from harmonics associated with the discrete number of wires. Once seeded, such azimuthal structures can remain coherent and be amplified during convergence, even for high-order perturbations (Apazidis & Eliasson Reference Apazidis and Eliasson2019; Sauppe et al. Reference Sauppe2020).
The semicylindrical-to-cylindrical configuration is shown in figure 3(b), namely, half of a cylindrical shock front impinging on a cylindrical bubble placed coaxially at the focal point. The shock Mach number at the time of impact ( ${\sim}$
3.4
${\sim}$
3.4 $\unicode{x03BC}$
s) is
$\unicode{x03BC}$
s) is $1.45\pm 0.05$
. A supersonic jet is generated (referenced to the speed of sound of air of 343 m s−1), moving at 885
$1.45\pm 0.05$
. A supersonic jet is generated (referenced to the speed of sound of air of 343 m s−1), moving at 885 $\pm$
30 m s−1. Micrometre-scale RMI spikes are observed during the jet formation process, which are caused by the interaction of the incident shock with the geometrical imperfections of the bubble surface.
$\pm$
30 m s−1. Micrometre-scale RMI spikes are observed during the jet formation process, which are caused by the interaction of the incident shock with the geometrical imperfections of the bubble surface.
The electrical waveforms of the explosions are essential both for assessing the repeatability of the experiments and for verifying their successful development. The discharge current $I$
is measured directly using the Rogowski coil, and the total voltage
$I$
is measured directly using the Rogowski coil, and the total voltage $V$
is measured using the HV probe. To calculate the resistive voltage (
$V$
is measured using the HV probe. To calculate the resistive voltage ( $V_R$
), we subtract the contribution of the inductive voltage (
$V_R$
), we subtract the contribution of the inductive voltage ( $V_L = L( {{\rm d}I}/{{\rm d}t})$
) from
$V_L = L( {{\rm d}I}/{{\rm d}t})$
) from $V$
, i.e.
$V$
, i.e. $V_R = V - L( {{\rm d}I}/{{\rm d}t})$
. The inductances of the wire arrays
$V_R = V - L( {{\rm d}I}/{{\rm d}t})$
. The inductances of the wire arrays $L$
are estimated by fitting the early-time discharge total voltage to
$L$
are estimated by fitting the early-time discharge total voltage to $V = L( {{\rm d}I}/{{\rm d}t})+ IR_0$
, with
$V = L( {{\rm d}I}/{{\rm d}t})+ IR_0$
, with $R_0$
being the initial load resistance computed as the equivalent resistance of the wires in the array connected in parallel. This yields inductances of
$R_0$
being the initial load resistance computed as the equivalent resistance of the wires in the array connected in parallel. This yields inductances of $34$
nH for the cylindrical load and
$34$
nH for the cylindrical load and $38$
nH for the semicylindrical load. We then calculate the Joule-heating power as
$38$
nH for the semicylindrical load. We then calculate the Joule-heating power as $P = IV_R$
, and obtain the energy delivered to the load by integrating
$P = IV_R$
, and obtain the energy delivered to the load by integrating $P$
in time. We include the results of this analysis in figure 4. The cylindrical explosion reaches a maximum current of 137 kA, a resistive voltage of 37 kV, a peak power of 3.2 GW and an energy deposition of 410 J. The current rises for
$P$
in time. We include the results of this analysis in figure 4. The cylindrical explosion reaches a maximum current of 137 kA, a resistive voltage of 37 kV, a peak power of 3.2 GW and an energy deposition of 410 J. The current rises for ${\sim} 0.35\,\unicode{x03BC} \text{s}$
up to the first peak, and the maximum resistive voltage occurs at
${\sim} 0.35\,\unicode{x03BC} \text{s}$
up to the first peak, and the maximum resistive voltage occurs at ${\sim} 0.40\,\unicode{x03BC} \text{s}$
. The semicylindrical explosion reaches 132 kA, 51 kV, 5.7 GW and 1150 J, with a current rise time of
${\sim} 0.40\,\unicode{x03BC} \text{s}$
. The semicylindrical explosion reaches 132 kA, 51 kV, 5.7 GW and 1150 J, with a current rise time of ${\sim} 0.55\,\unicode{x03BC} \text{s}$
and a time to maximum resistive voltage of
${\sim} 0.55\,\unicode{x03BC} \text{s}$
and a time to maximum resistive voltage of ${\sim} 0.65\,\unicode{x03BC} \text{s}$
. The cylindrical explosion has current restrike since it is under-massed, i.e. it does not employ the energy stored in the capacitors efficiently, thereby using only
${\sim} 0.65\,\unicode{x03BC} \text{s}$
. The cylindrical explosion has current restrike since it is under-massed, i.e. it does not employ the energy stored in the capacitors efficiently, thereby using only ${\sim} 30\,\%$
of the available energy compared with
${\sim} 30\,\%$
of the available energy compared with ${\sim} 82\,\%$
for the semicylindrical case. This is consistent with a lower SW Mach number for the cylindrical load (
${\sim} 82\,\%$
for the semicylindrical case. This is consistent with a lower SW Mach number for the cylindrical load ( $1.35\pm 0.05$
) than for the semicylindrical case (
$1.35\pm 0.05$
) than for the semicylindrical case ( $1.45\pm 0.05$
).
$1.45\pm 0.05$
).
Waveforms of the current (a), resistive voltage (b), power (c) and deposited energy (d) for both the cylindrical and semicylindrical wire array explosions.

The electrical energy density depositions are 18.2 $\text{kJ}\,\text{g}^{-1}$
(or 12.0
$\text{kJ}\,\text{g}^{-1}$
(or 12.0 $\text{eV}\,\text{atom}^{-1}$
) and 19.2
$\text{eV}\,\text{atom}^{-1}$
) and 19.2 $\text{kJ}\,\text{g}^{-1}$
(or 12.6
$\text{kJ}\,\text{g}^{-1}$
(or 12.6 $\text{eV}\,\text{atom}^{-1}$
) for the cylindrical and semicylindrical cases, respectively, showing that, despite the cylindrical load not having enough mass to employ all the energy stored in the capacitors, it reaches a comparable energy density deposition to the semicylindrical case. The current density
$\text{eV}\,\text{atom}^{-1}$
) for the cylindrical and semicylindrical cases, respectively, showing that, despite the cylindrical load not having enough mass to employ all the energy stored in the capacitors, it reaches a comparable energy density deposition to the semicylindrical case. The current density $j$
of the discharge peaks at
$j$
of the discharge peaks at ${\sim} 2 \times 10^{12}$
A m−
${\sim} 2 \times 10^{12}$
A m− $^2$
for the cylindrical load and
$^2$
for the cylindrical load and ${\sim} 1 \times 10^{12}$
A m−
${\sim} 1 \times 10^{12}$
A m− $^2$
for the semicylindrical case, both sufficient to generate fast electrical explosions (Sedoi et al. Reference Sedoi, Mesyats, Oreshkin, Valevich and Chemezova2002). The specific current action integral, defined as
$^2$
for the semicylindrical case, both sufficient to generate fast electrical explosions (Sedoi et al. Reference Sedoi, Mesyats, Oreshkin, Valevich and Chemezova2002). The specific current action integral, defined as $\int _0^{\tau _{{exp}}} j^2 {\rm d}t$
, where
$\int _0^{\tau _{{exp}}} j^2 {\rm d}t$
, where $\tau _{{exp}}$
is the explosion time taken as the time to maximum resistive voltage (Burtsev, Kalinin & Luchinsky Reference Burtsev, Kalinin and Luchinsky1990), yields
$\tau _{{exp}}$
is the explosion time taken as the time to maximum resistive voltage (Burtsev, Kalinin & Luchinsky Reference Burtsev, Kalinin and Luchinsky1990), yields $2.6 \times 10^9\,\text{A}^2\,\text{s}\,\text{cm}^{-4}$
for the cylindrical load and
$2.6 \times 10^9\,\text{A}^2\,\text{s}\,\text{cm}^{-4}$
for the cylindrical load and $2.9 \times 10^9\,\text{A}^2\,\text{s}\,\text{cm}^{-4}$
for the semicylindrical case, in good agreement with the tabulated range of
$2.9 \times 10^9\,\text{A}^2\,\text{s}\,\text{cm}^{-4}$
for the semicylindrical case, in good agreement with the tabulated range of $2\,{-}\,4 \times 10^9\,\text{A}^2\,\text{s}\,\text{cm}^{-4}$
expected for explosions with high energy deposition (Oreshkin & Baksht Reference Oreshkin and Baksht2020). The characteristic penetration depth of the current (skin depth) (Keller Reference Keller2023) is estimated to be
$2\,{-}\,4 \times 10^9\,\text{A}^2\,\text{s}\,\text{cm}^{-4}$
expected for explosions with high energy deposition (Oreshkin & Baksht Reference Oreshkin and Baksht2020). The characteristic penetration depth of the current (skin depth) (Keller Reference Keller2023) is estimated to be $110\,\unicode{x03BC}$
m, which is
$110\,\unicode{x03BC}$
m, which is ${\sim} 4$
and
${\sim} 4$
and ${\sim} 2$
times the radii of the
${\sim} 2$
times the radii of the $\varnothing 50$
and
$\varnothing 50$
and $\varnothing 100$ $\unicode{x03BC}$
m wires used in the experiments, respectively.
$\unicode{x03BC}$
m wires used in the experiments, respectively.
3.2. Cylindrical-to-cylindrical configuration
In this section, we compare the experimental radiography and the numerical simulations for the cylindrical-to-cylindrical case. The HD simulations are performed on a uniform Cartesian grid containing nine million elements, with element centres spaced by 10 $\unicode{x03BC}$
m. To initiate the simulations, a high-pressure region of water is modelled using 32 cylinders of approximately 1 mm diameter, each at a pressure of 750 MPa. These initial conditions were not chosen from first principles but were iteratively adjusted to reproduce the resulting experimental dynamics with good fidelity, consistently with the order of magnitude of near-field pressures predicted in single-wire explosions (Hernández Garcia et al. Reference Hernández Garcia, Rojas Mata, Apazidis and Liverts2025). The expanding high-pressure region emulates the behaviour of the exploding wires in the array, assuming that the continuous compression waves emitted during the wire expansion exert minimal influence on the trajectory of the primary shock. That is, we assume the magnetohydrodynamic (MHD) process can be approximated by an analogous HD process at sufficiently large distances from the explosion source. Previous work (Rososhek et al. Reference Rososhek, Efimov, Tewari, Yanuka, Khishchenko and Krasik2018; Hernández Garcia et al. Reference Hernández Garcia, Rojas Mata, Apazidis and Liverts2025) indicates that this assumption is valid only at distances greater than approximately
$\unicode{x03BC}$
m. To initiate the simulations, a high-pressure region of water is modelled using 32 cylinders of approximately 1 mm diameter, each at a pressure of 750 MPa. These initial conditions were not chosen from first principles but were iteratively adjusted to reproduce the resulting experimental dynamics with good fidelity, consistently with the order of magnitude of near-field pressures predicted in single-wire explosions (Hernández Garcia et al. Reference Hernández Garcia, Rojas Mata, Apazidis and Liverts2025). The expanding high-pressure region emulates the behaviour of the exploding wires in the array, assuming that the continuous compression waves emitted during the wire expansion exert minimal influence on the trajectory of the primary shock. That is, we assume the magnetohydrodynamic (MHD) process can be approximated by an analogous HD process at sufficiently large distances from the explosion source. Previous work (Rososhek et al. Reference Rososhek, Efimov, Tewari, Yanuka, Khishchenko and Krasik2018; Hernández Garcia et al. Reference Hernández Garcia, Rojas Mata, Apazidis and Liverts2025) indicates that this assumption is valid only at distances greater than approximately $1\,{-}\,2$
mm from the exploding wires, beyond which the SWs begin to behave self-similarly. We do not attempt a first-principles MHD prediction for the full array, since this would require modelling multi-wire interactions and associated electromagnetic coupling effects (Wang et al. Reference Wang, Zhang, Jiang, Wang and Shi2020), whereas the present study focuses on the shock evolution where the HD approximation is expected to be valid.
$1\,{-}\,2$
mm from the exploding wires, beyond which the SWs begin to behave self-similarly. We do not attempt a first-principles MHD prediction for the full array, since this would require modelling multi-wire interactions and associated electromagnetic coupling effects (Wang et al. Reference Wang, Zhang, Jiang, Wang and Shi2020), whereas the present study focuses on the shock evolution where the HD approximation is expected to be valid.
The comparison between the experimental X-ray images and numerical schlieren is presented in figure 5. We highlight with a white line the mean interface position extracted from the experimental images to account for the variability caused by the four RMI spikes. These features do not appear in the simulations due to the perfectly symmetric geometry of the incident cylindrical shock. In contrast to the near-discontinuous real interface, the simulated interface spans a finite region over which the mixture density changes rapidly. To visualise both fluids and their interface clearly with our numerical schlieren method, we arbitrarily pick a cutoff density (e.g. the midpoint between the two fluid densities) and band-pass filter the density field into ‘lower-density’ and ‘higher-density’ ranges. This lets us render each fluid separately by accounting for the numerical variability in the position of the interface and makes the overall flow structures much clearer. For each simulated density range, we construct a schlieren-like edge-enhanced representation by taking the logarithmic value of the normalised density gradient variation. While this mimics optical schlieren imaging (based on $\boldsymbol{\nabla }\!\rho$
), the experimental X-ray images are in fact phase-contrast images that depend on the Laplacian of the line-integrated density. The analogy is therefore only approximate but provides a consistent way to highlight sharp density gradients in the simulations. The numerical schlieren image
$\boldsymbol{\nabla }\!\rho$
), the experimental X-ray images are in fact phase-contrast images that depend on the Laplacian of the line-integrated density. The analogy is therefore only approximate but provides a consistent way to highlight sharp density gradients in the simulations. The numerical schlieren image $s$
is computed as
$s$
is computed as
 \begin{align} s\;=\; \log \left (\frac {|\boldsymbol{\nabla }\!\rho | \;-\;\min |\boldsymbol{\nabla }\!\rho |}{\max |\boldsymbol{\nabla }\!\rho | \;-\;\min |\boldsymbol{\nabla }\!\rho |}\right ). \end{align}
Experimental X-ray images (top) and numerical schlieren (bottom) at different times for the cylindrical-to-cylindrical case. The labels denote: IS (incident SW); TS1 (transmitted SW 1); CL1 (compression layer 1); RS1 (reflected SW 1); TS2 (transmitted SW 2); and CL2 (compression layer 2).

When the incident shock impinges on the bubble surface at ${\sim} 3.8 \; \unicode{x03BC}$
s, it generates a first compression layer of high density and pressure outside the interface, setting it into motion. At the same time, the shock transmits into the bubble and continues converging towards the centre, while a rarefaction wave reflects back into the surrounding medium. The transmitted shock converges at the geometrical focus at
${\sim} 3.8 \; \unicode{x03BC}$
s, it generates a first compression layer of high density and pressure outside the interface, setting it into motion. At the same time, the shock transmits into the bubble and continues converging towards the centre, while a rarefaction wave reflects back into the surrounding medium. The transmitted shock converges at the geometrical focus at ${\sim} 5.5 \; \unicode{x03BC}$
s and then reflects radially outward. When this reflected shock encounters the inward-moving interface, a second compression layer forms at
${\sim} 5.5 \; \unicode{x03BC}$
s and then reflects radially outward. When this reflected shock encounters the inward-moving interface, a second compression layer forms at ${\sim} 6.9 \; \unicode{x03BC}$
s due to a water hammer effect created by the impedance mismatch upon collision. This interaction generates a second transmitted shock that propagates outward, while the interface continues its inward collapse and the water–gelatine flow remains directed toward the cylinder axis. The total collapse time of the bubble is
${\sim} 6.9 \; \unicode{x03BC}$
s due to a water hammer effect created by the impedance mismatch upon collision. This interaction generates a second transmitted shock that propagates outward, while the interface continues its inward collapse and the water–gelatine flow remains directed toward the cylinder axis. The total collapse time of the bubble is ${\sim} 5.1 \; \unicode{x03BC}$
s. In our computations, negative pressures are limited to avoid numerical instabilities near the interface. Allowing for lower pressures would require modelling complex phenomena such as molecular tension and cavitation. In pure water, homogeneous vapour nucleation occurs at approximately −134 MPa (Fisher Reference Fisher1948), at which point liquid rupture prevents further pressure decrease. In contrast, heterogeneous nucleation in impure water can occur at much higher pressures, up to approximately −0.1 MPa (Bokman et al. Reference Bokman, Fiorini, Strucka, Lukić, Bland, Mughal, Liu, Rack and Supponen2025). To avoid triggering these phenomena, we cap the computed pressure at −0.1 MPa, holding it constant thereafter. A more accurate representation of negative-pressure effects would require cavitation models, such as the Zwart–Gerber–Belamri, Schnerr–Sauer or Merkle model (Niedźwiedzka et al. Reference Niedźwiedzka, Schnerr and Sobieski2016), which account for the vapour bubble dynamics and phase change in the liquid phase. However, incorporating such detailed modelling lies beyond the scope of this study. By limiting negative pressures, the numerical schlieren can make the first compression layer appear artificially sharp, and the interface may over-accelerate non-physically.
${\sim} 5.1 \; \unicode{x03BC}$
s. In our computations, negative pressures are limited to avoid numerical instabilities near the interface. Allowing for lower pressures would require modelling complex phenomena such as molecular tension and cavitation. In pure water, homogeneous vapour nucleation occurs at approximately −134 MPa (Fisher Reference Fisher1948), at which point liquid rupture prevents further pressure decrease. In contrast, heterogeneous nucleation in impure water can occur at much higher pressures, up to approximately −0.1 MPa (Bokman et al. Reference Bokman, Fiorini, Strucka, Lukić, Bland, Mughal, Liu, Rack and Supponen2025). To avoid triggering these phenomena, we cap the computed pressure at −0.1 MPa, holding it constant thereafter. A more accurate representation of negative-pressure effects would require cavitation models, such as the Zwart–Gerber–Belamri, Schnerr–Sauer or Merkle model (Niedźwiedzka et al. Reference Niedźwiedzka, Schnerr and Sobieski2016), which account for the vapour bubble dynamics and phase change in the liquid phase. However, incorporating such detailed modelling lies beyond the scope of this study. By limiting negative pressures, the numerical schlieren can make the first compression layer appear artificially sharp, and the interface may over-accelerate non-physically.
Experimental and simulated position of the bubble interface (a), and simulated position of the SW compared with the Guderley and Chester–Chisnell–Whitham (CCW) non-ideal solutions (b) for the cylindrical-to-cylindrical case. The experimental data show the mean interface position over time, with the variability capturing the spread of the RMI spike positions.

Figure 6(a) shows the position of the interface during convergence, comparing experiments and simulations with the cylindrical Gilmore-type equation for bubble pulsation in a compressible liquid, developed by Kedrinskii (Reference Kedrinskii2005) for arbitrary geometries. In the spherical case and under weak-compressibility assumptions, this formulation reduces to the Keller–Miksis equation (Keller & Miksis Reference Keller and Miksis1980; Bokman et al. Reference Bokman, Biasiori-Poulanges, Meyer and Supponen2023). In its general formulation, the Gilmore-type equation reads
 \begin{align} \left (1-\frac {\dot {R}}{a_L}\right )R\ddot {R} + \left (1-\frac {\dot {R}}{3a_L}\right )\frac {3\nu }{4}\dot {R}^2 = \left (1+\frac {\dot {R}}{a_L}\right )\frac {\nu }{2}H + \left (1-\frac {\dot {R}}{a_L}\right )\frac {R}{a_L}\dot {H}, \end{align}
where $R$
is the radius of the bubble,
$R$
is the radius of the bubble, $a_L$
is the speed of sound at the bubble wall (taken as a constant 1498 m s−1),
$a_L$
is the speed of sound at the bubble wall (taken as a constant 1498 m s−1), $H$
is the difference between specific enthalpy at the bubble wall and at infinity and
$H$
is the difference between specific enthalpy at the bubble wall and at infinity and $\nu$
is a geometrical parameter. The cavity can be planar (
$\nu$
is a geometrical parameter. The cavity can be planar ( $\nu = 0$
), cylindrical (
$\nu = 0$
), cylindrical ( $\nu = 1$
) or spherical (
$\nu = 1$
) or spherical ( $\nu = 2$
); we use the cylindrical form (
$\nu = 2$
); we use the cylindrical form ( $\nu = 1$
), whose accuracy is expected to be lower than for the spherical case (Ilinskii et al. Reference Ilinskii, Zabolotskaya, Hay and Hamilton2012). The specific enthalpy difference can be computed as
$\nu = 1$
), whose accuracy is expected to be lower than for the spherical case (Ilinskii et al. Reference Ilinskii, Zabolotskaya, Hay and Hamilton2012). The specific enthalpy difference can be computed as $H = (p_L-p_{\infty } )/\rho _0$
, with
$H = (p_L-p_{\infty } )/\rho _0$
, with $\rho _0$
being the undisturbed water density, and the pressure on the liquid side of the cylindrical gas bubble (neglecting surface tension and viscosity) can be estimated as
$\rho _0$
being the undisturbed water density, and the pressure on the liquid side of the cylindrical gas bubble (neglecting surface tension and viscosity) can be estimated as $p_L \approx p_0 ({R_0}/{R} )^{2\gamma }$
, with
$p_L \approx p_0 ({R_0}/{R} )^{2\gamma }$
, with $R_0$
being the initial bubble radius. The term
$R_0$
being the initial bubble radius. The term $p_{\infty }$
is a function of time and is calculated in the simulations as the pressure 1 mm upstream in the direction of the incident shock. This choice gave the most accurate results, yielding a pressure peak at 470 MPa with a positive phase lasting 0.9
$p_{\infty }$
is a function of time and is calculated in the simulations as the pressure 1 mm upstream in the direction of the incident shock. This choice gave the most accurate results, yielding a pressure peak at 470 MPa with a positive phase lasting 0.9 $\unicode{x03BC}$
s. We observe from figure 6(a) that, following shock impingement, the interface accelerates rapidly to an average speed of
$\unicode{x03BC}$
s. We observe from figure 6(a) that, following shock impingement, the interface accelerates rapidly to an average speed of $560\;\rm {m\,s}^{-1}$
, with an asymmetrical uncertainty ranging from
$560\;\rm {m\,s}^{-1}$
, with an asymmetrical uncertainty ranging from $-10\;\rm$
to
$-10\;\rm$
to $+30\;\rm {m\,s}^{-1}$
, maintaining this velocity throughout the convergence. In the simulation, the interface is represented by a region of rapidly changing density rather than a sharp boundary. This makes the simulated interface challenging to track near the focus because of the rapid increase in density and pressure at the centre as the interface converges. Furthermore, between 5 and 7
$+30\;\rm {m\,s}^{-1}$
, maintaining this velocity throughout the convergence. In the simulation, the interface is represented by a region of rapidly changing density rather than a sharp boundary. This makes the simulated interface challenging to track near the focus because of the rapid increase in density and pressure at the centre as the interface converges. Furthermore, between 5 and 7 $\unicode{x03BC}$
s, the simulations exhibit a slightly higher acceleration than expected, which may be a consequence of limiting the negative phases of the pressure field.
$\unicode{x03BC}$
s, the simulations exhibit a slightly higher acceleration than expected, which may be a consequence of limiting the negative phases of the pressure field.
We now examine the simulated position of the first transmitted shock as it converges within the bubble, as shown in figure 6(b). The initial simulated speed of the SW is $1670 \pm 170$
m s−1 (Mach
$1670 \pm 170$
m s−1 (Mach $4.87 \pm 0.50$
), whereas the final speed is mesh-dependent. In order to assess the self-similarity of the simulated shock, we use the solution proposed by Guderley (Reference Guderley1942)
$4.87 \pm 0.50$
), whereas the final speed is mesh-dependent. In order to assess the self-similarity of the simulated shock, we use the solution proposed by Guderley (Reference Guderley1942)
 \begin{align} \frac {r}{r_i} = \left (1-\frac {t}{t^*}\right )^\alpha \;. \end{align}
Here, $r_i$
is the initial radius of the shock and
$r_i$
is the initial radius of the shock and $t^*$
the time necessary for convergence, fitted from simulation data. The Guderley coefficient
$t^*$
the time necessary for convergence, fitted from simulation data. The Guderley coefficient $\alpha$
is taken as
$\alpha$
is taken as $\alpha = 0.834$
, corresponding to cylindrical convergence of air and assuming perfect diatomic gas, which is consistent with the simulations. Good agreement is found between the simulated results and the Guderley solution, indicating that the simulated transmitted shock behaves self-similarly. Previous work (Bhardwaj et al. Reference Bhardwaj, Rojas Mata, Apazidis and Liverts2024) found that the value of the Guderley exponent
$\alpha = 0.834$
, corresponding to cylindrical convergence of air and assuming perfect diatomic gas, which is consistent with the simulations. Good agreement is found between the simulated results and the Guderley solution, indicating that the simulated transmitted shock behaves self-similarly. Previous work (Bhardwaj et al. Reference Bhardwaj, Rojas Mata, Apazidis and Liverts2024) found that the value of the Guderley exponent $\alpha$
must be increased by approximately 3
$\alpha$
must be increased by approximately 3 $\,\%$
to accurately capture the reduced acceleration resulting from real-gas effects, which in turn slows the overall convergence process. Liverts & Apazidis (Reference Liverts and Apazidis2016) showed that excitation, dissociation, ionisation and radiation significantly limit the attainable thermodynamic conditions at the convergence point, reducing the maximum temperature by roughly an order of magnitude, and thereby lowering the achievable pressure and density. Neither simulations nor the self-similar solution (based on the perfect gas EOS) can accurately capture this reduced acceleration due to real-gas effects. To estimate the thermodynamic conditions near the focus, we recompute the shock trajectory using the SESAME 5031 EOS model (Lyon Reference Lyon1978), combined with a pressure and temperature-dependent model for
$\,\%$
to accurately capture the reduced acceleration resulting from real-gas effects, which in turn slows the overall convergence process. Liverts & Apazidis (Reference Liverts and Apazidis2016) showed that excitation, dissociation, ionisation and radiation significantly limit the attainable thermodynamic conditions at the convergence point, reducing the maximum temperature by roughly an order of magnitude, and thereby lowering the achievable pressure and density. Neither simulations nor the self-similar solution (based on the perfect gas EOS) can accurately capture this reduced acceleration due to real-gas effects. To estimate the thermodynamic conditions near the focus, we recompute the shock trajectory using the SESAME 5031 EOS model (Lyon Reference Lyon1978), combined with a pressure and temperature-dependent model for $\gamma$
(Bahadori & Vuthaluru Reference Bahadori and Vuthaluru2011). The SW trajectory is then recomputed using a geometric shock dynamics approximation based on Whitham’s approach (Whitham Reference Whitham1957, Reference Whitham1974), also known as the CCW approximation after Chester–Chisnell–Whitham. This solution assumes that the interaction of the accelerating SW with the flow behind it can be ignored and that the shock motion can be approximated by integrating the governing equation along the
$\gamma$
(Bahadori & Vuthaluru Reference Bahadori and Vuthaluru2011). The SW trajectory is then recomputed using a geometric shock dynamics approximation based on Whitham’s approach (Whitham Reference Whitham1957, Reference Whitham1974), also known as the CCW approximation after Chester–Chisnell–Whitham. This solution assumes that the interaction of the accelerating SW with the flow behind it can be ignored and that the shock motion can be approximated by integrating the governing equation along the $C_{+}$
characteristic. The ratio of radii of the SW as it converges at two consecutive instants
$C_{+}$
characteristic. The ratio of radii of the SW as it converges at two consecutive instants $t_1$
and
$t_1$
and $t_2$
is expressed as
$t_2$
is expressed as
 \begin{align} \frac {r_2}{r_1} = \exp {\left [-\frac {1}{\nu }\left (\int _1^2 \frac {u+a}{\rho a^2 u}{\rm d}p + \int _1^2\frac {u+a}{au}{\rm d}u\right )\right ]}. \end{align}
Here, $\nu$
can be taken as 1 or 2 for cylindrical or spherical convergence, respectively, and the rest of the variables are the properties behind the shock. The initial conditions for solving this equation are taken from the HD simulations, yielding the CCW trajectory shown in figure 6(b). Deviations from both the simulations and the Guderley solution appear only near the focus, where the rapid temperature rise triggers real-gas effects that slow down the convergence. When the ideal shock reaches the focus, the non-ideal shock front is still located at
$\nu$
can be taken as 1 or 2 for cylindrical or spherical convergence, respectively, and the rest of the variables are the properties behind the shock. The initial conditions for solving this equation are taken from the HD simulations, yielding the CCW trajectory shown in figure 6(b). Deviations from both the simulations and the Guderley solution appear only near the focus, where the rapid temperature rise triggers real-gas effects that slow down the convergence. When the ideal shock reaches the focus, the non-ideal shock front is still located at $r \approx 0.04\,r_i$
. All models, independently of the chosen EOS, predict an unbounded acceleration as the shock approaches the focus, driving the thermodynamic properties towards infinity. In reality, however, this acceleration is effectively limited by the relaxation time of the internal energy modes (rotational, vibrational, electronic, dissociation and ionisation). These relaxation processes set the scale of the shock front thickness, since the shock cannot be thinner than the time and distance required for the energy modes to equilibrate. As a result, the finite shock thickness prevents perfect geometric convergence: as the converging shock reflects from itself at the centre, the broadened front interacts unevenly, limiting the acceleration. The slowest of these relaxation processes is ionisation (Biberman, Mnatsakanyan & Yakubov Reference Biberman, Mnatsakanyan and Yakubov1971), whose relaxation length in air can be as large as
$r \approx 0.04\,r_i$
. All models, independently of the chosen EOS, predict an unbounded acceleration as the shock approaches the focus, driving the thermodynamic properties towards infinity. In reality, however, this acceleration is effectively limited by the relaxation time of the internal energy modes (rotational, vibrational, electronic, dissociation and ionisation). These relaxation processes set the scale of the shock front thickness, since the shock cannot be thinner than the time and distance required for the energy modes to equilibrate. As a result, the finite shock thickness prevents perfect geometric convergence: as the converging shock reflects from itself at the centre, the broadened front interacts unevenly, limiting the acceleration. The slowest of these relaxation processes is ionisation (Biberman, Mnatsakanyan & Yakubov Reference Biberman, Mnatsakanyan and Yakubov1971), whose relaxation length in air can be as large as $5\;\unicode{x03BC} \mathrm{m}$
; we adopt this upper bound as a conservative estimate (computed as the product of the relaxation time and the particle velocity). Once the thermodynamic properties behind the shock at this distance from the focus are known, the conditions after reflection are estimated using the one-dimensional conservation equations of the flow (Anderson Reference Anderson2003). Accordingly, we report the pre-reflection shock speed at a distance from the focus equal to the relaxation length, yielding a Mach number of 14.10. The computed air temperature, density and pressure using the real-gas EOS post-reflection yield
$5\;\unicode{x03BC} \mathrm{m}$
; we adopt this upper bound as a conservative estimate (computed as the product of the relaxation time and the particle velocity). Once the thermodynamic properties behind the shock at this distance from the focus are known, the conditions after reflection are estimated using the one-dimensional conservation equations of the flow (Anderson Reference Anderson2003). Accordingly, we report the pre-reflection shock speed at a distance from the focus equal to the relaxation length, yielding a Mach number of 14.10. The computed air temperature, density and pressure using the real-gas EOS post-reflection yield $10\,800 \;\text{K}$
,
$10\,800 \;\text{K}$
, $60 \;\rm {kg\,m}^{-3}$
and
$60 \;\rm {kg\,m}^{-3}$
and $280\;\text{MPa}$
, respectively. These estimates are based on the assumption of perfect cylindrical symmetry and should therefore be regarded as an overestimation of the conditions that can potentially be achieved in the experiment.
$280\;\text{MPa}$
, respectively. These estimates are based on the assumption of perfect cylindrical symmetry and should therefore be regarded as an overestimation of the conditions that can potentially be achieved in the experiment.
Radiative emission from the hot post-shock gas may pre-ionise the upstream air, thereby modifying the shock dynamics near the focus (Sutherland & Dopita Reference Sutherland and Dopita2017). Estimates for radiative precursors indicate that appreciable ionising emission becomes relevant only once post-shock temperatures reach of the order of $10^4{-}10^5\,\mathrm{K}$
(Zel’Dovich & Raizer Reference Zel’Dovich and Raizer2002), although non-equilibrium radiation from shock-heated gas may enable pre-ionisation at lower temperatures (Nomura, Kawakami & Fujita Reference Nomura, Kawakami and Fujita2021). In our non-ideal simulations, such temperatures are attained only when the shock front is within
$10^4{-}10^5\,\mathrm{K}$
(Zel’Dovich & Raizer Reference Zel’Dovich and Raizer2002), although non-equilibrium radiation from shock-heated gas may enable pre-ionisation at lower temperatures (Nomura, Kawakami & Fujita Reference Nomura, Kawakami and Fujita2021). In our non-ideal simulations, such temperatures are attained only when the shock front is within ${\sim} 1\,\unicode{x03BC} \mathrm{m}$
of the focus. Radiative pre-ionisation is therefore unlikely to play a significant role in the shock evolution, since ionisation relaxation limits the post-shock temperature before upstream pre-ionisation becomes important.
${\sim} 1\,\unicode{x03BC} \mathrm{m}$
of the focus. Radiative pre-ionisation is therefore unlikely to play a significant role in the shock evolution, since ionisation relaxation limits the post-shock temperature before upstream pre-ionisation becomes important.
3.3. Semicylindrical-to-cylindrical configuration
In this section, we compare the experimental and numerical results for the semicylindrical-to-cylindrical case. The HD simulations employ a uniform mesh of four million elements with the centre of the elements spaced 8 $\unicode{x03BC}$
m apart, ensuring spatial convergence of the results. The initial high-pressure region consists of 17 cylinders of approximately
$\unicode{x03BC}$
m apart, ensuring spatial convergence of the results. The initial high-pressure region consists of 17 cylinders of approximately $2.5$
mm diameter, each at a pressure of 650 MPa. Note that, unlike the cylindrical-to-cylindrical configuration, this experiment employs 100
$2.5$
mm diameter, each at a pressure of 650 MPa. Note that, unlike the cylindrical-to-cylindrical configuration, this experiment employs 100 $\unicode{x03BC}$
m wires instead of 50
$\unicode{x03BC}$
m wires instead of 50 $\unicode{x03BC}$
m wires. Based on the electrical energy transfer analysis in § 3.1, more energy is delivered to the wires over a longer explosion time in this experiment; accordingly, we use a larger initial high-pressure region in the HD model to represent the resulting larger effective driver.
$\unicode{x03BC}$
m wires. Based on the electrical energy transfer analysis in § 3.1, more energy is delivered to the wires over a longer explosion time in this experiment; accordingly, we use a larger initial high-pressure region in the HD model to represent the resulting larger effective driver.
In figure 7, we include a comparison between the experimental X-ray images and the numerical schlieren. The incident SW originates from the upstream direction, that is, from the left side of the schlieren images, and propagates downstream towards the right. The SW impinges on the upstream wall of the interface at approximately ${\sim} 3.4\;\unicode{x03BC}$
s, generating a rapid compression of the gas at the point of contact. Following this initial impact, the upstream wall begins to involute, gradually curving inward and forming a focused jet along the bubble’s horizontal axis of symmetry. During this involution process, both the radius of curvature of the wall and the pressure behind it steadily increase, intensifying the jet formation. This pressure rise counteracts the rarefaction region generated after the incident shock impingement, preventing the pressure near the wall from dropping to negative values. A well-directed jet then traverses the interior of the bubble and strikes the downstream wall at
${\sim} 3.4\;\unicode{x03BC}$
s, generating a rapid compression of the gas at the point of contact. Following this initial impact, the upstream wall begins to involute, gradually curving inward and forming a focused jet along the bubble’s horizontal axis of symmetry. During this involution process, both the radius of curvature of the wall and the pressure behind it steadily increase, intensifying the jet formation. This pressure rise counteracts the rarefaction region generated after the incident shock impingement, preventing the pressure near the wall from dropping to negative values. A well-directed jet then traverses the interior of the bubble and strikes the downstream wall at ${\sim} 10.3\;\unicode{x03BC}$
s. The total collapse time of the bubble, defined as the interval from the initial shock impingement on the upstream wall to the jet’s impact on the downstream wall, is approximately
${\sim} 10.3\;\unicode{x03BC}$
s. The total collapse time of the bubble, defined as the interval from the initial shock impingement on the upstream wall to the jet’s impact on the downstream wall, is approximately ${\sim} 6.9\;\unicode{x03BC}$
s.
${\sim} 6.9\;\unicode{x03BC}$
s.
Experimental X-ray images (top) and numerical schlieren (bottom) at different times for the semicylindrical-to-cylindrical case. The label IS stands for incident SW.

The impact of the jet on the downstream wall splits the bubble, producing two distinct lobes of trapped, highly compressed gas. These lobes contain a pair of coherent linear vortices, as observed at ${\sim} 11.6\;\unicode{x03BC}$
s, which move towards the downstream direction. The penetration of the jet into the downstream wall also generates a localised region of increased pressure ahead of the now deformed bubble, which influences the flow field downstream. This pressure can be estimated as the maximum achievable water hammer pressure in the liquid
${\sim} 11.6\;\unicode{x03BC}$
s, which move towards the downstream direction. The penetration of the jet into the downstream wall also generates a localised region of increased pressure ahead of the now deformed bubble, which influences the flow field downstream. This pressure can be estimated as the maximum achievable water hammer pressure in the liquid $( {1}/{2})\rho _0 a_L v_{\kern-1pt j}$
for isolated bubbles, with
$( {1}/{2})\rho _0 a_L v_{\kern-1pt j}$
for isolated bubbles, with $v_{\kern-1pt j}$
being the speed of the jet at collision and
$v_{\kern-1pt j}$
being the speed of the jet at collision and $\rho _0$
the undisturbed water density (Dear et al. Reference Dear, Field and Walton1988). The simulated water hammer pressure yields a maximum of
$\rho _0$
the undisturbed water density (Dear et al. Reference Dear, Field and Walton1988). The simulated water hammer pressure yields a maximum of ${\sim} 430$
MPa, while using the estimate
${\sim} 430$
MPa, while using the estimate $( {1}/{2})\rho _0 a_L v_{\kern-1pt j}$
gives
$( {1}/{2})\rho _0 a_L v_{\kern-1pt j}$
gives ${\sim} 660$
MPa. After jet penetration, two distinct high-pressure regions develop: one upstream of the bubble due to the involution of the upstream wall and another downstream caused by the jet’s impact on the downstream wall.
${\sim} 660$
MPa. After jet penetration, two distinct high-pressure regions develop: one upstream of the bubble due to the involution of the upstream wall and another downstream caused by the jet’s impact on the downstream wall.
Numerical schlieren (top) and logarithmic pressure field (bottom) at different times for the semicylindrical-to-cylindrical case. The labels denote: TS1 (transmitted SW 1); TP (triple point); MR (Mach reflection); I (incident SW); R (reflected SW); M (Mach stem); TS2 (transmitted SW 2); and RS1 (reflected SW 1).

We focus in figure 8 on the SW dynamics inside the bubble between $5.6$
and
$5.6$
and $9.1\;\unicode{x03BC}$
s. Each panel displays the numerical schlieren image (top) and the pressure field (bottom), the latter shown on a logarithmic scale to highlight finer flow structures. After the incident SW enters the bubble, the first transmitted SW immediately begins focusing towards the bubble’s centre. Once it focuses, a triple point forms, as seen in figure 8(b), marking the onset of a Mach reflection. As illustrated in figure 8(c), this is an irregular reflection consisting of a triple-SW configuration: the incident SW, a reflected SW and a Mach stem. At this stage, an exchange of wave strength occurs between the incident and reflected SWs: the incident SW weakens as it moves downward, while the reflected SW gains strength moving upward. Eventually, the incident SW weakens completely, leaving the Mach stem and reflected SW to merge into a single SW structure propagating downstream (see figure 8
d). We refer to this process as SW recovery. When the first transmitted SW impinges on the downstream wall, it generates a localised high-pressure region due to the water hammer effect, as shown in figure 8(f). This impact produces a second transmitted SW moving further downstream into the liquid and a reflected SW travelling upstream towards the advancing jet.
$9.1\;\unicode{x03BC}$
s. Each panel displays the numerical schlieren image (top) and the pressure field (bottom), the latter shown on a logarithmic scale to highlight finer flow structures. After the incident SW enters the bubble, the first transmitted SW immediately begins focusing towards the bubble’s centre. Once it focuses, a triple point forms, as seen in figure 8(b), marking the onset of a Mach reflection. As illustrated in figure 8(c), this is an irregular reflection consisting of a triple-SW configuration: the incident SW, a reflected SW and a Mach stem. At this stage, an exchange of wave strength occurs between the incident and reflected SWs: the incident SW weakens as it moves downward, while the reflected SW gains strength moving upward. Eventually, the incident SW weakens completely, leaving the Mach stem and reflected SW to merge into a single SW structure propagating downstream (see figure 8
d). We refer to this process as SW recovery. When the first transmitted SW impinges on the downstream wall, it generates a localised high-pressure region due to the water hammer effect, as shown in figure 8(f). This impact produces a second transmitted SW moving further downstream into the liquid and a reflected SW travelling upstream towards the advancing jet.
In figure 9(a), we show the evolution of the jet position in time. Fitting a linear regression on the experimental data, we estimate a jet speed of $885\pm 30$
m s−1. The speed of the tip of the jet
$885\pm 30$
m s−1. The speed of the tip of the jet $v_{\kern-1pt j}$
can be estimated by
$v_{\kern-1pt j}$
can be estimated by $v_{\kern-1pt j} \approx 2v_p$
, where
$v_{\kern-1pt j} \approx 2v_p$
, where $v_p$
is the particle velocity of the transmitted shock after impingement. This corresponds to the simplified case of a planar shock reflecting off a free surface and imparting it with a velocity of
$v_p$
is the particle velocity of the transmitted shock after impingement. This corresponds to the simplified case of a planar shock reflecting off a free surface and imparting it with a velocity of $2v_p$
. Using a model to estimate
$2v_p$
. Using a model to estimate $v_p$
based on the Tait equation and one-dimensional conservation equations (Ridah Reference Ridah1988), we obtain a jet speed of
$v_p$
based on the Tait equation and one-dimensional conservation equations (Ridah Reference Ridah1988), we obtain a jet speed of $v_{\kern-1pt j} \approx 700$
m s−1. As expected, this underestimates the actual value because the simplified analytical approach neglects interface convergence effects which can increase the final jet velocity by a factor of 1.5 (Dear et al. Reference Dear, Field and Walton1988).
$v_{\kern-1pt j} \approx 700$
m s−1. As expected, this underestimates the actual value because the simplified analytical approach neglects interface convergence effects which can increase the final jet velocity by a factor of 1.5 (Dear et al. Reference Dear, Field and Walton1988).
Figure 9(b) illustrates the position and velocity of the first transmitted SW, generated when the incident SW impacts the upstream wall of the bubble, and the second transmitted SW, which forms when it reaches the downstream wall. The trajectory of first transmitted shock displays a nearly symmetric pattern around the bubble’s centre at 0 mm. Its speed follows a similar symmetry as it accelerates from ${\sim} 750$
m s−1 (Mach
${\sim} 750$
m s−1 (Mach $2.19$
) upon transmission to
$2.19$
) upon transmission to ${\sim} 1950$
m s−1 (Mach
${\sim} 1950$
m s−1 (Mach $5.69$
) at the focal point at
$5.69$
) at the focal point at ${\sim} 5.6\;\unicode{x03BC}$
s, and then decelerates after passing through the focus as the SW undergoes Mach reflection. This indicates that the focal point of the incident SW coincides with that of the transmitted one. When this SW impacts the downstream wall at approximately
${\sim} 5.6\;\unicode{x03BC}$
s, and then decelerates after passing through the focus as the SW undergoes Mach reflection. This indicates that the focal point of the incident SW coincides with that of the transmitted one. When this SW impacts the downstream wall at approximately ${\sim} 7.8\;\unicode{x03BC}$
s, it transmits back into the water. Due to the impedance mismatch at the bubble boundary, a distinct discontinuity appears in the velocity field and the second transmitted shock propagates forward at an almost constant near-sonic speed.
${\sim} 7.8\;\unicode{x03BC}$
s, it transmits back into the water. Due to the impedance mismatch at the bubble boundary, a distinct discontinuity appears in the velocity field and the second transmitted shock propagates forward at an almost constant near-sonic speed.
Experimental and simulated position of the jet interface (a), and simulated position and speed of the SW (b) for the semicylindrical-to-cylindrical case. The vertical axis indicates the travelled horizontal distance, with 0 mm corresponding to the centre of the bubble. Here, TS1 and TS2 stand for transmitted SW 1 and 2, respectively.

The time evolution of the equivalent radius of the bubble, defined as the radius of a circle with the same cross-sectional area as the deforming bubble, is shown in figure 10. The experimental and simulation results are compared with the Gilmore-type solution given in (3.2). At time 12.4 $\unicode{x03BC}$
s, when the experimental equivalent radius reaches its minimum, the experimental data appear to accelerate less than the simulations. This discrepancy may arise from the difficulty in determining the equivalent bubble area from experimental images such as those in figure 3, where the interface becomes diffuse in the X-ray images at later times. For the Gilmore-type solution, the driver pressure
$\unicode{x03BC}$
s, when the experimental equivalent radius reaches its minimum, the experimental data appear to accelerate less than the simulations. This discrepancy may arise from the difficulty in determining the equivalent bubble area from experimental images such as those in figure 3, where the interface becomes diffuse in the X-ray images at later times. For the Gilmore-type solution, the driver pressure $p_\infty$
has a peak of 350 MPa and a positive phase lasting 1.8
$p_\infty$
has a peak of 350 MPa and a positive phase lasting 1.8 $\unicode{x03BC}$
s. In between 6 and 9
$\unicode{x03BC}$
s. In between 6 and 9 $\unicode{x03BC}$
s, the analytical solution is slightly slower than both simulations and experiments, due to
$\unicode{x03BC}$
s, the analytical solution is slightly slower than both simulations and experiments, due to $p_\infty$
not accounting for the additional pressure generated as the upstream wall of the bubble involutes during jet formation. The three models agree within a maximum relative error of 14
$p_\infty$
not accounting for the additional pressure generated as the upstream wall of the bubble involutes during jet formation. The three models agree within a maximum relative error of 14 $\,\%$
in the convergence time, validating their accuracy.
$\,\%$
in the convergence time, validating their accuracy.
Experimental, simulated and Gilmore-type solutions for the equivalent radius of the converging bubble for the semicylindrical-to-cylindrical case.

In the canonical planar heavy-to-light shock–bubble interaction, the shock transmitted into the gas is diverted/defocused and subsequently develops into a bow shock propagating ahead of the collapsing jet (Ranjan et al. Reference Ranjan, Oakley and Bonazza2011); this bow shock may strengthen as it propagates and generate reflections upon interacting with the bubble wall (Hawker & Ventikos Reference Hawker and Ventikos2012). In the present semi-cylindrical configuration, by contrast, the key difference is that the transmitted SW instead focuses towards the bubble centre before undergoing Mach reflection, which concentrates the gas compression and produces a high-pressure region along the horizontal symmetry axis. The semi-cylindrical shock impinges on the full upstream bubble interface nearly simultaneously, leading to a different impulse deposition than in the planar case, where the shock loading is progressive, potentially modifying the associated baroclinic vorticity deposition. The attainable jet dynamics in the semi-cylindrical case may therefore reflect a counterplay between (i) enhanced upstream interface focusing and more synchronous impulse deposition, which may strengthen the local driving pressure, and (ii) increased gas compression associated with focusing of the transmitted SW, which opposes the inward interface motion and may reduce jet acceleration.
4. Conclusion
In this work, we investigated the dynamics of cylindrical and semicylindrical converging SWs interacting with cylindrical air bubbles using a combination of experimental, numerical and analytical approaches. Experimentally, we generated highly controlled converging shock fronts in a water–gelatine solution using exploding wire arrays driven by a HV pulsed power system at beamline ID19 of the ESRF synchrotron. We visualised the bubble deformation through X-ray radiography in a set up with two high-speed cameras working at 5 Mfps. Numerically, we employed two-dimensional compressible multiphase Navier–Stokes simulations to resolve flow features inside the bubble that could not be observed experimentally. Additionally, we applied the Gilmore-type model for compressible cylindrical bubble pulsation to provide an independent theoretical prediction for the interface evolution. This integrated methodology enabled cross-validation between experiments, simulations and theory, ensuring that the observed dynamics was accurately reproduced and that key physical mechanisms were correctly identified. For both the cylindrical-to-cylindrical and semicylindrical-to-cylindrical configurations, the experimental observations, numerical simulations and analytical predictions showed good agreement in interface motion, collapse time and overall flow evolution.
In the cylindrical case, the azimuthally symmetric converging shock front drove an inward collapse of the bubble interface, punctuated by four RMI spikes that developed into high-speed liquid jets. The simulated transmitted shock inside the bubble was found to accelerate self-similarly, in good agreement with Guderley’s solution for cylindrical shock convergence. To estimate the shock speed and thermodynamic conditions near the shock convergence focus, including real-gas effects, we solved the CCW equation in combination with a non-ideal EOS for air based on SESAME tables. This analysis indicates that, at a distance corresponding to the relaxation length from the focus, the shock reaches Mach $14.10$
. In contrast, the semicylindrical case broke azimuthal symmetry, concentrating momentum into a single, well-collimated supersonic jet that traversed the bubble and impacted the downstream wall, generating two localised symmetric lobes containing coherent counter-rotating vortices. This configuration exhibited a complex internal shock dynamics, including transmitted-shock focusing, Mach reflection with triple-point formation, wave-strength exchange and SW recovery, followed by the emission of a secondary water hammer shock into the water–gelatine solution.
$14.10$
. In contrast, the semicylindrical case broke azimuthal symmetry, concentrating momentum into a single, well-collimated supersonic jet that traversed the bubble and impacted the downstream wall, generating two localised symmetric lobes containing coherent counter-rotating vortices. This configuration exhibited a complex internal shock dynamics, including transmitted-shock focusing, Mach reflection with triple-point formation, wave-strength exchange and SW recovery, followed by the emission of a secondary water hammer shock into the water–gelatine solution.
Overall, these two configurations have been investigated experimentally, numerically and analytically, providing insight into the underlying physics. The results present a tractable quasi-two-dimensional system that can serve as a benchmark for validating compressible multiphase solvers, while also raising broader unresolved questions. Among these are the influence of fully three-dimensional shock geometries on the collapse dynamics and jet formation, in particular the case of spherical and hemispherical shocks interacting with spherical bubbles. A further consideration is the systematic quantification of the role of shock curvature and asymmetry in promoting interfacial instabilities, secondary shock emission and vortex structures. Future experiments could complement the X-ray measurements with a dedicated schlieren system, using an additional synchronised camera with collimated illumination to resolve transmitted and reflected shocks in the gas phase.
Supplementary movies
Supplementary movies are available at https://doi.org/10.1017/jfm.2026.11472.
Acknowledgements
The authors acknowledge ESRF for provision of beamtime during the experimental session MI-1493 at the ID19 beamline. The authors also sincerely thank the anonymous reviewers for their instructive comments and helpful suggestions.
Funding
This work is supported by ERC grant DYNPRESS, project number 101042878, and by Swedish Research Council under Grant No. 2020-03700. Funded by the European Union. Views and opinions expressed are, however, those of the authors only and do not necessarily reflect those of the European Union or the European Research Council Executive Agency. Neither the European Union nor the granting authority can be held responsible for them.
Declaration of interests
The authors report no conflicts of interest.
Data availability statement
The data that support the findings of this study are openly available in Zenodo at http://doi.org/10.5281/zenodo.16927652, Hernández Garcia, Bhardwaj & Liverts (Reference Hernández Garcia, Bhardwaj and Liverts2025). The original data set can be accessed from ESRF proposal number MI-1493 at https://doi.org/10.15151/ESRF-ES-1930999865, Armstrong et al. (Reference Armstrong2024). Both data sets are under embargo until 3 December 2027, in accordance with the ESRF data policy.


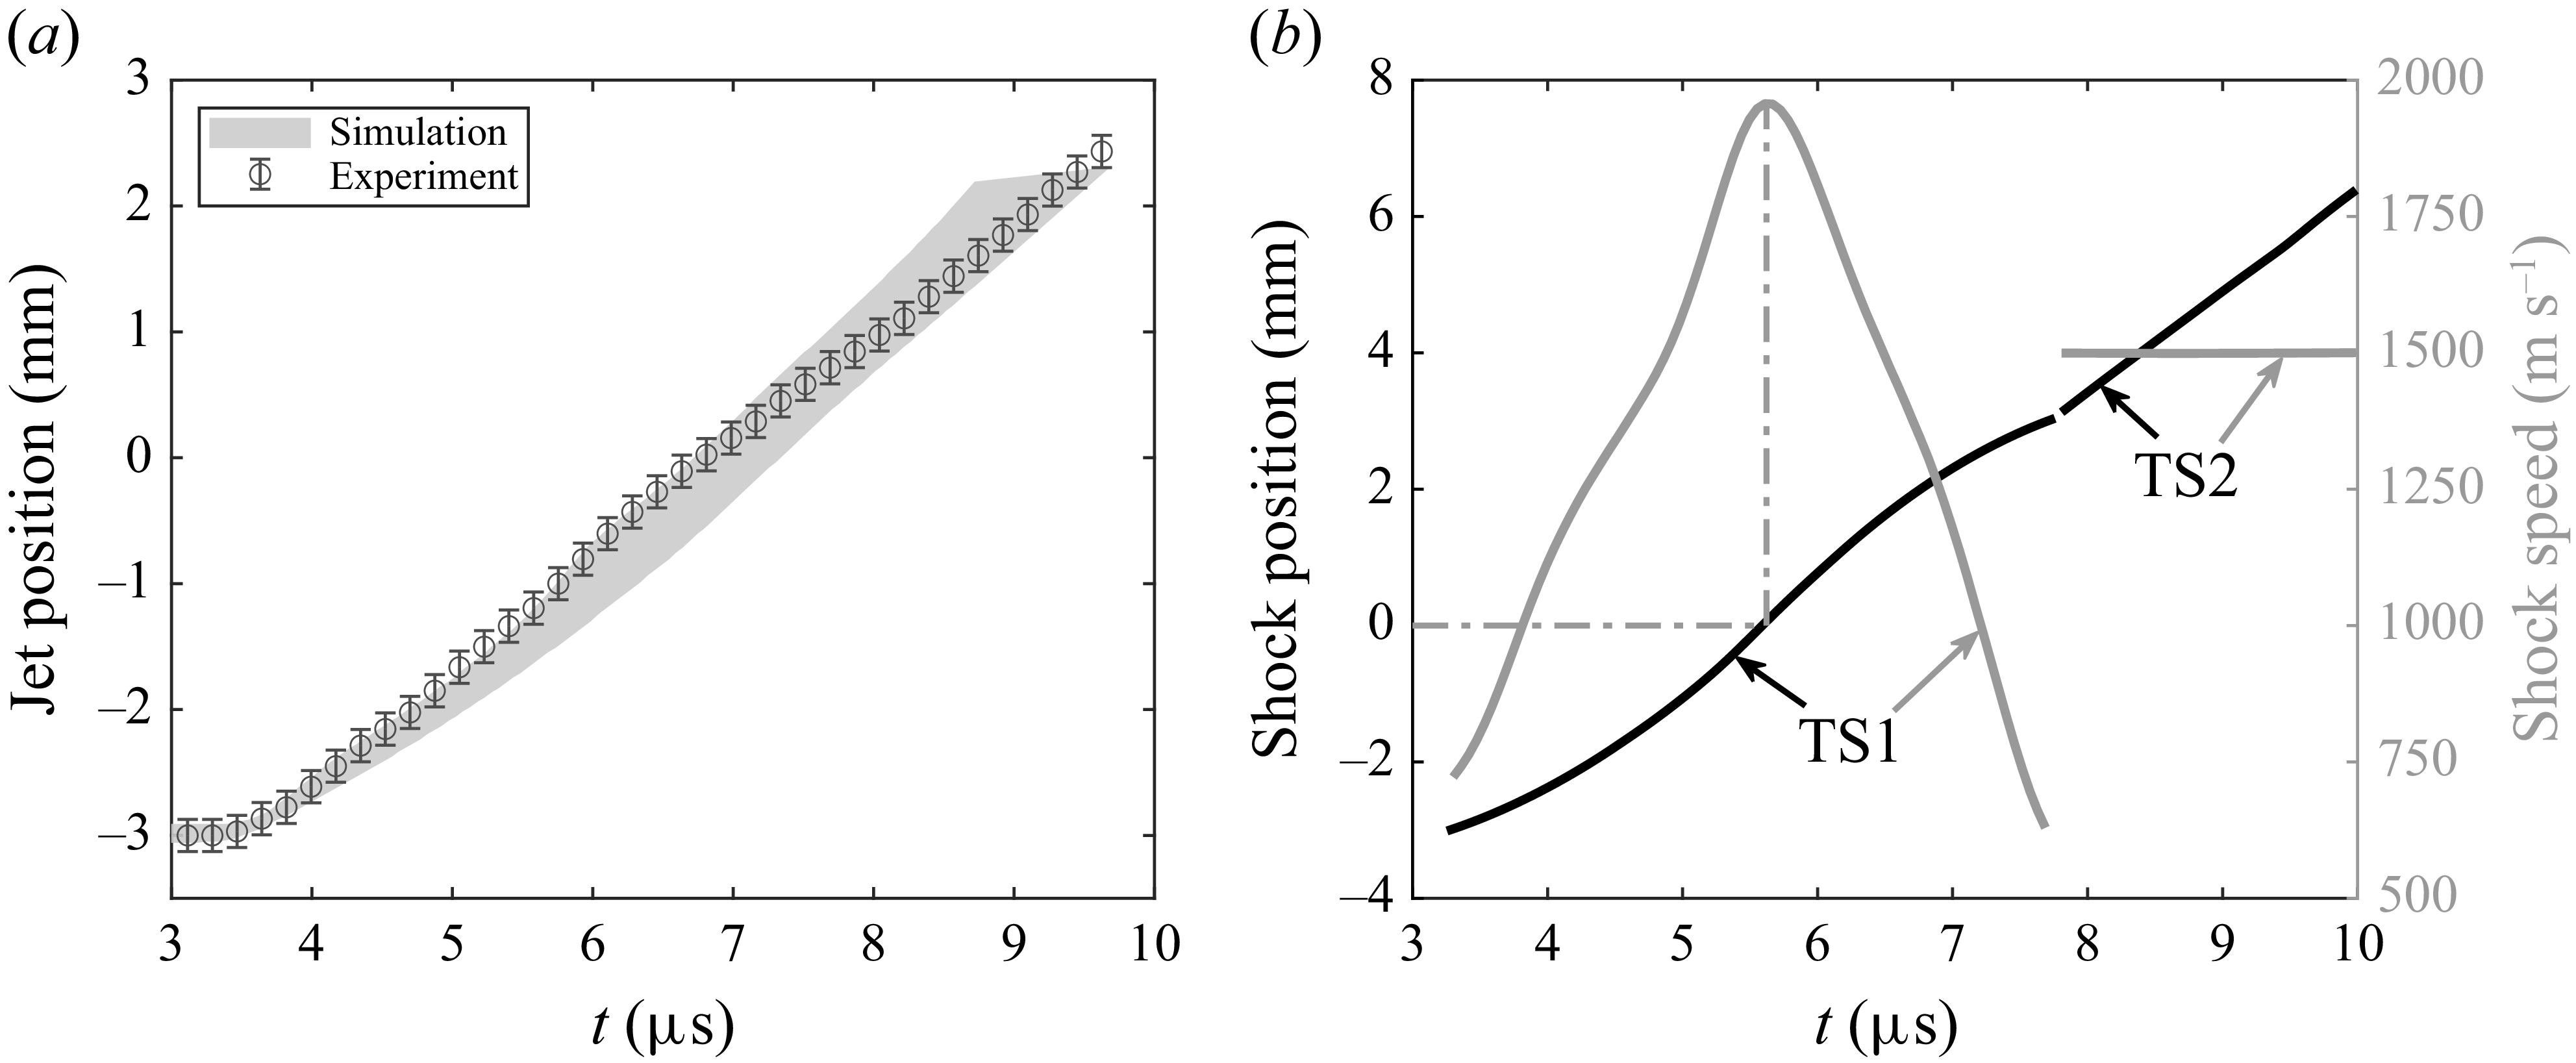


 Open access

