Chronic kidney disease (CKD) is increasingly recognised as a major global public health problem. In 2016, thirty million people or 15 % of US adults are estimated to have CKD(Reference Levey and Coresh1). Patients with CKD are at increased risk for CVD, end-stage renal disease (ESRD) and all-cause mortality(Reference Levey and Coresh1–Reference Athyros, Katsiki and Karagiannis3). The 2010 US Renal Data System report shows that Medicare spent $29 billion in 2009, or almost 6 % of the annual Medicare budget, for patients with ESRD(Reference Honeycutt, Segel and Zhuo4). Primary prevention of CKD is therefore an important public health priority(Reference Leung, Tonelli and James5). Inflammation seems to play an important role in the pathogenesis of kidney injury, leading to chronically impaired kidney function(Reference Leung, Tonelli and James5,Reference Miyamoto, Carrero and Stenvinkel6) .
It is known that diet plays a critical role in the regulation of the level of inflammatory factors and oxidative stress(Reference Giugliano, Ceriello and Esposito7–Reference Mazidi, Kengne and Mikhailidis9) and possibly in renal function. It has been suggested that diets with high load of nutrients such as antioxidant vitamins including vitamin E, C, A, Mg, K, Ca, fibre, PUFA, MUFA and phytochemicals and a lower amount of SFA, trans-fatty acids and simple carbohydrate could have a beneficial impact on renal function and decrease the likelihood of CKD(Reference Farhadnejad, Asghari and Mirmiran10,Reference Huang, Jiménez-Moleón and Lindholm11) . Some nutrients, such as fibre, and several vitamins are recognised as anti-inflammatory nutrients(Reference Dunkler, Dehghan and Teo12), and some of them including SFA or sugar are known to have a pro-inflammatory action(Reference Huang, Sjogren and Arnlov13). The first category is related to favourable renal function, lower risk of albuminuria and slower decline in kidney function(Reference Dunkler, Dehghan and Teo12,Reference Miller, Juraschek and Appel14, Reference Xu, Huang and Riserus15) , while the second group of nutrients has been linked with worsening of kidney function(Reference Lin, Judd and Le16).
However, there is a limited number of controversial evidence on the association between whole grain (WG) or refined grain (RG) and kidney function(Reference Sabatino, Regolisti and Gandolfini17–Reference Foster, Hwang and Massaro19). The Multi-Ethnic Study of Atherosclerosis (MESA) showed that higher consumption of WG was associated with lower albumin to creatinine ratio (ACR)(Reference Nettleton, Steffen and Palmas20). In contrast, the Framingham Heart Study found no association between consumption of WG, microalbuminuria and low estimated glomerular filtration rate (eGFR)(Reference Foster, Hwang and Massaro19). Very recently, results from the population-based longitudinal Doetinchem study (n 3787, 26–65 years) reported no link between WG intake, eGFR and ACR(Reference Herber-Gast, Boersma and Verschuren18).
The main objectives in the management of CKD include: reduction of the unfavourable symptoms of uraemia, delaying the need for renal replacement therapy and improving the quality of life(Reference Deniz Ayli, Ayli and Ensari21). The dietary limitations for CKD subjects make it difficult to ensure adequate micronutrient content in their diet. Furthermore, they may suffer from impaired intestinal absorption of mineral and vitamins(Reference Vaziri, Said and Hollander22).
The aim of this study was to investigate the association of WG and RG with kidney function (assessed by eGFR) and prevalent CKD in adult Americans. Second, we evaluated the ratio of WG:RG in the diet in relation to CKD prevalence. Furthermore, we examined whether possible associations were moderated by adiposity factors. We hypothesised that individuals with a higher intake of WG would have a more favourable eGFR and a lower likelihood for CKD and vice versa for RG.
Methods
Population
We used data from the National Health and Nutrition Examination Survey (NHANES), which is described in detail elsewhere(23). In brief, these are periodic cross-sectional surveys conducted by the US National Center for Health Statistics (NCHS), and during which home visits are conducted to administer questionnaires and collect data on demographics, diet and other health behaviours. NHANES applies complex multistage probability sampling procedure to ensure selection of participants from various geographical locations and adequate racial/ethnic representation(23). Informed consent was obtained from all participants and the NCHS Research Ethics Review Board approved the protocol. Poverty to income index was measured by using the Department of Health and Human Services’ poverty guidelines. Smoking status was self-reported and participants classified as current smoker or not. The metabolic equivalent of task (MET) was used to measure the intensity level of physical activity and indicated the rate of energy consumption for a specific activity. A MET is defined as 4·184 kJ/kg per h (1 kcal/kg per h) that is roughly equal to the energy cost of being at rest. Physical activity was categorised into three intensity levels based on the MET score: light, moderate and vigorous(Reference Liu24).
The methods for the biochemical analyses are described in the NHANES Laboratory/Medical Technologists Procedures Manual(Reference Needham, Adler and Gregorich25–28). A blood specimen was drawn from an antecubital vein according to a standardised protocol. Fasting glucose was measured in the plasma by a hexokinase method using a Roche/Hitachi 911 Analyzer. The DxC800 modular chemistry side uses the Jaffe rate method (kinetic alkaline picrate) to determine the concentration of creatinine in serum. The creatinine calibration is traceable to an isotope dilution MS reference method(Reference Selvin, Manzi and Stevens29). Urinary creatinine (assessed by the Jaffe rate reaction) and urinary albumin (assessed by a solid-phase fluorescent immunoassay from a random urine sample)(Reference Chavers, Simonson and Michael30) were used to calculate ACR. The CKD Epidemiology Collaboration equation was used to calculate eGFR (in ml/min per 1·73 m2). Prevalent CKD was defined as an eGFR <60 ml/min per 1·73 m2(Reference Chavers, Simonson and Michael30). The National Cholesterol Education Program’s Adult Treatment Panel III report criteria were used to define the metabolic syndrome (MetS)(Reference Grundy, Brewer and Cleeman31), based on the presence of three or more of the following five criteria: (1) waist circumference ≥102 cm for men or ≥88 cm for women; (2) TAG ≥150 mg/dl (1·7 mmol/l); (3) HDL-cholesterol <40 mg/dl (1·0 mmol/l) for men or <50 mg/dl (1·3 mmol/l) for women; (4) systolic blood pressure ≥130 or diastolic blood pressure ≥85 mmHg and (5) fasting blood glucose ≥100 mg/dl (5·5 mmol/l).
For the present analysis, three survey cycles (i.e. 2005–2006, 2007–2008 and 2009–2010) were combined to produce estimates with greater precision and smaller sampling error. The analytical sample was limited to adults aged ≥18 years. After excluding pregnant and lactating women (n 102) as well as those with missing information regarding the variables of interest (n 2131), the final analytical sample included 16 325 respondents from the NHANES 2005–2010.
Whole grain and refined grain consumption
Dietary intake was assessed via 24 h recall obtained by a trained interviewer during the mobile examination centre visit, with the use of a computer-assisted dietary interview system with standardised probes, that is, the US Department of Agriculture Automated Multiple-Pass Method (AMPM)(Reference Ahluwalia, Andreeva and Kesse-Guyot32,Reference Ahluwalia, Dwyer and Terry33) . Briefly, the type and quantity of all foods and beverages consumed in a single 24 h period before the dietary interview (from midnight to midnight) were collected with the use of the AMPM. The AMPM is designed to enhance complete and accurate data collection while reducing respondent burden(Reference Ahluwalia, Dwyer and Terry33,Reference Moshfegh, Rhodes and Baer34) . Detailed descriptions of the dietary interview methods are provided in the NHANES Dietary Interviewer’s Training Manual(Reference Bowman, Friday and Moshfegh35). The MyPyramid Equivalents Database for US Department of Agriculture (USDA) Survey Food Codes was used to calculate WG and RG intake(Reference Bowman, Friday and Moshfegh35). The MyPyramid Equivalents Database is currently the only database available that provides quantified measures of WG foods with separate tables based on the old and new (without bran) definitions for WG. My Pyramid Equivalents food data files include the number of servings. Examples of WG food servings within the database include one slice of 100 % WG bread, one cup of 100 % WG cereal, or one-half cup of 100 % WG hot cereal, cooked pasta, rice, or other grain such as bulgur, oatmeal and whole cornmeal. The USDA Community Nutrition Research Group FoodLink staff, in consultation with the Agricultural Research Service’s Nutrient Data Laboratory, has classified all grain ingredients used in the Food and Nutrient Database for Dietary Studies and the Continuing Survey of Food Intake by Individuals (CSFII) recipe databases as WG or RG(Reference Ahluwalia, Dwyer and Terry33). The total number of ounce equivalents of grains/100 g has been determined for each food. The total number of ounce equivalents was divided into WG and RG equivalents based on the proportion of the grain ingredients in the food that were WG or non-WG. For example, cracked wheat bread contains white wheat flour and bran, which are RG, and whole-wheat flour, which is a WG. The white wheat flour and bran contribute 68 % to the total weight of the grain ingredients and the whole-wheat flour contributes 32 %. Thus, of the four ounce equivalents/100 g of cracked wheat bread, 2·7 are RG and 1·3 are WG(Reference Ahluwalia, Dwyer and Terry33).
Statistical analysis
Data analyses followed the Centers for Disease Control and Prevention guidelines for analysis of complex NHANES data, accounting for the masked variance and using the recommended weighting methodology(36), implemented with the use of SPSS® complex sample module version 22.0 (IBM Corp.). We used means and standard errors of the mean for continuous (ANOVA) measures and percentages for categorical variables (χ 2). The Kolmogorov–Smirnov test was used to evaluate the normality of data. Adjusted mean levels of kidney function markers (serum creatinine, ACR, eGFR, serum uric acid) across WG and RG quartiles were conducted using ANCOVA. These models were adjusted for age, sex, race, poverty:income ratio, fasting blood glucose, systolic and diastolic blood pressure, BMI (kg/m2), diabetes mellitus (DM) (self-reported history of DM or fasting plasma glucose ≥126 mg/dl (7 mmol/l)) and hypertension (HTN), diagnosed in individuals with systolic blood pressure ≥140 mmHg, a diastolic blood pressure ≥90 mmHg or in those on antihypertensive drugs(Reference Nwankwo, Yoon and Burt37). Log transformations were performed for those with not normal distribution. Logistic regressions models with three different levels of adjustments (model 1: age, sex, race and poverty:income ratio, model 2: age, sex, race, poverty:income ratio, fasting blood glucose, systolic and diastolic blood pressure and HTN, model 3: age, sex, race, poverty:income ratio, fasting blood glucose, systolic and diastolic blood pressure, HTN, TAG and HDL, DM, BMI and C-reactive protein (CRP)) were then used to derive the OR and 95 % CI for the association with prevalent CKD across WG, RG and ratio of WG:RG quartiles, always using the lowest quartile as reference. Multi-collinearity for the multiple linear regressions was assessed with variance inflation factors (VIF) at each step(Reference Slinker and Glantz38). Multi-collinearity was considered high when the VIF was >10(Reference Slinker and Glantz38).
The SPSS macro for moderation model by Preacher & Hayes(Reference Preacher and Hayes39) was used to investigate the effects of adiposity (assessed by BMI) on the associations of WG and RG with eGFR. The application of this macro allowed simultaneous estimation of the moderation impact of adiposity, while adjusting for relevant confounders. The approach also allowed the visualisation of the impact of each standard deviation change in the potential moderator on the relationship between independent and dependent variables. We tested for the presence of an effect of the adiposity-adjusted model (age, sex, race, fasting blood glucose, systolic and diastolic blood pressure, BMI, DM and HTN). All tests were two-sided, and P<0·05 characterised significant results.
Results
A total of 16 325 participants met the criteria for inclusion in the current analysis; 6·9 % had prevalent CKD. The characteristics of participants overall and by status of prevalent CKD are summarised in Table 1. Overall, 51·3 % of the participants were women, with no significant sex difference between those with and those without CKD (P=0·352). Compared with those without CKD, participants with CKD were more likely to be non-Hispanic Whites (82·7 v. 68·6 %), and less likely Mexican-Americans (2·5 v. 8·8 %), non-Hispanic Black (8·3 v. 11·2 %) and other Hispanic (3·1 v. 5·3 %); P<0·001 shows differences in the distribution of ethnicity by status for CKD. Mean age was 45·8 years overall; participants with CKD were older than those without (69·2 v. 44·6 years, P<0·001). With regard to other characteristics, patients with CKD had a higher BMI (P<0·001) and higher serum concentrations of CRP, TAG, fasting and 2 h glucose, insulin and HbA1c (P<0·001 for all comparisons). They were also more likely to have a high prevalence of the MetS, DM and HTN (P<0·001 for all comparisons, Table 1).
Demographic characters of subjects based on chronic kidney disease (CKD) status (Mean values with their standard errors; percentages; mean values and 95 % confidence intervals)
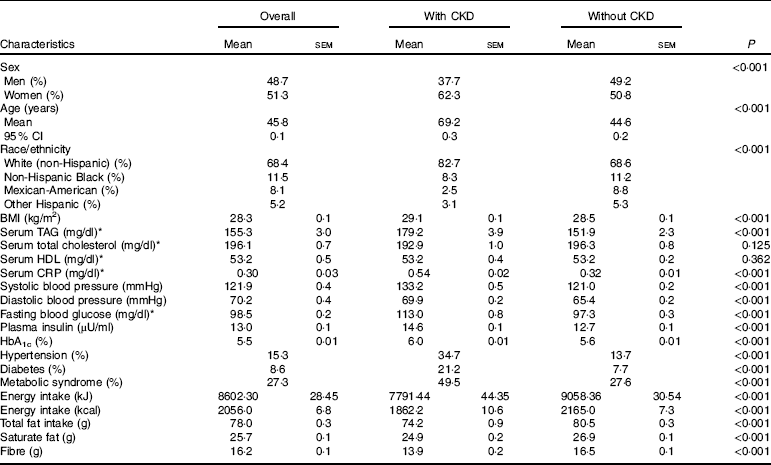
CRP, C-reactive protein; HbA1c, glycated Hb.
* To convert TAG from mg/dl to mmol/l, multiply by 0·0113. To convert cholesterol from mg/dl to mmol/l, multiply by 0·0259. To convert CRP from mg/dl to mg/l, multiply by 10. To convert glucose from mg/dl to mmol/l, multiply by 0·0555.
Adjusted (age, sex, race, fasting blood glucose, systolic and diastolic blood pressure, BMI, DM and HTN) mean levels of kidney function markers by quartiles of WG and RG are shown in Table 2. Across increasing WG quartiles, mean serum uric acid decreased from 6·01 to 5·02 mg/dl (357 to 299 μmol/l) (P<0·001), urine albumin increased from 2·32 to 1·98 mg/l (P<0·001), while eGFR increased from 88·2 to 95·4 ml/min per 1·73 m2 (P<0·001). Log ACR also decreased from 2·19 to 1·99 (P=0·012). With regard to the consumption of RG, we have found that as the quartiles of RG increased, mean serum uric acid increased from 4·99 to 5·78 mg/dl (297 to 344 μmol/l) (P<0·001), log ACR increased from 2·01 to 2·22 mg/dl (P<0·001), whereas eGFR decreased from 97·2 to 88·4 ml/min per 1·73 m2 (P<0·001, Table 2).
Age, sex, race, fasting blood glucose, systolic and diastolic blood pressure, BMI, diabetes, and hypertension-adjusted mean of markers of kidney function across quarters of whole grain (WG) and refined grain (RG) consumption (Estimated mean values with their standard errors; medians and 25th–75th percentiles)
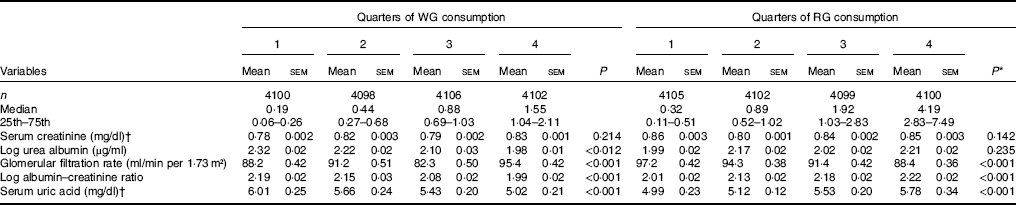
* P-values for linear trend across quartiles of WG and RG consumption. Variables were compared across quartiles of WG and RG consumption using ANCOVA test.
† To convert creatinine from mg/dl to μmol/l, multiply by 88·4. To convert uric acid from mg/dl to μmol/l, multiply by 59·48.
As shown in Table 3, three different models were used with a wide range of potential confounders to evaluate the odds of CKD across the quarters of WG and RG, as well as the ratio of WG:RG. In the model adjusted for age, sex, race and poverty:income ratio compared with the lowest quartile of the WG, the OR for CKD was 0·52 (95 % CI 0·41–0·63) for the top quartiles (P<0·001 for trend). In the same model, subjects in the top quarter (Q4) of WG:RG ratio had a lower chance for CKD compared with the first quarter (OR: 0·48, 95 % CI 0·34, 0·59, Table 3), while in same model as the quarters of RG increased, the likelihood of CKD was also increasing in a step-wise manner ((Q2=OR: 1·32, 95 % CI 1·06, 1·46), (Q3=OR: 1·56, 95 % CI 1·11, 1·69) and (Q4=OR: 1·78, 95 % CI 1·23, 1·89, P<0·001), Table 3). In the expanded models with further adjustment for age, sex, race, poverty:income ratio, fasting blood glucose, systolic and diastolic blood pressure, HTN, DM, TAG, HDL and CRP, similar associations were observed, that is, as the quarters of WG and ratio of WG:RG increased, the likelihood for CKD was decreasing (P<0·001 for both, Table 3), whereas the second quarter of RG was no longer significant after adjustment for age, sex, race, poverty:income ratio, fasting blood glucose, systolic and diastolic blood pressure, HTN, DM, TAG, HDL and CRP ((Q2=OR: 1·00, 95 % CI 0·98, 1·01), (Q3=OR: 1·02, 95 % CI 1·01, 1·03) and (Q4=OR: 1·07, 95 % CI 1·05, 1·09, P<0·001 for trend, Table 3).
Adjusted logistic regression to examine the association between quartiles for whole grain (WG), refined grain (RG), WG:RG and the risk of chronic kidney disease (CKD)Footnote * (Odds ratios and lower bound–upper bounds)
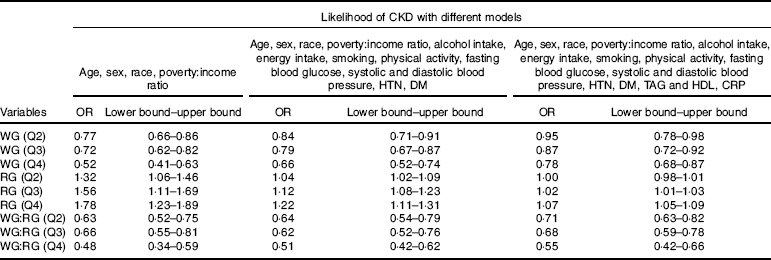
HTN, hypertension; DM, diabetes mellitus; CRP, C-reactive protein; Q2, second quarter; Q3, third quarter; Q4, fourth quarter.
* The first quarter was always used as reference.
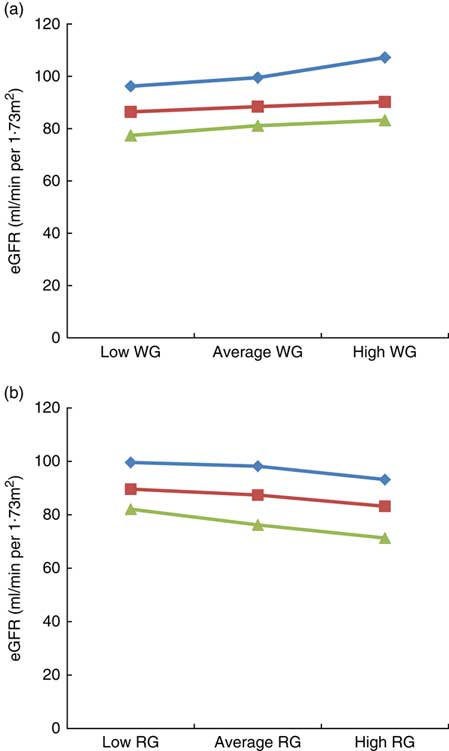
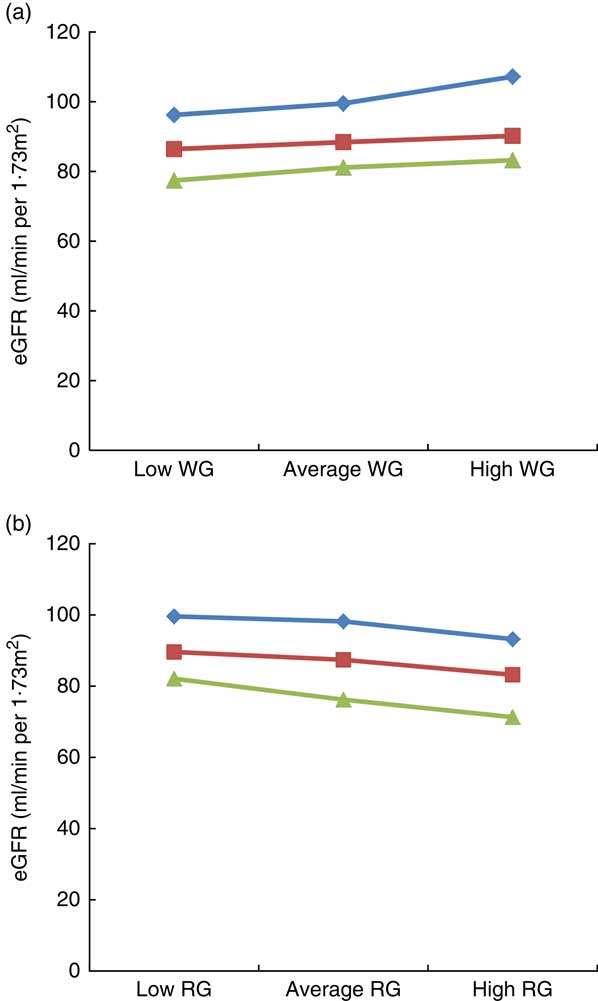
The results of the moderation analysis to investigate the role of adiposity (assessed by BMI) in the association between WG and RG intake with eGFR are shown in Fig. 1(a) and (b). In the model adjusted for age, sex, race, poverty:income ratio, alcohol intake, energy intake, smoking, physical activity, fasting blood glucose, systolic and diastolic blood pressure, HTN, DM, TAG, HDL and CRP, BMI moderated the link between WG and eGFR, for example, when WG consumption changed from low to high, eGFR in the low BMI category (21·3 kg/m2) changed from 96·2 to 107·2 ml/min per 1·73 m2 (an increase of 11 ml/min per 1·73 m2), whereas in the high BMI category (36·3 kg/m2) it changed from 77·4 to 83·2 ml/min per 1·73 m2 (an increase of 5·8 ml/min per 1·73 m2), thus suggesting that obesity strongly modulates the impact of WG on eGFR, particularly in the group of low BMI (Fig. 1(a)). With regard to RG consumption, in the low BMI category, eGFR varied from 99·6 to 93·2 ml/min per 1·73 m2 (6·4 ml/min per 1·73 m2 increase), whereas in the high BMI category, it changed from 82·1 to 71·3 ml/min per 1·73 m2 (10·8 ml/min per 1·73 m2 increase), indicating that in contrast to WG intake, a higher BMI had a greater impact on the link of RG with eGFR (Fig. 1(b)).
Impact of BMI on the link between estimated glomerular filtration rate (eGFR), whole grain (WG) and refined grain (RG) consumption. (a) Impact of BMI on the link between eGFR with WG, (b) impact of BMI on the link between eGFR with RG. Average indicate mean values, low indicates mean –1 sd values and high indicates mean 1 sd values.
![]() , Low BMI;
, Low BMI;
![]() , average BMI;
, average BMI;
![]() , high BMI.
, high BMI.
Discussion
To our knowledge, the present study is the largest study that examined the association of WG, RG and WG:RG ratio with CKD prevalence and renal function markers in a representative sample of US adults. We found that participants with a higher intake of WG had better markers of renal function, while RG adversely affected these markers. Furthermore, participants with a greater intake of WG or WG:RG ratio had a lower risk for CKD, whereas subjects with a higher RG consumption had a greater likelihood of CKD. Adiposity, assessed by BMI, significantly moderated the link between WG and RG with eGFR. Our findings were robust even after adjustment for a wide range of confounders.
Our results are in accordance with other studies. The prospective observational Nurses’ Health Study reported that women in the top quartile of the Dietary Approaches to Stop Hypertension (DASH) score (highly loaded with WG sources) had a decreased risk of rapid eGFR decline (OR: 0·55; 95 % CI 0·38, 0·80) compared with the lowest quartile(Reference Ahluwalia, Dwyer and Terry33). Furthermore, the highest quartile of the Western pattern score (rich in with RG(Reference Mazidi, Kengne and Mikhailidis8)) was associated with a high risk of microalbuminuria (OR: 2·17; 95 % CI 1·18, 3·66) and rapid eGFR decline ≥3 ml/min per 1·73 m2 per year (OR: 1·77; 95 % CI 1·03, 3·03)(Reference Lin, Fung and Hu40). The MESA (n 5000) demonstrated that a dietary pattern rich in WG was associated with a lower ACR (20 % lower ACR across quintiles, P=0·004), whereas a dietary pattern which is rich in animal food was directly associated with an 11 % higher ACR across quintiles (P=0·03)(Reference Nettleton, Steffen and Palmas20). Similarly, the Healthy Eating Index(Reference Preacher and Hayes39) was associated with a lower risk of albuminuria and eGFR decline in DM patients(Reference Dunkler, Dehghan and Teo41,Reference Xu, Sjögren and Ärnlöv42) . The Northern Manhattan Study (NOMAS) reported that a high vegetable intake (the main source of WG) was related to a significantly lower risk of incident eGFR <60 ml/min per 1·73 m2 (Reference Khatri, Moon and Scarmeas43). However, results from the Doetinchem Study (n 3787, 26–65 years) reported no link between WG intake, eGFR and mean ACR(Reference Herber-Gast, Boersma and Verschuren18), indicating that further research is needed to replicate these findings in other large populations. Discrepancies in these findings may be due to differences in study design. In this context, participants of the MESA study included older adults of mixed origin, whereas in the Doetinchem Study there were relatively young, white individuals with well-preserved renal function.
In this context, findings from the prospective Framingham Heart Study and NOMAS showed that a higher diet quality(Reference Foster, Hwang and Massaro19,Reference Ma, Jacques and Hwang44) , a better adherence to a Mediterranean(Reference Khatri, Moon and Scarmeas43) or a DASH diets, but not prudent diet(Reference Lin, Fung and Hu45) was associated with a reduced incidence of low eGFR or risk of rapid eGFR decline. As a higher intake of WG and limited consumption of RG are highly recommended in these dietary patterns, it is expected that these individual foods are associated with renal function too, which is in accordance with our results.
Poor diet could lead to several tissue-specific and systemic metabolic disturbances that could enhance renal dysfunction(Reference Gopinath, Harris and Flood46,Reference Odermatt47) . For example, diets with high load of WG are inversely linked with inflammatory factors, whereas a diet with high amount of total fats and processed meats is positively related with inflammatory factors(Reference Nettleton, Steffen and Mayer-Davis48). Of note, a link between inflammation and unfavourable renal profile was proposed(Reference Nerpin, Helmersson-Karlqvist and Risérus49). Taken together with our results, decreasing the level of inflammation (increasing load of WG and ratio of WG:RG) should be a reasonable target to control and prevent the developments of CKD.
There is a biological plausibility that WG may protect against declining kidney function. Possible mechanism might be associated with the endothelial dysfunction, which has been associated with both CKD and cardiovascular risk, and has been favourably affected by a WG intake(Reference Qi, van Dam and Liu50). Moreover, some studies reported a beneficial impact of WG intake on inflammation(Reference Qi, van Dam and Liu50–Reference Lutsey, Jacobs and Kori52), which is closely linked to CKD (as explained before). Lipid profile and blood pressure have also been favourably affected by WG consumption, which may also translate into beneficial kidney effects(Reference Liese, Roach and Sparks53,Reference Steffen, Jacobs and Murtaugh54) . Of note, statins that exert anti-inflammatory and hypolipidaemic effects have also been shown to improve kidney function(Reference Athyros, Katsiki and Karagiannis55–Reference Deedwania58). It has been reported that WG are a rich source of fibre, minerals (Mg, K, P, Se, Mn, Zn and Fe), vitamins (particularly high in vitamins B and E), phenolic compounds, phyto-oestrogens (lignans) and related antioxidants(59). These compounds have been found to favourably affect markers of inflammation and glucose homoeostasis(Reference Ajani, Ford and Mokdad60,Reference King, Egan and Geesey61) . Moreover, WG intake may produce SCFA in the large intestine which have beneficial effects on insulin/glucose management(Reference Canfora, Jocken and Blaak62).
We also found that individuals with a higher intake of WG had lower serum levels of uric acid, while, in contrast, there was a positive association between RG intake and uric acid concentrations. Elevated levels of serum uric acid have been associated with increased cardiovascular risk and CKD(Reference Katsiki and Mikhailidis63–Reference Xia, Luo and Li65). In this context, it has been suggested that lowering serum uric acid may improve kidney function(Reference Mende66,Reference Sampson, Singer and Walters67) .
The current study has significant clinical and public health implications, regarding the link between WG and RG consumption with renal markers. Our study revealed that, on the one hand, increasing the load of WG (include cereal grains that consist of the intact, or ground, cracked or flaked fruit of the grains) in the diet from half of servings/d to about one-and-a-half of servings/d could essentially improve the kidney function and chance of CKD, on the other hand, once the intake of the RG increased from one-third of a servings/d to four servings/d it could significantly damage the renal functions and enhance the likelihood of low eGFR. In this regard, a crucial step is necessary towards public health policy making and raising public awareness about the advantages and disadvantages of the WG and RF and choosing the right food basket for the family.
This is the largest study on the association of WG and RG with renal function markers. Participants represented a random sample of the general US population and therefore the results can be extrapolated to the general US population. Because data collection was performed on all weekdays in NHANES, the potential for day-specific information bias is very low(Reference Tooze, Midthune and Dodd68,Reference Guenther, Ding and Rimm69) . Our findings have to be considered along with the context of some study limitations. First, its cross-sectional nature does not allow for direct inference about causality. Second, it is well known that a single 24 h diet recall interview is not ideal for characterising an individual’s long-term habitual intake(Reference Hebert, Hurley and Steck70,Reference Ma, Olendzki and Pagoto71) . Finally, we did not have data on repeated measurements of exposures and outcomes to evaluate changes over time. So, for future studies it would be suitable to take into consideration some dietary factors that may affect kidney function, such as fat intake. We need to mention that although BMI is commonly used to estimate adiposity, this marker might be inaccurate and can lead to bias in measuring adiposity(Reference Rothman72). BMI does not take into consideration age, sex, bone structure, fat distribution or muscle mass(Reference Rothman72). To overcome this issue, future studies need to use fat mass from bio-impedance which is more accurate than BMI for the adiposity(Reference Rothman72). Given the nature of the study, there is always a chance of the residual bias and unmeasured factors that may influence our results, therefore, our results need to be confirmed by randomised controlled trial.
Conclusions
The results of the present study shed light on the beneficial effects of WG on kidney function and CKD. Furthermore, RG intake was adversely associated with markers of kidney function. These findings suggest the potential utility of modulating diet as a strategy to prevent CKD. The obtained results might have application for both population-wide and high-risk approach to CKD prevention and management in various settings.
Acknowledgements
This research received no specific grant from any funding agency, or from commercial or not-for-profit sectors.
All authors contributed to: (1) substantial contributions to conception and design, or acquisition of data, or analysis and interpretation of data, (2) drafting the article or revising it critically for important intellectual content, and, (3) final approval of the version to be published.
N. K. has given talks, attended conferences and participated in trials sponsored by Amgen, Angelini, Astra Zeneca, Boehringer Ingelheim, MSD, Novartis, NovoNordisk, Sanofi and WinMedica. D. P. M. has given talks and attended conferences sponsored by MSD, AstraZeneca and Libytec. The other authors have no conflict of interest to declare.