

Introduction
As human consumption and populations increase, the demand for land and natural resources inevitably intensifies pressure on wildlife, and this competition epitomizes the challenges associated with human–wildlife coexistence. Anthropogenic pressures are rapidly expanding globally, causing direct loss of biodiversity and a decline in human well-being (Dickman & Hazzah, Reference Dickman, Hazzah and Angelici2016). Multiple-use landscapes are often the most turbulent and complex contexts for securing coexistence, where managers are tasked with balancing multiple values and needs to ensure human well-being and secure conservation goals simultaneously (Peterson et al., Reference Peterson, Peterson, Peterson and Leong2013).
In such multi-use landscapes many large mammals with declining global populations occur outside protected areas (Di Marco et al., Reference Di Marco, Boitani, Mallon, Hoffmann, Iacucci and Meijaard2014), and their survival is dependent on human tolerance, which varies widely and is both multifaceted and complex (Treves & Bruskotter, Reference Treves and Bruskotter2014). By understanding this diversity along with ecological thresholds, conservation managers will be able to identify how pressures on people and wildlife can be alleviated (Dickman, Reference Dickman2010).
Financial loss or infrastructure damage (tangible costs) are often presumed to be the primary determinants of tolerance (Barua et al., Reference Barua, Bhagwat and Jadhav2013). Accordingly, financial instruments such as compensation and crop/livestock insurance schemes are widely promoted by conservationists for (1) offsetting these tangible costs and (2) increasing tolerance (Dickman & Hazzah, Reference Dickman, Hazzah and Angelici2016; Ravenelle & Nyhus, Reference Ravenelle and Nyhus2017). A typical example is compensation paid to the Mbirikani group in Kenya for livestock depredation, which reduced retaliatory killing of lions Panthera leo (Bulte & Rondeau, Reference Bulte and Rondeau2007).
Although compensation schemes can be effective in ameliorating tangible costs (Ravenelle & Nyhus, Reference Ravenelle and Nyhus2017), their effectiveness is increasingly questioned (Naughton-Treves et al., Reference Naughton-Treves, Grossberg and Treves2003; Marino et al., Reference Marino, Braschi, Ricci, Salvatori and Ciucci2016); such schemes can have the unintended consequence of subsidizing agricultural expansion (Bulte & Rondeau, Reference Bulte and Rondeau2005). Furthermore, communities may struggle to navigate bureaucratic systems for payment claims (DeMotts & Hoon, Reference DeMotts and Hoon2012; Barua et al., Reference Barua, Bhagwat and Jadhav2013), payments are insufficient and often delayed (Ravenelle & Nyhus, Reference Ravenelle and Nyhus2017), and societal rifts may develop when elite capture stymies the equitable distribution of funds (Sommerville et al., Reference Sommerville, Jones, Rahajaharison and Milner-Gulland2010).
Perhaps more fundamentally, compensation schemes may not lead to increased tolerance, a prerequisite for reducing human persecution of wildlife (Treves et al., Reference Treves, Wallace and White2009; Marino et al., Reference Marino, Braschi, Ricci, Salvatori and Ciucci2016). For example, communities in Solapur, India, and Wisconsin, USA, neither reported nor expected payments to improve people's attitude towards wolves, despite the popularity of compensation in both locations (Agarwala et al., Reference Agarwala, Kumar, Treves and Naughton-Treves2010). Compensation schemes may also have low effectiveness when intangible costs are more important than tangible costs for driving tolerance (DeMotts & Hoon, Reference DeMotts and Hoon2012; Barua et al., Reference Barua, Bhagwat and Jadhav2013) but few empirical studies have examined this topic (Muradian et al., Reference Muradian, Arsel, Pellegrini, Adaman, Aguilar and Agarwal2013). Kansky et al. (Reference Kansky, Kidd and Knight2016) found intangible rather than tangible costs, to be significant in driving attitudes towards chacma baboons Papio hamadryas ursinus in a South African urban context. Intangible costs are non-monetary, temporally delayed or psychological in nature (Ogra, Reference Ogra2008), typically embodied as fear, stress, sleep-deprivation or grief associated with the deaths of community members (Davies et al., Reference Davies, Wilson, Hazarika, Chakrabarty, Das, Hodgson and Zimmermann2011). These costs are difficult to assess (Schwerdtner & Gruber, Reference Schwerdtner and Gruber2007), and with current policies and management focused on direct quantifiable damages (Ravenelle & Nyhus, Reference Ravenelle and Nyhus2017) there is little impetus to address them (DeMotts & Hoon, Reference DeMotts and Hoon2012). A review identified studies of 138 unique compensation programmes that ran during 1980–2015; within these studies there were 173 suggestions for improving compensation effectiveness, with only one identifying the need to account for psychological damages (Ravenelle & Nyhus, Reference Ravenelle and Nyhus2017).
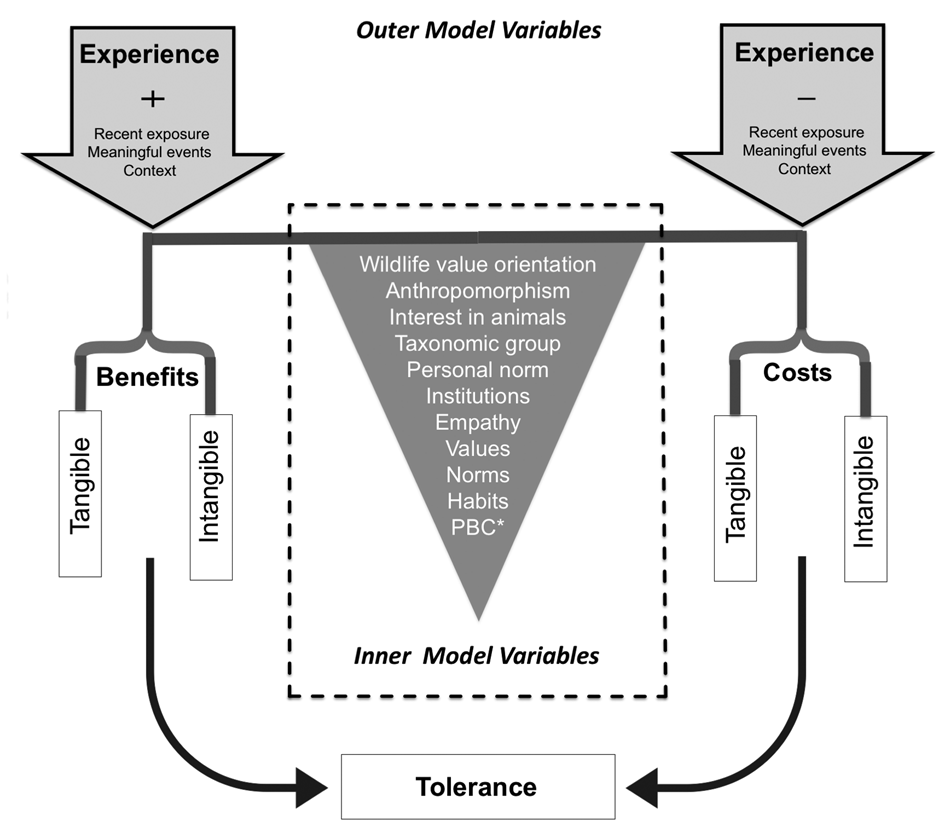
Here we quantify the drivers of tolerance towards Asian elephants Elephas maximus among subsistence rice farmers in Bangladesh. We define tolerance as the ability of the individual to absorb the potential or actual costs of living with wildlife (Kansky et al., Reference Kansky, Kidd and Knight2016). Given the direct dependence of Bangladeshi communities on the natural resources they harvest, we test if tangible damage-related costs or intangible costs are more significant in driving tolerance. We apply the wildlife tolerance model (Fig. 1; Kansky et al., Reference Kansky, Kidd and Knight2016) as the theoretical framework to uncover these pathways and indicate whether monetary compensation would be a useful intervention. We chose this particular model because (1) it distinguishes between tangible and intangible costs, (2) it comprises a set of indicators that are applicable for cross-cultural and cross-species comparisons, potentially providing landscape-level insights in the future (this is the second time this model is being applied), and (3) these variables are designed to be analysed using structural equation modelling, a statistically robust method for inferring causality in complex scenarios.
The wildlife tolerance model (Kansky et al., Reference Kansky, Kidd and Knight2016). In the outer model, tolerance is determined by the net perceived costs and benefits of living with a species, based on the extent to which a person experiences a species. The inner model consists of an additional 11 variables that influence tolerance through costs and benefits. The order of inner model variables listed in the inverted triangle is random. The triangle indicates that the 11 variables point to and drive tolerance through effecting perceptions of costs and benefits. *PBC, perceived behavioural control.
Study area
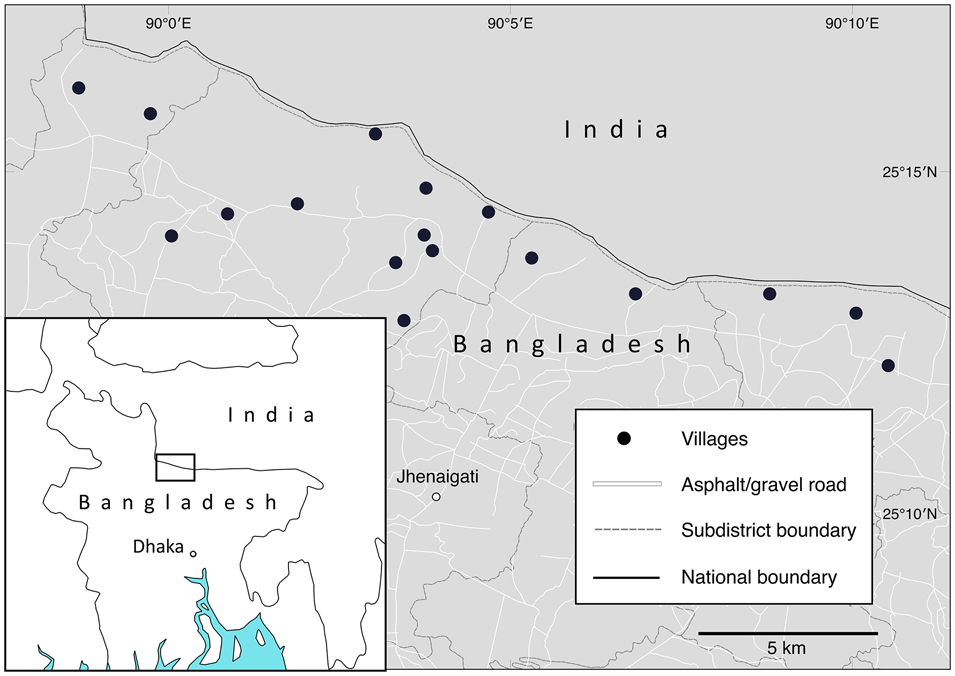
The 180 km2 study area (Fig. 2) is in the Sherpur district of Bangladesh. It is an agricultural mosaic of paddy fields within a matrix of acacia Acacia catechu plantations and remnants of secondary Śāl Shorea robusta forests (Islam et al., Reference Islam, Mohsanin, Chowdhury, Choudhury, Aziz and Uddin2011). The site shares a national border and a transboundary elephant population of c. 50 individuals (Motaleb & Ahmed, Reference Motaleb and Ahmed2016) with the biodiverse Indian state of Meghalaya. Similar to Assam in India and south-east Bangladesh, northern Bangladesh has a history of difficult coexistence between people and elephants (Islam et al., Reference Islam, Khan, Kabir, Chowdhury, Feeroz and Begum1999; Gogoi, Reference Gogoi2018). Conflicts typically occur in paddy fields and households. During 2000–2018, 78 people died and 68 were injured by elephants in the study area, with c. 42% of fatalities reported in crop fields (as a result of crop-guarding) and c. 38% in homes (Aziz et al., Reference Aziz, Shamsuddoha, Maniruddin, Morshed, Sarker and Islam2016). Household destruction and agricultural losses were the most common types of damage reported, with villages closer to forests suffering more (Sarker & Røskaft, Reference Sarker and Røskaft2014). Conflict is linked to degradation of the elephants’ habitat as a result of unregulated firewood collection (residents have no other energy source for cooking), overgrazing and the clearing of remaining secondary forest for acacia plantations (Islam et al. Reference Islam, Mohsanin, Chowdhury, Choudhury, Aziz and Uddin2011). It has been exacerbated by the expansion of the national border fencing, which has disrupted migrations and prevented herds from returning to the Meghalaya forests (Aziz et al., Reference Aziz, Shamsuddoha, Maniruddin, Morshed, Sarker and Islam2016), forcing them into closer proximity to people. Since 2008, 25 elephant deaths have been recorded in the study area, with nine of those known to be caused by human intervention (Aziz et al., Reference Aziz, Shamsuddoha, Maniruddin, Morshed, Sarker and Islam2016).
Location of the study villages in Sherpur District, Bangladesh.
Methods
The wildlife tolerance model consists of two components: an outer model with six variables and an inner model with 11 variables (Kansky et al., Reference Kansky, Kidd and Knight2016). In the outer model, experience is the first variable and is operationalized using two variables: (1) recent exposure to a species, and (2) number of meaningful events a person has had with the species. Exposure measures the frequency and spatial proximity of a person's exposure to wildlife in a particular time frame. Meaningful events are emotionally charged experiences, which can be either positive or negative and are not time constrained; i.e. they could have occurred at any time in a person's life. Benefits and costs are the next pair of variables, and are separated into tangible and intangible. The first hypothesis of the outer model (H1) is that experience drives perceptions of costs and benefits; if their experiences are more positive than negative, people will perceive greater benefits, and vice versa. The second hypothesis of the outer model (H2) is that cost and benefit perceptions drive tolerance.
The inner model consists of 11 variables predicted to influence perceptions of costs and benefits: wildlife value orientation, anthropomorphism, interest in animals, taxonomic group, personal norm, institutions, empathy, values, norms, habits, and perceived behavioural control. For example, people who are more interested in animals are hypothesized to perceive relatively more benefits than costs, and therefore to be more tolerant than those who dislike animals. The outer and inner models can be applied independently or together, depending on the context and resources available. If the community in question is not in direct contact with wildlife (e.g. when determining how tolerant UK citizens would be towards the reintroduction of the lynx Lynx lynx) then only the inner model variables are applicable, as there is no experience with the species. In this study we tested the two hypotheses of the outer model only. The variables are described in Table 1.
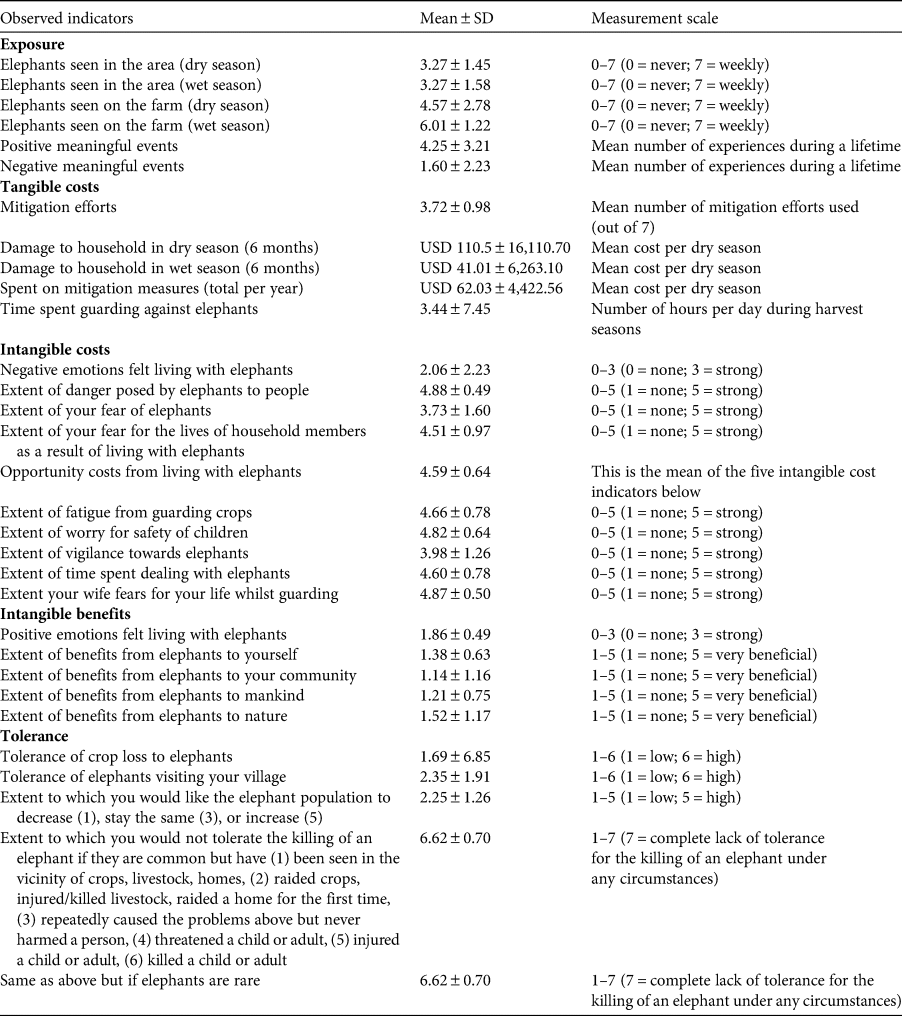
Descriptions of the outer model variables of the wildlife tolerance model that were applied in a survey to investigate tolerance of Asian elephants Elephas maximus in rural Bangladesh, with examples of survey questions. The full set of questions and measurements is in Supplementary Table 1.
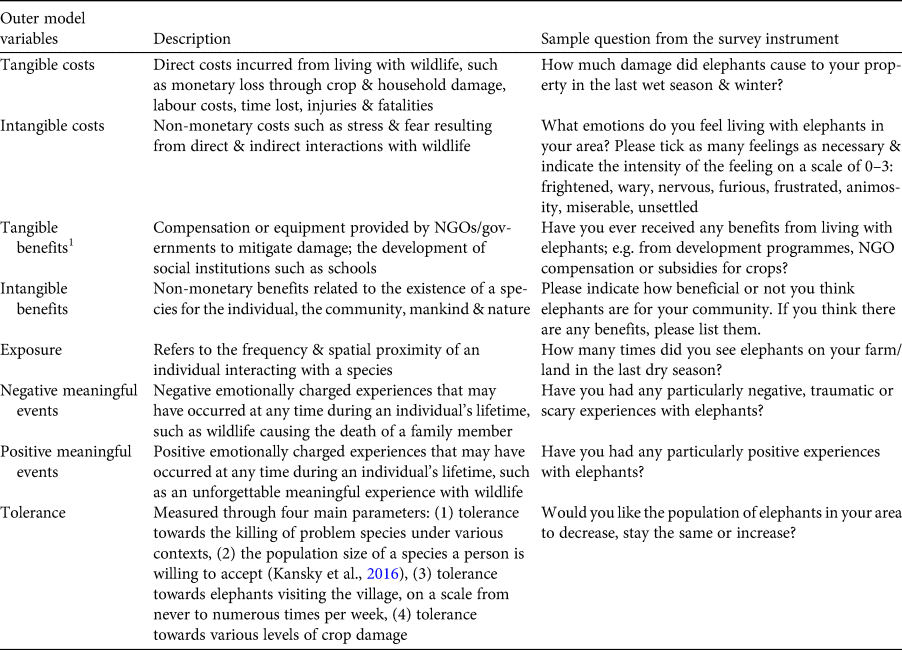
1Tangible benefits were not included in the analysis because of insufficient numbers of responses.
We conducted pilot interviews (n = 37) in villages with a history of human–elephant conflict. We evaluated the results and made changes to the survey instrument to align with the socio-cultural context of Bangladeshi farmers. The final survey of 243 households was conducted during May–July 2016 in 17 villages. We interviewed male heads of households from the major cultural groups (Bengali-Muslims, 63.94%; Garo-Christians, 19.74%; Koch-Hindus, 16.32%), typical of the overall population in the northern extents of Sherpur District. We interviewed men exclusively because during the pilot study women were unable to answer questions relating to tangible costs (e.g. the financial damage to crops), meaningful events, and exposure (e.g. number of elephant visits to farms), which are necessary to build the outer model. Two Bangla-speaking interviewers administered randomized household interviews (Babbie, Reference Babbie2015). Whilst walking in one direction through a village, each household was approached for availability for an interview. The ethnicity/religion of the occupier was not known prior to conducting the interview, and the number of householders interviewed in each village varied. Respondents were asked to participate in a rural livelihood survey (Supplementary Table 1); elephants were not mentioned explicitly, to avoid response bias.
We analysed the survey results using partial least squares structural equation modelling (Hair et al., Reference Hair, Hult, Ringle and Sarstedt2016), to test relationships between the outer model variables, using SmartPLS (Ringle et al., Reference Ringle, Wende and Becker2015). Partial least squares is a less frequently applied structural equation modelling method that is preferred when conducting exploratory theoretical research, compared to the more typical covariate-based methods, which are usually used to accept or reject more established hypotheses (Reinartz et al., Reference Reinartz, Haenlein and Henseler2009; Lowry & Gaskin, Reference Lowry and Gaskin2014).
Structural equation modelling consists of (1) a measurement model, which assesses how distinct constructs are from each other based on the indicators used (Lowry & Gaskin, Reference Lowry and Gaskin2014), and (2) a structural model, which evaluates the relationships between independent and dependent latent variables (latent variables are abstract complex phenomena that are not directly observable). Interviews with > 30% missing responses were removed from the dataset to ensure the overall model's predictive reliability.
We evaluated the measurement model across five models to ensure reliability: the full model, and four models with systematic removal of indicators from constructs. These were assessed by calculating (1) indicator reliability, which represents how much of the variation in an indicator is explained by the variable, (2) discriminant validity, which indicates the extent to which a variable is truly distinct from other variables thereby capturing phenomena not represented by other constructs in the model, (3) composite reliability, which shows whether the indicators measuring a variable are similar in their scores, and (4) convergent validity, which shows whether variables that should be theoretically related to each other are observed to be so, and is measured through the average variance extracted (Hair et al., Reference Hair, Hult, Ringle and Sarstedt2016).
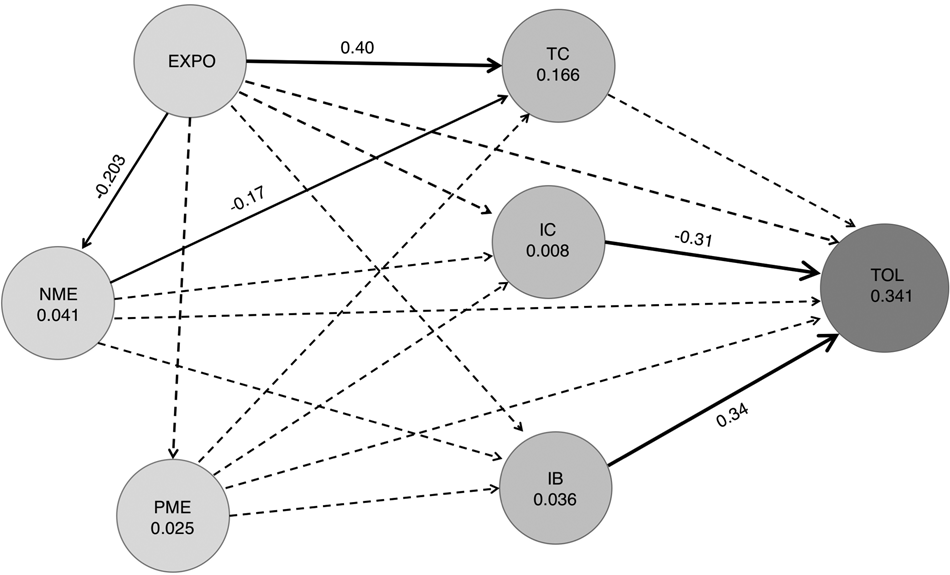
The structural model utilizes the set of indicators collected via the survey (Supplementary Table 1) to create the latent variables, also known as constructs. The importance of (i.e. variance explained by) each construct is computed by R 2, the coefficient of determination, and the relationships between each construct by the path coefficient (Hair et al., Reference Hair, Hult, Ringle and Sarstedt2016; Fig. 3). The path coefficients describe the extent to which each construct affects the other (−1 indicates a highly negative impact and +1 a highly positive impact). The relative statistical importance of the path coefficients is determined using their varying weights, and facilitates ranking (Wong, Reference Wong2013). We calculated bootstrap confidence intervals and evaluated the significance of path coefficients by ascertaining if zero falls within the 95% confidence intervals (Hair et al., Reference Hair, Hult, Ringle and Sarstedt2016).
Partial least squares structural equation models of latent variables: tangible costs (TC), intangible costs (IC), intangible benefits (IB), exposure (EXPO), negative meaningful events (NME), positive meaningful events (PME), and tolerance (TOL). Values within the circles are the coefficients of determination (R 2). Lines joining circles are the path coefficients linking the latent variables. Solid lines represent significant path coefficients and dashed lines non-significant path coefficients.
Results
Of the 243 interviews conducted, 234 were used in the analysis. Descriptive results for the outer model constructs are presented in Table 2, and indicate the experiences, costs, benefits and tolerance experienced by the population. We found no differences in tolerance by age or religious affiliation (Supplementary Material 2). Tangible benefits were not analysed, as respondents failed to deliver sufficient responses for structural equation modelling.
Observed indicators from the wildlife tolerance model's outer constructs. For a description of indicator calculations that determine the construction of latent variables see Supplementary Table 1.
The results for measurement models 1–5 are presented in Table 3. Low convergent validity resulted for tangible costs (0.25) and intangible benefits (0.35) when all indicator items were used in the analysis (i.e. model 5). This had little impact on composite reliability, path coefficients and R 2 values (Tables 3, 4 & 5, respectively). In addition, indicator reliability, measured as outer loadings (Supplementary Table 2), showed consistent results across variations of the model. We report model 3 (Fig. 3) but the other models yielded similar conclusions. The discriminant validity for the Fornell–Larckner criterion was not met for two pathways for intangible benefits and tangible costs, which is probably related to their low convergent validity (0.44 and 0.51, respectively) but there was discriminant validity for these pathways in our other models (1 and 5), which suggests these constructs are distinct. As the wildlife tolerance model is still an exploratory model, further work will be required to improve on the low convergent validity and discriminant validity measures under various contexts (Ping, Reference Ping2007).
Observed differences from measurement model evaluation, representing variation in reliability across the five structural equation models, each of which contains a differing selection of indicators. Model 5 is the complete model with no indicators removed, whereas Models 1–4 have selected indicators removed (see Supplementary Table 1 for a description of the indicators). For average variance extracted (AVE) a value of 0.5 or higher indicates that on average the construct explains more than half of the variance of its indicators. Composite reliability (CR) is used to determine whether the items measuring a construct are similar in their scores; the value should be in the range 0.7–0.9 but for exploratory research 0.6 is acceptable. Discriminant validity (DV) is the extent to which a construct is truly distinct from other constructs (Yes: the The Fornell-Larckner criterion was met, meaning the construct was significantly unique; No: it was not.)
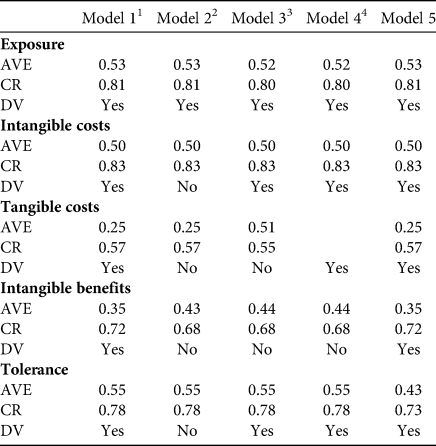
1Indicators removed from Model 1: Tol_kill_(1 + 2) (tolerance).
2Indicators removed from Model 2: Tol_kill_(1 + 2) (tolerance), Ben_you (intangible benefits), Ben_com (intangible benefits).
3Indicators removed from Model 3: Tol_kill_(1 + 2) (tolerance), Ben_you (intangible benefits), Ben_com (intangible benefits), Mitigation_effort (tangible costs), Hours_lost_night (tangible costs), Spent_mitigation (tangible costs).
4Indicators removed from Model 4: Tol_kill_(1 + 2) (tolerance), Ben_you (intangible benefits), Ben_com (intangible benefits), Mitigation_effort (tangible costs), Hours_lost_night (tangible costs), Spent_mitigation (tangible costs), cost_dry (tangible costs).
Path coefficients for Models 1–5, with significant pathways indicated in bold, and change in significance as a result of the removal of an indicator indicated in italics.
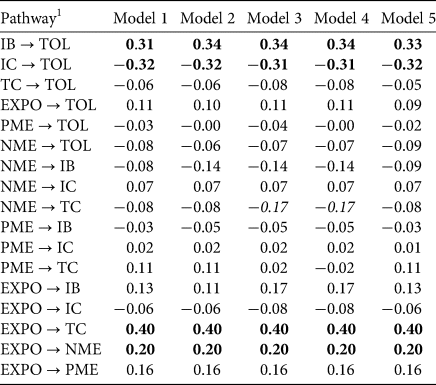
1IB, intangible benefits; TOL, tolerance; IC, intangible costs; TC, tangible costs; EXPO, exposure; PME, positive meaningful events; NME, negative meaningful events.
Coefficient of determination (unadjusted R 2) for all models.
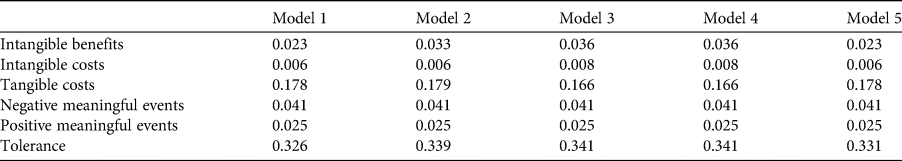
Results from our structural model (Fig. 3) indicate that of the experience constructs (exposure, negative and positive meaningful events) only exposure (0.40) and negative meaningful events (−0.17) drove tangible costs, whereas their effect on intangible costs and benefits were non-significant (Table 4). Approximately 17% of variation in tangible costs was explained by exposure and positive meaningful events, and 2% of variation in intangible benefits and 0% in intangible costs were explained by the three experience constructs (Table 5).
Regarding our second hypothesis, we found that intangible costs (−0.31) and benefits (0.34) significantly drove tolerance, yet tangible costs were non-significant (Table 4). Approximately 34% of variance in tolerance was explained by tangible costs, intangible costs and intangible benefits.
Discussion
Considering the direct reliance of rural Bangladeshi communities on the crops they harvest for personal consumption, it could be assumed that their tolerance for wildlife would be determined by the level of threat posed to their livelihoods. Our results indicate that communities suffer considerable monetary losses from damage caused by elephants (15.5% mean loss of annual income). However, those experiencing higher monetary losses were not necessarily less tolerant, as indicated by the non-significant path coefficient between tangible costs and tolerance. In a previous study using the wildlife tolerance model in Cape Town, South Africa, tangible costs were also non-significant in driving the tolerance of urban residents towards baboons Papio spp. (Kansky et al., Reference Kansky, Kidd and Knight2016). In the South African study this was perhaps unsurprising given that the livelihoods of relatively well-off urban residents were not particularly affected by baboon damage (Kansky et al., Reference Kansky, Kidd and Knight2016). However, in our study these results are more surprising given the reliance of farmers on rice as a staple food.
Within the complexity of a multi-use landscape such as that in our case study, multiple safety nets may reduce the impact of financial damages and costs (Aziz et al., Reference Aziz, Shamsuddoha, Maniruddin, Morshed, Sarker and Islam2016). Close family units often provide resilience against wildlife damage by covering each other's crop losses and providing emotional coping mechanisms (DeMotts & Hoon, Reference DeMotts and Hoon2012; Gogoi, Reference Gogoi2018). In addition, diversification of incomes from casual labour (e.g. logging in our study) reduces dependence on agricultural production to maintain livelihoods. Such existing mechanisms that mitigate the negative impacts of wildlife should be identified before implementing new conservation initiatives, and fostered thereafter. It should also be noted that agrarian communities may have been led unwittingly to partake in forest-degrading livelihood activities (e.g. logging) with the promise of economic gains, which may ultimately lead to negative livelihood impacts.
In synergy with these socio-economic safety nets, a spiritual belief common across the three main cultural groups in Sherpur is that damage by wildlife is God's will (Inskip et al., Reference Inskip, Carter, Riley, Roberts and MacMillan2016), which may explain the lack of significant relationships between tangible costs and tolerance. For example, one respondent stated:
If I have the blessing of God, elephants will not create any trouble in the locality, even to our crops.
Another, whose child had been killed by a raiding elephant, stated:
My child's lifetime expired and that's why he was killed. There is no way to blame the elephant.
A third stated:
If a child drowns you don't blame or hurt the water so how could you want to hurt an elephant if it was the reason the child died?
Similar beliefs have been recorded in other cases; e.g. regarding Bengal tigers Panthera tigris tigris in the Bangladeshi Sundarbans (Inskip et al., Reference Inskip, Carter, Riley, Roberts and MacMillan2016) and elephants in Assam, India (Gogoi, Reference Gogoi2018). This fatalistic acceptance of severe losses appears to be founded upon a belief that wildlife damage occurs within a natural order of events. Tolerant attitudes towards elephants may also stem from their association with deities (e.g. the Hindu god Ganesh; Ghosal & Kjosavik, Reference Ghosal and Kjosavik2015). At our study site we often witnessed people shouting the word Maama (maternal uncle) while guarding their crops against raiding elephants, in the hope of placating the elephants. These observations were not confined to the Hindu population but also included Muslims and Christians, who do not consider the elephant to be a deity.
These socio-economic safety nets and fatalistic beliefs are likely to be more complex than we suggest; they improve resilience through the collective sum of individuals in the community exhibiting their cultural norms. In a sense, tangible costs may not really be experienced independently by the individual but shared by the unified common culture of the community, which may explain further why direct costs were non-significant.
Intangible costs, on the other hand, were significant in driving tolerance among all respondents, similar to the South African study (Kansky et al., Reference Kansky, Kidd and Knight2016). Commonly cited costs were fear and stress, and the loss of sleep and productivity resulting from all-night vigils to guard fields. Framed within the concept of universal human needs (Tay & Diener, Reference Tay and Diener2011), these can be understood as unmet needs, such as lack of autonomy, lack of safety, and opportunity costs (e.g. time spent guarding against elephants could otherwise have been spent socializing). For residents of Sherpur we suggest a reduction in intangible costs could be achieved by employing specialized teams to guard fields, releasing farmers to focus on farming and to ensure adequate sleep, as well as creating jobs for unemployed youth. More research on intangible costs will be necessary to design initiatives that address the whole spectrum of costs endured by communities living with wildlife (Ogra, Reference Ogra2008; Barua et al., Reference Barua, Bhagwat and Jadhav2013; Pooley et al., Reference Pooley, Barua, Beinart, Dickman, Holmes and Lorimer2017), to inform arguments that will persuade policy makers/donors to support alleviating these costs. Alongside these intangible costs, intangible benefits were found to be equally significant for tolerance. Where intangible benefits are recognized, they lead to increased tolerance, suggesting that fostering the positive ontological and underlying relationships that people in Sherpur already have with elephants and increasing people's awareness of intangible benefits would be valid as a management mechanism.
We have explained how costs and benefits drive tolerance, which is the main focus of our research; however, it is also necessary to expound briefly on what initially affects the costs and benefits communities in Sherpur perceive. Although increasing exposure to elephants understandably resulted in increased tangible costs (Fig. 3), reducing exposure will not necessarily increase tolerance, as tangible costs are not a significant driver of tolerance. There was also a lack of significance between exposure and intangible costs or benefits, possibly because of the highly stochastic and dangerous nature of elephant visits (Davies et al., Reference Davies, Wilson, Hazarika, Chakrabarty, Das, Hodgson and Zimmermann2011), where one visit may be sufficient to shape perceptions permanently. Hence, interventions seeking to foster direct human–elephant interactions are unlikely to improve tolerance.
Similarly, negative meaningful events were significant in driving tangible costs. However, although positive meaningful events are predicted to increase intangible benefits, as was found in South Africa (Kansky et al., Reference Kansky, Kidd and Knight2016), this did not hold true in Bangladesh. This may stem from cultural beliefs in which elephants are respected/anthropomorphized (e.g. people identify with mourning behaviours expressed by elephants following a death in a herd; Barua et al., Reference Barua, Bhagwat and Jadhav2013), and thus perceived benefits are already fixed through deep-seated cultural conditioning processes rather than positive interactions with elephants. Overall, the costs and benefits in our study may have been driven by indicators we did not measure, and understanding what affects costs and benefits may be improved by employing the inner model variables (e.g. empathy and anthropomorphism) of the wildlife tolerance model (Supplementary Material 1).
In conclusion, the non-significance of tangible costs and the significance of intangible costs in driving tolerance suggest that in this case monetary compensation schemes may not be the most appropriate mechanism for increasing tolerance. This recommendation holds true as long as there is not a monetary threshold above which communities will not tolerate further monetary costs. Undoubtedly there will be occasions when monetary compensation is required but we should endeavour to avoid identifying drivers of tolerance and the costs communities face using only our intuition.
As conservationists we must advocate the use of robust science in achieving conservation goals whilst maintaining a sensitivity that balances conservation equally as a human discourse (Pooley et al., Reference Pooley, Barua, Beinart, Dickman, Holmes and Lorimer2017). Presented with this challenge, research on human–wildlife coexistence is usually designed for specific contexts using methodologies and variables appropriate to individual cases, but this prevents useful comparisons across contexts (Kansky et al., Reference Kansky, Kidd and Knight2016). The wildlife tolerance model provides a single model for repeated testing, which can promote development of testable theory and facilitate the identification of statistically robust drivers of tolerance. Such repeated testing is not common in conservation (Fazey et al., Reference Fazey, Fazey and Fazey2005), to the detriment of conservation science and practice. If repeated testing is conducted and tangible costs are found to be non-significant across a broad range of contexts, the implications could include redirection of funding (Santangeli & Sutherland, Reference Santangeli and Sutherland2017) and reprioritization of our efforts to address the costs communities truly face.
Acknowledgements
We thank WildTeam Bangladesh for supporting this research, Md Anwarul Islam for his invaluable hosting, Dipongkor Roy for his time in the field, two anonymous reviewers for their insightful comments, Jocelyne Sze for her contributions, and all the respondents for their time and generous hospitality.
Author contributions
Conception of research: RK, AK; design and implementation of fieldwork: OS, AP; data analysis: MK; writing: OS, RK, AK.
Conflicts of interest
None.
Ethical standards
The research proposal was approved by the ethics committees of the Department of Life Sciences, Imperial College London, and the Department of Zoology, Dhaka University, and conforms to the British Sociological Association's ethical standards.


