

INTRODUCTION
Mountain forests have two major roles in snow avalanche protection: preventing avalanche release (Gubler and Rychetnik, Reference Gubler and Rychetnik1991; McClung and Schaerer, Reference McClung and Schaerer2006; Teich and others, Reference Teich2012b), and decelerating and stopping flowing avalanches (Teich and Bebi, Reference Teich and Bebi2009; Anderson and McClung, Reference Anderson and McClung2012; Teich and others, Reference Teich, Bartelt, Grêt-Regamey and Bebi2012a, Reference Teichb; Feistl and others, Reference Feistl2014b). The protective effect of forests on avalanche release has been studied early and is relatively well known (Bebi and others, Reference Bebi, Kulakowski and Rixen2009). Regarding requirements for preventing full-depth avalanche release, Ishikawa and others (Reference Ishikawa, Sato and Kawaghchi1969) formulated criteria for the necessary forest stand density as a function of tree trunk diameter and slope angle, and this formula has been used as an afforestation guideline in Japan. The braking effect of forests on flowing avalanches has not been quantified yet.
There are several reports on forests damaged by avalanches (Mears, Reference Mears1975; Saeki and others, Reference Saeki, Watanabe and Ozeki1975; Shimokawa, Reference Shimokawa1983; Casteller and others, Reference Casteller2008; Bebi and others, Reference Bebi, Kulakowski and Rixen2009; Takeuchi and others, Reference Takeuchi, Torita, Nishimura and Hirashima2011, Reference Takeuchi2014; Feistl and others, Reference Feistl, Bebi, Margreth and Bartelt2014a). Large flowing avalanches can easily destroy large tracts of mountain forest, and the braking effect of a mountain forest is removed or at least reduced once it has been destroyed by an avalanche (Johnson, Reference Johnson1987; Gubler and Rychetnik, Reference Gubler and Rychetnik1991). According to the calculations by Bartelt and Stöckli (Reference Bartelt and Stöckli2001), the energy required to fracture, uproot and entrain trees is small compared with the total potential energy of an avalanche, particularly when the avalanche is large, and therefore the braking effect of a forest on a large flowing avalanche was considered to be minor (Brang and others, Reference Brang2006). However, it is also evident that the role of forests in braking avalanches depends on the size of the avalanche and forests of a certain structure are able to significantly reduce runout distances of small-to-medium avalanches (Teich and others, Reference Teich, Bartelt, Grêt-Regamey and Bebi2012a).
Avalanche activity is monitored in the Makunosawa valley, Myoko, Japan where avalanches often occur, and meteorological data are recorded near the valley to study the effect of meteorological factors on avalanche release (Takeuchi and Hirashima, Reference Takeuchi and Hirashima2013). Since 2000, seven large-scale avalanches with running distances exceeding 2000 m have been observed, and avalanche data from 19 winter seasons up to 2018 have been obtained (Takeuchi and others, Reference Takeuchi, Akiyama and Irasawa2002, Reference Takeuchi, Yamanoi, Endo, Murakami and Izumi2003; Takeuchi, Reference Takeuchi2010). Of the seven avalanches observed, the one that occurred on 17 February 2008 was the largest; it was the only event to have damaged large tracts of forest and it terminated in a cedar (Cryptomeria japonica) forest. Takeuchi and others (Reference Takeuchi, Torita, Nishimura and Hirashima2011) investigated the extent of damage to the cedar forest and obtained a unique and useful dataset to verify the braking effect of forests on flowing avalanches.
The importance of the effect of forests on flowing avalanches is now also recognized in modeling (Feistl and others, Reference Feistl2012, Reference Feistl2014b; Teich and others, Reference Teich2014). The effects of forested terrain have been considered within an avalanche dynamics program (RAMMS, Rapid Mass Movements) by increasing friction parameters, and it has been shown that even if forests cannot reduce the runout distances of large avalanches, they can prevent their lateral spread (Christen and others, Reference Christen, Bartelt and Kowalski2010a).
Feistl and others (Reference Feistl2012) compared two different approaches to quantify the forest effects; the first approach increased friction parameters, and the second approach extracted the mass from the avalanche flow that had been stopped by the trees (detrainment). Feistl and others (Reference Feistl2014b) subsequently quantified the effects of forests on small- and medium-sized avalanches, where trees had not been destroyed but where the runout had been affected. They applied a detrainment function and demonstrated how forests reduce the speed of avalanches. However, the detrainment approach has a limitation in that it is only valid for small-to-medium-sized avalanches: e.g. <10 000 m3 when the forest is not destroyed.
Numerical models have been developed to model and predict avalanche dynamics. Two- and three-dimensional avalanche dynamics models (Denlinger and Iverson, Reference Denlinger and Iverson2004; Iverson and others, Reference Iverson, Logan and Denlinger2004; Christen and others, Reference Christen, Kowalski, Bartelt and Stoffel2008, Reference Christen, Kowalski and Bartelt2010b) have been increasingly applied in avalanche hazard mapping and disaster reduction studies instead of simple stationary one-dimensional models (e.g. Voellmy, Reference Voellmy1955; Salm, Reference Salm1993). As to the Makunosawa valley, Abe and others (Reference Abe, Nakamura, Lang and Ohnuma1987) simulated the avalanche motion that occurred in 1984 using four one-dimensional models, and suggested that the avalanche was stopped by resistance of the forest which was located at the terminal point of the runout zone.
In this study, the avalanche dynamics program TITAN2D (Pitman and others, Reference Pitman2003; Patra and others, Reference Patra2005) is used to model the large 2008 Makunosawa avalanche. The two avalanche events on Mt. Iwate (see section ‘Mt. Iwate avalanche’) were also modeled using TITAN2D in order to examine whether the bed friction angles obtained for the Makunosawa avalanche are valid in other paths as well. Numerical simulations are conducted to compare the velocities of avalanches and their runout distances between forested and non-forested cases. Although there are more advanced models than TITAN2D that incorporate the physical processes, TITAN2D is used in order to suggest a simple method for examining the effect that forests have on stopping avalanches, for use in future forest management programs. The aim of this study is to ascertain whether forests can substantially decelerate and eventually stop avalanches, even if many trees are broken in the process.
THE MAKUNOSAWA VALLEY AVALANCHE
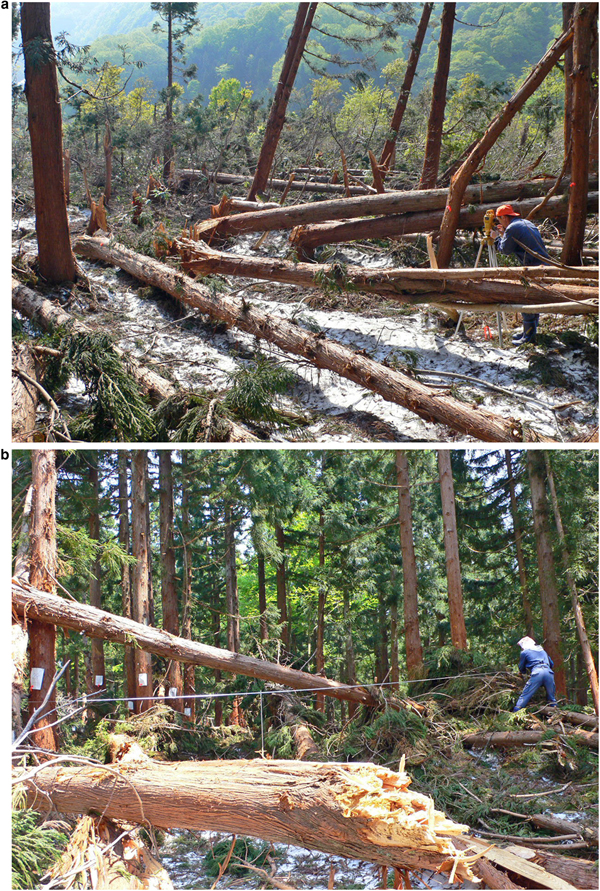
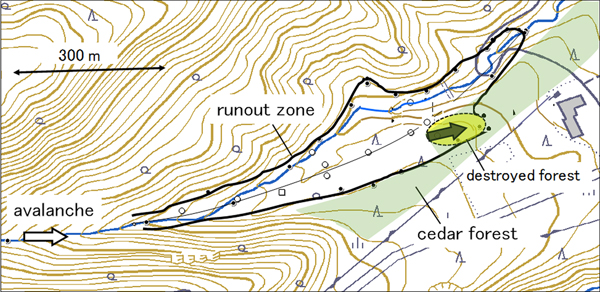
A large-scale, dry-slab avalanche occurred in the Makunosawa valley on 17 February 2008, damaging large tracts of forest (Takeuchi and others, Reference Takeuchi, Torita, Nishimura and Hirashima2011). The starting zone appeared to be on an east-southeast-facing slope located at ~1700 m a.s.l. (Fig. 1). The avalanche followed two paths: one was a straight path over the ridge, and the other was a curved path along a stream, as shown in Figure 1. It ultimately ended at ~770 m a.s.l. with a horizontal runout distance of ~3000 m. Part of the avalanche flowed into a cedar (C. japonica) forest in the runout zone (Fig. 1), breaking many cedar trees (Fig. 2). The cedar forest in the Makunosawa valley was planted in 1947 and stands were >60 years old. According to the investigations conducted within the destroyed area, tree heights were 3.5–22.2 m (15.5 m on average), tree diameters at breast height were 0.14–0.56 m (0.38 m on average), tree diameters at breaking height were 0.12–0.80 m (0.37 m on average) and the stand density was 480 ha−1.
Overview of Makunosawa valley. The two lines represent paths of the avalanche: (a) the straight route over the ridge; (b) the curved route along a stream. Part of the avalanche flowed into the cedar forest located in the ellipse.
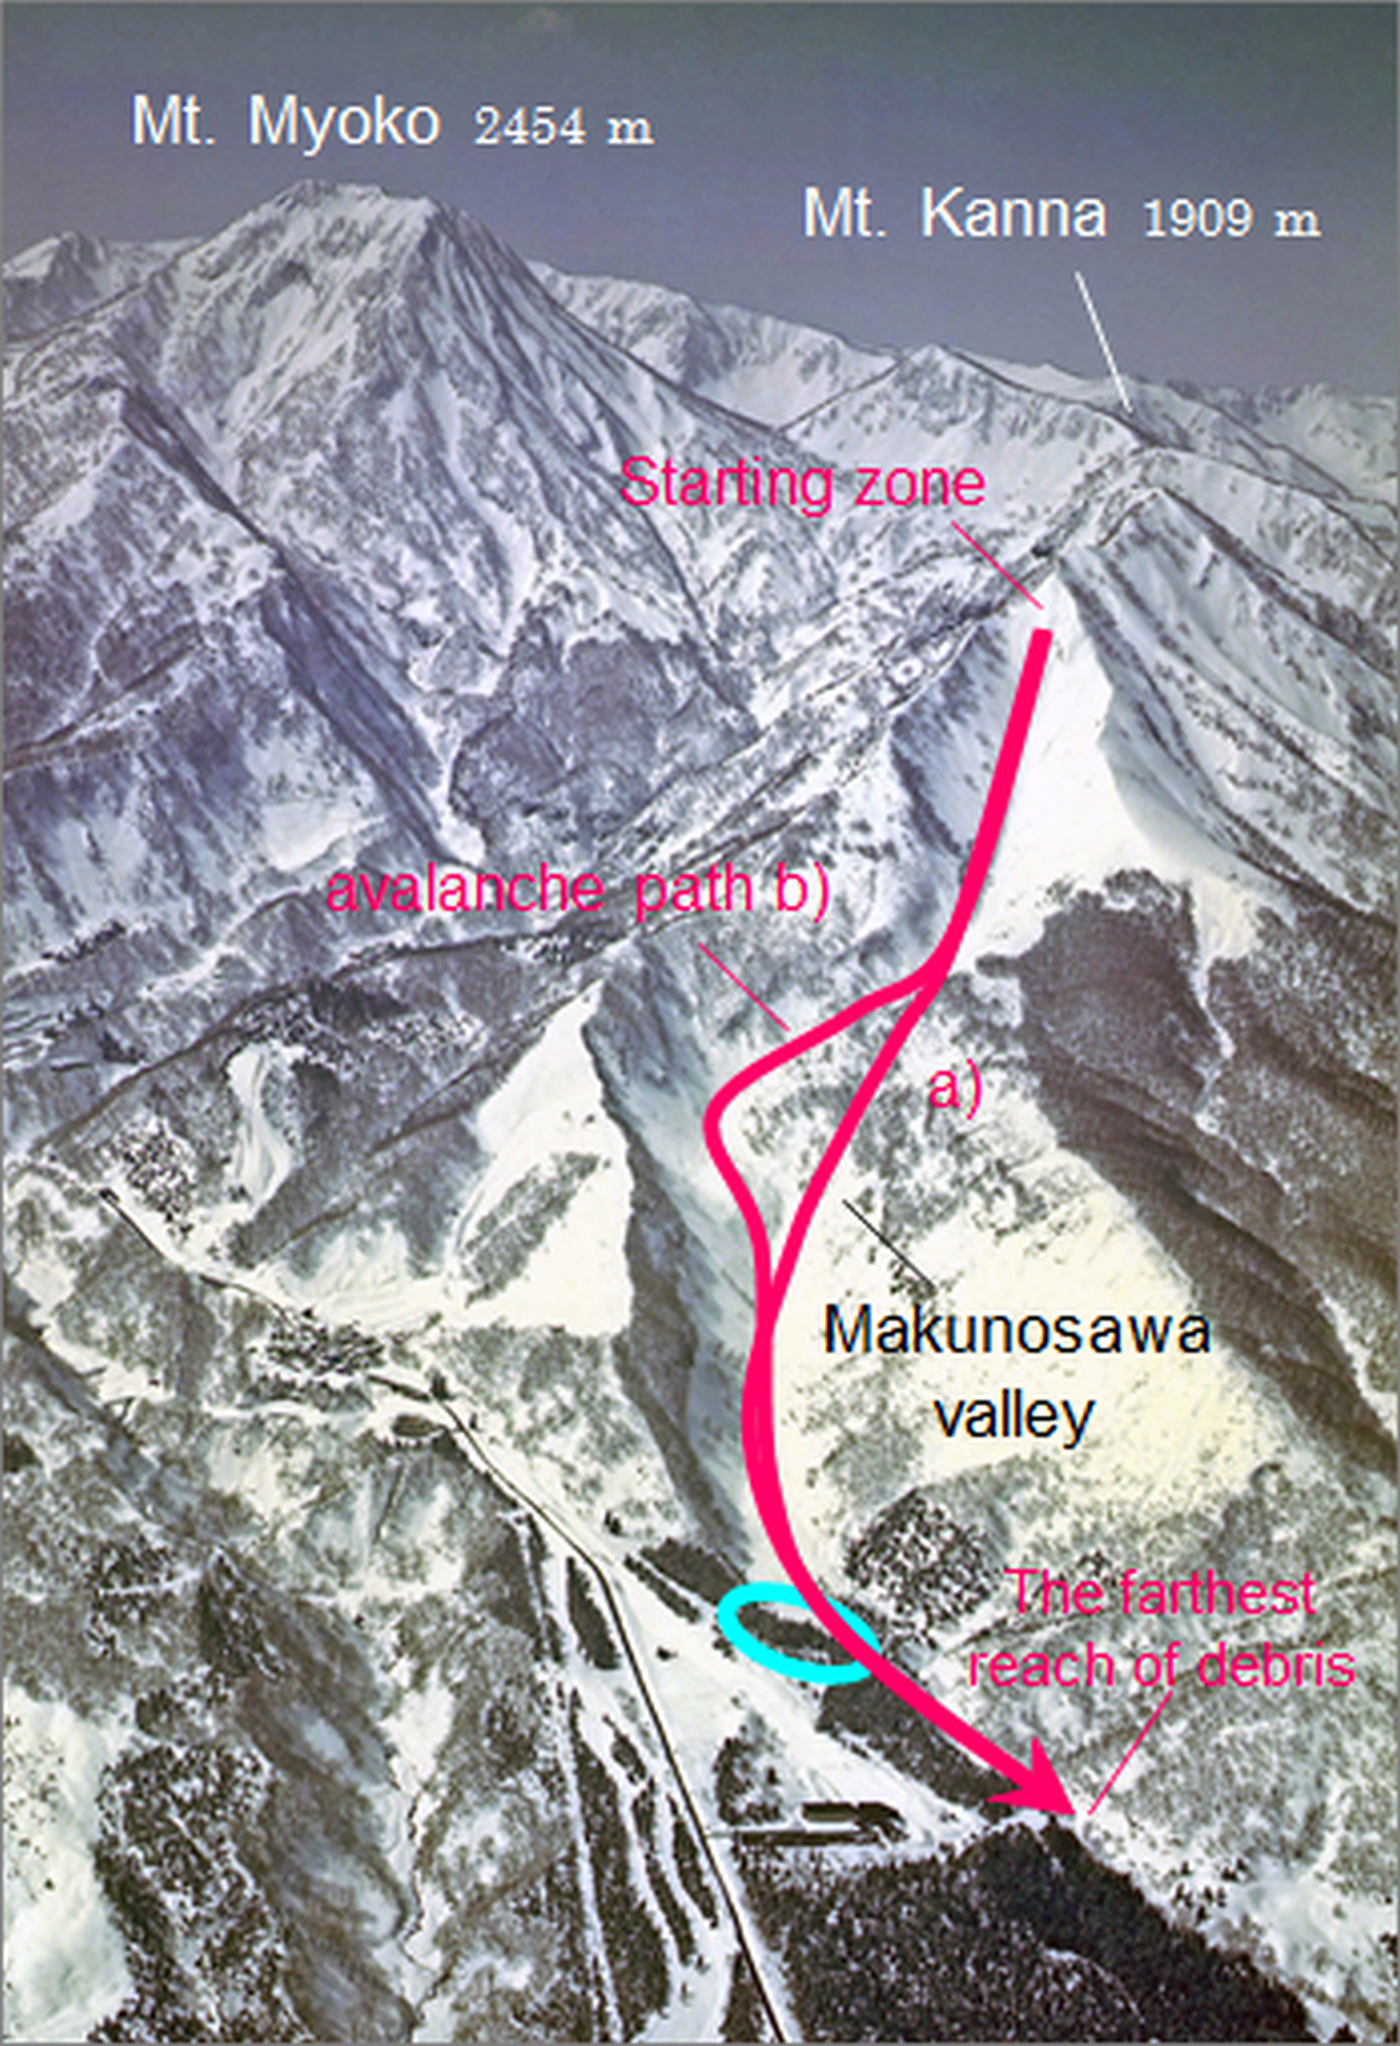
Broken and fallen cedar trees after the Makunosawa valley avalanche, 2008.

Damage to the cedar trees was particularly severe near the upper edge of the forest; fewer trees were damaged farther down, and the avalanche was found to have terminated within the forest and did not pass through it. On the basis of these observations, Takeuchi and others (Reference Takeuchi, Torita, Nishimura and Hirashima2011) attempted to estimate the avalanche's velocity in the forest from the bending stress of the broken cedar trees, and the avalanche was estimated to have surged into the forest at a velocity of at least 26–31 ms−1. Calculations revealed that the avalanche decelerated within the forest and terminated at ~130 m from its upper edge; these results were consistent with field observations. Field observations and calculations showed that the forest was effective in stopping the avalanche. However, the forest was in the runout zone of the avalanche where the slope was only 4°, and it is therefore possible that it may have terminated even if the forest had not been there. Therefore, in this study, to determine whether or not the cedar forest terminated the flowing avalanche in the Makunosawa valley, a numerical model simulation was conducted based on the field observations and data analysis by Takeuchi and others (Reference Takeuchi, Torita, Nishimura and Hirashima2011).
MT. IWATE AVALANCHE
Large-scale avalanches occurred on the west-facing slope of Mt. Iwate, Japan, during the winter of 2010–2011, and damaged 7 ha of subalpine forest containing species such as Maries’ fir (Abies mariesii) and Erman's birch (Betula ermanii) (Fig. 3). As these events seem to have penetrated the forest at high speed, it is probable that they were dry-slab avalanches, with starting zones higher than the tree line at ~1730 m a.s.l. (Takeuchi and others, Reference Takeuchi2014). According to the photographs and a snowpack model simulation (Hirashima and others, Reference Hirashima, Nishimura, Yamaguchi, Sato and Lehning2008, Reference Hirashima, Abe and Sato2011), the avalanches seem to have occurred by 6 January 2011 by a record heavy snowfall on 31 December 2010.
(a) Avalanche tracks on the west-facing slope of Mt. Iwate. (b, c) Broken and fallen trees after Mt. Iwate avalanche.

The extent of forest damage and the behavior of avalanche flows in subalpine forests were investigated in July 2012. Four investigation areas in the avalanche path were fixed and all trees within these areas were measured. Based on the investigations conducted on 85 Maries’ firs and nine Erman's birches and the bending stress of broken trees, avalanche velocities in the four investigation areas were estimated as (in order from the top) a minimum of 21–42, 33–53, 24–39 and 22–33 m s−1, respectively (Takeuchi and others, Reference Takeuchi2014).
The avalanches flowed for a distance of more than 500 m within the forest, breaking trees and eventually terminating on a 13° slope within the forest. It is therefore likely that the avalanches would have flowed farther downhill if the forest had not existed. Then the simulations with TITAN2D was conducted to estimate the run-out reduction due to the forest.
SIMULATION METHODS
TITAN2D model
TITAN2D is an open source that was developed to simulate dry granular avalanches in complex terrain. The granular material is assumed to be an incompressible continuum that satisfies the Mohr–Coulomb law, which states that slip planes appear inside the bulk as soon as the internal state of stress surpasses the Coulomb criteria of failure. The model is depth-averaged assuming that the flowing layer is thin compared with its lateral extension and that the detailed motion of the mass through depth is relatively unimportant except in a thin layer near the bed (Pitman and others, Reference Pitman2003; Patra and others, Reference Patra2005).
The basic equations of TITAN2D are conservation equations for mass and momentum written as follows:
 $$\displaystyle{{\partial h} \over {\partial t}} + \displaystyle{{\partial hv_{\rm x}} \over {\partial x}} + \displaystyle{{\partial hv_{\rm y}} \over {\partial y}} = 0,$$
 $$\eqalign{\displaystyle{{\partial hv_{\rm x}} \over {\partial t}} + &\displaystyle{{\partial \lpar {hv_{\rm x}^2 + (1/2)k_{{\rm ap}}g_{\rm z}h^2} \rpar } \over {\partial x}} + \displaystyle{{\partial hv_{\rm y}v_{\rm x}} \over {\partial y}} \cr& = g_{\rm x}h-hk_{{\rm ap}}{\mathop{\rm sgn}} \left( {\displaystyle{{\partial v_{\rm x}} \over {\partial y}}} \right)\displaystyle{{\partial g_{\rm z}h} \over {\partial y}} \cr& \sin (\varphi )-\displaystyle{{v_{\rm x}} \over {\sqrt {\mathop v\nolimits_{\rm x}^2 + \mathop v\nolimits_{\rm y}^2}}} \left( {g_{\rm z} + \displaystyle{{\mathop v\nolimits_{\rm x}} \over {r_{\rm x}}}} \right)h\tan (\delta ),} $$
where x, y and t are the independent variables; h is the flow depth; g x, g y and g z are the components of gravitational acceleration in the local coordinate system; v x and v y are the velocity components in the downslope and cross-slope directions; r x is the radius of local bed curvature in the flow direction; δ is the bed friction angle; k ap is the earth pressure coefficient; and φ is the internal friction angle. The equation for the y momentum is similar, and it can be obtained by interchanging x and y in Eqn (2). The earth pressure coefficient k ap is in the active or passive state, depending on whether the downslope and cross-slope flows were expanding or contracting:
 $$k{\rm ap} = 2\displaystyle{{1 \pm {[1-{\cos} ^2(\varphi )\{ 1 + {\tan} ^2(\delta )\} ]}^{1/2}} \over {{\cos} ^2(\varphi )}}-1,$$
where the passive state (+) applies when flow is converging, that is, if ∂x v x + ∂y v y < 0, and the active state (−) applies if ∂x v x + ∂y v y > 0. In Eqn (2), the first term on the right-hand side is the gravitational driving force, the second term is the internal Coulomb force due to velocity gradients in the direction transverse to the flow, and the last term is the resisting force due to Coulomb friction at the base. The governing equations are solved using a parallel, adaptive-mesh Godunov scheme. Details of the depth-averaged theory and solution techniques are described in Pitman and others (Reference Pitman2003) and Patra and others (Reference Patra2005).
The starting zone of the avalanche was approximated as an elliptically shaped flux source with major and minor axes of 250 and 100 m, respectively. The maximum initial thickness of the pile was input as 2 m based on the snow thickness above the weak layer that was estimated from the meteorological data using the snowpack model (Takeuchi and Hirashima, Reference Takeuchi and Hirashima2013). The value of the internal friction angle was found to have minor effect on the simulation results and was set to φ = 20° in this study.
Estimation of bed friction angle
Although TITAN2D dynamically obtains the required topographic data by incorporating a direct connection to geographic information system databases, vegetation (such as forests) is not taken into account. In this study, therefore, forested areas are assigned a larger bed friction angle than non-forested areas to mimic the flow resistance due to the trees. Tree resistance is caused by hydrodynamic drag while the tree is intact and thereafter by fracturing of the trunk, overturning and tree debris entrainment (Bartelt and Stöckli, Reference Bartelt and Stöckli2001), which decelerate the avalanche by physical processes different from bed friction. However, one of the aims of this study is to suggest simpler method for ascertaining the braking effect of the forest on flowing avalanche, rather than modeling the physical processes in detail.
By trial and error, we found the best-fit bed friction angle for the main avalanche flow in the non-forested area. In the model, the avalanche was initiated from the inferred starting zone of the 17 February 2008 avalanche. For constant bed friction angles ranging from 12 to 16°, the paths, maximum runout distances and velocities of the calculated avalanches were compared with those of the actual avalanche, and the best-fit bed friction angle was selected.
The best-fit bed friction angle for the avalanche flow in the cedar forest was then examined separately. In these simulations, the avalanche was started from the upper edge of the forest (Fig. 4) at an initial velocity of 30 ms−1, moving in the direction of the fallen trees (77° from the north); this was the most likely avalanche velocity flowing into the forest (Takeuchi and others, Reference Takeuchi, Torita, Nishimura and Hirashima2011). The initial pile at the upper edge of the forest was approximated as an ellipse with major and minor axes of 50 and 25 m, respectively, based on the area of the cedar forest that was actually destroyed. The maximum initial thickness of the pile was input as 2 m, which was based on the debris thickness near the forest (Takeuchi and others, Reference Takeuchi, Torita, Nishimura and Hirashima2011). The bed friction angle for which the runout distance coincided with the actual distance (130 m) was then obtained by trial and error.
Topographical map of Makunosawa valley avalanche runout zone. The solid line indicates observed runout zone. Colored area is cedar forest, and the ellipse indicates destroyed cedar forest. In the simulations, the avalanche was initiated in the upper edge of the forest and moved in the direction of fallen trees; this is represented by the solid arrow. This figure was made by editing the maps of the Geospatial Information Authority of Japan (GSI).

RESULTS
Bed friction angle in non-forested area of the Makunosawa valley
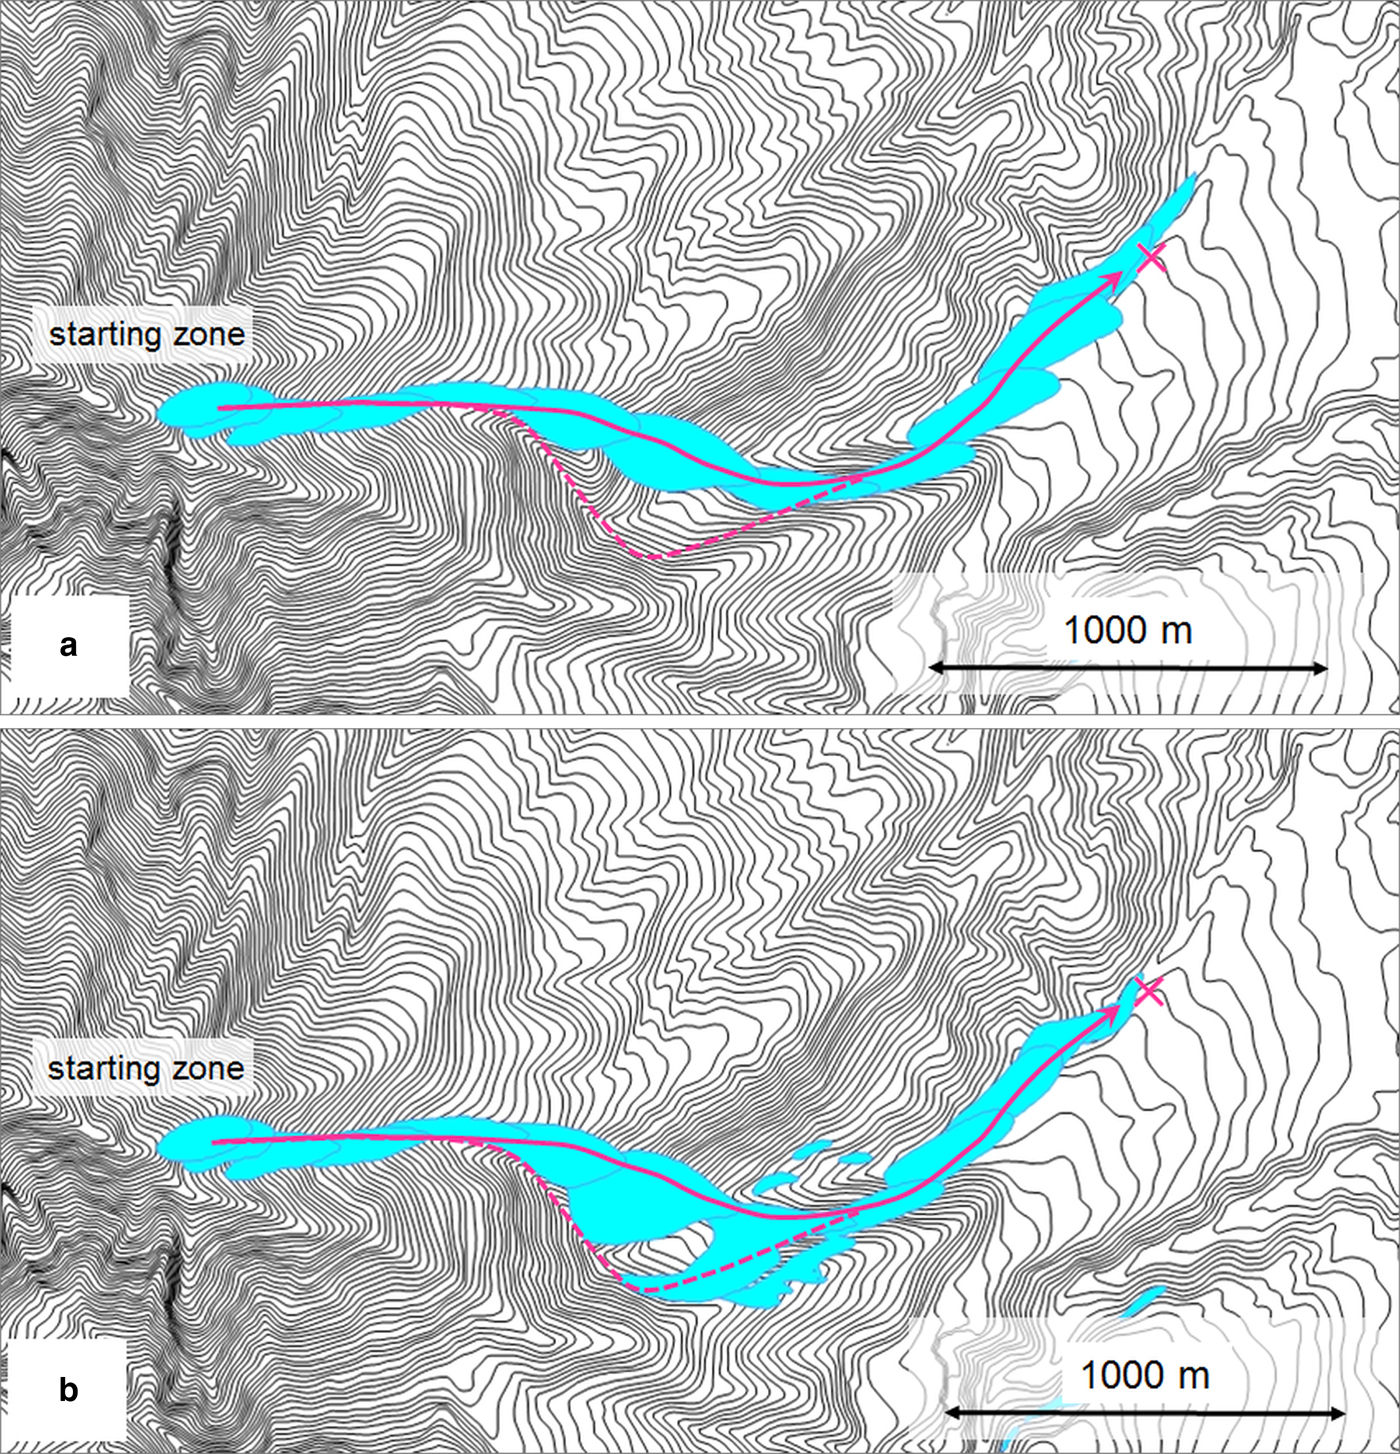
The simulations using bed friction angles between 12 and 16° showed that both paths and the runout distances coincided well with those of the actual avalanche when the bed friction angle was 13–14°. Figure 5a shows a simulation run with a bed friction angle of 13°. The extent of the avalanche with a thickness >0.1 m is shown every 5 s. The avalanche almost terminated after 60 s. The cross in Figure 5a shows the position of the actual debris limit, which illustrates that the simulation slightly overestimates the extent. The broken line indicates the actual avalanche path along a stream, whereas the simulated path crosses the ridge in a straight line and does not follow the stream. Therefore, the bed friction angle of 13° was determined as too small and the avalanche too fast under such conditions. The bed friction angle was then increased to 14° (Fig. 5b), and in the subsequent simulation, the avalanche was found to terminate near the cross in the figure and to follow both paths (the straight one over the ridge and the curved one along the stream), in accordance with the path of the actual avalanche. In further simulations with a bed friction angle >14°, the avalanche was found to follow only the stream; it did not run over the ridge and it terminated in a position higher than that of the actual limit.
Comparison of simulation results with observations from the 2008 Makunosawa valley avalanche. The extent of an avalanche with a thickness >0.1 m is shown at 5 s intervals. The cross shows the position of the observed limit of the debris; broken line indicates the path along the stream and the solid line represents the path over the ridge (see text). (a) Simulation run with bed friction angle of 13°; (b) simulation run with bed friction angle of 14°.
The differences in avalanche velocity using different bed friction angles were then investigated to confirm that an angle of 13–14° was the best-fit value. The mean velocity variations obtained by altering the bed friction angle from 12 to 16° are shown in Figure 6 (the location of the upper end of the cedar forest is indicated by the arrow). The initial velocity of the avalanche flowing into the forest is known to have been ~30 ms−1 at least (Takeuchi and others, Reference Takeuchi, Torita, Nishimura and Hirashima2011); when the bed friction angles were 13 and 14°, the velocities at the upper end of the forest were ~44 and 25 ms−1, respectively. Therefore, 13–14° was found to be the best-fit bed friction angle for avalanche velocity, and the bed friction angle of the Makunosawa valley avalanche was determined as 13–14° in the non-forested area.
Velocity variations resulting from change in bed friction angle from 12 to 16°. The internal friction angle (φ) was kept constant at 20°. The arrow indicates the location of the upper end of the cedar forest.

Bed friction angle in forested area of Makunosawa valley
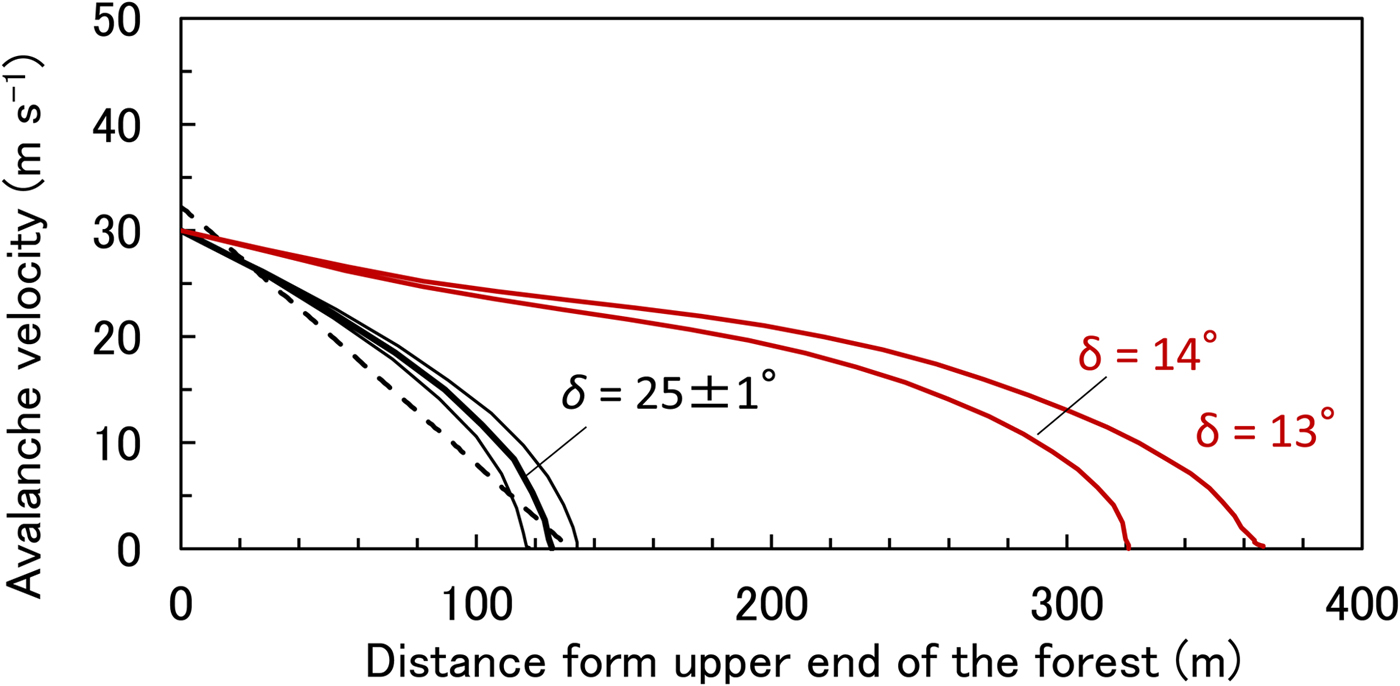
When the bed friction angle was 25°, the avalanche released from the upper edge of the cedar forest with an initial velocity of 30 ms−1 was found to terminate ~130 m downstream, in accordance with the actual avalanche (Fig. 7). The velocity reduction coincided well with the actual velocity estimated from the bending stress of the broken trunks, shown by the broken line in Figure 7. Comparisons were then made using bed friction angles of 24 and 26°, and the thin lines in the figure represent the results (Fig. 7). The bed friction angle in the forest was thus chosen to be 25° in our simulation, and we assumed that the combined resistance of bed friction and trees was equivalent to a bed friction angle of 25°. However, the initial velocity of 30 ms−1 was the minimum estimation, then it is possible that the actual velocity may have been larger and the best-fit bed friction angle in the forest may also be larger than 25°.
Comparison between the simulated longitudinal profiles of velocity with bed friction angle of 25° (thick solid black line), 24 and 26° (thin solid black line), and the velocity estimated from the bending stress of broken tree trunks (broken black line). In addition, the red lines representing simulations with bed friction angles of 13 and 14°, respectively, indicate how much farther the avalanche would have flowed without the protective effect of the forest.
Simulation of the Makunosawa valley avalanche without forest
Utilizing the bed friction angles obtained above, the extent of the avalanche was simulated without the existence of the forest, to ascertain the braking effect of the forest on the avalanche in the Makunosawa valley occurring in 2008. We initiated the avalanche at an initial velocity of 30 ms−1 from the position of the upper edge of the forest with bed friction angles of 13 and 14°, which were the values determined for the non-forested area. Results show that the avalanche gradually decelerated and came to a stop ~360 and 320 m from the upper edge of the forest (Fig. 7). It was thus determined that the avalanche may have run more than 300 m from the upper edge of the forest and traveled at least 200 m farther than its actual limit if the forest had not existed. If the actual initial velocity was larger than 30 ms−1, the avalanche would have traveled farther than this result without the protective effect of the forest.
Back-calculation of the Mt. Iwate avalanches
To test the applicability of the friction parameters from the Makunosawa avalanche to other avalanche paths, TITAN2D was used to simulate the Mt. Iwate avalanches. The starting zones of the avalanches were above the tree line (which is at ~1730 m a.s.l. on Mt. Iwate), but as the precise positions are unknown, we used trial and error to examine the positions of the starting zones to reproduce the actual avalanche paths with the TITAN2D model.
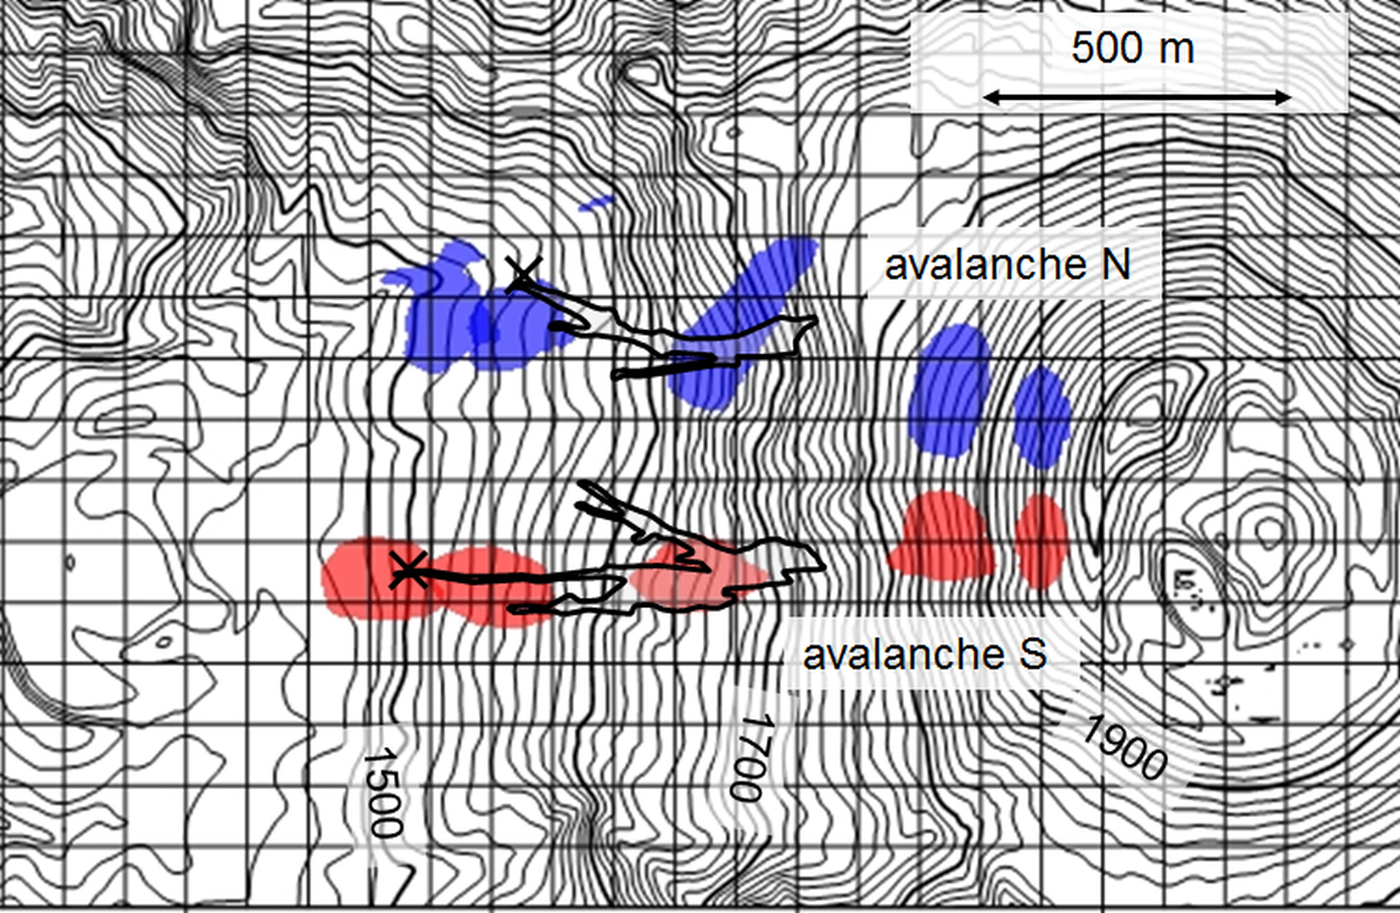
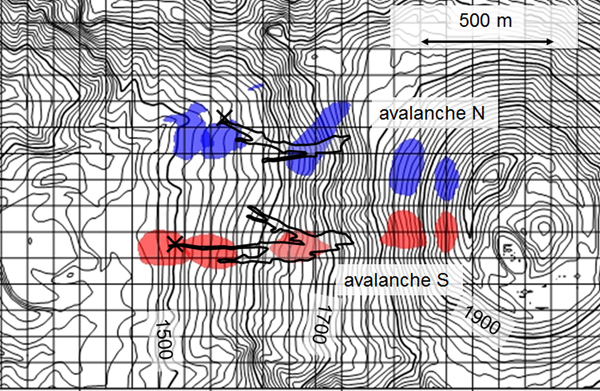
Two areas of forest were destroyed, as can be seen in Figure 3a. However, although we analyzed photographs and examined the simulated avalanche paths from various starting zones, we were unable to determine whether a single avalanche or two separate events caused the two cuts. In the simulation of this study, we thus considered the tracks to belong to two avalanches that initiated in different areas, as shown in Figure 8 and named the northern (N) and southern (S) avalanches, respectively.
Simulation results from Mt. Iwate avalanches with bed friction angles of 14° for non-forested area and 25° for forested area. Extents of avalanches with thicknesses >0.1 m are shown every 10 s. Areas surrounded by solid lines indicate fallen tree zones. Crosses show the positions of the actual limits of fallen trees.
The starting zone of the each avalanche was approximated as an ellipse with major and minor axes of 150 and 70 m, respectively. The maximum initial thickness of the pile was input as 1 m with reference to snow thickness above the weak layer and the snow depth estimation (Takeuchi and others, Reference Takeuchi2014). The internal friction angle (φ) was input as 20°, which was constant (as described in section ‘Simulation methods’).
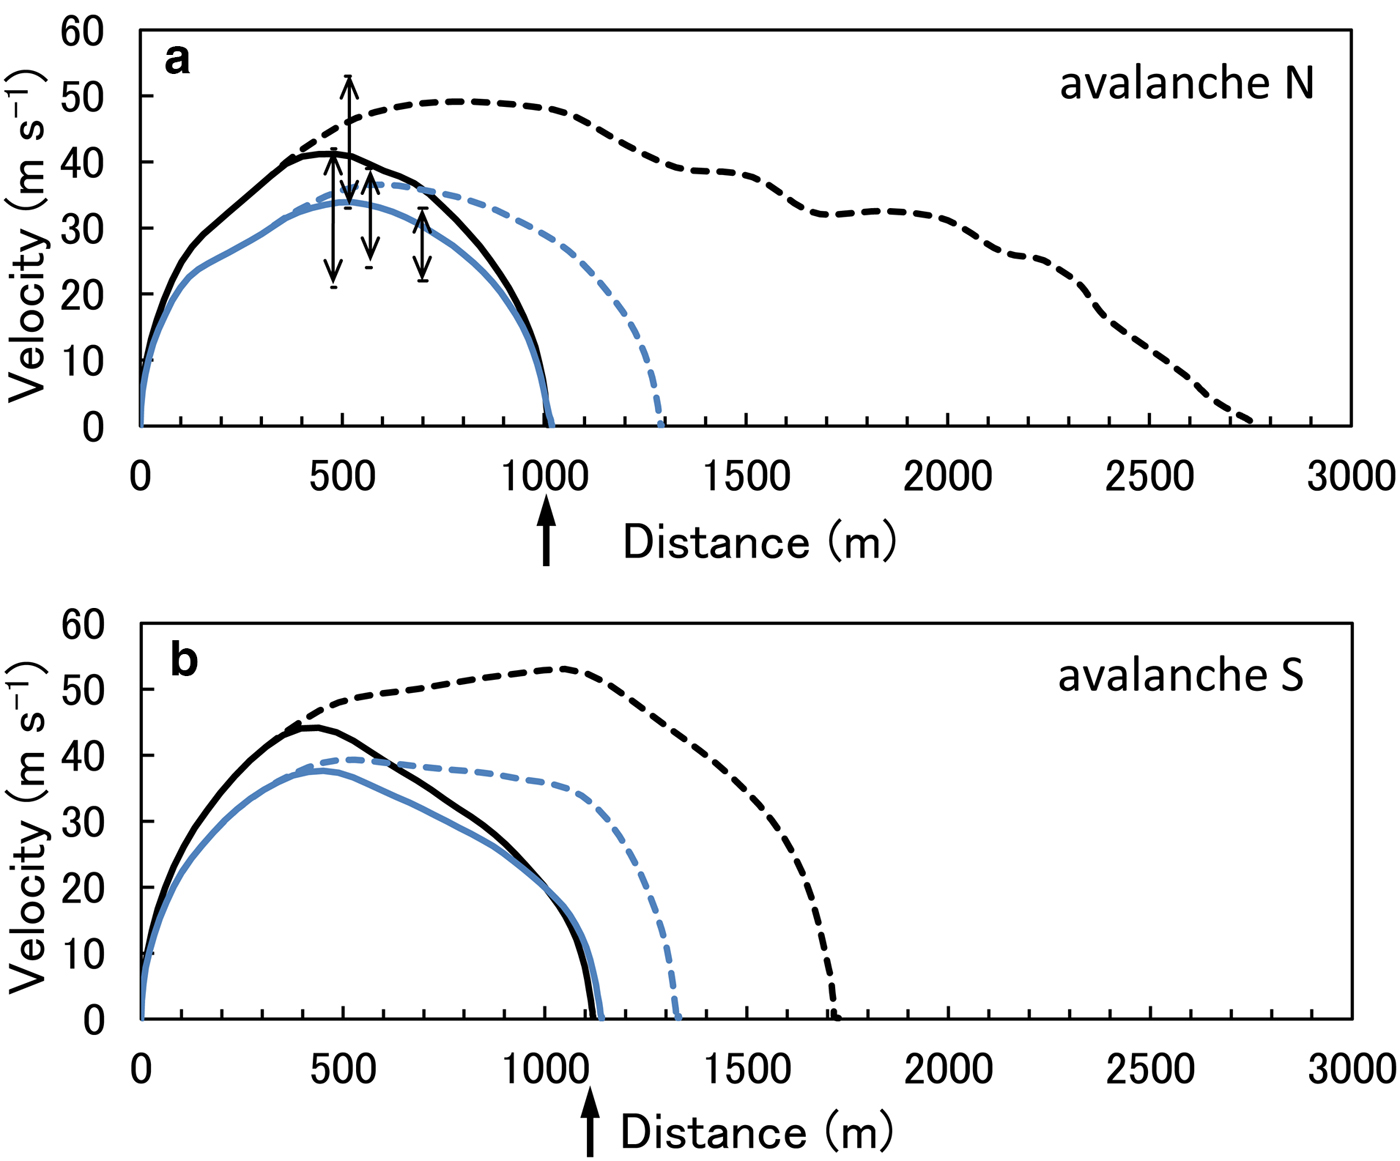
Titan2D can be run with spatially variable friction angle. We conducted simulations of the Mt. Iwate avalanches by inputting different bed friction angles in the non-forested area above 1730 m a.s.l. and the forested area below. Generally, in the case of avalanches in non-forested area, the larger the scale of avalanche is, the smaller the bed friction angle becomes (Izumi, Reference Izumi1985). Since the Mt. Iwate avalanches were smaller than the Makunosawa valley avalanche, we assumed the bed friction angle for Mt. Iwate avalanche is 14° at least and it might be larger than 14°. We found the bed friction angle for the non-forested area at Mt. Iwate to be 19° at most by trial and error on the three conditions that (1) the velocity exceed the values calculated from the bending stress of the broken trunks (Takeuchi and others, Reference Takeuchi2014); (2) the runout distance coincide with those of the actual avalanche; (3) the bed friction angle for non-forested area be larger than that for forested area. We also found the best-fit bed friction angle for the forested area of Mt. Iwate to be 25 and 23°, respectively, in the case of bed friction angles of 14 and 19° for non-forested area. The simulation tracks of the avalanches N and S are shown in Figure 8, and the velocity variations are shown in Figure 9. The runout distances of the avalanches N and S are regarded as being distances from the starting zones to the farthest limits (cross marks in Fig. 8) and are estimated as being ~1000 and 1100 m, respectively. As shown in Figures 8 and 9, both avalanche paths and runout distances coincided well with those of the actual avalanche tracks. Simulation results of the avalanche velocity were also considered to be good, because the velocity of the avalanche N was equal to, or a little larger than, the two-way arrow ranges in Figure 9a. The two-way arrows show velocities calculated from the bending stress of the broken trunks and represent the minimum estimation of velocity (Takeuchi and others, Reference Takeuchi2014).
Simulation results from Mt. Iwate avalanches. Solid lines are velocity variations with bed friction angles of 14° (blue line: 19°) for non-forested area and 25° (blue line: 23°) for forested area. Broken lines are velocity variations with bed friction angles of 14° (blue line: 19°) for forested area as well as non-forested area, indicating how much farther the avalanche would have flowed without the protective effect of the forest. (a) Avalanche N. (b) Avalanche S.
Verification of forest braking effect on Mt. Iwate avalanches
To verify the braking effect of subalpine forests, the extent of the avalanches on Mt. Iwate was also simulated assuming no forest and using the same method as for the Makunosawa valley avalanche. To cover the possible range of friction values, we specified bed friction angles of 14 and 19° for the entire slope. Results showed that both the N and S avalanches delayed to decelerate and traveled farther than their actual limit (Fig. 9). The large difference in the runout distances between avalanches N and S without forest in the case of bed friction angle of 14° (black broken lines in Fig. 9) was caused by topographic differences between the two paths. That is to say, while avalanche S decelerated abruptly in a flat area with a pond, avalanche N flowed into the valley and traveled a long distance. Both avalanches would have traveled at least 200 m and possibly up to 600 m farther than their observed run-outs if the forest had not existed. Consequently, the forest on Mt. Iwate is considered to have been effective in braking the flow of avalanches.
DISCUSSION AND CONCLUSIONS
The tree sizes, stand densities and tree species differ considerably between the planted cedar forest in the Makunosawa valley and the natural subalpine forest on Mt. Iwate (Table 1). For example, the stand densities in the Makunosawa valley and on Mt. Iwate were 480 and 1500 ha−1, respectively, and the mean stem diameter at breast height was 38 cm for cedar trees in the Makunosawa valley, but was 18 cm for Maries’ firs and 27 cm for Erman's birches on Mt. Iwate. A tree breaks when the bending stress exceeds its modulus of rupture (MOR), and the MOR varies between species and is 35 ± 3, 48 ± 4 and 64 ± 4 MPa for cedar tree, Maries’ fir and Erman's birch, respectively (Takeuchi and others, Reference Takeuchi2014). As far as they have been measured, trees in subalpine forests such as Maries’ fir and Erman's birch have larger MOR than cedar trees.
Descriptions of forests broken by the avalanches

C, cedar tree; F, Maries’ fir; B, Erman's birch.
The increase in bed friction angle of forest is regarded as a braking effect of forest and arises from the flow resistance of the trees. Then the extra friction (Δδ) is reasonably assumed to be proportional to the stand density (n) and the tree diameter (D). The coefficient (Δδ/nD) is possibly supposed to be a variable depending on the interaction between avalanche and forest. To show how the friction parameter should be chosen in other situations, it is necessary to clear the theory for the dependence of Δδ on the forest characteristic parameters which presumably are the mean tree diameter at breast height, the stand density and the MOR, but it could not be provided in this study. The lack of data on the Mt. Iwate avalanches, especially on the run-out distance in the absence of forest, caused the limitation. Then, it is not clear whether the good agreement between observations and simulations at Mt. Iwate, using the same bed friction angles (14 and 25° for non-forested and forested areas, respectively) from Makunosawa valley, is coincidental or not.
It is clear that the most important and most valuable protection of forests against avalanches is provided in the starting zone. However, there are non-forested areas caused by the climatic or topographic severe conditions such as high altitude and steep terrain. This study showed the cases that forests below the starting zone and in the runout zone are useful to decelerate the flowing avalanches when avalanches release. As mentioned in the introduction, since the trees are destroyed easily by large avalanches, the braking effect of forests was considered to be negligible for large destructive avalanches or it was recognized with limitation for small-to-medium avalanches by which trees were not destroyed in the previous studies. Nevertheless, this study showed that the braking effect of forests is useful for large avalanche which destroyed trees. The simulation showed that the runout distance of avalanche was clearly decreased by forest in spite of trees destruction. This result was based on the actual avalanche events which terminated within the forests, but the braking effect of forests is supposed to be variable depending on the conditions such as avalanche scale and velocity, slope angle, trunk diameter and stand density. To obtain general conclusion, we need to study more avalanches which flow into forests under various conditions. It is clear that forests which are destroyed by avalanches are less reliable as protection against avalanches, because a follow-up event in the same track with similar intensity would have again a larger runout. Therefore, a reforestation project for early forest recovery is considered to be important and necessary for the protection against the recurring avalanches after long years.
It is considered the larger the trunk diameter, the larger the braking effect of forests is. Also the denser a stand, the larger its braking effect will be. However, mature forests with large trees cannot be as dense as young stands in general forestation. Quantification of trunk diameter and stand density of forest for the effective protection against avalanches for each species is an interesting problem for future research. To solve this question, collecting more and specific dataset on forests and avalanches is necessary.
ACKNOWLEDGEMENTS
The authors deeply appreciate the two reviewers’ constructive and thoughtful suggestions. A part of this study was financially supported by a Grant-in-Aid for Scientific Research (Project No. 22510199) from the Ministry of Education, Culture, Sports, Science and Technology of Japan.


 Open access