

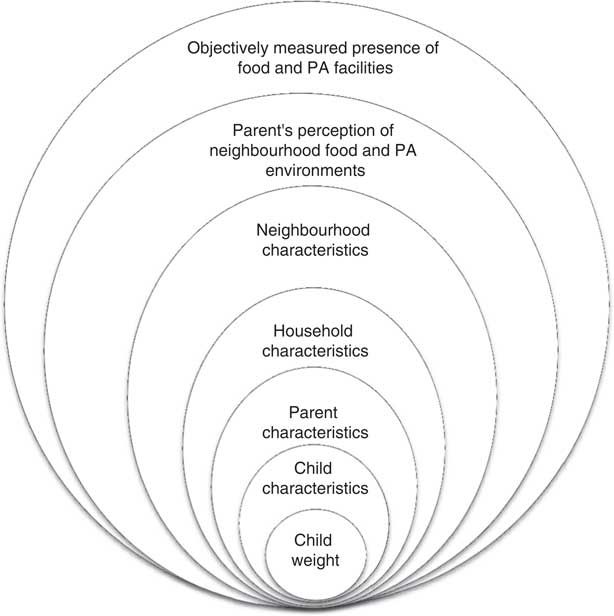
The Institute of Medicine’s 2005 report, Preventing Childhood Obesity: Health in the Balance, used the Social Ecological Model (SEM) to describe the possible aetiology of the childhood obesity epidemic and also to lay the groundwork for future interventions( Reference Koplan, Liverman and Kraak 1 ). Based on ecological systems theory, the SEM postulates that changes in individual outcomes are influenced not only by individual-level factors such as age and gender, but also by interactions with the larger social, cultural, economic and environmental contexts in which individuals live( Reference Davison and Birch 2 , Reference Lobstein, Baur and Uauy 3 ). Appropriately, the SEM, which posits concentric layers of influence including intrapersonal, interpersonal, community, organization, government, industry and societal domains, is a frequently used model in childhood obesity research and prevention efforts( Reference Lytle 4 – 6 ).
Social Ecological Model showing the layers influencing a child’s weight status (PA, physical activity)
Researchers have investigated individual factors within different layers of the SEM to understand the influence of these factors on children’s weight status. Child-level factors such as age, race and gender( Reference Ogden, Carroll and Kit 7 , Reference Keane, Layte and Harrington 8 ), parental characteristics such as weight status and education level( Reference Keane, Layte and Harrington 8 – Reference Chivers, Parker and Bulsara 10 ) and household characteristics such as income( Reference Bhargava, Jolliffe and Howard 11 ) have consistently been associated with children’s weight status. Community-level factors such as proximity to types of food outlets and physical activity (PA) facilities, however, have produced mixed findings( Reference Epstein, Raja and Daniel 12 – Reference Potwarka, Kaczynski and Flack 25 ).
Although prior studies have examined specific elements of the SEM, important unanswered questions remain about the combined contribution of elements in each layer. Such an analysis is crucial for setting priorities among different intervention domains and allocating scarce resources. For example, studies often investigate the independent contribution of one or more elements of the community built environment (e.g. parks, stores)( Reference Laska, Hearst and Forsyth 16 , Reference Potwarka, Kaczynski and Flack 25 , Reference Leung, Laraia and Kelly 26 ), but seldom quantify the combined contribution of various elements of the built environment taken together on children’s weight status. Neglecting the combined contribution of elements within the same SEM layer can be problematic if those elements correlate highly with each other, creating a situation in which each individual element appears to contribute negligibly to weight outcomes although the elements taken together are highly predictive. Similarly, prior studies seldom account for the combined contribution of each SEM layer independent of contributions attributable to other layers. For example, in analyses where models are built incrementally, estimates of the contribution of variables entered in the first step (e.g. individual-level sociodemographic variables) do not reflect or account for contributions from subsequent layers (e.g. community-level demographics, built environment variables)( Reference Elder, Arredondo and Campbell 9 , Reference Patnode, Lytle and Erickson 27 ). Thus examination of the independent and relative contribution of each layer of the SEM – information that can be valuable in designing interventions and setting priorities – is not possible. To address these unanswered questions, the analysis presented here uses data collected from low-income, high-minority communities as part of the New Jersey Childhood Obesity Study. The study collected comprehensive information on children’s BMI and multiple layers of the SEM (Fig. 1), including child-, parent-, household- and neighbourhood-level characteristics, parental perceptions of the food and PA environments and objective measures of community food and PA environments, to examine the unique and relative contribution of different layers on children’s weight status.
Methods
Data sources
Household survey
Data were collected in 2009–2010 from a random-digit-dial sample of 1408 households in four low-income cities in the state of New Jersey in the USA. Households with a landline telephone and at least one child in the age range of 3–18 years old were included. Participants were offered an incentive of $US 10 for completing the survey, which was conducted in either English or Spanish. The respondent was the adult ‘parent’ who made most of the decisions about food shopping for the household. The overall survey response rate( 28 ) for the survey was 49 %.
Survey items used for the present analysis were derived from previous research as described in Table 1. At the conclusion of the survey, parents were asked to weigh and measure themselves and their children using instructions based on the Centers for Disease Control and Prevention’s guidelines and a tape measure mailed to their homes. The instructions also included suggestions on locating weighing scales in the community (e.g. doctor’s office, community centre, WIC (Special Supplemental Nutrition Program for Women, Infants, and Children) clinic, YMCA) in case parents did not have a scale at home. Parent-measured heights and weights were mailed back to the researchers on a reporting worksheet. An additional $US 10 incentive was offered for completion of this task; 40·5 % of participants who provided their mailing addresses returned completed worksheets. Parent-measured heights and weights have been reported to be highly correlated with professionally measured values( Reference Carnell and Wardle 29 ) and more accurate than parent-reported estimates( Reference Huybrechts, Himes and Ottevaere 30 ).
Definitions and descriptions of variables included in the analysis grouped by layers of the Social Ecological Model

SNAP, Supplemental Nutrition Assistance Program; PA, physical activity; FV, fruit and vegetables; LFF, low-fat foods; GIS, geographical information system; CDC, Centers for Disease Control and Prevention; TANF, Temporary Assistance to Need Families; SSI, Supplemental Security Initiative; ref., referent category.
Neighbourhood demographic data
Indicators of neighbourhood socio-economic conditions, calculated at the census block group level, were derived from pooled 2005–2009 American Community Survey data( 31 ).
Geographical information systems data
Drawing on commercial and publically available data sources, objective geocoded data on locations of food outlets and PA facilities in each of the study cities as well as in a 1·61 km (1 mile) buffer around the city boundary were collected. Food outlet data were purchased from two commercial vendors, InfoUSA and Trade Dimensions, and using methodology developed by Ohri-Vachaspati et al.( Reference Ohri-Vachaspati, Martinez and Yedidia 32 ) were categorized into supermarkets, small grocery stores and specialty stores, convenience stores and fast-food restaurants.
Similar data on private and public PA facilities and parks were collected, using a methodology proposed by Abercrombie et al.( Reference Abercrombie, Sallis and Conway 33 ). This strategy included acquisition of data from county and city departments, web-based searches and the Yellow Pages. Only parks larger than 0·40 ha (1 acre) in size were included as they were most likely to offer opportunities for being physically active. These data sources were supplemented with commercial data purchased from InfoUSA for NAICS (North American Industry Classification System) codes associated with fitness and recreational sports centres and amusement and recreational facilities. Each PA facility included in the final database was investigated to ensure that it offered programmes for 3–18-year-olds. All food outlets and PA facilities were geocoded to create proximity measures. The roadway network distance from each respondent’s home to the nearest facility was estimated using the distance tools in the geographical information system ArcGIS version 10·1.
Study sample
The sample used for the present study included 560 children whose parents completed and returned the worksheet with measured heights and weights (excluding any biologically implausible values( 34 )) and had complete data on the explanatory variables. Sampling weights were developed specifically for children with returned worksheets to ensure that the survey estimates represent the population of 3–18-year-olds in the four cities combined. Because only 40·5 % of the survey respondents who provided their mailing addresses returned completed worksheets, self-selection bias is a potential concern. However, recent work using similar statistical modelling examined the effects of such biases in detail and found that they were negligible( Reference Ohri-Vachaspati, Lloyd and DeLia 22 ).
Survey fieldwork and initial geocoding were carried out by Abt SRBI Inc. This research was approved by the Institutional Review Boards of Rutgers University and Arizona State University. Participants provided informed consent prior to enrolling in the study.
Measures
Outcome variable
The dependent variable was a dichotomous indicator of child overweight or obese (OW/OB) status based on the age- and sex-specific percentile of the child’s BMI calculated with the measured height and weight provided on the parents’ worksheet and the 2000 growth charts of the Centers for Disease Control and Prevention( 35 ). Children with a BMI at or above the 85th percentile were classified as OW/OB.
Explanatory variables – layers of the Social Ecological Model
Table 1 provides the sources and definitions and survey questions used for constructing each of the exposure variables, along with the coding scheme used, and the psychometric statistics for composite variables. Data for SEM layers were collected for the child, parent and household levels, for parental perception of the neighbourhood built environment and for neighbourhood income and race.
Access to healthy and unhealthy environments was measured by proximity of food and PA outlets to each individual child’s residence. Based on prior work, presence or absence of food and PA outlets within 0·40 km (¼ mile) of the respondent’s home based on the roadway network was used to capture proximity to a food or PA outlet( Reference Ohri-Vachaspati, Lloyd and DeLia 22 ). These measures of proximity have also been found by other researchers( Reference Epstein, Raja and Daniel 12 , Reference Jilcott, Wade and McGuirt 14 , Reference Laska, Hearst and Forsyth 16 , Reference Leung, Laraia and Kelly 26 , Reference Jennings, Welch and Jones 36 , Reference Wolch, Jerrett and Reynolds 37 ) to be significantly associated with children’s weight status.
Analysis
Descriptive and bivariate statistics were examined for all variables in the analysis. Survey-weighted logistic regression analyses were performed using the svy: logistic procedure in the Stata statistical software package version 12·0 to predict the odds that a child was OW/OB. In these analyses differential sampling probabilities as well as clustering at the city and household levels were accounted for, thus yielding appropriately adjusted standard errors to be used in tests of significance. Elements from each of the six SEM layers (Fig. 1, Table 1) were included in the regression model as predictors based on previous research( Reference Chivers, Parker and Bulsara 10 , Reference Laska, Hearst and Forsyth 16 , Reference Ohri-Vachaspati, Lloyd and DeLia 22 , Reference Potwarka, Kaczynski and Flack 25 , Reference Leung, Laraia and Kelly 26 , Reference Li, Law and Lo Conte 38 – Reference Bacha, Appugliese and Coleman 42 ). Using the logistic regression estimates from this initial stage, we then determined whether the elements of each SEM layer were jointly significant in predicting child weight status with Wald tests for complex survey data( Reference Korn and Graubard 43 ), generated by Stata’s lincom procedure. Statistical tests were considered significant at P<0·05.
Additional analyses were conducted to assess the relative contribution of different layers of the SEM to the prediction of child’s weight. Specifically, a recently developed and validated R 2 measure called the coefficient of discrimination( Reference Tjur 44 ) (or Tjur R 2), which can be easily applied to logistic regression with complex survey data, was used. The Tjur R 2 measures the difference between the mean predicted probability of being OW/OB among children known to be in that category and the mean predicted probability of being OW/OB among children not in that category( Reference Tjur 44 ). The Tjur R 2 is conceptually similar to the more familiar R 2 statistic in an ordinary least squares (OLS) regression model where, like the OLS R 2, the Tjur R 2 is equal to 1 if the model perfectly predicts the outcome for each observation, equals 0 if the model has no explanatory or discriminatory power at all, and lies between 0 and 1 for intermediate cases. However, while the OLS R 2 measures the percentage of variation in the (usually continuous) dependent variable that is explained by the independent variables in the model, the Tjur R 2, specific to a binary dependent variable, measures the extent to which the independent variables in the model can discriminate between observations holding the two values for a dichotomous dependent variable. Intuitively, if a layer of the SEM was a very strong predictor of child weight status, then the removal of that layer from the full model would cause a large reduction in the Tjur R 2. Conversely, the removal of a weakly predictive layer would cause a negligible reduction in the Tjur R 2. Thus, the differences suggest the relative contribution of each SEM layer to the prediction of child weight status.
Results
Forty per cent of the children were OW/OB; 50·4 % of the children were non-Hispanic Black and 39·4 % were Hispanic (Table 2). Rates of OW/OB were highest among 6–11-year-olds (50·6 %) compared with 3–5-year-olds (28·4 %) and 12–19 year-olds (36·0 %). Parents of OW/OB children had significantly higher BMI than other parents (31·7 v. 28·4 kg/m2). Lowest levels of OW/OB prevalence were observed among children living in mixed neighbourhoods (27·9 %) and those living in higher-income neighbourhoods (31·0 %). Forty-four per cent of children living within 0·40 km (¼ mile) of a convenience store were OW/OB compared with 25·6 % of those who did not.
Description of demographic characteristics of children and parents, parental perceptions of food and PA environments and geospatial variables for all children and children categorized as OW/OB and not OW/OB; random sample of households living in low-income, racially diverse communities in four cities in the state of New Jersey, USA, 2009–2010 (New Jersey Childhood Obesity Study)
OW/OB, overweight/obese; FPL, federal poverty level; SNAP, Supplemental Nutrition Assistance Program; PA, physical activity; FV, fruit and vegetables; LFF, low-fat foods; GIS, geographical information system.
Analysis based on weighed sample and adjusted for complex survey design.
* Unweighted n.
Table 3 shows the results from a logistic regression analysis indicating the odds of a child being OW/OB for each predictor variable after adjusting for the effect of all other variables in the model. Table 3 also includes the results of a test of joint significance for each layer of the SEM, which shows the collective predictive power of the variables included in a particular layer after adjusting for the effect of all other layers in the model. For five of the six layers included in the analysis (geospatial measures of neighbourhood, parental perception of neighbourhood, neighbourhood characteristics, parent demographics and child demographics), the test of joint significance for the layer was statistically significant (P<0·05) indicating that elements in each of these layers were collectively significant predictors of a child’s obesity status after adjusting for all other variables in the model. The test of joint significance for the sixth layer representing household characteristics approached significance at P=0·088. Within the six layers examined, objectively measured proximity to parks (P<0·01), parents’ report of ease of getting to their main food store (P<0·05), parents’ reported ability to purchase fruits and vegetables at their main food shopping stores (P<0·01), child’s residence in majority White and mixed neighbourhoods (P<0·05), higher neighbourhood income (P<0·01) and higher level of mother’s education (P<0·05) were significantly inversely associated with a child’s odds of being OW/OB, while parent BMI (P<0·01) and child’s age (P<0·01) were positively associated. Other individual variable associations with child’s OW/OB status that approached significance were an inverse association with household participation in SNAP (Supplemental Nutrition Assistance Program; P=0·06) and positive associations with parents’ perception of safety from crime in neighbourhood (P=0·08) and non-English speaking household (P=0·09).
Logistic regression analysis of the associations between child weight status and layers of the Social Ecological Model; random sample of households living in low-income, racially diverse communities in four cities in the state of New Jersey, USA, 2009–2010 (New Jersey Childhood Obesity Study)
GIS, geographical information system; PA, physical activity; FV, fruit and vegetables; LFF, low-fat foods; ref., referent category; FPL, federal poverty level; SNAP, Supplemental Nutrition Assistance Program.
Analysis based on weighted sample and adjusted for complex survey design.
* Unweighted n.
† Joint significance calculated using testparm command in Stata software.
Table 3 also shows the Tjur R 2 for the full model and for models where elements from each layer were removed. In the full model, the Tjur R 2 was equal to 0·157 which means that, on average, the predicted probability of being OW/OB was 15·7 percentage points higher for children who truly were OW/OB relative to children who were not. When the layer representing geospatial measures of environment was removed from the full model (without removing any other layers), the Tjur R 2 fell by 0·017 (from 0·157 to 0·140), which is a statistically significant reduction according to the Wald F statistic (F=2·38, P=0·028). The largest reduction in Tjur R 2 (0·054) was observed when elements from the layer consisting of parent-level characteristics were removed from the model, followed by the layers representing parental perceptions of the neighbourhood environment, neighbourhood characteristics, child demographics, geospatial neighbourhood measures and household characteristics.
Discussion
The role of different layers of the SEM in predicting children’s OW/OB status among randomly selected, predominantly minority and low-income 3–18-year-old children living in low-income, racially diverse communities was examined. Five of the six layers of the SEM considered were significantly associated with children’s OW/OB status. Based on the magnitude of reduction in Tjur R 2, the SEM layer representing parent characteristics made the largest contribution to children’s weight status, followed by the layers representing parental perception of the neighbourhood food and PA environments, neighbourhood demographic characteristics, child characteristics, objectively measured presence of neighbourhood food and PA outlets, and finally household characteristics (which approached significance). It is important to note that the contribution for each layer depended heavily on the individual elements of that layer that were available for the current analysis. Although subsequent studies using different data elements could produce different findings, the current analysis was based on a rich source of data so that a comprehensive set of elements within each layer could be included. Moreover, the analysis used a fairly new and innovative analytic strategy, well-suited to assessing the empirical relevance of the SEM that can be applied to alternative databases to confirm and extend these findings.
Previous studies assessing correlates of different levels of the SEM have used analytic approaches that allow for estimating incremental contributions from each layer of the SEM( Reference Elder, Arredondo and Campbell 9 , Reference Patnode, Lytle and Erickson 27 ). Components of one level are entered first, and then incrementally components of the other layers are added, and the change in explanatory power of the model with each addition is assessed. A disadvantage of this approach is that findings for the first-entered layers may be biased because they are not independent of the effects of variables added in the succeeding layers. The approach used in the present study avoids these problems by assessing the marginal contribution of each layer of the SEM over and above all the other layers that appear in the full logistic regression model. As such, the independent contribution of each layer of the SEM on children’s weight outcomes is estimated.
The present findings suggest that the layers of the SEM representing parent characteristics and parent perceptions of neighbourhoods are strong predictors of children’s weight status. Previous studies have also found individual parent-level factors such as parental BMI( Reference Chivers, Parker and Bulsara 10 , Reference Li, Law and Lo Conte 38 , Reference Strauss and Knight 45 ) and parent education( Reference Chivers, Parker and Bulsara 10 , Reference Sturm and Datar 46 ) to be independent predictors of children’s weight status. Others have found strong evidence for associations of perceptions of the food and PA environments with both food and PA behaviours, as well as with weight status in children( Reference Galvez, Pearl and Yen 39 , Reference Bacha, Appugliese and Coleman 42 ). The present study finds that while the layer representing parental perceptions of the food and PA environments and the one consisting of objectively measured geographical presence of food and PA outlets in the neighbourhood were both significantly associated with weight status, parental perceptions had a somewhat stronger association as determined by the magnitude of change in Tjur R 2. These findings suggest that parents are crucial targets for designing interventions aimed at preventing childhood obesity. It is likely that objective assessments based on geospatial measures capture proximity to different types of facilities, but do not assess their quality and extent of use. Parental perceptions, on the other hand, are based on more nuanced factors that may depend upon how these facilities look, feel and function from a parent’s perspective. For example, in the analysis of various elements of parent perceptions of the neighbourhood environments, ease of getting to the store and parents’ ability to purchase fruits and vegetables at the main food shopping store were independently associated with better weight outcomes among children. This suggests that even in communities where objectively assessed physical proximity to supermarkets is high, perception of accessibility and ability to find fruits and vegetables that meet the family’s needs at the main food shopping store are important for the health of the children.
Studies examining inner-city low-income populations, similar to those investigated in the present study, show that living in close proximity to food outlets that offer unhealthy options, such as convenience stores, is associated with higher weight status( Reference Laska, Hearst and Forsyth 16 , Reference Ohri-Vachaspati, Lloyd and DeLia 22 , Reference Leung, Laraia and Kelly 26 ). In bivariate analysis, the presence of a convenience store was significantly associated with children being OW/OB, but after adjusting for the effect of covariates, specifically parental perceptions, the association was no longer significant, again suggesting the stronger influence of parental perception. In the present analysis, objectively measured presence of a park near a child’s home (i.e. within 0·40 km or ¼ mile) was associated with lower odds of the child being OW/OB after adjusting for the effect of important covariates. Similar results have been reported by Potwarka et al.( Reference Potwarka, Kaczynski and Flack 25 ). Consistent with other studies conducted in low-income areas( Reference Galvez, Pearl and Yen 39 , Reference Timperio, Salmon and Telford 47 ), weight status was not associated with perceptions of neighbourhood crime or traffic.
The layer of the SEM consisting of neighbourhood characteristics was also a significant contributor to children’s weight status. Specifically, racial composition of the neighbourhood and neighbourhood income levels were significant predictors. Neighbourhood socio-economic status can influence types of assets and facilities that are available to residents( Reference Fraser and Edwards 18 , Reference Pearce, Blakely and Witten 40 , Reference Powell, Slater and Mirtcheva 41 , Reference Mushi-Brunt, Haire-Joshu and Elliott 48 , Reference Gordon-Larsen, Nelson and Page 49 ) and these may contribute to factors that predict children’s health outcomes.
The present analyses confirm previous findings in showing that parent-level factors such as parent’s BMI and education child-level factors such as age( Reference Sturm and Datar 46 ) were significant predictors of weight outcomes. In this predominantly non-White and low-income sample, child’s race and household income were not associated with weight outcomes. However, a marginal association was observed between SNAP participation and children’s weight outcomes after adjusting for household poverty status and other variables in the model. Given the lack of consensus in the field and the current debate about the role of SNAP in curtailing the obesity epidemic, these finding are important in that they suggest in low-income minority communities, after adjusting for elements in different layers of the SEM, that SNAP participation may be protective against childhood obesity.
Strengths and limitations
The richness of the data reported here allows consideration of several layers of the SEM and assessment of their associations with children’s weight outcomes after adjusting for important covariates. A wide age range of low-income children from non-Hispanic Black and Hispanic racial/ethnic groups was included, allowing for inferences about diverse subgroups of children living in low-income urban neighbourhoods.
The cross-sectional nature of the study design limits causal inferences. The response rate for the household survey (49 %) is similar to the response rate (50·2 %) for the New Jersey Behavior Risk Factor Surveillance Survey (BRFSS) for 2010( 50 ). It is important to note that unlike our study, the BRFSS sample is not limited to lower-income populations among whom survey response rates tend to be lower. In addition, data on some layers of the SEM, in particular the school environment, were not available. School environments can play a critical role in shaping children’s food and PA behaviours and their weight outcomes, especially among older children for whom school environments may play a larger role. Also, we evaluated the relative contribution of each layer of the SEM by examining changes in the Tjur R 2 when layers were removed from the full model. While this analysis provides an indication of the relative magnitude of the contributions, tests are not available to determine whether the changes in Tjur R 2 are statistically significant.
Overall, the findings from this application of the SEM suggest that, although parent characteristics, parent perceptions and neighbourhood demographic characteristics are most strongly associated with child’s weight status, elements of the food and PA environment also offer leverage points for designing effective interventions.
Conclusion
The current analysis shows that the SEM is a viable framework to investigate factors at multiple levels that are independently associated with children’s weight outcomes. Elements representing six key layers of the SEM were examined and five of the six layers were found to contribute significantly to predicting children’s weight status, with parent characteristics and parental perceptions of neighbourhood food and PA environments having the strongest association. Objectively measured geographical presence of food and PA outlets in neighbourhoods was also significantly associated with children’s weight outcomes. Successful childhood obesity prevention strategies should focus on improving the built environment, as well as on engaging parents in promoting the use of such enhancements. The current analysis also introduces analytic strategies that can be used to generate additional knowledge about factors at multiple levels affecting childhood weight status, which can be critical for designing effective interventions.
Acknowledgements
Financial support: This research was funded by a grant (Grant #64253) from the Robert Wood Johnson Foundation (RWJF). The RWJF had no role in the design, analysis or writing of this article. Conflict of interest: None. Authorship: P.O.-V. led the data analysis and writing of the manuscript. D.D. provided critical input in data analysis and writing of the manuscript. R.S.D. helped with data analysis and preparation of the manuscript. N.C.C. helped with conceptualizing the analysis plan. M.T. provided statistical support for data analysis. M.Y.J. led the design of the study and contributed to interpretation of findings and manuscript development. Ethics of human subject participation: This research was approved by the Institutional Review Boards of Rutgers University and Arizona State University.


