


Dietary fibre is important for promoting rumination and maintaining rumen health and also provides energy to the host animal for maintenance and production(Reference Zebeli, Ghareeb and Humer1,Reference Omidi-Mirzaei, Azarfar and Kiani2) . Fibre degradation in the rumen is a complex process that needs a wide range of micro-organisms to work as a consortium, including fungi, protozoa, bacteria and methanogens(Reference Jiao, Wang and He3,Reference Lengowski, Witzig and Möhring4) . Molecular hydrogen (H2) is formed during fermentation of carbohydrates to volatile fatty acids (VFA) and transferred to methanogens, which produce methane (CH4) as the end product(Reference Hungate5). Methanogenesis plays an important role in maintaining a low H2 partial pressure in the rumen, as elevated ruminal H2 is understood to inhibit fibre degradation in the rumen(Reference Wolin6,Reference Janssen7) . A previous study indicates that ruminal dissolved H2 (dH2) concentration can be closely associated with rumen fermentation and microbiota in dairy cows fed different types of carbohydrates(Reference Wang, Wang and Xie8). However, few studies have been conducted to investigate the association between ruminal dH2 concentration with fibre digestibility in ruminants.
Both Napier grass (NG, Pennisetum purpureum) and corn stover (CS, Zea mays) are important forage sources for ruminant production in subtropical areas. NG has a flat, smooth, rigid, regular and compact surface structure. The cell wall of NG is formed of crystalline cellulose(Reference Daud, Mohd Hatta and Mohd Kassim9), which is highly resistant to chemical and biological hydrolysis(Reference Himmel, Ding and Johnson10). CS contains 30–46 % fermentable carbohydrates. The fibre of CS silage has a coarse surface with fibre delamination, which increases the ratio of external:internal-specific surface area, which benefits microbial colonisation and enzymatic attack(Reference Li, Zhai and Zhang11).
We hypothesised that NG and CS silage would have different ruminal fibre degradation extents and patterns, and replacing the less digestible fibre source by the more digestible one would alter rumen fermentation and microbiota, which might be associated with ruminal dH2 concentration. In vitro batch cultures were firstly performed to compare ruminal fibre degradation, H2 and CH4 production of these two selected forages. Once established which fibre source was more digestible, an in vivo study was then performed to compare fibre digestibility, rumen fermentation and the abundance of microbial groups in growing beef bulls fed NG or CS diets.
Experimental methods
All procedures involving animals were approved by the Animal Care Committee (approval number ISA-W-201801), Institute of Subtropical Agriculture, the Chinese Academy of Sciences, Changsha, China.
Forages
CS was harvested 90 d after sowing and immediately after grain harvest. CS was chopped with a chaff cutter (Guangzhou State Machinery Equipment Co. Ltd) to 4 cm, ensiled in polyethylene bags (Wenzhou Quanyu Packing Co. Ltd) and compressed to remove the air. NG (Pennisetum purpureum) was harvested after 90 d of regrowth, ensiled in polyethylene bags and compressed to remove the air. After 2 months, samples of NG and CS silage were randomly collected from ten bags and dried at 65°C for 24 h. Samples of both silages were analysed for chemical composition (Table 1), used as a substrate in in vitro ruminal batch cultures and scanned with an electron microscope.
Chemical composition (expressed in g/kg of DM unless otherwise indicated) of Napier grass (NG) and corn stover (CS) silage
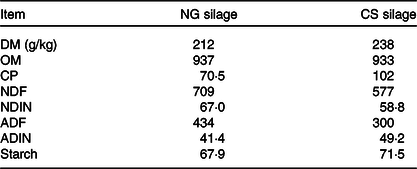
OM, organic matter; CP, crude protein; NDF, neutral-detergent fibre; NDIN, neutral-detergent insoluble N; ADF, acid-detergent fibre; ADIN, acid-detergent insoluble N.
In vitro ruminal batch incubation
Approximately 200 g samples of both dried forages were collected for in vitro ruminal batch incubations. One 100 g subsample was ground with a multi-functional pulverizer and then screened through a 1 mm stainless steel flour sieve. Approximately 1·0 g was weighed into each of 150 ml serum bottles for the investigation of in vitro fibre degradation and gas production. The other 100 g subsample was carefully cut to a length of 2 cm, and about 1·0 g was weighed into 150 ml serum bottles for the investigation of changes in the fibre structure before and after incubation by using scanning electron microscopy (SEM). In vitro ruminal incubations were performed in a fully automatic in vitro batch culture system as described by Wang et al. (Reference Wang, Wang and Yang12), with artificial saliva prepared according to Menke et al. (Reference Menke, Raab and Salewski13). The incubation was stopped at 48 h. Apparent in vitro degradation of chemical fractions was determined based on the contents of each fraction in the substrates incubated and the undigested residues after the 48-h in vitro incubation. The samples for obtaining SEM images were firstly filtered into Gooch filter crucibles to exclude small particles, dried at 105°C for 24 h and then stored in 50 ml sterile centrifuge tubes for further processing. Three runs of incubation were conducted. Two replicates per substrate were included in each incubation run.
Animal trial
Animals and diets
The experiment was conducted at the beef cattle farm of Guangxi Huisheng animal husbandry development Co. Ltd. Twenty-four healthy Limousin (sire) × (Aberdeen Angus (sire) × Simmental (dam)) crossbred growing beef bulls with an average body weight of 320 (SD 16·1) kg and 1·5 (SD 0·18) years old at the beginning of the experiment were used. Animals were allocated to twelve blocks according to body weight and DM intake (DMI) measured in a preliminary experiment. Each block contained two animals, and one animal within each block was randomly assigned to one of the two diets. The CS diet was formulated by replacing 55 % NG silage with 55 % CS silage (DM basis). The diets were formulated to meet appropriately 1·2–1·3 times the digestible energy and crude protein requirements of growing beef bulls according to Zhang & Zhang(Reference Zhang and Zhang14) (Table 2).
Ingredients and chemical composition of the Napier grass (NG) and corn stover (CS) diets (g/kg DM)
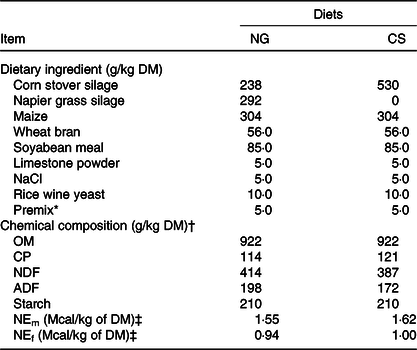
OM, organic matter; CP, crude protein; NDF, neutral-detergent fibre; ADF, acid-detergent fibre; NEm, net energy for maintenance; NEf, net energy for fattening.
* The premix (vitamins and microelements) was formulated to provide (per kg of DM) 1 000 000 IU of vitamin A, 200 000 IU of vitamin D, 1250 IU vitamin E, 8000 mg of Zn, 80 mg of Se, 120 mg of I, 2000 mg of Fe, 40 mg of Co, 2500 mg of Mn, and 2000 mg of Cu.
† Mean values from the analysis of three samples.
‡ NEm and NEf were calculated according to Feng(Reference Feng44). To convert Mcal to MJ, multiply by 4·184.
Bulls were housed in a tie-stall barn and fed individually two equal meals at 09.00 and 16.00 hours. Free access to fresh water was provided throughout the experiment. The experimental period lasted for 70 d, with 60 d of adaptation to the diets and the last 10 d for sampling and data collection, including 5 d for total faeces collection, 2 d for collecting rumen samples and 4 d for measuring body weight. Feed was offered ad libitum targeting 5 % refusals during the initial 10 d of the adaption period to estimate DMI. The amount of feed offered daily thereafter was set at 105 % of the previously measured DMI to minimise diet selection. The refusals were collected and analysed to calculate nutrient intake. All of the experimental bulls’ health conditions and DMI were recorded daily throughout the experiment to ensure that there was no clinical signs of possible metabolic disorders.
Nutrient digestibility
Feeds, refusals and faecal samples were collected daily from d 61 to 65. Total faeces were collected, weighed and mixed daily. A subsample (1 %, w/w) was acidified with H2SO4 (10 %, w/w) to prevent N loss and frozen immediately at –20°C. Another non-acidified subsample (1 %, w/w) was frozen immediately at –20°C. All the samples were dried at 65°C for 24 h in a forced-air oven and ground through a 1 mm screen for subsequent analysis of chemical composition. The acidified samples were used for total N analysis, and non-acidified samples were used for the rest of the chemical analyses.
Rumen sampling
The collection of rumen contents was performed on d 66 and 67 at 2·5 h after the morning feeding. The first 150 ml of rumen contents was discarded to avoid saliva contamination(Reference Wang, Wang and Janssen15). Then, about 300 ml of rumen contents was taken from the central rumen using the oral stomach tubing technique. About 20 ml of sampled rumen contents was used for immediately measuring pH with a portable pH meter (Starter 300; Ohaus Instruments Co. Ltd). Three 50 ml subsamples were immediately frozen in liquid N2 and stored at –80°C for DNA extraction for microbial abundance analyses. Two 35 ml rumen content subsamples were immediately transferred to 50 ml plastic syringes for measuring dH2 and dissolved CH4 (dCH4) concentrations(Reference Wang, Sun and Janssen16). Three more 5 ml subsamples of rumen contents samples were collected and centrifuged at 12 000 g for 10 min at 4°C, and 1·5 ml of supernatant was acidified with 0·15 ml of metaphosphoric acid (25 %, w/v) and stored at –20°C for subsequent measurement of VFA and ammonium concentrations.
Proximate analyses
Contents of DM (method 945.15), OM (method 942.05) and crude protein (method 945.01, total N × 6·25) were analysed using the methods of AOAC(17). Neutral-detergent fibre and acid-detergent fibre contents were determined according to Van Soest et al. (Reference Van Soest, Robertson and Lewis18) with inclusion of a heat stable α-amylase and sodium sulphite and were expressed with residual ash. Gross energy was determined with the use of an isothermal automatic calorimeter (5E-AC8018; Changsha Kaiyuan Instruments Co.). Starch content was measured using amyloglucosidase as described by Karthner & Theurer(Reference Karthner and Theurer19). Neutral-detergent insoluble N and acid-detergent insoluble N content were measured as described by Licitra et al. (Reference Licitra, Hernandez and VanSoest20).
The images of fibre structure were obtained by field emission using SEM (model SU8010), according to the manufacturer’s instructions. Briefly, the same site of the stem in each forage was selected and coated with gold before scanning by SEM(Reference Zhang, Wang and Wang21).
Dissolved gases were extracted from the liquid phase of rumen contents into the gas phase using the procedure by Wang et al. (Reference Wang, Sun and Janssen16). Gas samples in the gas phase were collected in evacuated tubes for measuring H2 and CH4 concentrations using a gas chromatograph (Agilent 7890A, Agilent Inc.)(Reference Wang, Wang and Janssen15). Concentrations of dH2 and dCH4 in the original liquid fraction were calculated using the equations by Wang et al. (Reference Wang, Wang and Janssen15).
Individual VFA concentrations were analysed by GC (Agilent 7890A, Agilent Inc.) according to Wang et al. (Reference Wang, Sun and Janssen16). Ammonium concentration was analysed according to Weatherburn(Reference Weatherburn22).
DNA extraction and quantification of microbial groups
Genomic DNA was extracted from 1 ml of rumen contents by physical disruption using a bead beater, according to the protocol described by Yu & Morrison(Reference Yu and Morrison23), with the exception that DNA was purified with phenol–chloroform–isopentyl alcohol (25:24:1 v/v, Solarbio Co.). Isopentyl alcohol was removed with vacuum. DNA was then dissolved into TE buffer (TRIS 10 mm, EDTA 1 mm, pH = 8·0) after being washed with 70 % ethanol twice. The quality of the DNA extracts was assessed using agarose gel (0·8 %) electrophoresis. Total DNA extracted was quantified with Nano Drop ND1000 (NanoDrop Technologies, Inc.) and then stored at –80°C until further analyses(Reference Jiao, Lu and Tan24).
Total DNA was then diluted to 10 ng/μl to quantify selected groups of micro-organisms, including total bacteria, protozoa, fungi and methanogens, Ruminococcus albus, Ruminococcus flavefaciens, Fibrobacter succinogenes, Selenomonas ruminantium, Prevotella ruminicola and the genus Prevotella spp. (online Supplementary Table S1). Quantitative PCR was performed according to Jiao et al. (Reference Jiao, Lu and Tan24) and expressed as log10 copies of 16S or 18S rRNA genes per ml rumen contents.
Statistical analyses
The effects of substrate or diet on response variables in vitro and in vivo were analysed by using the SPSS 21.0 software (SPSS Inc.). The in vitro data were analysed using the general linear model procedure with the following model:
 $${Y_{ijk}} = \mu + {S_i} + {R_j} + {e_{ijk}}$$
where μ is the overall mean, S i is the fixed effect of substrates (i = 2, NG or CS silage), R j is the random effect of the incubation run (j = 3) and e ijk is the random error term.
The in vivo data were also analysed using the procedure of general linear model with the following model:
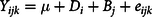 $${Y_{ijk}} = \mu + {D_i} + {B_j} + {e_{ijk}}$$
where μ is the overall mean, D i is the fixed effect of diets (i = 2, NS and CS diets), B j is the random effect of the block (j = 12) and e ijk is the random error term.
The associations of dH2 concentration and diet with various fermentation and microbiological variables were studied using the RStudio software (R × 64 3.5.0) with the following model(Reference Horton and Kleinman25):
 $$Y = {\beta _0} + {\beta _1}{X_1} + {\beta _2}{X_2} + {\beta _3}{X_1}{X_2} + \varepsilon $$
where Y is the neutral-detergent fibre (NDF) digestibility, dCH4 is the concentration or selected microbial groups, β 0 is the intercept, X 1 and X 2 are the main effects of dH2 concentration and diet, respectively, β 1 to β 2 are the regression coefficients of dH2 concentration and diet, respectively, X 1 X 2 is the interaction between dH2 concentration and diet, β 3 is the regression coefficient of the interaction term and ε is the random error. The point belonging to the CS diet with ‘dH2 = 0·83 μm’ was identified as an outlier by the Dixon Q test of the Data Processing System (DPS) software (version 15.10) and was excluded from the analyses but it is still depicted in graphs(Reference Rorabacher26).
Linear regression was performed by using RStudio software (R × 64 3.5.0) to obtain the correlation coefficients (R 2) and their statistical significance. Statistical significance of effects was declared at P ≤ 0·05 and a tendency towards significance at 0·05 < P ≤ 0·10.
Results
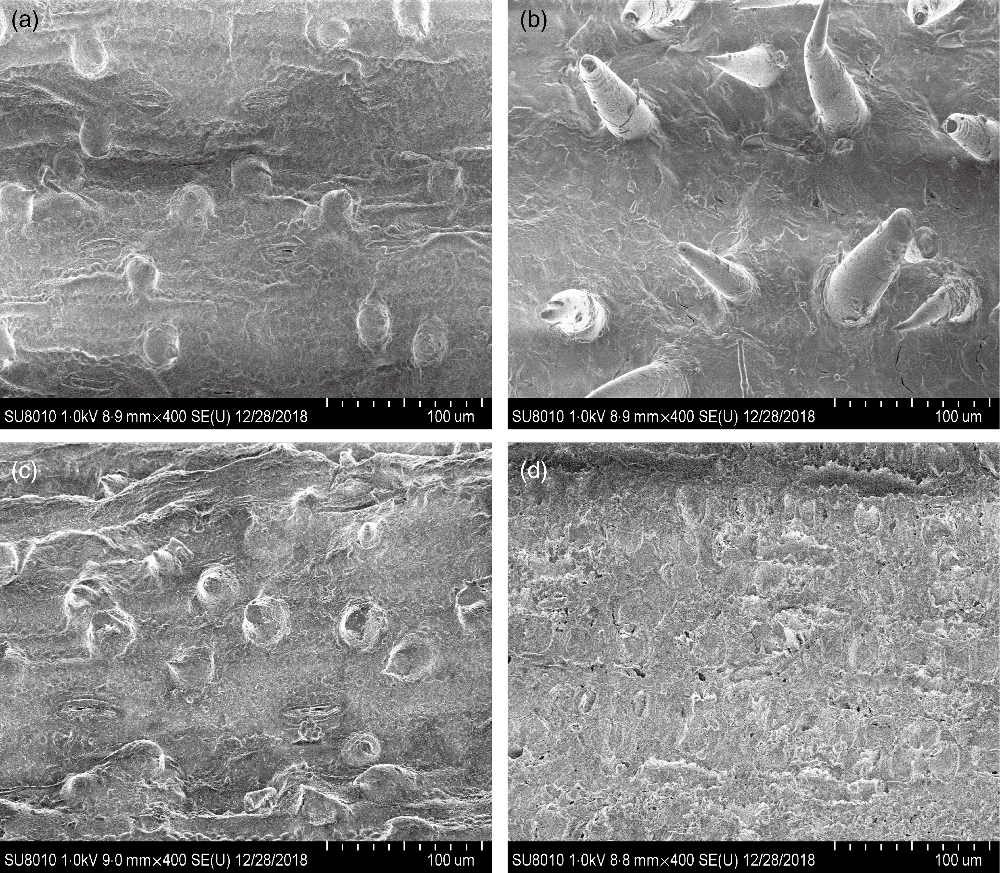
CS silage had greater in vitro digestibility (P < 0·001) of DM, NDF and acid-detergent fibre, total gas (P = 0·004) and CH4 volume (P = 0·03), and lower H2 volume (P < 0·001), in comparison with NG silage (Table 3). The SEM images showed that the CS silage had greater density of hairy appendages than the NG silage before the in vitro ruminal incubation, with the surface of both NG and CS silages appearing smooth, intact and contiguous (Fig. 1(a) and (b)). After 48-h in vitro rumen incubation, the hairy appendages disappeared from the CS silage and the CS silage seemed to have more small holes than the NG silage (Fig. 1(c) and (d)).
Substrate degradation and gas production of Napier grass (NG) or corn stover (CS) silage during 48-h in vitro ruminal batch incubation
(Mean values with their standard errors)
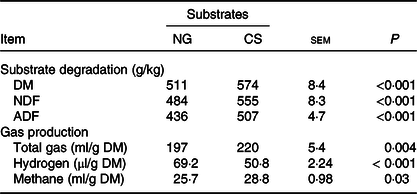
NDF, neutral-detergent fibre; ADF, acid-detergent fibre.
Scanning electron microscopy images (scale bar = 100 μm) of Napier grass (a and c) or corn stover (b and d) silage before (a and b) and after (c and d) 48-h in vitro ruminal incubation.
Bulls fed the CS diet had greater OM (P = 0·03), crude protein (P < 0·001) and gross energy (P = 0·002) intake, lower NDF (P = 0·03) and acid-detergent fibre intake (P < 0·001), and higher daily weight gain (P = 0·03), than those fed the NG diet (Table 4). Bulls fed the CS diet had greater digestibility of OM (P = 0·002), NDF (P = 0·048) and starch (P = 0·02), and lower digestibility of crude protein (P = 0·004) than those fed the NG diet.
Feed intake and total-tract apparent digestibility and growth performance in bulls fed the Napier grass (NG) or corn stover (CS) diets
(Mean values with their standard errors)
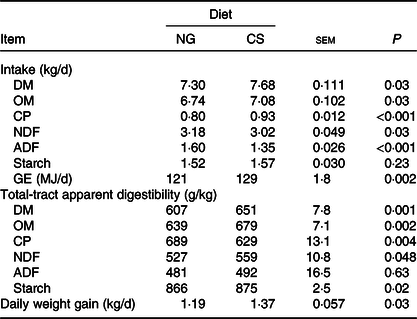
OM, organic matter; CP, crude protein; NDF, neutral-detergent fibre; ADF, acid-detergent fibre; GE, gross energy.
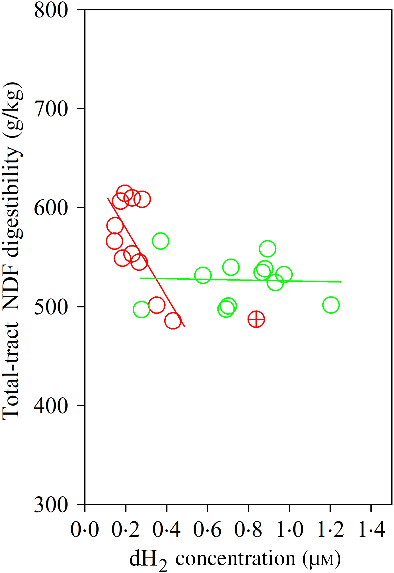
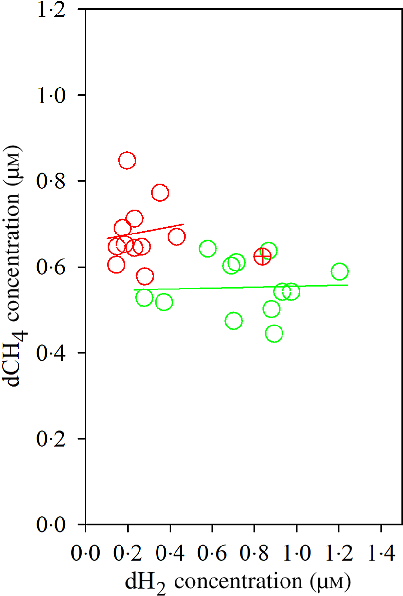
The Dixon Q test identified a point with ‘dH2 = 0·83 μm’ as an outlier for the CS diet. The outlier was removed from all of the analyses. Bulls fed the CS diet had lower ruminal dH2 concentration (P < 0·001), molar proportion of valerate (P = 0·02) and isovalerate (P = 0·02), and greater dCH4 concentration (P < 0·001), and tended to increased molar proportion of butyrate (P = 0·07), compared with those fed the NG diet (Table 5). There was an interaction between dH2 and diet on NDF digestibility (P = 0·006, Table 6), with a negative correlation between dH2 concentration and NDF digestibility in bulls fed the CS diet (R 2 0·48, P = 0·02) and no relationship in their counterparts fed the NG diet (R 2 < 0·01, P = 0·90; Fig. 2). Ruminal dH2 concentration did not have an association with dCH4 concentration in each diet separately (Fig. 3).
Concentrations of dissolved gases and fermentation end products in the rumens of bulls fed the Napier grass (NG) or corn stover (CS) diets
(Mean values with their standard errors)
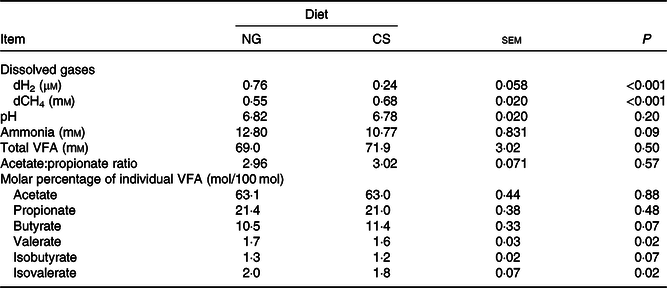
dCH4, dissolved methane; dH2, dissolved hydrogen; VFA, volatile fatty acids.
Initial regression equations depicting the associations of diet and ruminal dissolved hydrogen (dH2) concentration, and their interaction, with neutral-detergent fibre (NDF) digestibility, dissolved methane (dCH4) concentration and selected microbial groups in growing beef bulls fed the Napier grass (NG) or corn stover (CS) diets
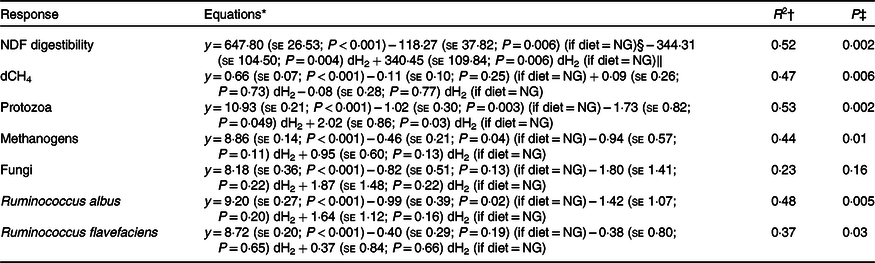
* Terms in parentheses after the regression coefficient estimates are standard errors and regression coefficient P values. The outlier (dH2 = 0·83 μm) identified by the Dixon Q test was excluded from all of the analyses, n 23.
† R 2, coefficient of determination of the multiple regression models.
‡ P value, statistical significance of the overall models.
§ Main effect of the NG diet.
‖ Regression coefficients for interaction terms are equal to zero for the CS diet.
Association of neutral-detergent fibre (NDF) digestibility with ruminal dissolved hydrogen (dH2) in bulls fed the Napier grass (NG) or corn stover (CS) diets. The green and red points and solid lines represent the best regression lines fitted using observations each diet separately. NG (green): y = 529·54 (±22·61; P < 0·001) – 3·86 (±28·39; P = 0·90) dH2; R 2 < 0·01, n 12; CS (red): y = 647·80 (±30·59; P < 0·001) – 344·31 (±120·48; P = 0·02) dH2; R 2 0·48, n 11. Equations contain regression coefficients, standard errors and P values and are expressed as regression coefficients with their standard errors. Each point represents an individual animal, with ⊕ being an outlier (dH2 = 0·83 μm) identified by the Dixon Q test and excluded from the analysis. Note the effect of diet by dH2 interaction is shown in Table 6.
Association of ruminal dissolved methane (dCH4) with ruminal dissolved hydrogen (dH2) in bulls fed the Napier grass (NG) or corn stover (CS) diets. The green and red points and solid lines represent the best regression lines fitted using observations from each diet separately. NG (green): y = 0·54 (±0·06; P < 0·001) + 0·01 (±0·08; P = 0·89) dH2; R 2 < 0·01, n 12; CS (red): y = 0·66 (±0·07; P < 0·001) + 0·09 (±0·29; P = 0·76) dH2; R 2 = 0·01, n 11. Equations contain regression coefficients, standard errors and P values, and are expressed as regression coefficients with their standard errors. Each point represents an individual animal, with ⊕ being an outlier (dH2 = 0·83 μm) identified by the Dixon Q test and excluded from the analysis. Note the effect of diet by dH2 interaction is shown in Table 6.
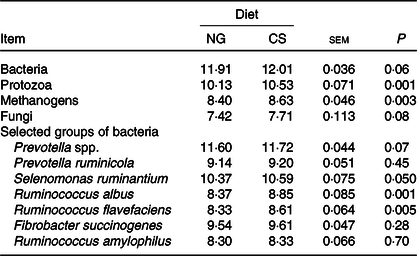
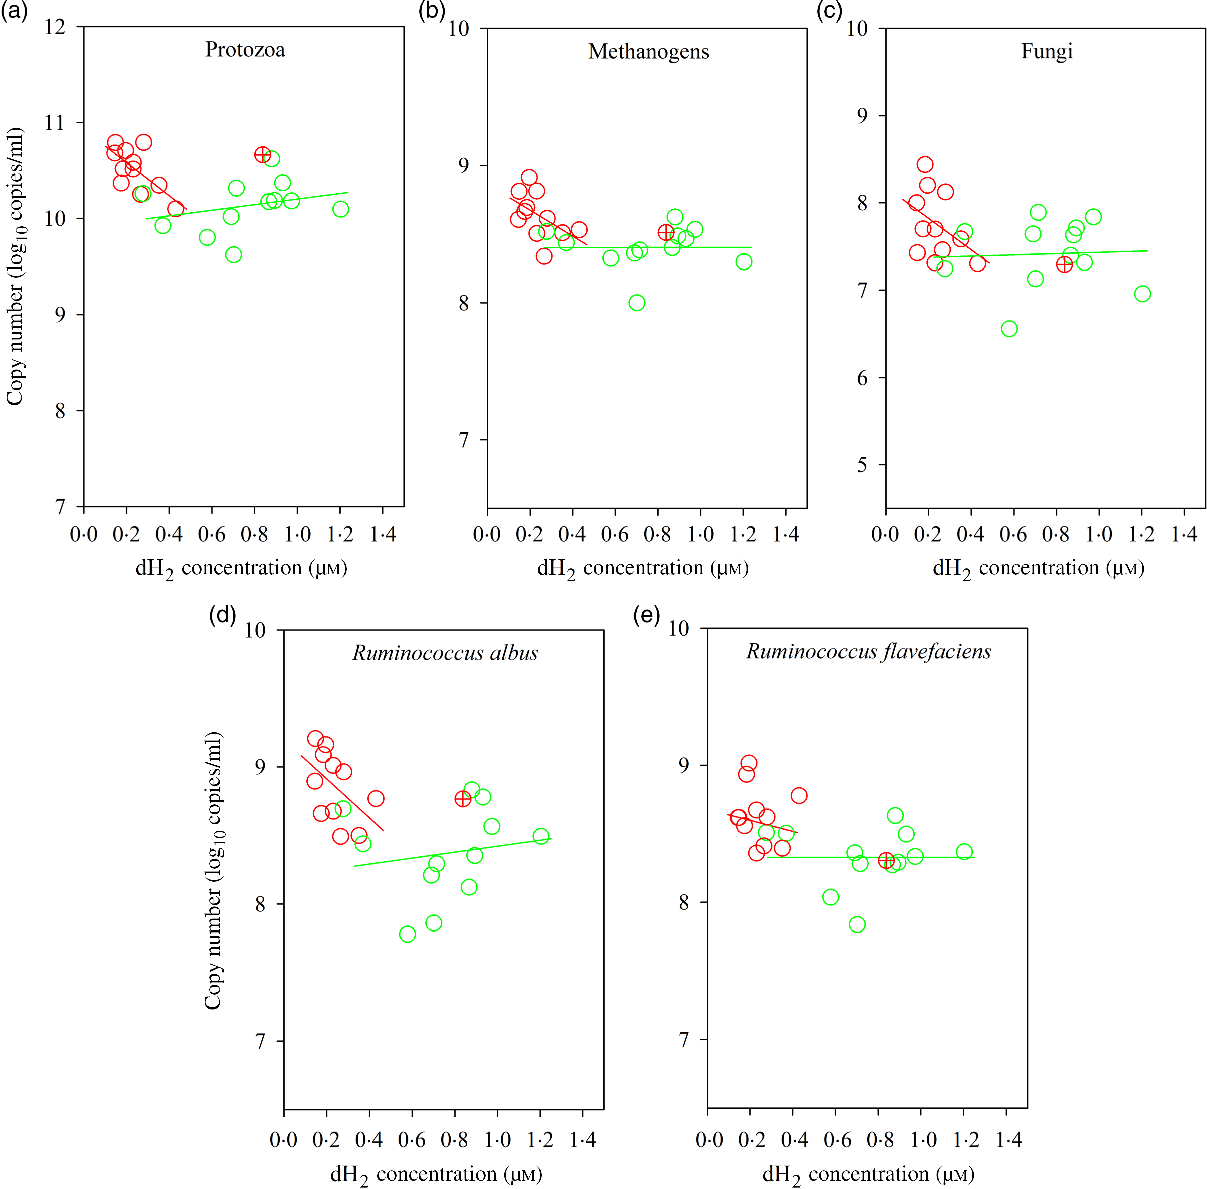
Bulls fed the CS diet had greater log 18S rRNA gene copies of protozoa (P = 0·001) and log 16S rRNA gene copies of S. ruminantium (P = 0·05), R. albus (P = 0·001), R. flavefaciens (P = 0·005) and methanogens (P = 0·003) and tended to increased total bacteria (P = 0·06), fungi (P = 0·08) and Prevotella spp. (P = 0·07) per ml of rumen fluid (Table 7). There was an interaction between dH2 and diet on 18S rRNA protozoal gene copies (P = 0·03, Table 6), with no association at the relatively lower dH2 concentration of the NG diet (R 2 = 0·08, P = 0·37) and a positive association with dH2 at the higher dH2 concentration of the CS diet (R 2 0·45, P = 0·02; Fig. 4). Ruminal dH2 concentration did not correlate (P > 0·10) with the 16S gene copies of methanogens, fungi, R. flavefaciens or R. albus per ml of rumen fluid in each diet separately (Fig. 4).
Selected microbial groups (log10 gene copies per ml rumen content) in the rumens of bulls fed the Napier grass (NG) or corn stover (CS) diets
(Mean values with their standard errors)
Associations of ruminal 16S rRNA gene copies of selected microbial groups with ruminal dissolved hydrogen (dH2) in bulls fed the Napier grass (NG) or corn stover (CS) diets. The green and red points and solid lines represent the best regression lines fitted using observations from the NG (n 12) and the CS (n 11) diets fitted separately. (a) NG (green): y = 9·91 (±0·25; P < 0·001) + 0·29 (±0·31; P = 0·37) dH2, R 2 0·08, n 12; CS (red): y = 10·93 (±0·16; P < 0·001) – 1·73 (±0·64; P = 0·02) dH2, R 2 0·45, n 11. (B) NG (green), y = 8·40 (±0·15; P < 0·001) + 0·003 (±0·19; P = 0·99) dH2, R 2 < 0·01, n 12; CS (red): y = 8·86 (±0·14; P < 0·001) – 0·94 (±0·54; P = 0·12) dH2, R 2 = 0·25, n 11. (C) NG (green) y = 7·36 (±0·38; P < 0·001) + 0·07 (±0·48; P = 0·89) dH2, R 2 < 0·01, n 12; CS (red) y = 8·18 (±0·34; P < 0·001) – 1·80 (±1·33; P = 0·21) dH2, R 2 = 0·17, n 11. (D) NG (green), y = 8·20 (±0·32; P < 0·001) + 0·22 (±0·40; P = 0·60) dH2, R 2 = 0·03, n 12; CS (red): y = 9·20 (±0·21; P < 0·001) – 1·42 (±0·83; P = 0·12) dH2, R 2 = 0·25, n 11. (E) NG (green): y = 8·33 (±0·21; P < 0·001) – 0·001 (±0·26; P = 0·99) dH2, R 2 < 0·01, n 12; CS (red): y = 8·72 (±0·20; P < 0·001) – 0·38 (±0·79; P = 0·65) dH2, R 2 = 0·02, n 11. Equations contain regression coefficients, standard errors and P values, and are expressed as regression coefficients with their standard errors. Each point represents an individual animal, with ⊕ being an outlier (dH2 = 0·83 μm) identified by the Dixon Q test and excluded from the analysis. Note the effect of diet by dH2 interaction is shown in Table 6.
Discussion
DMI of the CS diet was greater than that of the NG diet, which is in agreement with a previous study by Ruiz et al. (Reference Ruiz, Sanchez and Staples27). Increased DMI is associated with increased passage rate, which can result in less rumen degradation if not compensated by greater rumen degradation rate or lower tract digestion(Reference Allen28). However, feeding the CS diet resulted in greater total-tract DM digestibility compared with feeding the NG diet, which makes us think that greater digestion rates with the CS diet might have allowed greater DMI. The CS diet had lower NDF content and greater in vitro NDF degradation than the NG diet. Lower fibre content and greater fibre degradation decrease rumen fill with increased outflow of ruminal digesta(Reference Allen28), which might explain the greater DMI and daily weight gain in bulls fed the CS diet.
The fibre structure of CS silage differed from that of NG silage. Differences in fibre structure can be related to a vast range of biochemical compounds(Reference Elleuch, Bedigian and Roiseux29,Reference Foschia, Peressini and Sensidoni30) . From a structural point of view, CS silage had a greater density of hairy appendages than NG silage, which might provide more sites for microbial attachment and colonisation. Both in vitro and in vivo experiments indicated that the CS silage had greater NDF degradability than the NG silage. It seems that the fibre of the CS silage was easier to degrade by the mixed ruminal microbiota. In agreement, the SEM images showed that the CS silage had greater disruption and physical changes than the NG silage after 48-h in vitro rumen incubation.
Hydrogen is generated during fermentation of carbohydrates to VFA and mostly utilised by ruminal methanogens to produce CH4 (Reference Janssen7,Reference van Lingen, Plugge and Fadel31) . Maintenance of a low ruminal dH2 concentration facilitates carbohydrate degradation(Reference McAllister and Newbold32). Ruminal dH2 concentration can be affected by many factors, such as the rate of H2 generation, the saturation factor of dH2 and the rate of H2 utilisation for methanogenesis. When the rate of H2 generation is greater than H2 utilisation, H2 accumulates. In our in vitro study, CS silage was more degraded and fermented than NG silage, which would be thought to lead to increased H2 production(Reference Janssen7). However, CS silage had lower in vitro H2 gas volume with greater in vitro CH4 gas volume in comparison with NG silage. Furthermore, feeding the CS diet resulted in lower ruminal dH2 concentration compared with feeding the NG diet. This might be due to the enhanced capacity of ruminal H2 utilisation by methanogens in bulls fed the CS diet(Reference Janssen7), which is consistent with the greater dCH4 concentration and 16S rRNA gene copies of methanogens observed in bulls fed the CS diet. Enhancement of methanogenesis results in lower ruminal dH2 concentration(Reference Janssen7) and thus facilitates the re-oxidation of reduced electron carriers, like NADH, leading to an enhancement of microbial ATP generation and fibre degradation in the rumen(Reference Ungerfeld33,Reference Wolin, Miller, Stewart, Hobson and Stewart34) . This proposed mechanism agrees with the negative association of NDF digestibility with dH2 observed for the CS diet and suggests that the low dH2 concentration may have facilitated ruminal fibre degradation in bulls fed the CS diet. On the other hand, even though the range of dH2 concentration observed with NG was higher compared with CS, dH2 concentration did not correlate to NDF digestibility with the NG diet, and thus an inhibitory effect of dH2 on fibre digestion was not apparent with the NG diet. It is possible that in the less digestible NG diet, other aspects related to the forage structure (Fig. 1) limited NDF digestibility, rather than dH2 concentration. Lower dH2 concentration with the CS diet would have been the result of enhanced methanogenesis(Reference Janssen7), although the mechanisms by which feeding the CS diet could have affected methanogens are unknown.
Although the CS diet had greater fibre digestibility than the NG diet, both diets resulted in similar ruminal pH and VFA concentration. It is well known that VFA concentration is not only determined by VFA production but also by VFA absorption, passage, incorporation into microbial biomass and changes in rumen volume(Reference Dijkstra, Boer and Vanbruchem35–Reference Hall, Nennich and Doane37). Furthermore, feeding the CS diet resulted in greater butyrate molar percentage in the rumen. As protozoa are butyrate producers(Reference Morgavi, Martin and Jouany38), it is possible that the increased protozoa population in bulls fed the CS diet could have contributed to the greater butyrate percentage.
Ruminal fibre degradation requires a complex consortium of micro-organisms. Anaerobic fungi are primary colonisers of plant fibre that physically open plant tissues for subsequent colonisation by fibrolytic bacteria(Reference Edwards, Kingston-Smith and Jimenez39,Reference Belanche, Doreau and Edwards40) . Feeding the CS diet resulted in greater numbers of bacteria, fungi, protozoa and R. albus and R. flavefaciens 16S and 18 rRNA gene copies, in comparison with feeding the NG diet. It seems that feeding the CS diet favoured the colonisation and growth of fibre degraders, such as fungi, R. albus and R. flavefaciens, and possibly some protozoa(Reference Newbold, de la Fuente and Belanche41). Fibre degradation generally increases H2 production. Greater removal of H2 by methanogens, resulting in lower dH2 concentration, can favour the growth of H2 producers(Reference Janssen7). However, we did not find relationships between dH2 concentration and the abundance of fibre degraders; thus, the negative association of dH2 concentration with fibre degradation found for the CS diet may be related to other fibrolytic micro-organisms not determined in this study.
Methanogens are the most important H2 utilisers in the rumen, maintaining a low H2 partial pressure. We observed a significant effect of the diet, which was not associated with dH2, on methanogens 16S rRNA gene copies. These results indicate that fibre source was the main factor to influence growth of methanogens, and dH2 concentration was probably a result of the rate of methanogenesis(Reference Janssen7). Some methanogens are symbiotic of protozoa(Reference Morgavi, Martin and Jouany38,Reference Tokura, Chagan and Ushida42,Reference Lewis, Sendra and Embley43) , which were more abundant with the CS diet. It is possible that fibre in the CS diet provided more sites for the colonisation and growth of protozoa, which could have favoured the growth of methanogens.
Conclusion
Bulls fed the CS diet had greater DMI, NDF digestion and average daily gain than those fed the NG diet. Fibre in CS silage provided more sites for colonisation by rumen micro-organisms, which probably favoured the growth of fibre degraders and resulted in greater ruminal fibre degradation and increased dCH4 concentration compared with NG silage. Such enhancement of methanogenesis with CS probably decreased ruminal dH2 concentration, which might have contributed to increased fibre degradation and growth of fibrolytic micro-organisms. Fibre degradation of the NG diet was unrelated to dH2 concentration and may have been influenced more by structural factors.
Acknowledgements
The authors thank the National Key Research and Development Program of China (grant no. 2018YFD0501800 and 2016YFD0500504), National Natural Science Foundation of China (grant no. 31922080 and 31561143009), CAS President’s International Fellowship (grant no. 2018VBA0031) and the Major Project for Science and Technology of Hunan Province (grant no. 2017NK1020) for the joint financial support.
R. W., M. W., B. L., Z. Y. M., T. T. W., J. N. W. and X. M. Z. conducted the research; R. W. and M. W. analysed the data; R. W., M. W., E. M. U., J. P. D. and Z. L. T. wrote and revised the paper; R. W. and M. W. designed the research and had primary responsibility for the final content. All authors read and approved the final manuscript.
The authors declare that they have no conflicts of interest.
Supplementary material
For supplementary material referred to in this article, please visit https://doi.org/10.1017/S0007114520002962


