

Obesity has been a global epidemic for decades and is linked to various diseases, including multiple types of cancers, type 2 diabetes and CVD(Reference Renehan, Tyson and Egger1). In 2016, 39 % of adults worldwide were overweight and 13 % were obese. The prevalence of obesity in 2016 nearly tripled that in 1975. Additionally, the obesity crisis is even more prominent among children. Nearly 40 million children under age 5 were overweight in 2019(2). Moreover, obese patients have worse outcomes compared with the normal-weight patients. Obese individuals had a 25 % increased risk of all-cause mortality, compared to those with normal body weight(Reference Lee, Meyerhardt and Giovannucci3).
One of the mechanisms that obesity increases the risk of cancer and cardiometabolic diseases is through changes in the level of sex hormones. For example, in postmenopausal women, attained body weight is positively associated with oestrone (E1), oestradiol (E2) and inversely associated with sex hormone-binding globulins (SHBG)(Reference Vermeulen and Verdonck4–Reference Turcato, Zamboni and De Pergola6), and these changes of the hormones, higher E1 and E2, and lower SHBG, are associated with a higher risk of breast cancer(Reference Zeleniuch-Jacquotte, Shore and Koenig7). In premenopausal women, adulthood BMI is positively associated with free T(Reference Tworoger, Eliassen and Missmer8), while higher free T is associated with increased breast cancer risk(Reference Wysowski, Comstock and Helsing9–Reference Zeleniuch-Jacquotte, Afanasyeva and Kaaks12). This discrepancy between women of different ages may be explained by increased oestrogen production from peripheral adipose tissues in women after menopause. On the other hand, obesity is associated with decreased SHBG and T in men(Reference Allan and McLachlan13,Reference Cooper, Page and Amory14) , and these hormone changes are in relation to higher colon cancer risk(Reference Lin, Zhang and Rexrode15).
Growing data indicate the importance of long-term adiposity status, particularly middle-life weight gain, for chronic diseases(Reference Kværner, Hang and Giovannucci16–Reference Song, Hu and Wu20). Most studies assessed body weight in single or different cross-sectional time points in relation to sex hormones(Reference Tworoger, Eliassen and Missmer8,Reference Liedtke, Schmidt and Vrieling21–Reference Bezemer, Rinaldi and Dossus23) . For example, Tworoger et al. examined the association of birth weight, body shape at ages 5 and 10, BMI at age 18 and adulthood with sex hormone concentrations among premenopausal women, and found while few associations between early body weight and sex hormones, adult BMI was positively associated with free T and negatively associated with SHBG(Reference Tworoger, Eliassen and Missmer8). However, little is known about the impact of the life-course changes in adiposity on sex hormones. More specifically, individuals may have different weight change trajectories over time. For example, individuals may have similar attained body weight but very different childhood body weight. Therefore, in this study, we investigated the relationship between trajectories of BMI and body shape, and plasma concentrations of sex hormones, including E1, E2, T, SHBG, free E2, free T and E2/T ratio. The trajectory of body fatness was calculated from age 5 to 60 for postmenopausal women and men and from age 5 to 40 for premenopausal women. Because the associations may differ by sex and menopausal status at blood draw, we performed separate analysis in men, pre- and postmenopausal women, in three large ongoing cohort studies in the USA.
Methods
Study population
This is a multicohort study. We used data from three large cohorts, including the Health Professionals Follow-up Study (HPFS), the Nurses’ Health Study (NHS) and NHS II. Detailed information regarding these three cohorts has been described elsewhere(Reference Colditz, Manson and Hankinson24,Reference Rimm, Giovannucci and Willett25) . In short, the HPFS enrolled 51 529 47–84-year-male health professionals in 1986. The NHS enrolled 121 700 30–55-year-female nurses in 1976. The NHS II enrolled 116 429 25–42-year-registered female nurses in 1989. Questionnaires have been mailed to participants every 2 years to collect updated medical and lifestyle information. The follow-up rates for the three cohorts have been higher than 90 %. Blood samples were collected in 1993–1995 from 18 159 participants in the HPFS, in 1989–1990 from 32 826 in the NHS and in 1996–1999 from 116 429 in the NHS II. The blood collection process was similar for the three cohorts and has been described elsewhere(Reference Kværner, Hang and Giovannucci16,Reference Wei, Giovannucci and Fuchs26) .
Participants with available sex hormone data from previous nested case–control studies of various outcomes within the three cohorts were included in this study (online Supplementary Fig. S1). We excluded participants who had a history of diabetes, CVD and any kind of cancers (except melanoma skin cancer) at the time of blood draw; those who had incomplete body shape data and whose sex hormone concentrations were considered outliers according to the Rosner’s method(Reference Rosner27). The final analysis included 2431 participants from HPFS, 6714 from NHS and 4105 from NHS II. We further combined and re-grouped women from the NHS and NHS II into 4801 premenopausal and 6018 postmenopausal women. The menopausal status and information of past hormone usage were collected at the questionnaire when participants had their blood draw. The participants who provided the blood sample had not taken any hormone therapy or oral contraceptives, been pregnant or breastfed within 6 months.
The study was approved by the Institutional Review Board at the Brigham and Women’s Hospital and Harvard TH Chan School of Public Health. The study was registered at www.clinicaltrials.gov (NCT03419455).
Body shape assessment
To assess early-life body fatness, participants were asked to recall their body shape in early and middle life with the use of pictorial diagrams (somatotypes), which were developed by Stunkard et al. (Reference Stunkard, Sørensen and Schulsinger28) In 1988, participants from the NHS and HPFS, and in 1989, women from the NHS II were asked to pick one of the nine somatotypes that best described their body shape when they were 5, 10, 20, 30 and 40 years old. Recalled somatotypes have been validated against measured early-aged BMI at similar ages from a previous study, the Third Harvard Growth Study(Reference Must, Willett and Dietz29). Among 181 participants, the correlation coefficients of recalled somatotypes and measured BMI at age 5, 15 and 20 years were 0·60, 0·65 and 0·66 for women. Participants were also asked to recall their weight at age 18 years in the NHS in 1980 and the NHS II in 1989, at age 21 years in HPFS in 1986. Self-reported body weight has been validated to be highly correlated with measured body weight in previous studies(Reference Troy, Hunter and Manson30,Reference Rimm, Stampfer and Colditz31) . The correlation coefficient of recalled weight and measured weight was 0·87 among 118 women in the NHS II and 0·97 among 263 women and men from the NHS and the HPFS. The data of current height and body weight were collected at the baseline questionnaire and body weight was continuously updated every 2 years. BMI was calculated as weight in kilograms divided by height in meters squared. The early- and middle-life body fatness of all participants then being used to perform group-based trajectory modelling(Reference Song, Hu and Wu20). Participants who had missing data at more than half of the examined age points were excluded (online Supplementary Fig. S1).
Covariate assessment
Detailed medical and behavioural information was collected through questionnaires at baseline and every 2–4 years thereafter. We included the following covariates: physical activity, smoking, alcohol consumption, dietary intake, multivitamin use, use of aspirin and other nonsteroidal anti-inflammatory drugs, ever use of contraceptives or hormone therapy (women only)(Reference Kværner, Hang and Giovannucci16). Physical activity was assessed by summing the time spent on various activities, including recreational or leisure-time physical activities, with the average metabolic equivalent of tasks for that activity. We calculated pack-years of smoking as years of smoking multiplied by the average number of packs smoked per day. The Alternative Healthy Eating Index score that reflects the pattern in food choices and consumption of micronutrients associated with lower risks of chronic diseases was used to assess the dietary quality of participants(Reference McCullough, Feskanich and Stampfer32,Reference Chiuve, Fung and Rimm33) . To better characterise the long-term impact of lifestyle exposures, we calculated cumulative average measurements from baseline to blood draw for physical activity, alcohol consumption and Alternative Healthy Eating Index dietary score.
Biomarker assessment
Details on laboratory assays of oestrogen, testosterone and SHBG can be found elsewhere(Reference Tworoger, Eliassen and Missmer8,Reference Hankinson, Willett and Manson34) . In short, samples were assayed by RIA at Quest Diagnostics. Because the assays were conducted in different batches in prior studies, we corrected sex hormone concentrations for potential batch variation using the batch correction method developed by Rosner et al. (Reference Rosner27,Reference Rosner, Cook and Portman35) in the correction model, and we adjusted for covariates that may influence sex hormone levels, including physical activity, smoking, alcohol consumption, use of aspirin and other nonsteroidal anti-inflammatory drugs, fasting status and ever use of contraceptive or hormone therapy (women only). We performed batch correction separately for each of the cohorts and used the recalibrated biomarker concentrations for the analyses. Measurement values were set to log (0·01) if the level was less than 0 after batch correction. We calculated free E2 and free T based on the concentrations of E2, T and SHBG using the formula proposed by Sodergard et al. (Reference Vermeulen, Verdonck and Kaufman36) We calculated free T from the concentrations of SHBG and T, and then used the concentrations of free T, SHBG and E2 to calculate free E2.
Statistical analysis
Trajectory modelling
We used group-based trajectory modelling to identify groups with similar evolution of life-course body shapes within men and premenopausal and postmenopausal women separately. The group-based trajectory method has been described elsewhere(Reference Song, Willett and Hu17). In short, longitudinal body shape data were fitted via maximum likelihood as a mixture of multiple latent trajectories in a censored normal model with a polynomial function of age. We used a two-stage approach based on the Bayesian information criterion to determine the optimal number and shape of trajectories for the model(Reference Nagin and Odgers37). Our final model yielded four trajectory groups for men and pre- and postmenopausal women.
We calculated the posterior predicted probability for each participant of being a member of each of the trajectory groups and assigned participants to the group for which they had the highest probability. To assess the adequacy of the trajectory group assignment, we calculated the mean posterior probability of assignment and the odds of correct classification for each group(Reference Nagin and Odgers37). The odds of correct classification are the ratio of the odds of correct classification based on the maximum probability classification rule and the odds of correct classification based on the random assignment. The mean posterior probability of at least 0·70 and the odds of correct classification of 5·0 for each group indicate adequate model fit(Reference Nagin and Odgers37). The measures in all of the trajectory groups in our study exceeded these recommended thresholds (online Supplementary Table S1). Finally, we named our trajectory groups based on their visual patterns for the evolution of body shapes over age. For men and postmenopausal women, the four trajectory groups were (1) lean-moderate increase group: participants started lean and had a moderate weight gain (from body fatness level 1–2 at age 5 years to body fatness level 3–4 at age 60 years), (2) lean-marked increase group: participants started lean and had a substantial weight gain (from body fatness level 1–2 at age 5 years to body fatness level 3–4 at age 60 years), (3) medium-stable group: participants maintained a relatively stable medium body weight (body fatness level maintains at 3–5 along age 5–60 years) and (4) medium increase group: participants started medium and acquired a moderate or substantial weight gain (from body fatness level 3–5 at age 5 years to body fatness level 7 at age 60 years). For premenopausal women, the four trajectory groups are (1) lean-stable moderate increase group: participants started lean and maintained a relative stable body weight or had a moderate weight gain (from body fatness level 2 at age 5 years to body fatness level 3–4 at age 40 years), (2) lean-marked increase group: participants started lean and had a substantial weight gain (from body fatness level 1 at age 5 years to body fatness level 3–4 at age 40 years), (3) medium-stable/increase group: participants started medium and maintained a relative stable body weight or had a moderate weight gain (body fatness level maintains at 3–5 along age 5–60 years), (4) heavy-stable/increase group: participants started heavy and maintained a relative stable body weight or acquired a moderate weight gain (from body fatness level 4–5 at age 5 years to body fatness level 6–7 at age 40 years).
Association analysis
We used Spearman’s partial correlation analysis with adjustment for age at blood draw to assess the correlations between body shape, BMI, changes in BMI across the life course and sex hormone concentrations. Although we assessed body weight at several different time points, we only had the sex hormone concentrations from the blood sample drawn during participants’ middle life.
We further performed linear regression models to examine relationships between trajectories of body fatness and sex hormone concentrations. We log-transformed the sex hormone measurements to improve the normality of the data. We used the trajectory group with the lowest adiposity level as the reference. The linear regression model was adjusted for age at blood draw, race (white, non-white), physical activity (men: < 7, 7–14·9, 15–24·9, ≥ 25 metabolic equivalent task hours/week; post- and premenopausal women: < 5, 5–11·4, 11·5–21·9, ≥ 22 metabolic equivalent task hours/week), alcohol consumption (< 0·15, 0·15–1·9, 2·0–7·4, 7·5–14·9, ≥ 15 g/d), smoking status (0, 1–15, 16–25, 26–45, > 45 pack-years), Alternative Healthy Eating Index dietary score (men: < 35·2, 35·2–40·9, 41·0, 47·6, > 47·6; women: < 37·8, 37·8–43·5, 43·6–49·9, > 49·9), multivitamin use (yes, no), regular aspirin/nonsteroidal anti-inflammatory drug use (yes, no) and ever use of contraceptives or hormone therapy (only in women). We further conducted a sensitivity analysis among pre- and postmenopausal women who had never been exposed to hormonal therapy at blood draw.
SAS 9.4 (SAS Institute) was used in all analyses. All the statistical tests were set at the significance level of P-value < 0·05, two-sided.
Results
We identified four distinct trajectory groups in each cohort. Figure 1 shows the estimated mean body fatness level according to the age in each trajectory group. Men and postmenopausal women had similar body shape trajectories: 36 % of men and 28 % of postmenopausal women started lean and acquired a moderate weight gain (lean-moderate increase group); 23 % men and 18 % postmenopausal women started lean and acquired a substantial weight gain (lean-marked increase group); 28 % men and 41 % postmenopausal women maintained a relatively stable medium body weight (medium-stable group); 13 % men and 13 % postmenopausal women started medium and acquired a moderate or substantial weight gain (medium-increase group). As for premenopausal women, 45 % started lean and maintained their weight or acquired a moderate weight gain (lean-stable/moderate increase group); 18 % started lean and acquired a substantial weight gain (lean-marked increase group); 31 % started medium and maintained their weight or acquired a moderate weight gain (medium-stable/increase group); 5 % started heavy and maintained their weight or acquired a moderate weight gain (heavy-stable/increase group).
The trajectory of body fatness by age from 5 to 40/60 in (a) men, (b) postmenopausal and (c) premenopausal women. 2431 men, 6019 postmenopausal and 4801 premenopausal women from the HPFS study, the NHS study and the NHS II study were included and categorised into four body shape trajectory groups. Y-axis represents the estimated mean body fatness in each trajectory group at the corresponding age (x-axis). HPFS, Health Professional Follow-Up Study; NHS, Nurse’ Health Study; NHS II, Nurse’ Health Study II. (a) ![]() , lean-moderate increase (current BMI: 24·2);
, lean-moderate increase (current BMI: 24·2); ![]() , lean-marked increase (current BMI: 27·8);
, lean-marked increase (current BMI: 27·8); ![]() , medium-stable (current BMI: 24·6);
, medium-stable (current BMI: 24·6); ![]() , medium-increase (current BMI: 28·5). (b)
, medium-increase (current BMI: 28·5). (b) ![]() , lean-moderate increase (current BMI: 23·0);
, lean-moderate increase (current BMI: 23·0); ![]() , lean-marked increase (current BMI: 28·7);
, lean-marked increase (current BMI: 28·7); ![]() , medium-stable (current BMI: 23·4);
, medium-stable (current BMI: 23·4); ![]() , medium-increase (current BMI: 32·9). (c)
, medium-increase (current BMI: 32·9). (c) ![]() , lean-marked increase (current BMI: 23·6);
, lean-marked increase (current BMI: 23·6); ![]() , lean-stable/moderate increase (current BMI: 23·8);
, lean-stable/moderate increase (current BMI: 23·8); ![]() , medium-stable/increase (current BMI: 27·0);
, medium-stable/increase (current BMI: 27·0); ![]() , heavy-stable/increase (current BMI: 33·8).
, heavy-stable/increase (current BMI: 33·8).
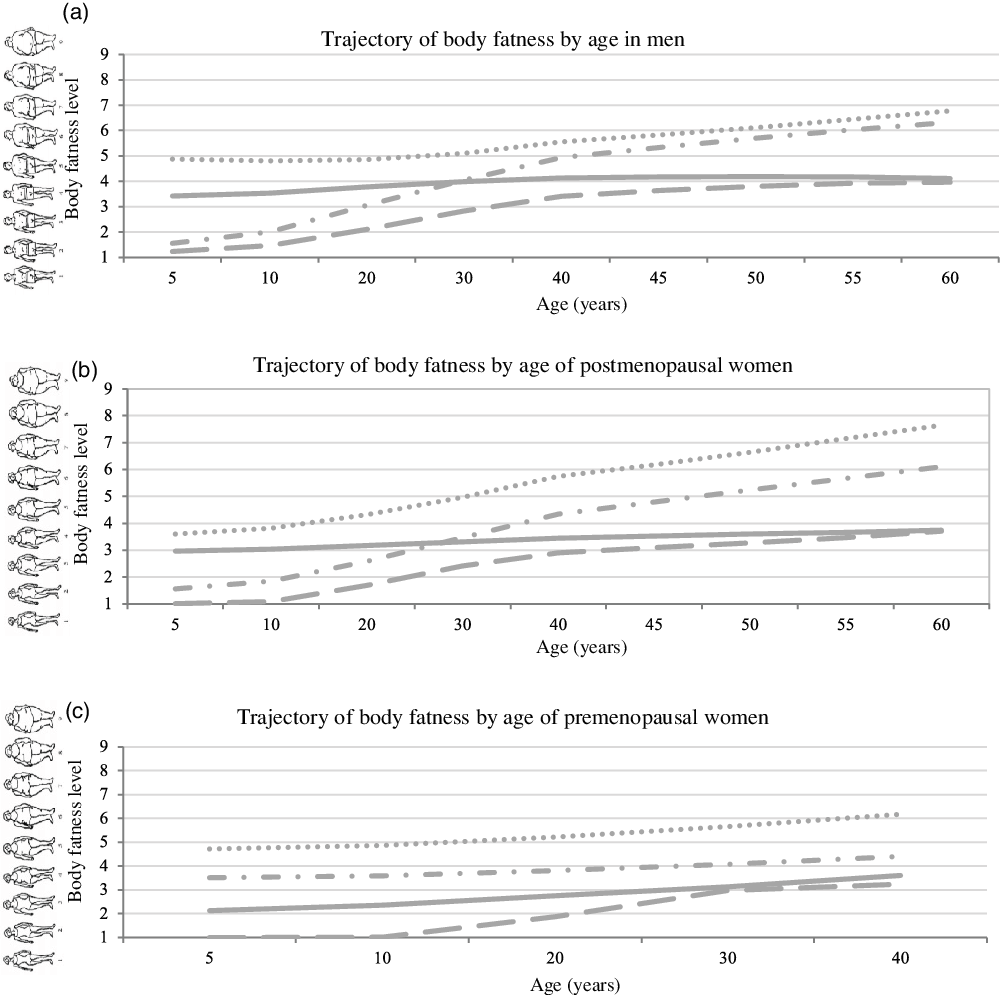
Table 1 presents the basic characteristics according to the body shape trajectories at the time of blood draw. The mean age was 64·1 (sd 8·1) years for men, 59·4 (sd 6·0) for postmenopausal women and 44·1 (sd 4·6) for premenopausal women. In general, the changes in BMI at different ages corresponded with the trajectories. The lean-marked increase group had larger differences between BMI at age 18 years and at age 50 years, compared with the lean-moderate increase group. Among men and postmenopausal women, compared with the lean-moderate increase and medium-stable groups, the lean-marked increase and medium-increase groups had larger waist circumferences and exercised less. Among premenopausal women, the heavy-stable/increase group had the largest waist circumferences and the highest Alternative Healthy Eating Index and exercised least when compared with the other three groups.
Demographics and sex hormone concentrations of study participants by body shape trajectory groups in men (HPFS), postmenopausal (NHS + NHS II) and premenopausal women (NHS + NHS II) (Mean values and standard deviations)
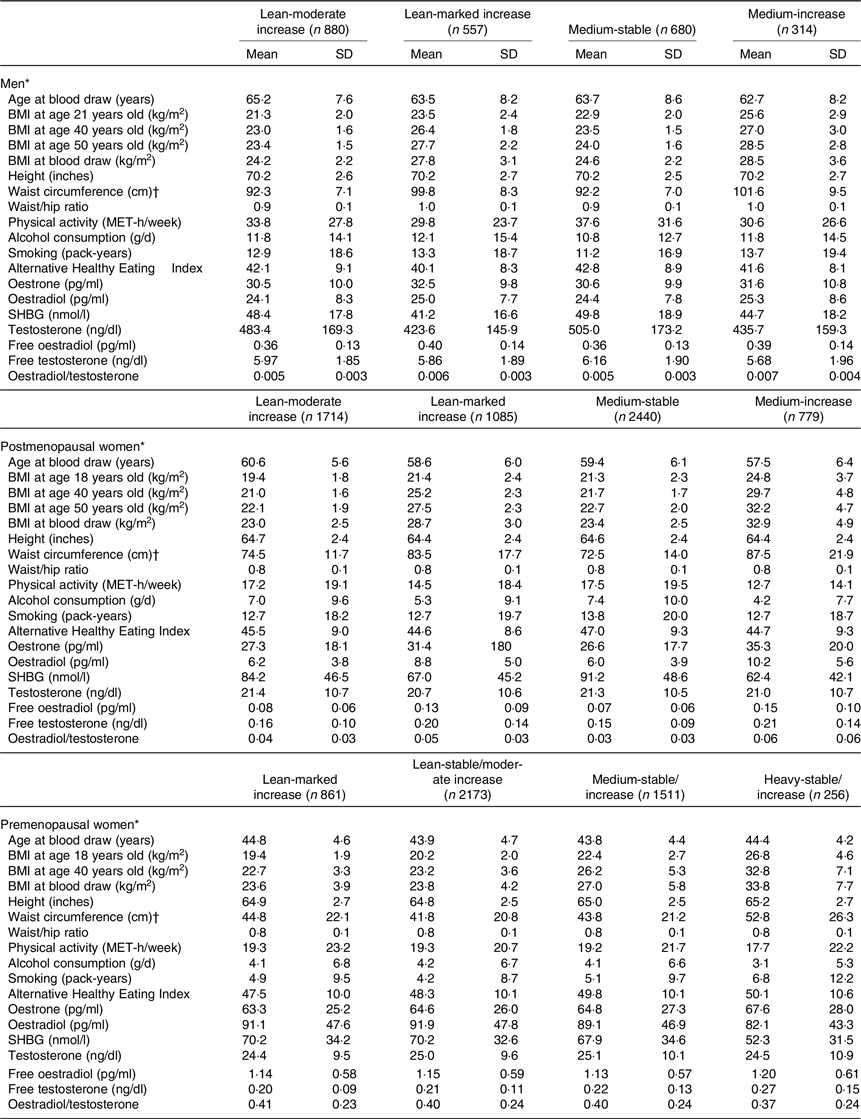
HPFS, Health Professional Follow-Up Study; NHS, Nurse’ Health Study; NHS II, Nurse’ Health Study II; SHBG, sex hormone-binding globulin.
* Men were from the HPFS; post- and premenopausal women were from the NHS and NHS II.
† Waist and hip circumferences were assessed in 1987 in the HPFS, 1986 in the NHS and 1993 in the NHS II.
Table 2 shows the age-adjusted correlation coefficients between adiposity measures and sex hormones. Among men, middle-life BMI (BMI at age 50 years or blood draw) and change in BMI from age 21 years to blood draw were positively associated with E2, free E2 and E2/T (r 0·06–0·38) but negatively associated with SHBG and T (r −0·32 to −0·10). In postmenopausal women, middle-life BMI (BMI at age 50 years or blood draw) and change in BMI from age 18 years to blood draw were positively associated with E1, E2, free E2, free T and E2/T (r 0·22–0·54) but negatively associated with SHBG (r −0·39 to −0·35). In premenopausal women, middle-life BMI (BMI at age 40 years or blood draw) and change in BMI from age 18 years to blood draw were positively associated with free E2 and free T (r 0·11–0·37) but negatively associated with SHBG, E2 and E2/T (r −0·48 to −0·07). In general, there were no strong correlations between early-life BMI (age 5–18 or 21 years) and sex hormones in adult life.
Spearman partial correlation coefficients of oestrone, oestradiol, SHBG, testosterone, free oestradiol, free testosterone and oestradiol/testosterone with body shape and BMI across the lifespan in men (HPFS), postmenopausal (NHS + NHS II) and premenopausal women (NHS + NHS II)†
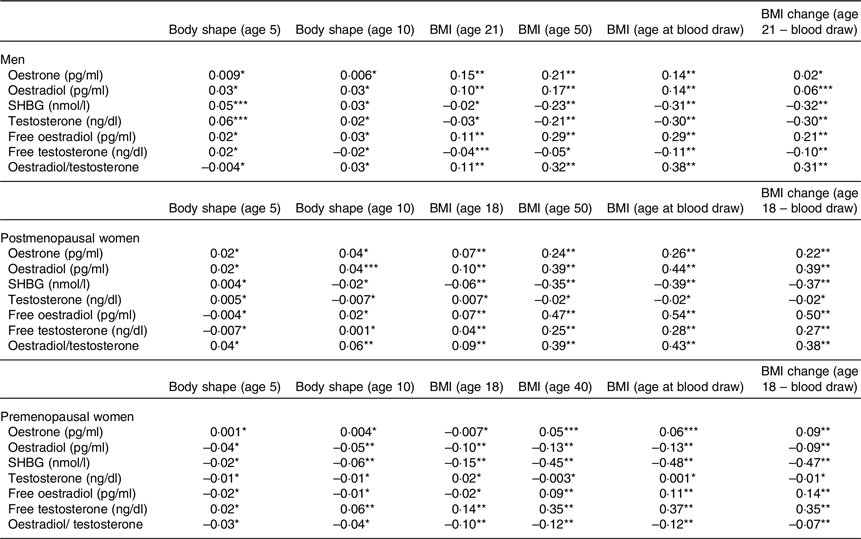
SHBG, sex-hormone binding globulin; HPFS, Health Professional Follow-Up Study; NHS, Nurse’ Health Study; NHS II, Nurse’ Health Study II.
† Partial correlation with adjustment for age at blood draw.
*P ≥ 0·05, **P < 0·001, ***P < 0·05.
Table 3 shows the multivariate-adjusted associations between sex hormone concentrations and the trajectory groups of body shape. Among men and postmenopausal women, we used the medium-stable group as the reference group, and among the premenopausal women, we used the lean-stable/moderate increase group as the reference group. The results are shown as the percentage differences in biomarker levels in the other trajectory groups compared with the reference.
Percentage difference in biomarker levels between the reference group (the medium-stable group in men/postmenopausal women and the lean-stable/moderate group in premenopausal women) and the other trajectory groups in men (HPFS), postmenopausal (NHS + NHS II) and premenopausal women (NHS + NHS II) (95 % confidence intervals)
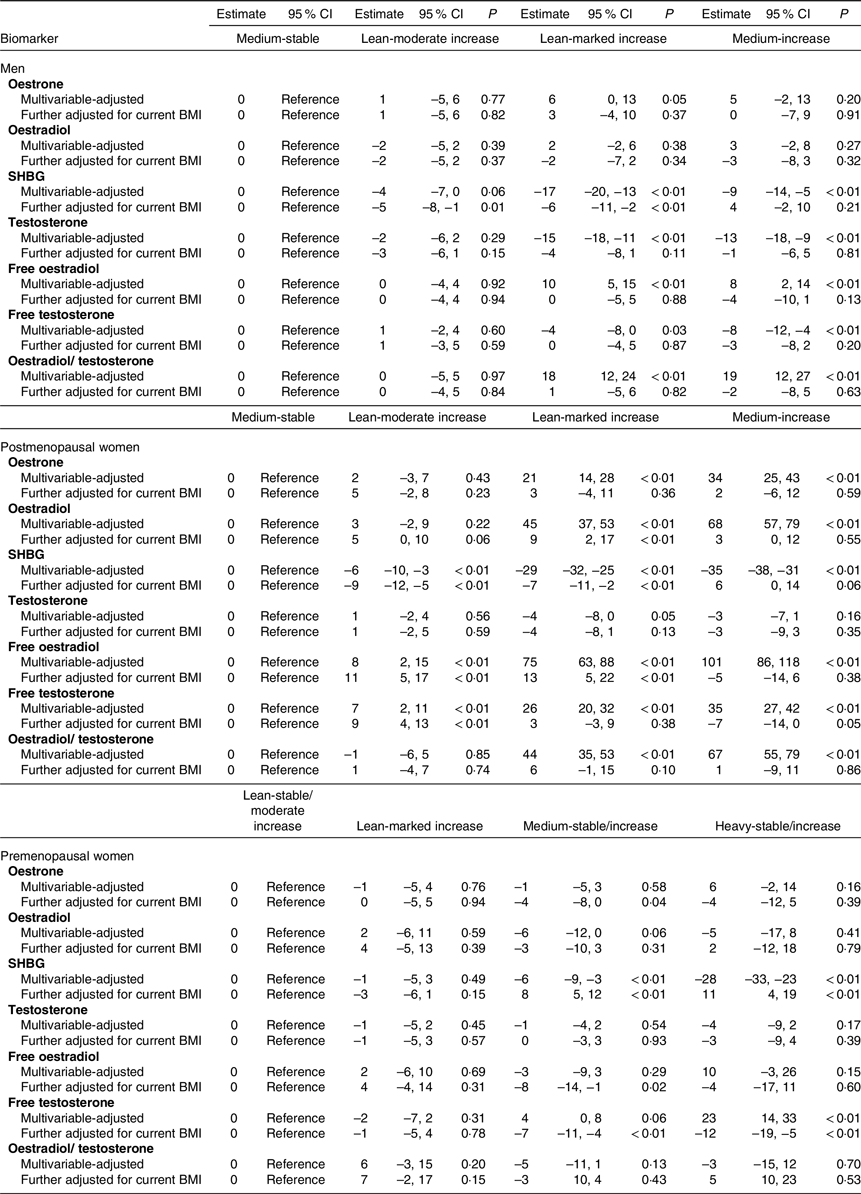
SHBG, sex hormone-binding globulin; HPFS, Health Professional Follow-Up Study; NHS, Nurse’ Health Study; NHS II, Nurse’ Health Study II.
*Multivariate linear regression analyses with covariates adjusted for: age at blood draw, height, race, physical activity, alcohol consumption, smoking, multivitamin use, AHEI dietary score, fasting status, regular aspirin/NSAID use, ever hormone use (women only).
In men, compared with the medium-stable group, the lean-marked increase group had significantly lower SHBG (percentage difference: −17 %; 95 % CI –20 %, −13 %) and lower T levels (–15 %; 95 % CI –18 %, −11 %), and significantly higher free E2 (10 %; 95 % CI 5 %, 15 %) and E2/T ratio (18 %; 95 % CI 12 %, 24 %). In a similar pattern, the medium-increase group also had significantly lower SHBG (–9 %; 95 % CI –14 %, −5 %) and lower T levels (–13 %; 95 % CI –18 %, −9 %), and significantly higher free E2 (8 %; 95 % CI 2 %, 14 %) and E2/T ratio (19 %; 95 % CI 12 %, 27 %). Although both the lean-marked increase and medium-increase groups had lower free T level compared with the medium-stable group, the difference was statistically significant for the medium-increase group only (–8 %; 95 % CI –12 %, −4 %). The above associations between life-course obesity and sex hormone concentrations were hugely attenuated after adjusted for BMI at blood draw. Only significantly lower SHBG was found in the lean-marked increased group when compared with the medium-stable group. By contrast, there were no associations of E1 and E2 with any of the trajectory groups in men.
In postmenopausal women, compared with the medium-stable group, the lean-marked increase group and the medium-increase group had higher E1, E2, free E2, free T and E2/T levels, while SHBG was lower. Most prominently, compared with the medium-stable group, the medium-increase group had higher E1 (percentage difference: 34 %; 95 % CI 25 %, 43 %), E2 (68 %; 95 % CI 57 %, 79 %), free E2 (101 %; 95 % CI 86 %, 118 %), free T (35 %; 95 % CI 27 %, 42 %), E2/T ratio (67 %; 95 % CI 55 %, 79 %) and lower SHBG (–35 %; 95 % CI –38 %, −31 %). These associations were also substantially attenuated after adjusted for BMI at blood draw. Only significantly higher E2 and free E2 and lower SHBG were found in the lean-marked increased group when compared with the medium-stable group. Conversely, no associations between T and trajectory groups were observed.
In premenopausal women, compared with the lean-stable/moderate increase group, significantly lower SHBG level was found in the medium-stable/increase group (percentage difference: −6 %; 95 % CI –9 %, −3 %) and in the heavy-stable/increase group (–28 %; 95 % CI –33 %, −23 %). The free T level was significantly higher in the heavy-stable/increase group (23 %; 95 % CI 14 %, 33 %), compared with the lean-stable/moderate increase group. No associations were found for E1, E2, testosterone, free E2 or E2/T ratio.
In sensitivity analysis among women without a history of hormone therapy use, associations between trajectory groups of body shape and concentrations of sex hormone were similar to that observed for the whole study population of pre- and postmenopausal women (online Supplementary Table S2). However, the use of hormone therapy attenuated the influence of adiposity on the concentrations of E1, E2, free E2, free T and E2/T level among postmenopausal women.
Discussion
Leveraging the life-course adiposity data, we showed that higher attained middle-life adiposity and larger middle-life weight gain were associated with changes in adulthood levels of sex hormones, including higher free E2 and E2/T, and lower SHBG and T in men, higher E1, E2, free E2, free T, and E2/T and lower SHBG in postmenopausal women, and lower SHBG and higher free T in premenopausal women. Among men, both weight gain and attained adiposity appeared to be important for the levels of SHBG, T, free E2 and E2/T, while attained BMI had a stronger association with the level of E1 and E2 than weight changes. The impact of weight change and attained BMI on sex hormones were relatively similar among premenopausal and postmenopausal women, with lower SHBG and higher free T as the predominant findings. For both men and postmenopausal women, after the inclusion of BMI at blood draw, the association between trajectory and sex hormones was diminished, indicating that attained adiposity plays a significant role in the variability in sex hormones, and the differences of attained BMI between groups are extensive. In contrast, for premenopausal women, the associations were not necessarily diminished, indicating that the differences in attained BMI between groups are relatively small. This could be explained by the fact that most men and women gain weight during their middle life.
Continuous life-course analysis is essential to better understand the health effect of adiposity(Reference Song38). Adiposity across the life course has been more strongly associated with disease risk than attained adiposity at a specific time point(Reference Tworoger, Eliassen and Missmer8,Reference Kværner, Hang and Giovannucci16) . An altered sex hormone profile is one of the major pathways underlying the effect of obesity on chronic diseases that normally take years or even decades to develop(Reference Lee, Meyerhardt and Giovannucci3,Reference Zeleniuch-Jacquotte, Shore and Koenig7,Reference McTiernan, Rajan and Tworoger39,Reference Alberg, Gordon and Hoffman40) . Besides, adulthood sex hormones have been suggested to be influenced by both early- and later-life adiposity(Reference Tworoger, Eliassen and Missmer8). However, no study has yet comprehensively assessed the association of adiposity across the lifespan with sex hormone levels.
Our findings are consistent with prior studies. In postmenopausal women, obese women have higher oestrogens than normal-weight women, compatible with the fact that after menopause, primary production of oestrogen occurs in the adipose tissue due to the overexpression of aromatase(Reference Turcato, Zamboni and De Pergola6,Reference Baglietto, English and Hopper22,Reference Bezemer, Rinaldi and Dossus23,Reference McTiernan, Rajan and Tworoger39,Reference Lukanova, Lundin and Zeleniuch-Jacquotte41–Reference McTiernan, Wu and Chen43) . Also, higher BMI is associated with lower SHBG, which leads to higher free T in both premenopausal and postmenopausal women(Reference Turcato, Zamboni and De Pergola6,Reference Bezemer, Rinaldi and Dossus23,Reference McTiernan, Wu and Chen43,Reference Cao, Zhang and Zou44) . The null relation between BMI and free T observed among premenopausal women in a previous study may be due to the small sample size (n 177)(Reference Lukanova, Lundin and Zeleniuch-Jacquotte41). On the other hand, obese men tend to have lower T and SHBG(Reference Glass, Swerdloff and Bray45). As for free T, it depends on the severity of obesity. Moderate obese men did not appear to have significantly altered free T compared with lean men, whereas severely obese men have lower free T, possibly due to the suppression of the hypothalamic-pituitary-testicular axis by adiposity(Reference Fui, Dupuis and Grossmann46).
In light of the remarkable association between sex hormone and the development of cancer and cardiometabolic diseases(Reference Sieri, Krogh and Bolelli47–Reference Peila, Arthur and Rohan51), it is crucial to investigate modifiable factors related to sex hormones, including body fatness, from the public health standpoint. Our study supports the importance of weight management throughout the life cycle for the prevention of cancer and cardiometabolic diseases. It is more achievable to maintain body weight than trying to reduce weight after attaining certain weight for a long time. In addition, our study suggests that both attained body weight and weight change have an impact on sex hormone concentrations. Therefore, it is important for healthcare providers and public health educators to raise awareness of maintaining a healthy body weight throughout life course for homoeostasis of sex hormones.
Our study has several strengths, including the large sample size, comprehensive assessment of sex hormones, detailed adiposity data across the life course and assessment of multiple demographic and lifestyle factors that allowed for rigorous adjustment. Our study also has several limitations. First, we only have one measurement of sex hormones in middle adulthood and are thus unable to assess how changes in adiposity may affect the dynamics of sex hormones over time. Second, the adiposity and covariate data were all self-reported and thus subject to measurement error. However, these data have been validated in our prior studies. Finally, we did not differentiate people with the same BMI but a different fat percentage, nor did we document the fat distribution of the participants.
In conclusion, attained adulthood adiposity and middle-life weight gain were associated with adulthood levels of sex hormones, including lower SHBG, T and free T but higher free E2 and E2/T in men; higher E1, E2, free E2, free T and E2/T but lower SHBG in postmenopausal women, and lower SHBG and higher free T in premenopausal women. Given that both attained body weight and weight change have an impact on sex hormone concentrations, it is important for healthcare providers and public health educators to raise awareness of maintaining a healthy body weight throughout the life course to prevent cancer and cardiometabolic diseases.
Acknowledgements
This work was supported by the NIH (U01 CA186107, P01 CA87969, R01 CA49449, R01 HL034594, R01 HL088521, U01 CA167552, R01 HL35464, U01 CA176726, R01 CA67262 and R00 CA215314). The funders had no roles in designing or conducting the study.
Y. W. C., D. H., A. S. K. and M. S. made a substantial contribution to the design of the study; E. L. G. provided essential materials; Y. W. C., D. H., A. S. K. and M. S. analysed the data; Y. W. C. and M. S. draft the manuscript; Y. W. C., D. H., A. S. K., E. L. G. and M. S. critically revised the article.
All authors have nothing to disclose.
Supplementary material
For supplementary materials referred to in this article, please visit https://doi.org/10.1017/S0007114521001732


