


1. Introduction
Recent advances in high power lasers and their wide applications in bio-photonics, micro-machining, surface patterning, laser surgery, texturing, sensing and military applications[Reference Chichkov, Momma, Nolte, von Alvensleben and Tünnermann1–Reference Dausinger, Hugel and Konov4] call for a flexible and robust means for beam delivery over a metre-long optical path. An ‘ideal’ transport solution for optical pulses requires low propagation loss, low dispersion, high input coupling efficiency, high damage threshold and single-mode guidance over a large optical bandwidth. Optical fibre has considerable and broad potentials in providing flexible laser beam delivery. However, silica-core-based optical fibre suffers from high dispersion, high nonlinearity and low laser-induced damage threshold (LIDT), which has hindered its successful implementation. Indeed, silica-core optical fibre is only capable of nanojoule pulse delivery in the picosecond regime[Reference Smith, Do, Hadley and Farrow5,Reference Ramachandran, Yan, Jasapara, Wisk, Ghalmi, Monberg and Dimarcello6] . Another alternative that has been previously considered is a hollow glass capillary fibre with metal-film-coated inner core and where delivery of femtosecond pulse laser has been demonstrated[Reference Matsuuraa and Miyagi7]. However, due to its large core size, the fibre supports multimode and is mainly utilized for infrared laser delivery (e.g.,  $10~\mathrm{\mu} \mathrm{m} $). Also, the capillary fibre is very sensitive to bending and its outer diameter, which exceeds 1 mm, makes the system not flexible.
The advent of hollow-core photonic crystal fibre (HC-PCF), where the majority of the light is guided through air, stimulated a number of interesting applications including higher power laser beam delivery. The idea of HC-PCF stems from the concept of out-of-plane photonic bandgap guidance (PBG) by Russell[Reference Russell8]. The theoretical demonstration of this concept by Birks et al.[Reference Birks, Roberts, Russell, Atkin and Shepherd9] in 1995 suggested that a new type of optical fibre whose cladding exhibited a two-dimensional periodic array of air holes was possible to guide light in defects with material indices lower than that of the vacuum (i.e., optical guidance in a hollow defect is possible). This led to the experimental demonstration of an HC-PCF by Cregan et al. in 1999[Reference Cregan, Mangan, Knight, Birks, Russell, Roberts and Allan10]. In 2005, the attenuation figure of HC-PCF was reduced to  $1. 2~\mathrm{dB} / \mathrm{km} $ at a wavelength of 1550 nm[Reference Roberts, Couny, Sabert, Mangan, Williams, Farr, Mason, Tomlinson, Birks, Knight and Russell11]. Further improvement in the loss reduction proved difficult due to the roughness of the air/glass interface[Reference Roberts, Couny, Sabert, Mangan, Williams, Farr, Mason, Tomlinson, Birks, Knight and Russell11] inherent to the fibre fabrication technique, and to the presence of the surface mode[Reference West, Smith, Borrelli, Allan and Koch12]. Up to now, the commercially available bandgap HC-PCF shows attenuation figures of
  ${\sim }10$,
  ${\sim }50$ and
  ${\sim }150~\mathrm{dB} / \mathrm{km} $ for optical guidance around 1550 nm,
  $1~\mathrm{\mu} \mathrm{m} $ and 800 nm, respectively[13]. Although these loss figures are too high for long-haul communication, the fact that HC-PCF guides light in air instead of silica opened a great number of applications, including soliton generation[Reference Ouzounov, Ahmad, Müller, Venkataraman, Gallagher, Thomas, Silcox, Koch and Gaeta14], electromagnetically induced transparency[Reference Ghosh, Sharping, Ouzounov and Gaeta15,Reference Benabid, Light, Couny and Russell16] , Raman scattering[Reference Benabid, Knight, Antonopoulos and Russell17,Reference Wang, Couny, Light, Mangan and Benabid18] and pulse delivery[Reference Humbert, Knight, Bouwmans and Russell19], to mention just a few. With the commercialization of HC-PCF and its applications in a wide range of fields, the drawbacks such as its narrow transmission bandwidth, the overlap of the core mode with the silica mode, the parasitic presence of surface modes and the challenges in fibre fabrication were gradually unveiled. Techniques were then concentrated on overcoming these limitations by speeding up the fibre fabrication process[Reference Amezcua-Correa, Gèrôme, Leon-Saval, Broderick, Birks and Knight20], tailoring the core for polarization maintaining[Reference Mangan, Lyngso and Roberts21], removing unwanted surface modes[Reference Amezcua-Correa, Gèrôme, Leon-Saval, Broderick, Birks and Knight20,Reference Wang, Light and Benabid22] and developing double-bandgap HC-PCF for guidance in two spectral ranges[Reference Light, Couny, Wang, Wheeler, Roberts and Benabid23]. However, even though a number of problems have already been conquered, the narrow transmission bandwidth of bandgap HC-PCF (
 ${\sim }70$ THz), which is intrinsically limited by its guidance mechanism, has not been significantly enlarged. This seriously hinders the extension of the application of bandgap HC-PCF to areas requiring large optical bandwidth.
In parallel to the above work on bandgap guiding HC-PCF, another type of HC-PCF, pioneered by Benabid[Reference Benabid24,Reference Benabid and Roberts25] , has attracted a growing interest from both its fundamental guidance standpoint and its potential applications. The optical guidance in this type of HC-PCF, sometimes called Kagome-like HC-PCF, does not rely on the PBG effect but rather on a radically new mechanism called ‘inhibited coupling’ (IC) guidance[Reference Couny, Benabid, Roberts, Light and Raymer26]. Kagome-lattice HC-PCF, first reported in 2002 by Benabid et al.[Reference Benabid, Knight, Antonopoulos and Russell17], is an example of such a fibre. At the birth of this fibre, its guidance mechanism was not well understood, which hindered further advances in terms of its propagation loss and transmission bandwidth. Since 2006, Kagome-type HC-PCF has experienced a strong development in both experimental fabrication[Reference Couny, Benabid, Roberts, Light and Raymer26–Reference Couny, Roberts, Birks and Benabid28] and physical understanding[Reference Argyros and Pla29,Reference Pearce, Wiederhecker, Poulton, Burger and Russell30] . It was shown that this type of fibre favours a large pitch and guides via inhibited coupling between the core modes and the cladding modes. A salient feature of this type of HC-PCF is its broad transmission window in comparison with bandgap HC-PCF. However, conventional Kagome HC-PCF exhibits a relatively high loss figure (slightly less than  $1~\mathrm{dB} / \mathrm{m} $). In 2011, a new avenue[Reference Wang, Wheeler, Couny, Roberts and Benabid31] was explored by shaping the core-surround structure from a circle (or polygon) to a hypocycloid in order to enhance the coupling inhibition at the interface of the core and the cladding. Such hypocycloid-core Kagome HC-PCF fibre shows an attenuation figure of 30–
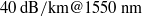 $40~\mathrm{dB} / \mathrm{km} @ 1550~\mathrm{nm} $[Reference Wang, Peng, Alharbi, Fourcade Dutin, Bradley, Gérôme, Mielke, Booth and Benabid32,Reference Nampoothiri, Jones, Fourcade-Dutin, Mao, Dadashzadeh, Baumgart, Wang, Alharbi, Bradley, Campbell, Benabid, Washburn, Corwin and Rudolph33] and
 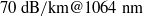 $70~\mathrm{dB} / \mathrm{km} @ 1064~\mathrm{nm} $[Reference Bradley, Wang, Alharbi, Fourcade-Dutin, Mangan, Wheeler and Benabid34] and maintains a large transmission window around 200 THz. This result beats the conventional circle-core Kagome fibre in terms of optical attenuation and bandgap HC-PCF in transmission bandwidth. Crucially for high laser power transportation applications, the enhancement of IC not only reduces the optical propagation loss but also the optical power overlap with the silica core-surround.
Both bandgap HC-PCF and Kagome HC-PCF have been used for high power laser beam delivery. Using bandgap HC-PCF, nanosecond[Reference Shephard, Jones, Hand, Bouwmans, Knight, Russell and Mangan35] pulses with energy of  ${\sim }0. 37$ mJ at 1064 nm were delivered in 2004. For sub-picosecond pulses, the maximum delivered pulse energy was
  $7~\mathrm{\mu} \mathrm{J} $ at 1550 nm in 2011[Reference Peng, Mielke and Booth36]. The limit of bandgap HC-PCF in transporting high energy pulses lies in the relatively small core diameter (10–
 $20~\mathrm{\mu} \mathrm{m} $) and the strong overlap of the air core mode with the silica core-surround. Kagome HC-PCF overcomes these problems by providing a large air core and much less energy coupling to the silica core-surround. Indeed, up to
  $10~\mathrm{\mu} \mathrm{J} $ femtosecond pulses have already been delivered using conventional Kagome HC-PCF[Reference Heckl, Baer, Kränkel, Marchese, Schapper, Holler, Südmeyer, Robinson, Tisch, Couny, Light, Benabid and Keller37]. The newly developed hypocycloid-core Kagome HC-PCF, which will be discussed below, increased this number to one order of magnitude higher.
In this paper, we review the advances of HC-PCF and its application in high power laser beam delivery. In Section 2, we compare the two types of HC-PCF by analysing their guidance mechanisms, cross-section geometry, transmission band, attenuation figure, dispersion and mode overlap with silica. Advantageous properties of hypocycloid-core Kagome HC-PCF are elaborated in the viewpoint of an ideal host for high power beam delivery. In Sections 3 and 4, three practical examples of high power beam delivery based on Kagome HC-PCF are presented: a fibre delivery of a 4 mJ energy and ns duration pulse for spark ignition; a fibre delivery of temporal distortion-free of  ${\sim }100~\mathrm{\mu} \mathrm{J} $ sub-ps pulse; and its compression to
  ${\sim }300$ fs.
2. Hollow-core photonic crystal fibre
Guidance mechanism
HC-PCF can guide either by a photonic bandgap or, in the absence of a bandgap, via inhibited coupling between the core-guided modes and modes associated with the cladding[Reference Couny, Benabid, Roberts, Light and Raymer26]. Bandgap guidance mechanism has been well explained by several intuitive pictures such as the ‘Anti-Resonant Reflective Optical Waveguides (ARROW)’ model[Reference Litchinitser, Dunn, Usner, Eggleton, white, McPhedran and de Sterke38], ‘cellular method’[Reference Birks, Pearce and Bird39] and the ‘tight binding model’[Reference Couny, Benabid, Roberts, Burnett and Maier40]. The formation of the bandgap depends strongly on the periodic anti-resonant high index rods, so called ‘apexes’ in a low-index background. However, in HC-PCF, where the low-index background is air, silica apexes are compromised by the necessary presence of connecting glass struts to form a realistic structure. The glass struts act as distinct wave-guiding features that tend to narrow the bandgaps via the coupling between the modes from the apexes and the struts. The tight binding model showed that the coupling between the modes from the cladding structure apex, strut and air holes limit the bandgap range to about 40% of the bandgap central frequency[Reference Couny, Benabid, Roberts, Burnett and Maier40].
The limitation of bandgap HC-PCF renewed the interest in IC guiding HC-PCF which is proved to provide broadband guidance. The strategy behind the design of broadband guiding fibres is, in many respects, opposite to that adopted for bandgap fibres. The broadband guiding fibre designs require that the glass apexes are maintained small, since these could support ‘low azimuthal’ number modes near the air lightline, which could couple to the core modes. Furthermore, larger apexes result in a reduction of the strut length, which hence reduces the azimuthal number of the strut supported modes. The Kagome-type structure is such that it entails a connected network of nearly constant thickness glass struts. Modes in the glass struts are with the fast oscillating transverse field, which results in a strong transverse wave-vector component mismatch with the core modes which possess a slowly varying phase distribution. The coupling between core and cladding modes is thus ‘inhibited’, and light is guided in the air core with relatively low loss over the large spectral region of inhibition. For a detailed understanding of bandgap guidance and inhibited coupling guidance, readers are directed to[Reference Benabid and Roberts25]. Here, we compare their density of photonic state plots to give some illustrative insights into their differences in guidance.
The density of photonic states (DOPS) is, by definition, the number of allowed electromagnetic modes per unit frequency interval and propagation constant interval-unit. In a photonic crystal fibre field, the DOPS is typically plotted against both the normalized frequency ( $k\Lambda )$ and normalized wave-vector component along the propagation direction
  $(\beta \Lambda )$ or the effective refractive index
  $({n}_{eff} )$ of a given perfect photonic structure (i.e., with no core defect). Here, parameters are normalized by multiplying them with the pitch
  $\Lambda $ (the spatial period of the photonic structure). The DOPS is also a mapping of the solutions of the propagation equation and shows all modes supported in the periodic structure. It also indicates clearly the regions for which there are no solutions to the equation (i.e., no light can be guided in any constituent of the structure at the associated pair of
  $k\Lambda $ and
  $\beta \Lambda $). Figure 1(a) shows the calculated DOPS diagram of bandgap HC-PCF using the plane wave approach[Reference Johnson and Joannopoulos41] for an infinite triangular cladding structure. In the DOPS map presented here, the DOPS is represented as a colour-scale ranging from blue for low allowed DOPS to red for a maximum DOPS indicated by the density legend in Figure 1. The white coloured regions correspond to
  $\mathrm{DOPS} = 0$, and presents to the pair
  $k\Lambda $–
 $\beta \Lambda $ for which there is no solution to the propagation equation and therefore where the photonic bandgap lies. For guidance to be achieved in a hollow core, the core modes need to lie within the white region of the PBG that is under the vacuum line (refractive index of the air) as plotted with a dash–dotted line in Figure 1(a). However, when the core mode arrives at the edge of the PBG, strong coupling is achieved between the core and the cladding mode, due to the very large overlap integral between them. This leads to energy transfer from the core to the cladding mode and ultimately to an increase of the core mode propagation loss at the edge of the bandgap. The bandwidth for bandgap HC-PCF is thus limited.
The DOPS of the Kagome cladding structure is shown in Figure 1(b). Note that the Kagome fibre operates for much larger  $k\Lambda $ (
 $k\Lambda \sim 100$) compared to the bandgap fibre (
 $k\Lambda \sim 15$). The Kagome lattice exhibits no bandgap but two low DOPS regions airline: region I extending from
  $k\Lambda = 20$ to
  ${\sim }60$ and region III (for
  $k\Lambda = 80$–140) with a high DOPS region in between (for
  $k\Lambda = 60{\unicode{x2013}}80$)[Reference Couny, Benabid, Roberts, Light and Raymer26]. For the low DOPS region of the cladding structure corresponding to high transmission bands in the core (regions I and III), as predicted by the inhibited coupling theory, the core mode is strongly located in the air core with a slowly varying phase distribution (i.e.,
  ${\mathrm{HE} }_{11} $-like mode). The cladding modes with the same
  $k\Lambda $ and
  ${n}_{eff} $ (
 ${\lt }1{0}^{- 5} $ difference with that of the core mode) are strongly localized in the silica struts with rapid field decay into the air region. Moreover, the cladding modes in these regions exhibit fast phase oscillation of the field in glass, a manifestation of modes with very high transverse (e.g., azimuthal) mode number. By virtue of symmetry, the overlap integral between the low azimuthal number core modes and these cladding modes is strongly attenuated; in other words, their coupling is inhibited. In region II, core modes exhibit high loss associated with glass resonances that involve slow variation of the transverse phase around each hole periphery, and hence stronger interaction between the cladding hole modes and glass strut modes. A full explanation can be found in[Reference Couny, Benabid, Roberts, Light and Raymer26] that likened the guidance mechanism to the Von-Neumann Wigner bound state in a continuum from quantum physics.
(a) Top left: scanning electron micrograph of a triangular HC-PCF. Bottom left: near-field profile of the fundamental ( ${\mathrm{HE} }_{11} $ like) air guided core mode lying within a bandgap (Centre). Right: band diagram showing the presence of the PBG. (b) Same as (a) but for Kagome-lattice HC-PCF. The fundamental mode lies within a continuum of cladding modes and the band diagram does not exhibit a PBG.

Fabrication technique
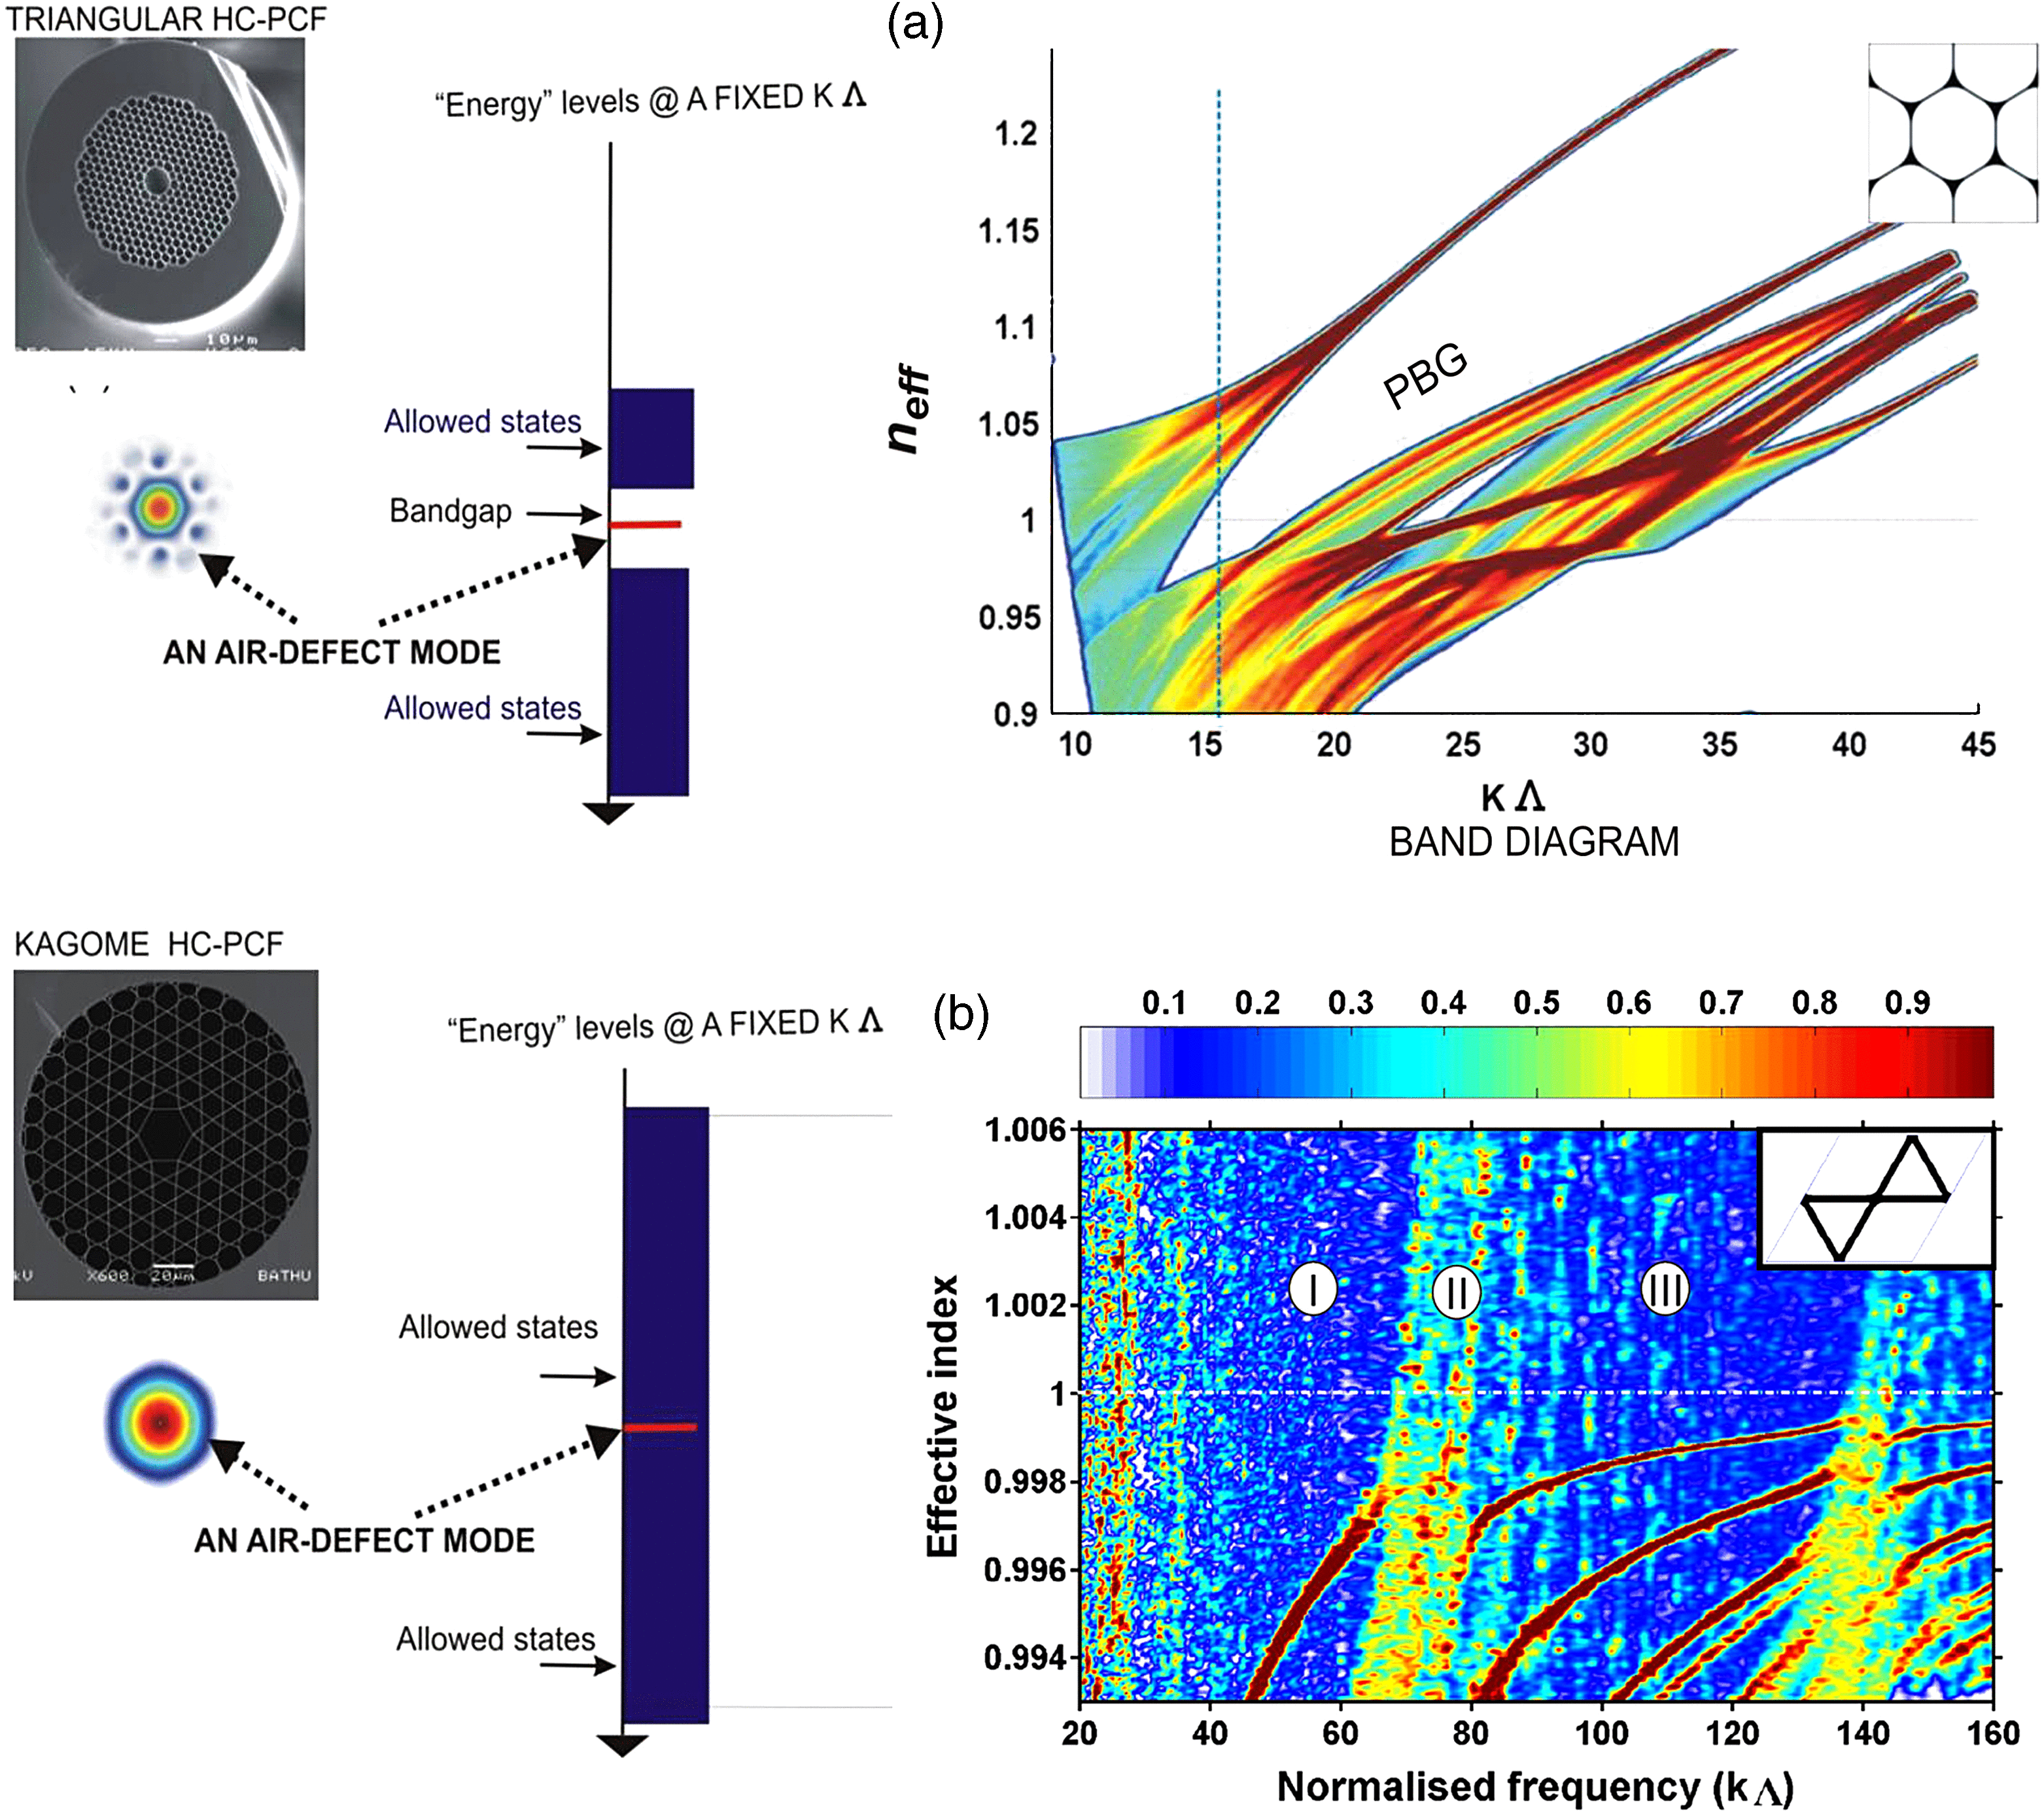
The stack-and-draw technique is widely used for fabricating silica-based PCF[Reference Knight, Birks, Russell and Atkin42].The main idea is to start with a large-scale version of the structure and then stretch it to a final fibre. Dozens of capillaries (Figure 2(a)) drawn using a conventional optical fibre drawing tower are stacked one-by-one on a specially designed stacking rig to form a hexagonal structure. Several central capillaries are replaced by a large core capillary to form the core defect (Figure 2(b)). The stack is then inserted into a jacketing tube with some ‘packing’ ones added to fill the gaps between the stack and the jacketing tube. The drawing of the stack to fibre is done in two stages. First, the stack is drawn into canes (Figure 2(c)), and then the cane is drawn into fibre (Figure 2(d)). This is because the overall draw-down ratio from the stack to the fibre is large; therefore, the process is difficult to control in one single step. The use of this intermediate stage also gives more opportunities in fibre design. When drawing fibres, different pressures may be applied to the core and cladding regions to control the air-filling fraction of the fibre and to ensure that the structure is not deformed.
An overview of the entire stack-and-draw technique: (a) drawing of capillaries; (b) capillaries are stacked and inserted into a larger tube; (c) the jacketed stack is drawn to smaller canes; and (d) the jacketed canes is drawn into fibre.
Bandgap HC-PCF
Figure 2 shows the main idea of fabricating PCF. In a real fabrication process, slightly different techniques are utilized in drawing different types of HC-PCF. For bandgap HC-PCF, in the stacking process of Figure 2(b), small rods are usually inserted in the gaps between neighbouring capillaries[Reference Roberts, Couny, Sabert, Mangan, Williams, Farr, Mason, Tomlinson, Birks, Knight and Russell11]. This is done so as to increase the size of the apexes of the fabricated fibre since they are important for the fundamental bandgap. In 2008, Correa et al.[Reference Amezcua-Correa, Gèrôme, Leon-Saval, Broderick, Birks and Knight20] reported an alternative method without interstitial rods being introduced. Thicker capillaries are used in the stacking process and very high pressure is applied to inflate the capillaries in the cane-to-fibre process (Figure 2(d)). This results in the formation of very thin struts and relatively wide apexes. The resulting fibre has similar optical properties to traditional bandgap fibre. In 2009, Light et al.[Reference Light, Couny, Wang, Wheeler, Roberts and Benabid23] found that the reduced apex size in the new fabrication technique could open a second bandgap and thus offer another degree of freedom in the control of bandgap range. Below, we describe this double-bandgap HC-PCF to show optical properties of current bandgap HC-PCF.
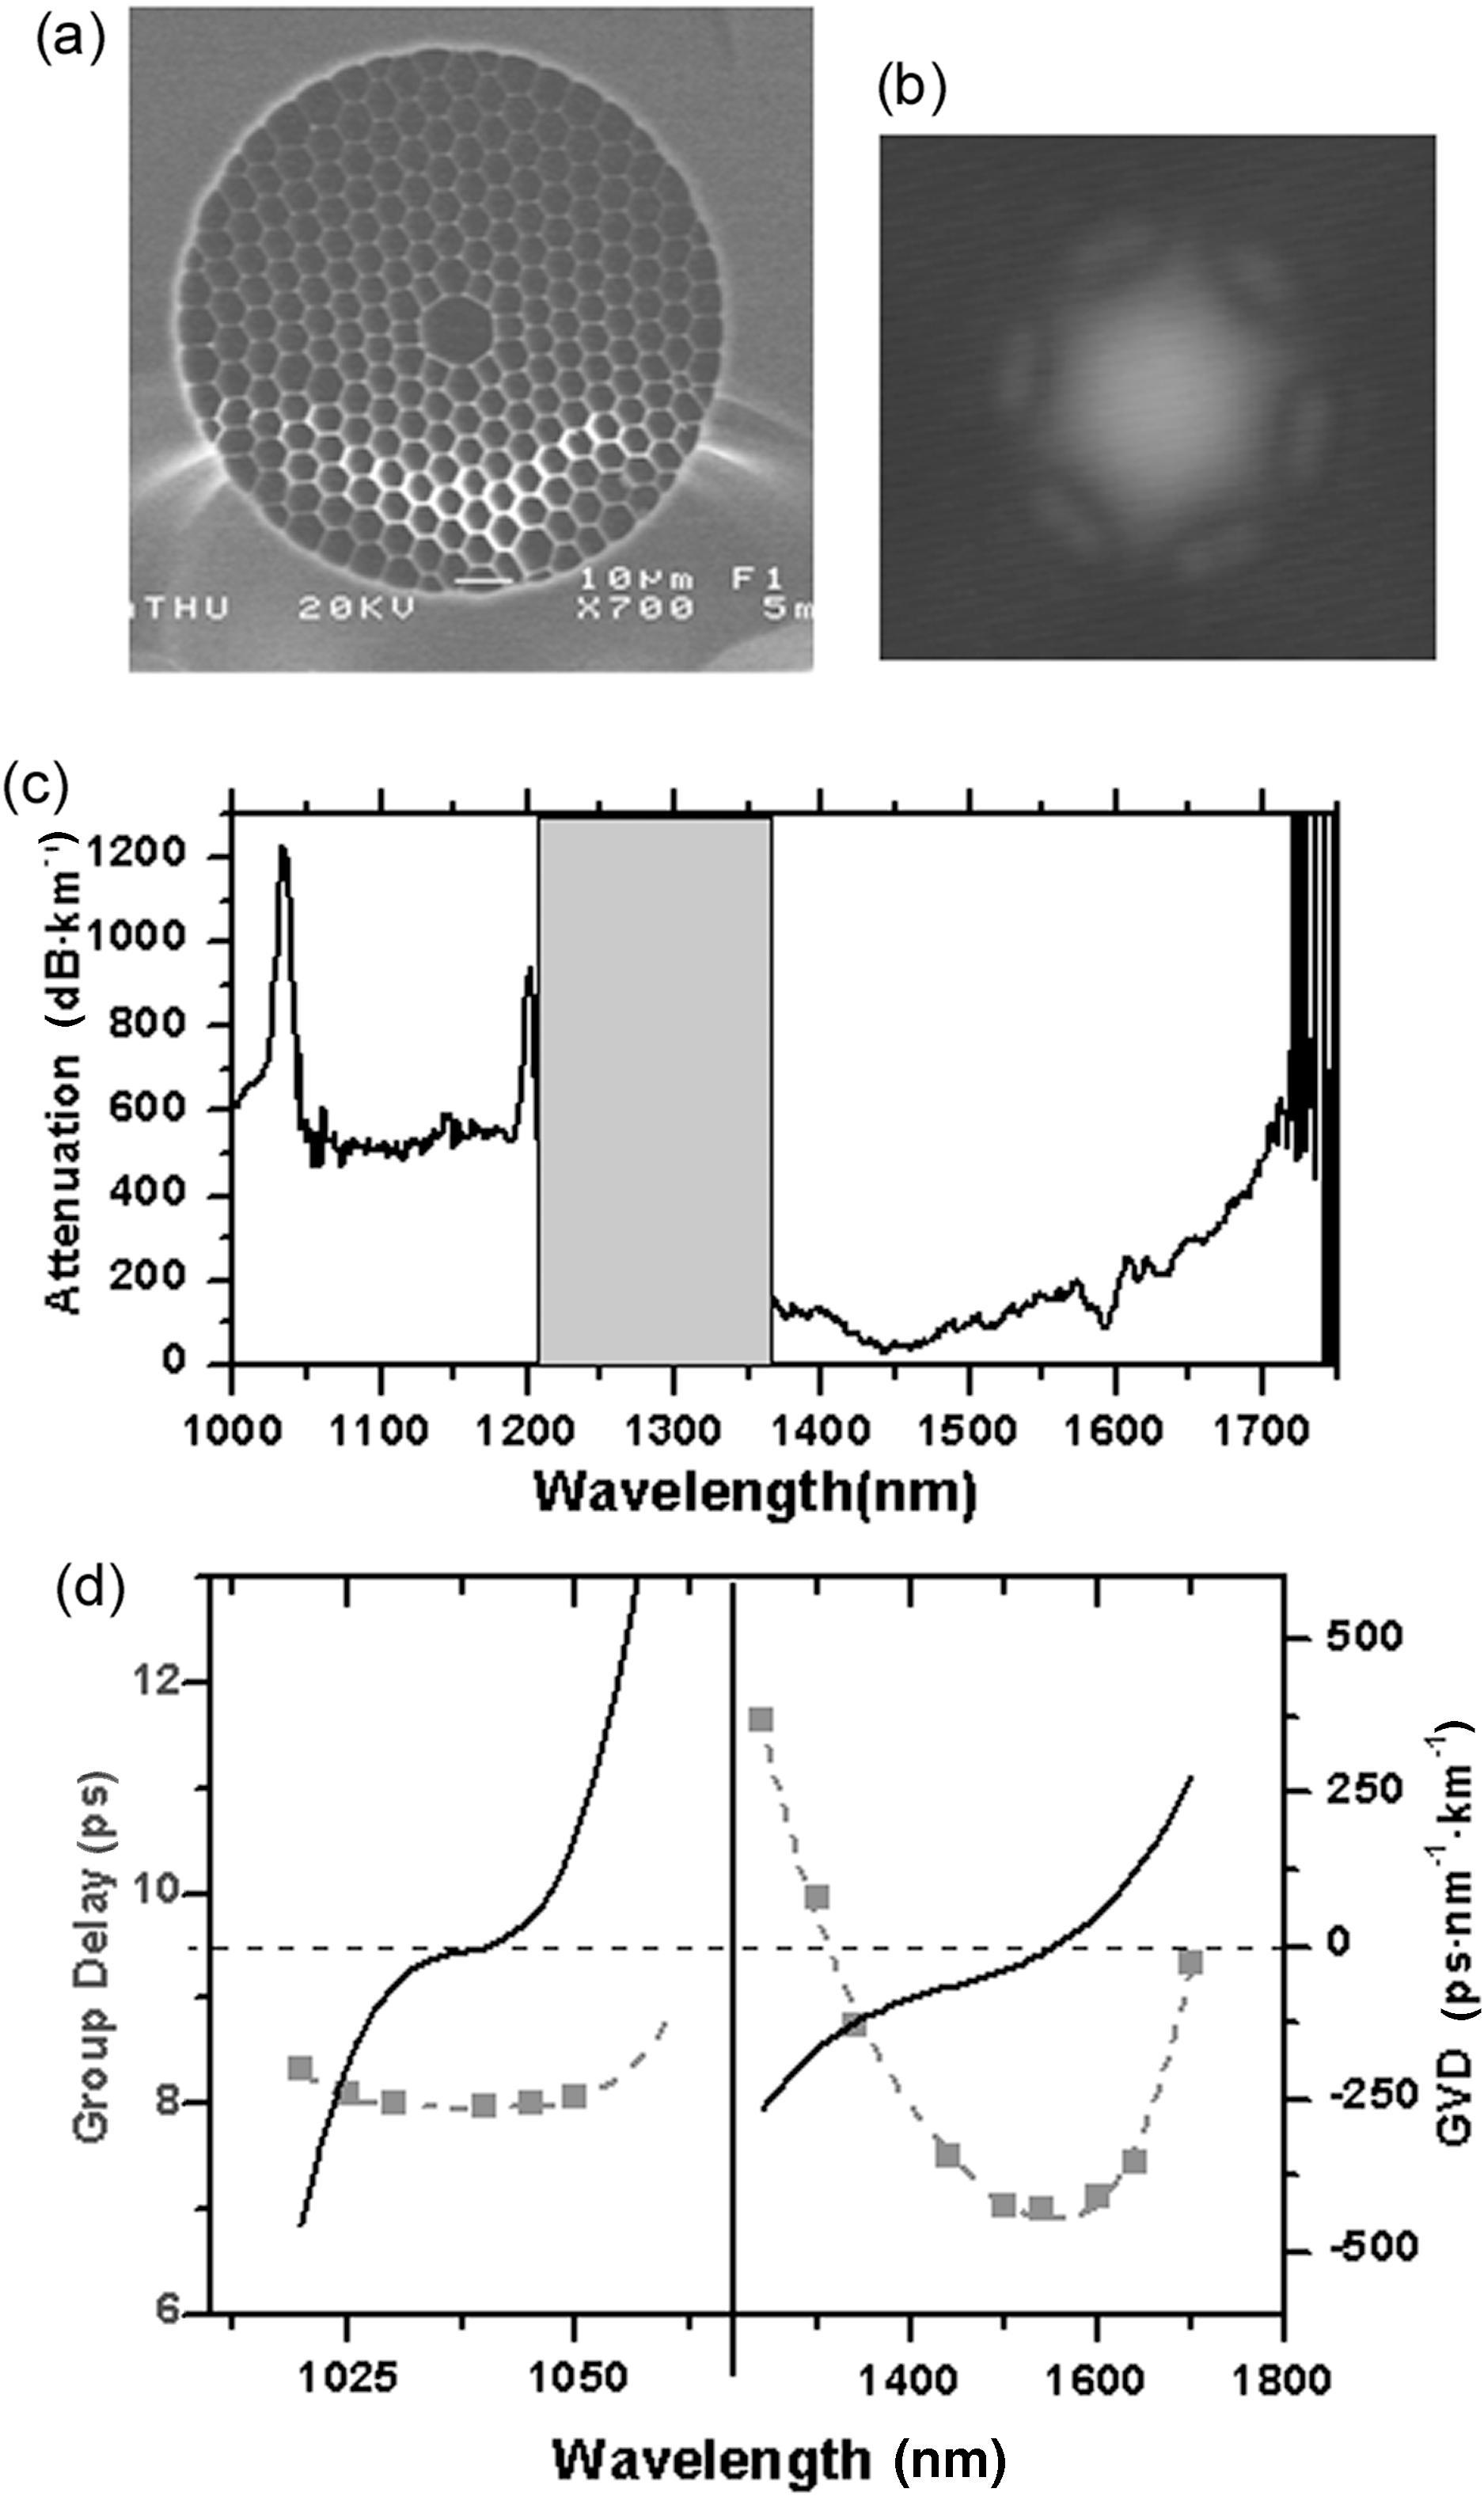
Figure 3(a) shows a scanning electron microscope (SEM) image of the cross-section of a double-bandgap HC-PCF. Bandgap HC-PCF usually has a triangular lattice cladding structure with 7–8 rings to minimize the confinement loss. The fabricated fibre has a pitch of around  $6~\mathrm{\mu} \mathrm{m} $, a core of
  $18~\mathrm{\mu} \mathrm{m} $ and an air-filling fraction (AFF) of
  ${\sim }97\% $. This size is much larger than those fabricated with old technique (inserting interstitial rods) which usually has a pitch of
  $2~\mathrm{\mu} \mathrm{m} $, a core of
  $10~\mathrm{\mu} \mathrm{m} $ and an AFF of
  ${\sim }93\% $. Figure 3(c) shows the measured attenuation spectrum of the fibre from a cut-back measurement from 25 to 5 m. The first bandgap centres at
  ${\sim }1515$ nm and covers from 1335 nm to above 1750 nm (detection limit of the OSA), showing an attenuation figure of
  ${\sim }80~\mathrm{dB} / \mathrm{km} $. This is relatively high compared to the conventional bandgap fibre due to the nonuniformity of the cladding (a typical value for bandgap HC-PCF is below
  $10~\mathrm{dB} / \mathrm{km} $). The second bandgap centres at
  ${\sim }1100$ nm and covers from 1080 to 1140 nm. This shows a loss of
  ${\sim }500~\mathrm{dB} / \mathrm{km} $. Both of these loss figures can be significantly reduced by optimized control of pressurization during the fibre drawing process.
Because of the relatively small core size, bandgap HC-PCF is apt to guide light in its fundamental mode. Figure 3(b) shows a typical near-field image of the guided mode in the transmission band. From this image, it is found that the guided mode has some fraction overlapping with the silica structures. Furthermore, for bandgap HC-PCF, this overlap is exacerbated by the problem of surface mode couplings. An attempt to reduce the surface modes in these fibres has been reported in Ref. [Reference Amezcua-Correa, Gèrôme, Leon-Saval, Broderick, Birks and Knight20]. However, there is no significant impact on the reduction of the core mode overlap with silica, and this remains a significant drawback for high power beam delivery since it lowers the laser-induced damage threshold.
In Figure 3(d) we also find the typical S shape of the dispersion of bandgap HC-PCF, with large normal dispersion near the short wavelength edge of each bandgap and large anomalous dispersion towards the high wavelength edge (Figure 4(d)). The dispersion in the transmission band is of the order of 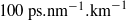 $100~\mathrm{ps} . {\mathrm{nm} }^{- 1} . {\mathrm{km} }^{- 1} $. This will cause substantial temporal spreads for sub-ps pulses after propagation over a few metres.
(a) SEM image of the fabricated double-bandgap HC-PCF. (b) Near-field mode in the guided band. (c) Attenuation spectrum of the fibre showing two bandgaps. (d) Measured group delay (squares), and dispersion (solid lines) calculated based on a fourth-order polynomial fit to group delay data (dashed lines) at the second bandgap and the first bandgap[Reference Light, Couny, Wang, Wheeler, Roberts and Benabid23].
Conventional Kagome HC-PCF
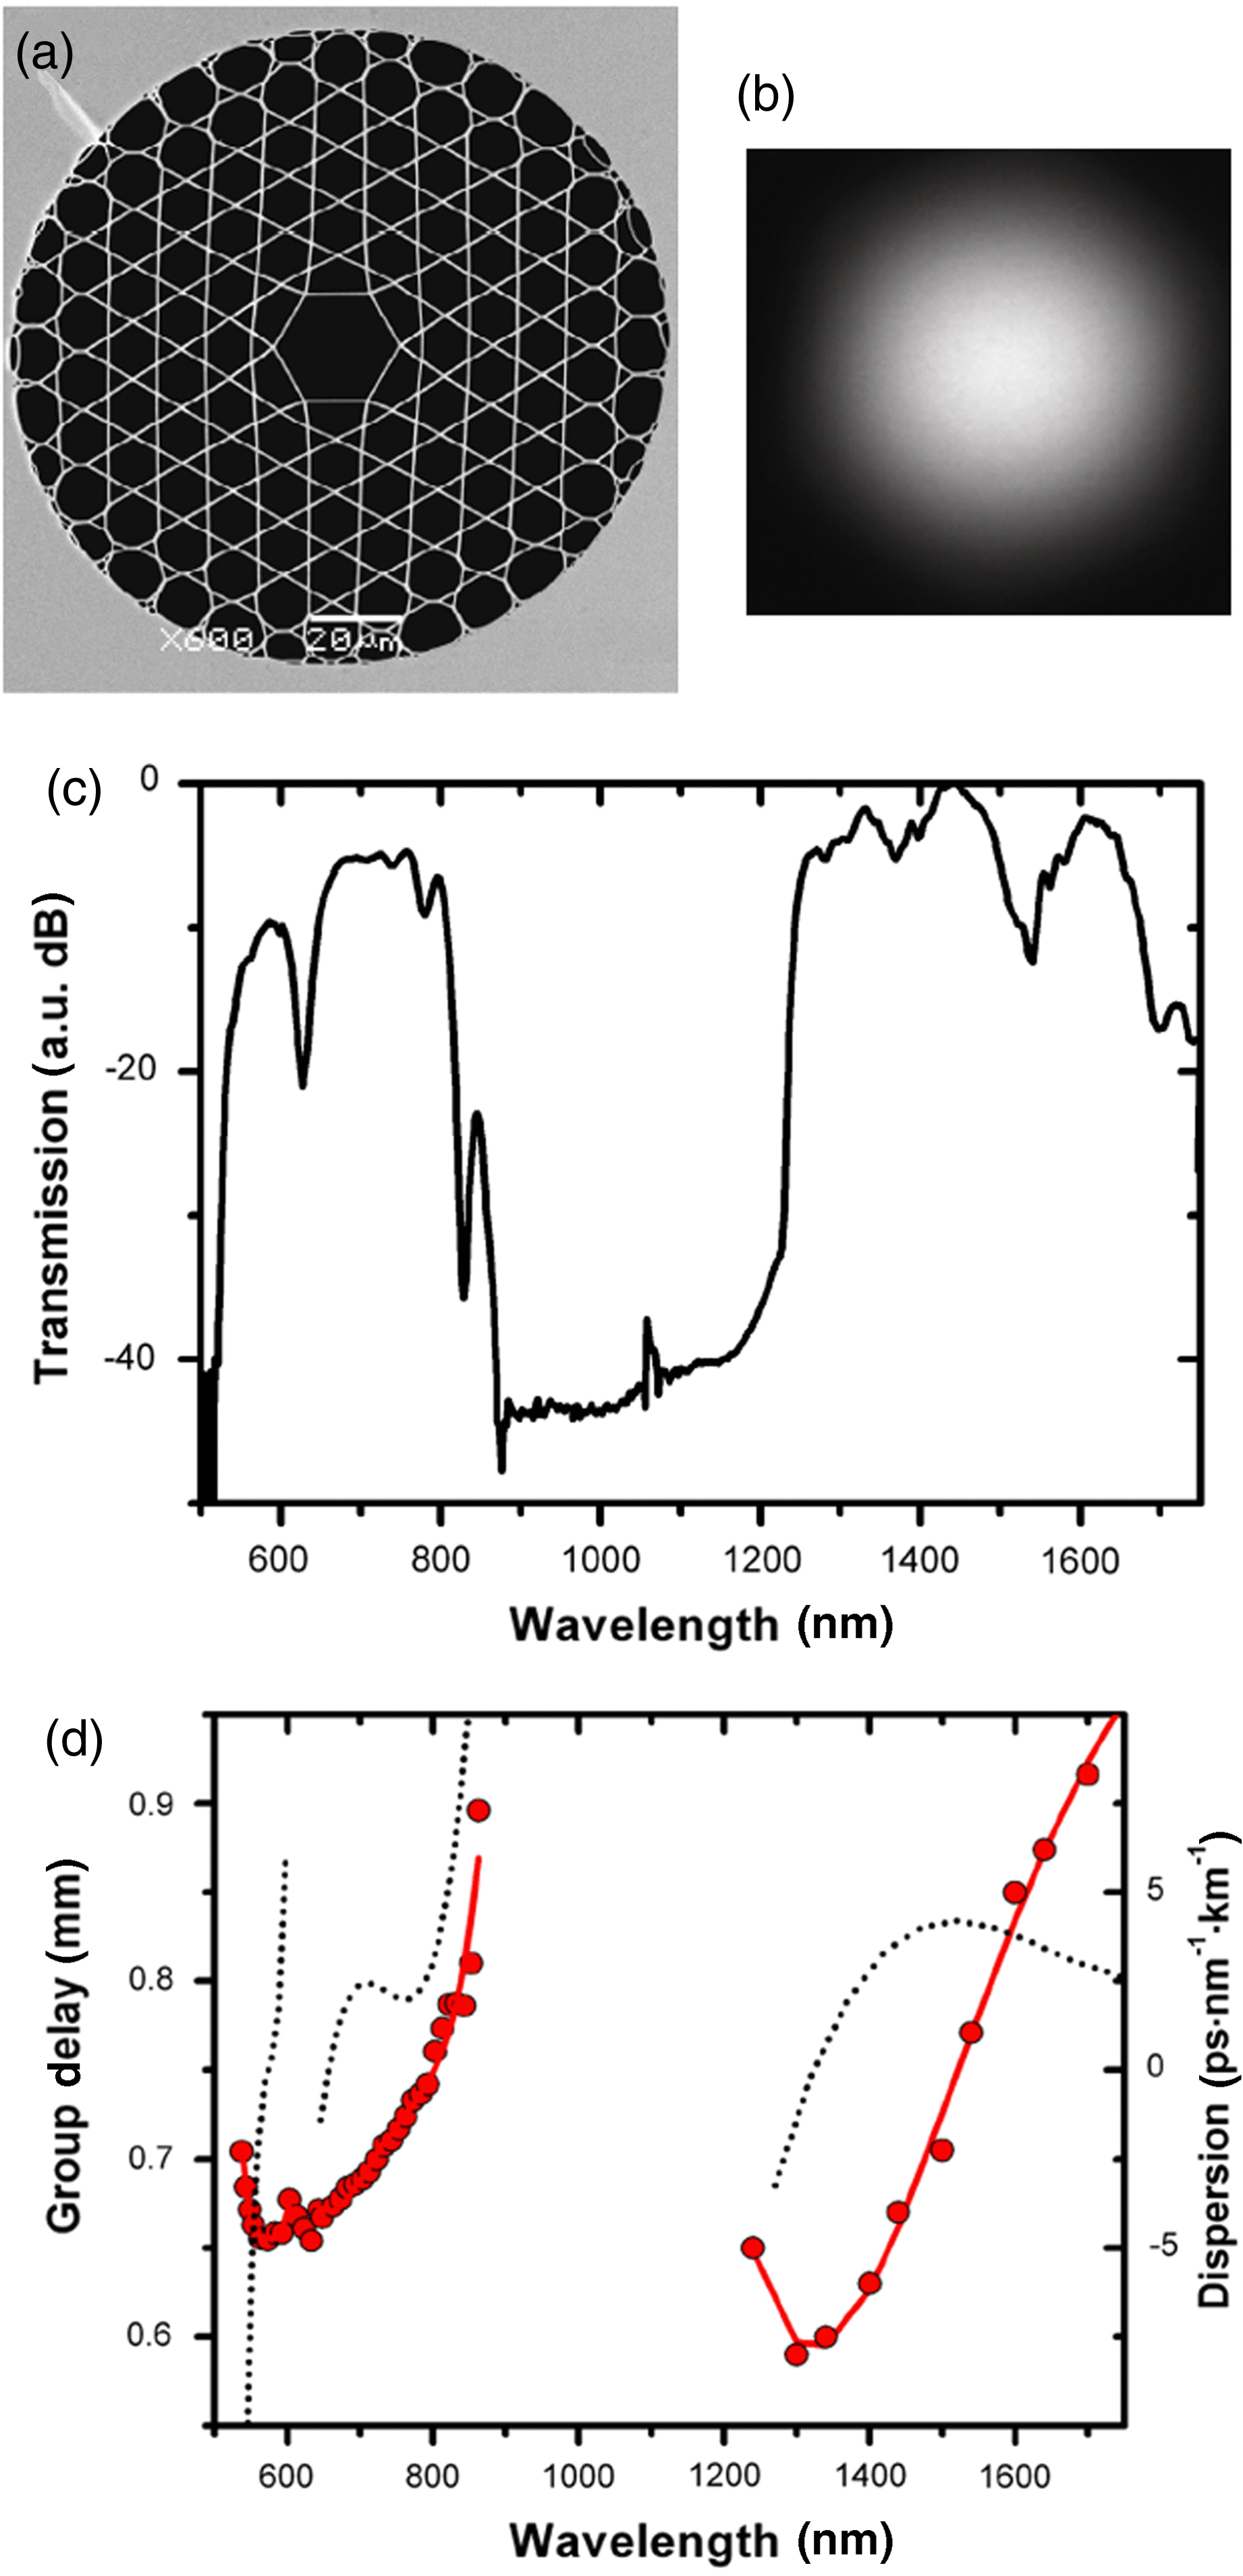
The fabrication of Kagome-type HC-PCF follows the same stack–draw process as bandgap HC-PCF. Subtle differences, however, have to be observed during the draw process so as to avoid the collapse of interstitial holes between the capillaries and to subsequently obtain the Kagome geometrical arrangement. Figure 4(a) shows an SEM image of a typical one-cell Kagome HC-PCF. As opposed to the triangular bandgap HC-PCF (Figure 3(a)), the structure is formed by a pattern of tessellated ‘stars of David’. Indeed, the word ‘Kagome’ comes from the Japanese word for ‘bamboo basket’. In addition, for the Kagome HC-PCF, it is estimated that three rings of cladding holes are sufficient for efficient light guidance and adding cladding rings has no merit in terms of optical attenuation properties except reducing the bending loss. This is completely different from bandgap HC-PCF, where at least eight rings of cladding holes are needed, due to the completely different guidance mechanism.
The one-cell six-ring Kagome HC-PCF in Figure 4(a) has a pitch of  $12~\mathrm{\mu} \mathrm{m} $ and a core of
  $25~\mathrm{\mu} \mathrm{m} $[Reference Benabid24]. The fibres guide over a broad bandwidth from 500 to 850 nm and from 1200 to 1750 nm. These two bands correspond to the I and III bands in the DOPS map in Figure 1(b). The band sandwiched in between is the low transmission band II in Figure 1(b). By thinning the silica struts, it is possible to narrow band II and widen bands I and III as reported in Ref. [Reference Couny, Benabid, Roberts, Light and Raymer26].The fibre exhibits a loss figure of
  ${\sim }1~\mathrm{dB} ~{\mathrm{m} }^{- 1} $. Due to the larger core size, the fibre can accommodate some higher-order modes. However, by carefully adjusting the launching condition, it is possible to excite only the fundamental modes (Figure 4(b)). Unlike core modes in bandgap HC-PCF, this fundamental mode is extremely well confined in the core with no light detected in the silica core-surround. This has been well explained by the ‘inhibited coupling’ mechanism: the coupling of the core mode with the silica mode produces the low transmission band (900–1200 nm here) and is inhibited in the high transmission band. Thus the core mode exhibits a low power-in-glass fraction. The extinction ratio between the intensity in the air core and the silica core-surround is more than 30 dB for Kagome HC-PCF while it is
  ${\sim }20$ dB for bandgap HC-PCF.
(a) SEM image of the fabricated one-cell Kagome HC-PCF. (b) Near-field mode in the guided band. (c) Transmission spectrum of the fibre showing broad band guidance. (d) Measured group delay (red dots), and dispersion (black dotted line) calculated based on fourth-order polynomial fit to group delay data[Reference Benabid24].
The low power-in-glass fraction also leads to a reduced chromatic dispersion. Figure 4(d) presents the measured group delay and the inferred chromatic dispersion of the fundamental mode of a 90 cm long fibre. The dispersion has the typical tilted, flattened S shape of a bandgap fibre, but the average figure throughout the whole transmission region of less than 5  $\mathrm{ps} {\cdot }{\mathrm{nm} }^{- 1} {\cdot }{\mathrm{km} }^{- 1} $ is about 20 times lower than photonic bandgap HC-PCF’s dispersion, except close to the low transmission regions. The measured dispersion further confirms the very low light-in-glass fraction of the fundamental mode and its exceptionally low coupling interaction with other cladding modes.
Hypocycloid-core Kagome HC-PCF
The above-described two types of HC-PCF, one with narrow transmission bandwidth and the other with high optical attenuation, have impeded many applications. There is always a desire for one piece of HC-PCF overcoming both drawbacks. However, in the bandgap HC-PCF structure, unless one adopts a very low-index material replacing silica, it is almost impossible to contemplate a significant increase of bandwidth because of the intrinsic dispersive properties of the DOPS of the silica cladding. On the other hand, in the context of Kagome-type HC-PCF, although its propagation loss is still higher than that of bandgap HC-PCF, the record of the attenuation figure keeps being broken. In fact, since the first invention of Kagome HC-PCF, great efforts have been made to minimize this figure. Fabrication attempts include thinning cladding glass webs down to  ${\sim }200$ nm[Reference Couny, Benabid, Roberts, Light and Raymer26], constructing large pitch fibre[Reference Couny, Benabid and Light27], and altering the cladding geometry to that of a square lattice[Reference Couny, Roberts, Birks and Benabid28]. After all these optimizations to the cladding geometry, the optical attenuation figure over large bandwidth stayed above 0.5 dB/m. A big limitation in the fabrication is that introducing core defects into PCF cladding will lead to a mismatch between the core-surround and the cladding in terms of their geometrical symmetry. Given the fact that most of the core-cladding field overlap occurs at the core-surround region, the twisted shape of the core-surround will strongly influence the light leakage from the core to the cladding. In 2011[Reference Wang, Wheeler, Couny, Roberts and Benabid31], a new avenue was explored by producing an optimized shape Kagome HC-PCF with a hypocycloidal core-surround to strengthen the coupling inhibition at the interface of the hollow core and the cladding, i.e., the core-surround.
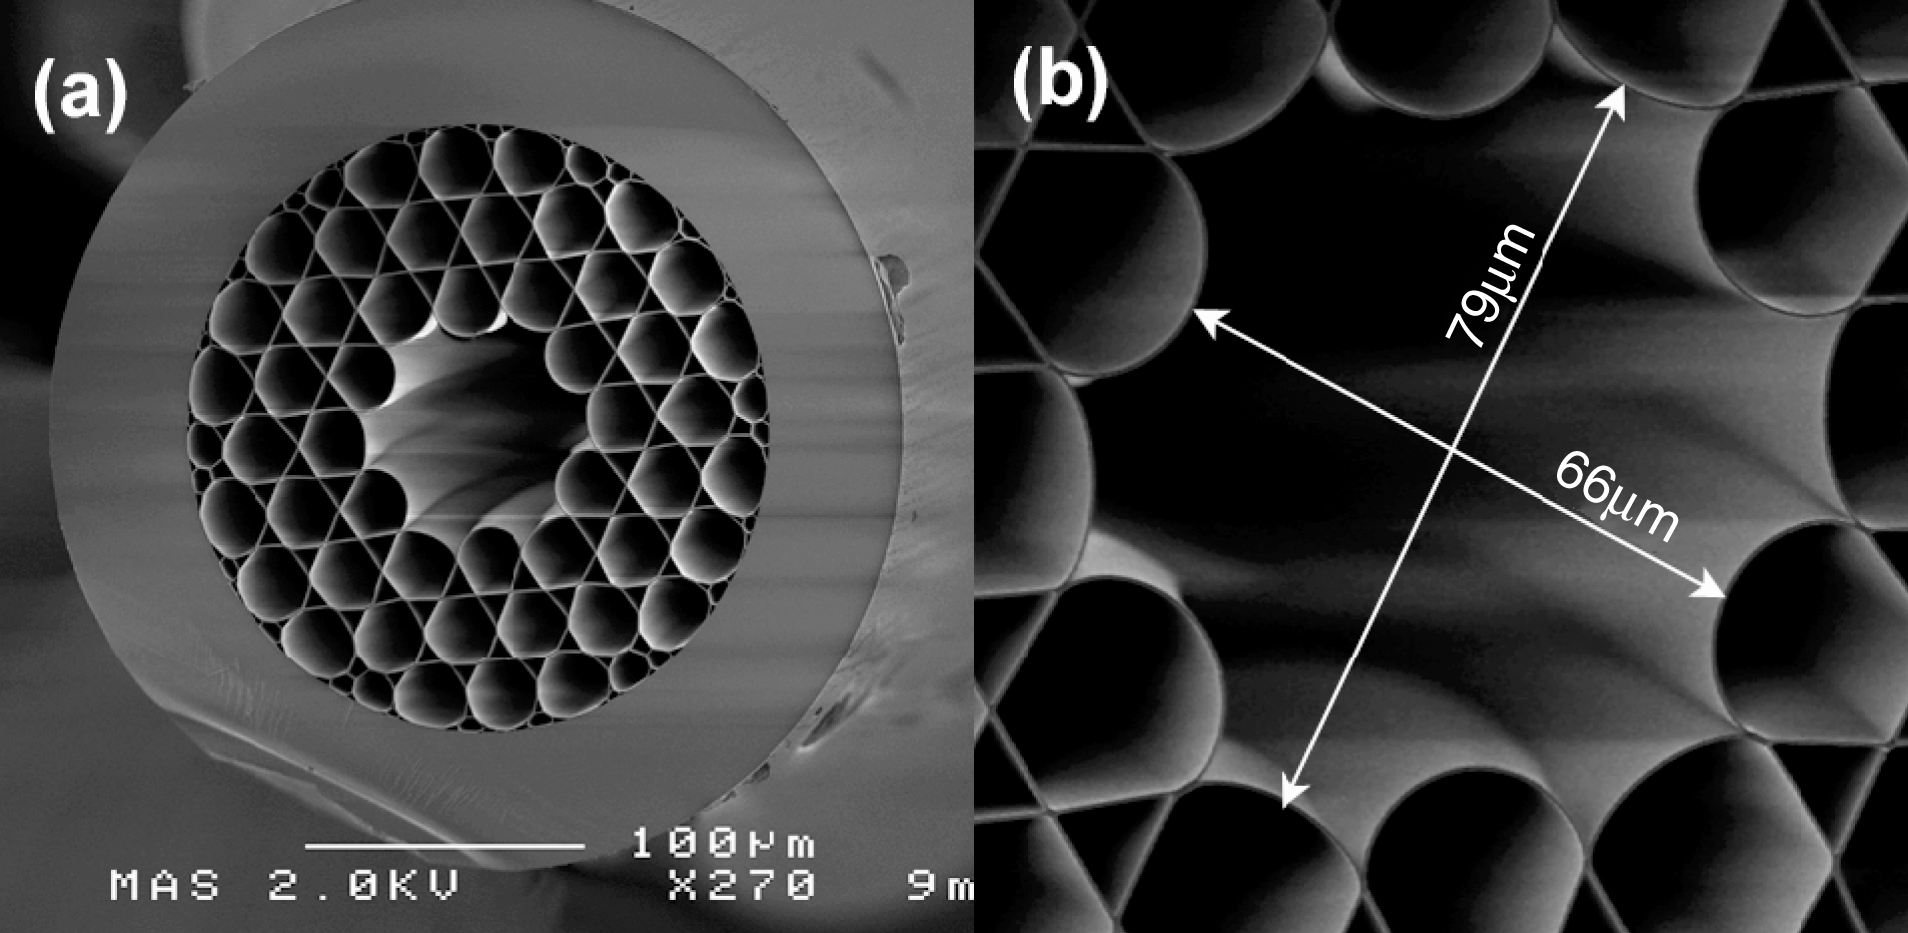
Figure 5(a) shows an SEM image of a seven-cell three-ring hypocycloid-core Kagome fibre. The hypocycloid core is created by removing the seven central capillaries and carefully controlling the relative pressures between the core and the cladding during the fibre drawing[Reference Wang, Wheeler, Couny, Roberts and Benabid31]. The fibre presents an outer diameter of  $300~\mathrm{\mu} \mathrm{m} $, a pitch of
  $23~\mathrm{\mu} \mathrm{m} $ and a strut thickness of 350 nm. The hypocycloid core exhibits a subjacent inner circle with a diameter of
  ${\sim }66~\mathrm{\mu} \mathrm{m} $ and an outer circle with a diameter of
  $79~\mathrm{\mu} \mathrm{m} $ (Figure 5(b)). Compared to the conventional Kagome HC-PCF (Figure 4(a)), this hypocycloid core introduces no distortion to the first cladding ring, indicating an enhanced coupling inhibition with the cladding.
SEM image of the fabricated seven-cell three-ring hypocycloid-core Kagome fibre showing (a) the whole structure; (b) the 66– $79~\mathrm{\mu} \mathrm{m} $ core[Reference Wang, Peng, Alharbi, Fourcade Dutin, Bradley, Gérôme, Mielke, Booth and Benabid32].
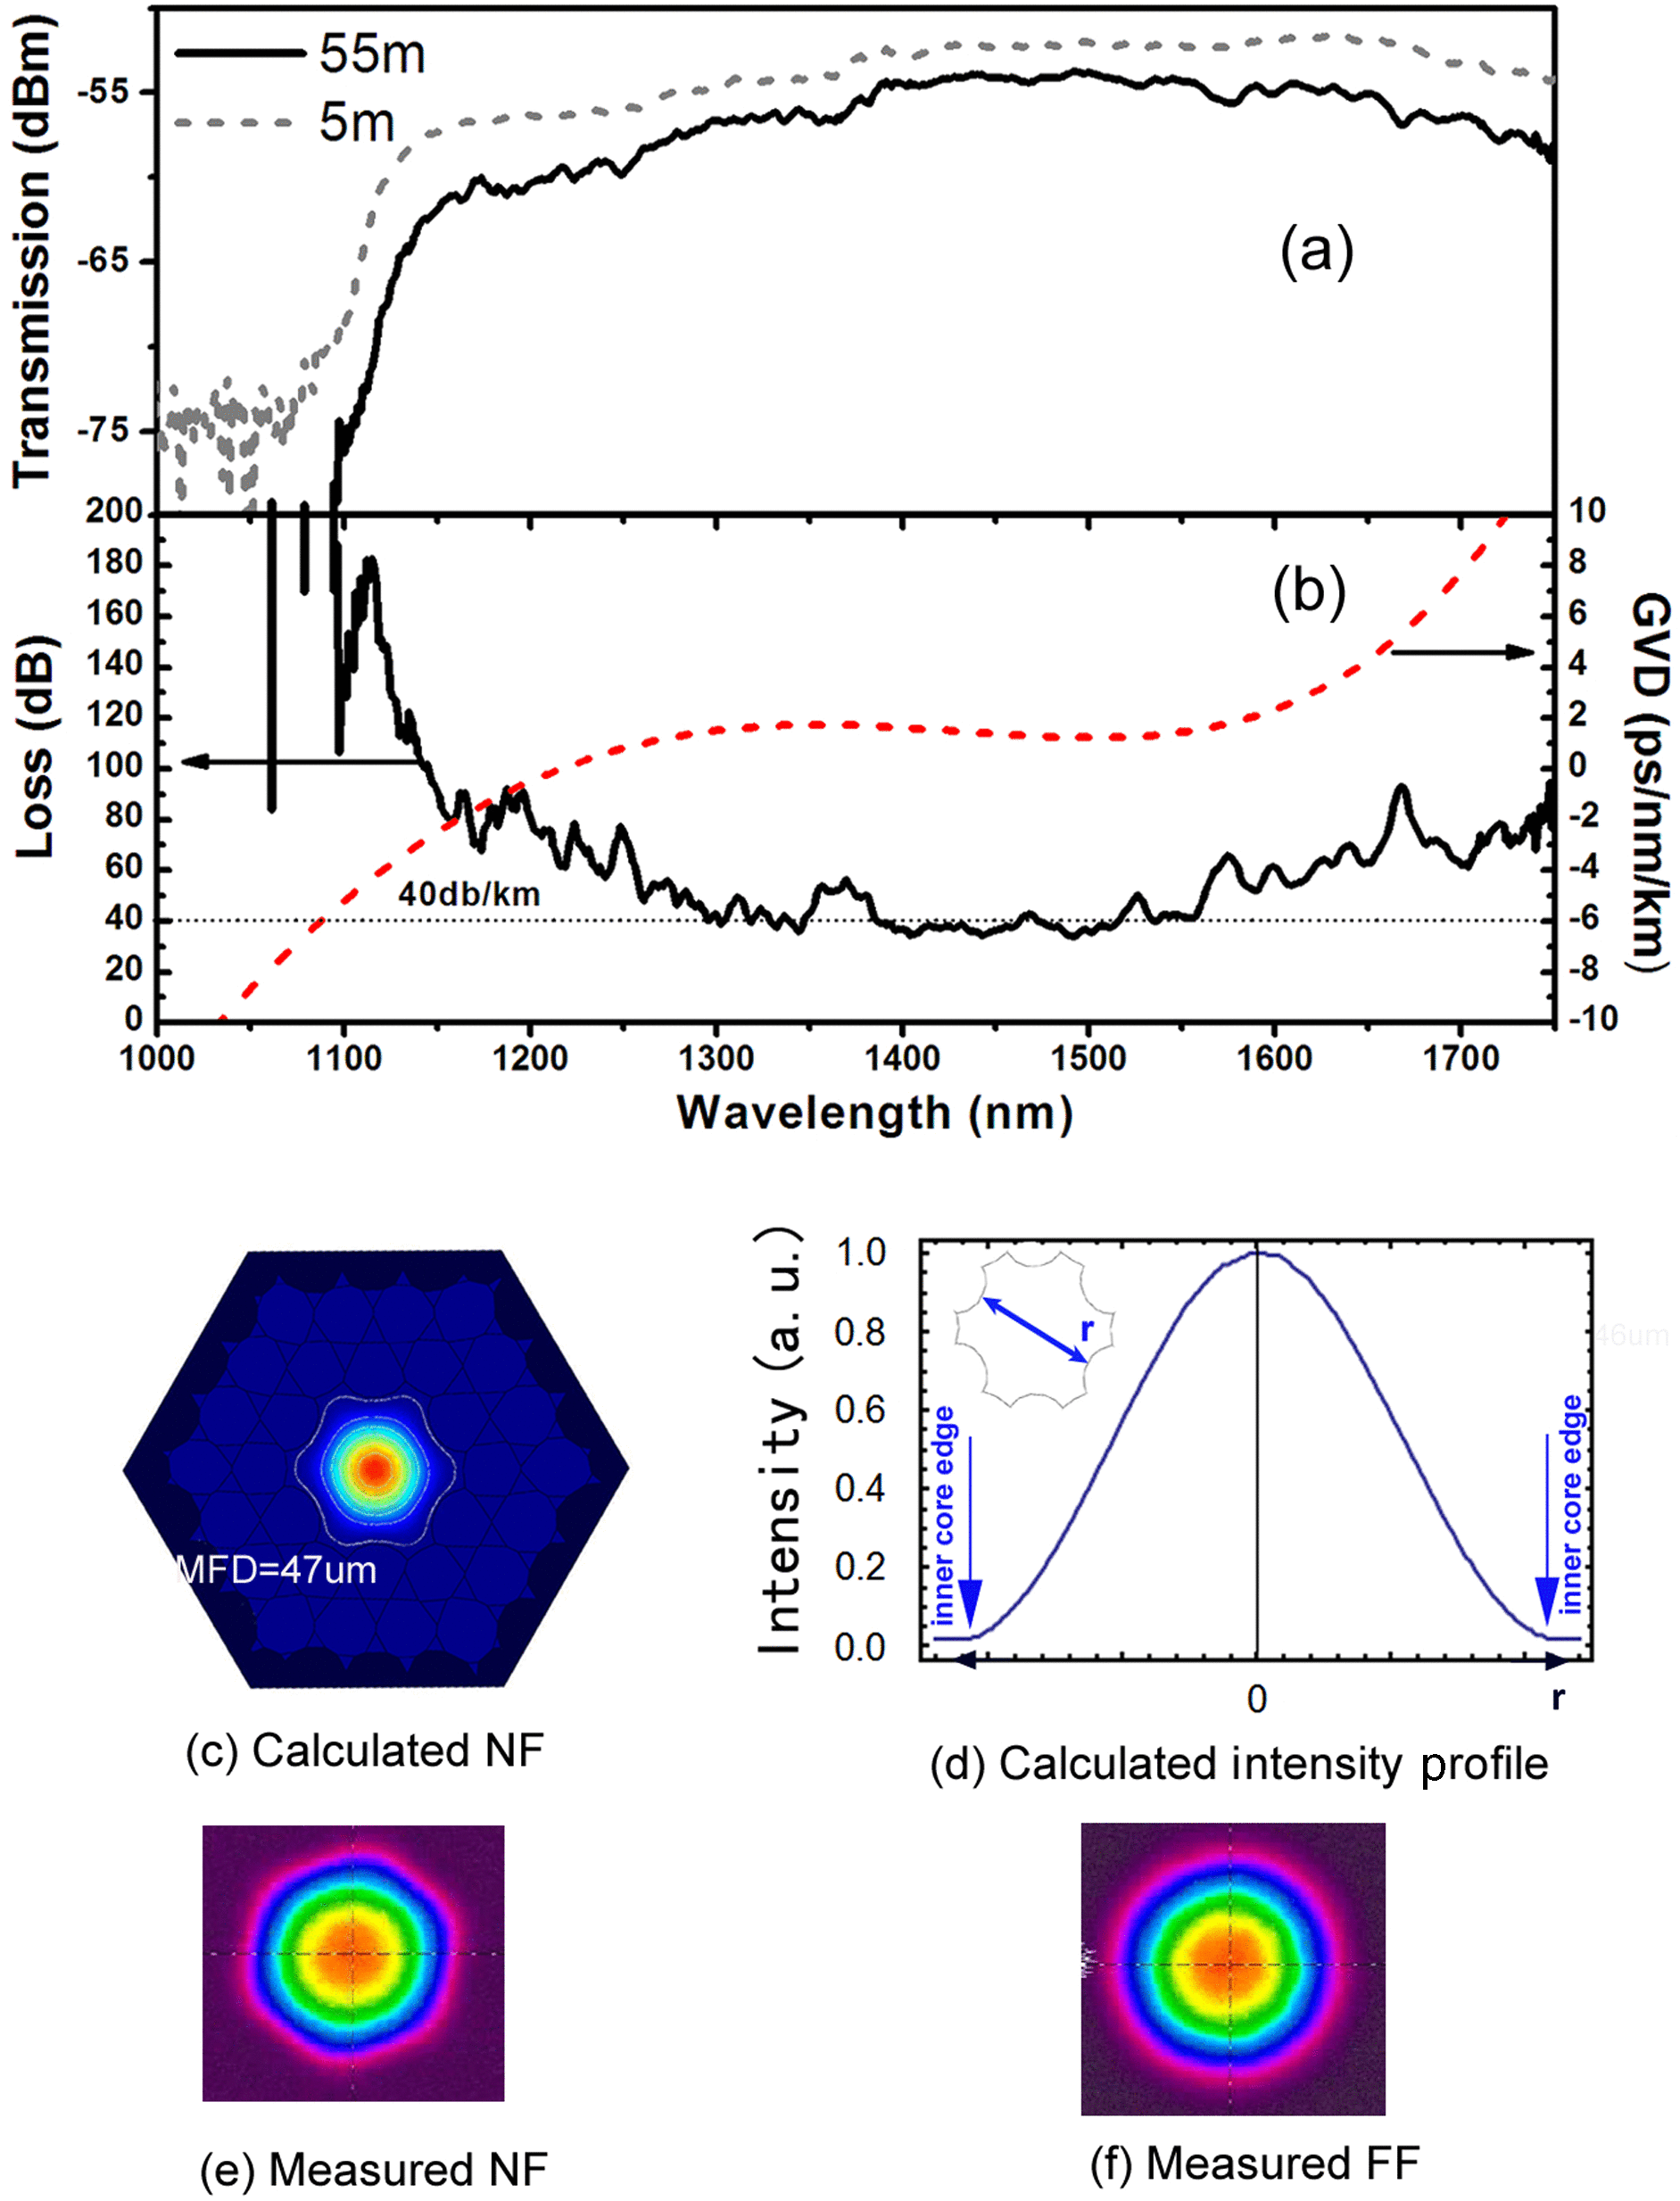
Figure 6(a) shows the transmission spectra of a 55 m (solid curve) and 5 m (dotted curve) length of this fibre recorded using a white light source. The loss spectrum (Figure 6(b)) is obtained by cut-back measurement and shows a record baseline of  $40~\mathrm{dB} ~{\mathrm{km} }^{- 1} $ over a bandwidth spanning from 1100 nm to
  $\gt 1750$ nm (limit of OSA) (
 ${\gt }100$ THz) and reaching a minimum of
  $33~\mathrm{dB} ~{\mathrm{km} }^{- 1} $ at 1440 and 1490 nm. This loss figure was confirmed by another cut-back measurement using a supercontinuum source. This beats bandgap HC-PCF in terms of bandwidth (
 ${\sim }70$ THz for PBG) and demonstrates a comparable loss figure[Reference Roberts, Couny, Sabert, Mangan, Williams, Farr, Mason, Tomlinson, Birks, Knight and Russell11]. Compared to the conventional Kagome fibre, the larger core size increases the laser-induced damage threshold and the one order of magnitude smaller propagation loss means less scattering and radiation to the silica cladding. Figure 6(b) also shows the calculated group velocity dispersion (GVD), which shows an anomalous dispersion over most of the transmission windows with a value of
 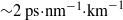 ${\sim }2~\mathrm{ps} {\cdot }{\mathrm{nm} }^{- 1} {\cdot }{\mathrm{km} }^{- 1} $ around the wavelength range of interest, 1500–1600 nm. By scaling down the pitch to
  $15~\mathrm{\mu} \mathrm{m} $, fibres with loss figure of
  ${\sim }$70 dB/km and bandwidth from 670 to 1400 nm (
 ${\sim }230$ THz) have also been fabricated[Reference Bradley, Wang, Alharbi, Fourcade-Dutin, Mangan, Wheeler and Benabid34].
Despite the relatively large core size of the fibre, and provided a good numerical aperture (NA) matching (NA  $\sim 0. 023$), the fibre guides light in a single-mode fashion and the coupling efficiency exceeds 90%. Figure 6(c–f) show the mode profiles of the fibre. Both the calculated and measured mode field diameter (MFD) show a value of
  ${\sim }47~\mathrm{\mu} \mathrm{m} $ (Figures 6(c) and (e)), much smaller than the core size (66–
 $79~\mathrm{\mu} \mathrm{m} $). This MFD approaches that of a capillary with a bore diameter equal to the inner diameter of the hypocycloid core of the HC-PCF. This implies a reduction of the spatial overlap of the core mode with the silica core wall, making it thus a good candidate for beam delivery.
(a) The fibre optical transmission spectra measured by the white-light source for 55 m (solid curve) and 5 m (dotted curve). (b) The fibre optical attenuation spectrum (solid black curve) and GVD (dashed red line). The dotted horizontal line shows the baseline of the attenuation figure. (c) Calculated near-field (NF) pattern with an MFD of  $47~\mathrm{\mu} \mathrm{m} $. (d) Calculated intensity profile showing along the axis shown in the top-left inset. (e) Measured NF pattern showing an MFD of
  $46~\mathrm{\mu} \mathrm{m} $. (f) Measured far-field (FF) pattern[Reference Wang, Peng, Alharbi, Fourcade Dutin, Bradley, Gérôme, Mielke, Booth and Benabid32].
Comparison
The two types of HC-PCF discussed above and tabulated in Table 1 have been widely used in various applications. In an all-fibre device, bandgap HC-PCF is usually favoured because of its suitable core size, which gives rise to a relatively low splice loss with conventional single-mode fibre. However, recently, Wheeler et al. demonstrated that Kagome HC-PCF could be spliced with comparable splice loss to that of PBG guiding ones, provided the HC-PCF is tapered[Reference Wheeler, Grogan, Light, Couny, Birks and Benabid43]. Bandgap HC-PCF also finds applications in soliton generation[Reference Ouzounov, Ahmad, Müller, Venkataraman, Gallagher, Thomas, Silcox, Koch and Gaeta14] and pulse compression[Reference Mosley, Huang, Welch, Mangan, Wadsworth and Knight44]. As a host for light–matter interactions[Reference Benabid, Light, Couny and Russell16,Reference Benabid, Knight, Antonopoulos and Russell17] , which is one of the most advanced applications of HC-PCF, bandgap HC-PCF can enhance the interaction intensity by up to a millionfold because of its small core size and low optical attenuation. However, a lot of light–matter interaction phenomena, for example Raman frequency comb generation[Reference Couny, Benabid, Roberts, Light and Raymer26] and high harmonic generation[Reference Heckl, Baer, Kränkel, Marchese, Schapper, Holler, Südmeyer, Robinson, Tisch, Couny, Light, Benabid and Keller37], produce light in a broad frequency range. In such situations, a broadband guiding HC-PCF, like Kagome HC-PCF, is required. Moreover, Kagome HC-PCF has also been successfully utilized in gas sensing thanks to its inherent large core size. More related to this paper, in the application of high power laser beam delivery, the maximum energy  ${E}_{max} $ that could couple into a piece of HC-PCF is proportional to the (LIDT) (
 ${A}_{ring} / F$), where LIDT stands for the laser-induced damage threshold (for silica it is equal to
  $120~\mathrm{J} / {\mathrm{cm} }^{2} $ for 9 ns pulses at 1064 nm),
  ${A}_{ring} $ is the area of the silica structure in the core region and
  $F$ is the intensity overlap ratio of the core modal profile and the silica structure. Compared to bandgap HC-PCF, Kagome HC-PCF wins out in both the core size and the overlap ratio with silica. Therefore, Kagome HC-PCF, especially the newly developed hypocycloid-core type, shows high potential. In the following section, two examples of high power laser beam delivery will be elaborated.
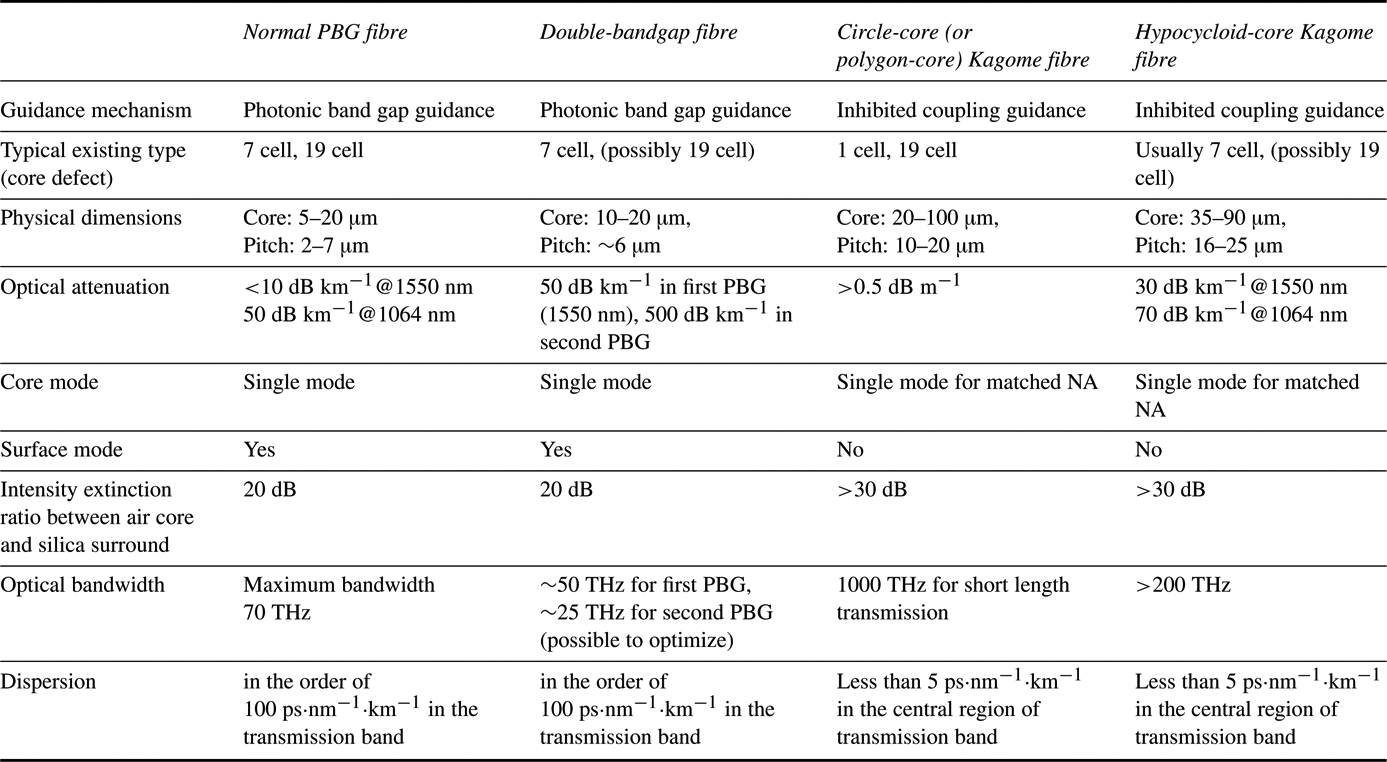
Comparison of single-bandgap HC-PCF, double-bandgap HC-PCF, conventional circle-core or polygon-core Kagome HC-PCF and hypocycloid-core Kagome HC-PCF in terms of their guidance mechanism, dimension, optical attenuation, mode profile, mode overlap with silica, optical bandwidth and dispersion.
3. Millijoule nanosecond laser pulse delivery and spark ignition
Laser-induced spark ignition has significant advantages over a conventional spark-ignition system such as higher efficiency to ignite leaner mixtures, reduction of erosion effects, selective chemistry, increase of engine efficiency and shorter combustion time, to mention just a few[Reference Ma, Alexander and Poulain45]. For efficient spark ignition, one must meet several requirements. First, a high level of power density is needed, which in turn calls for a tight laser beam focusing configuration. Second, for practical applications, a flexible delivery of the laser beam is necessary. Finally, for efficient laser-induced spark ignition, the laser beam should exhibit an  ${M}^{2} $ value close to unity. All these restrictions push researchers to investigate the use of HC-PCF for laser-induced spark ignition. Here two types of Kagome HC-PCF are used to deliver a millijoule laser pulse for spark ignition.
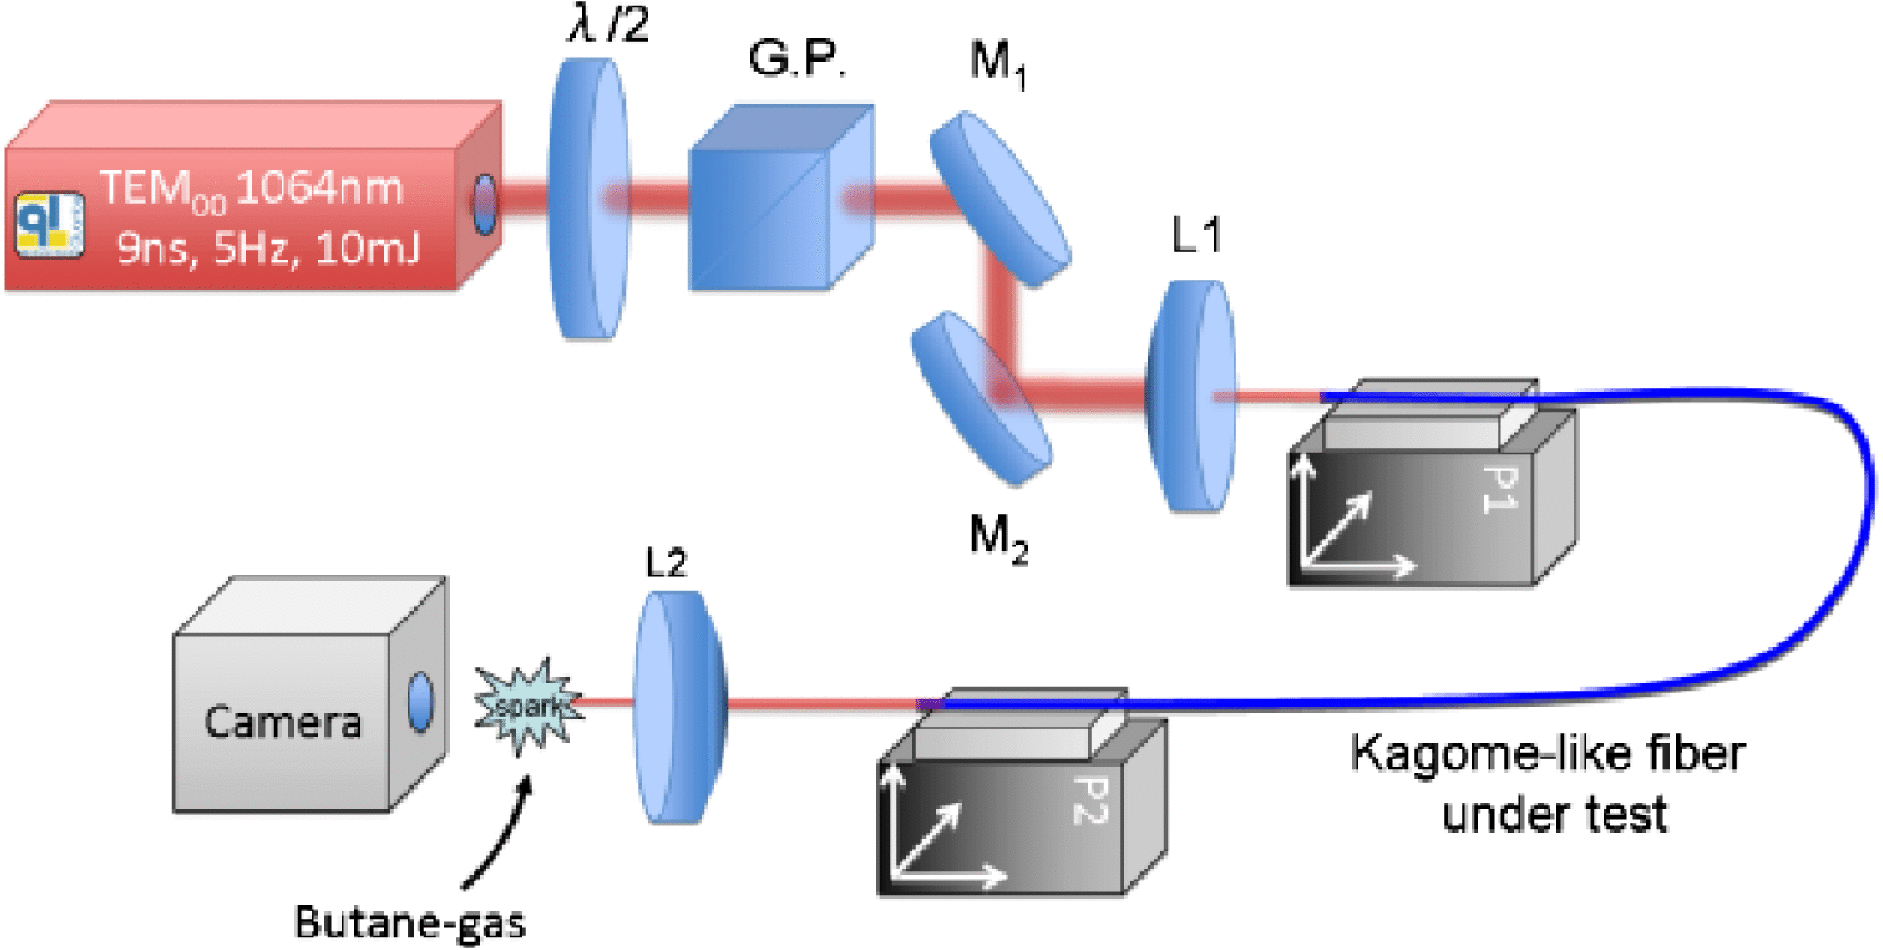
Figure 7 shows the experimental set-up. A Nd:YAG 9 ns pulsed laser emits pulses at 1064 nm with repetition rate of 5 Hz, energy of 10 mJ and a TEM00 mode profile. A Glan polarizer is used to control the incident energy and dielectric high power mirrors are added to adjust the angle of the incident beam. The focused spot is launched into the HC-PCF using a 53 mm effective focal length lens. The fibres under test were a 60 cm single-cell Kagome HC-PCF and a 1 m 7-cell Kagome HC-PCF with hypocycloid-core shape, respectively. The fibre is first flushed with neon to remove any trapped dust inside the fibre core. The output from the fibre is then refocused by an 8 mm aspheric lens to achieve sparking.
Experimental set-up for the laser-induced spark-ignition experiment.  $\lambda / 2$: half wave plate
  $@ 1064$ nm, G.P.: Glan polarizer, M: mirrors, L: lenses[Reference Beaudou, Gerôme, Wang, Alharbi, Bradley, Humbert, Auguste, Blondy and Benabid46].
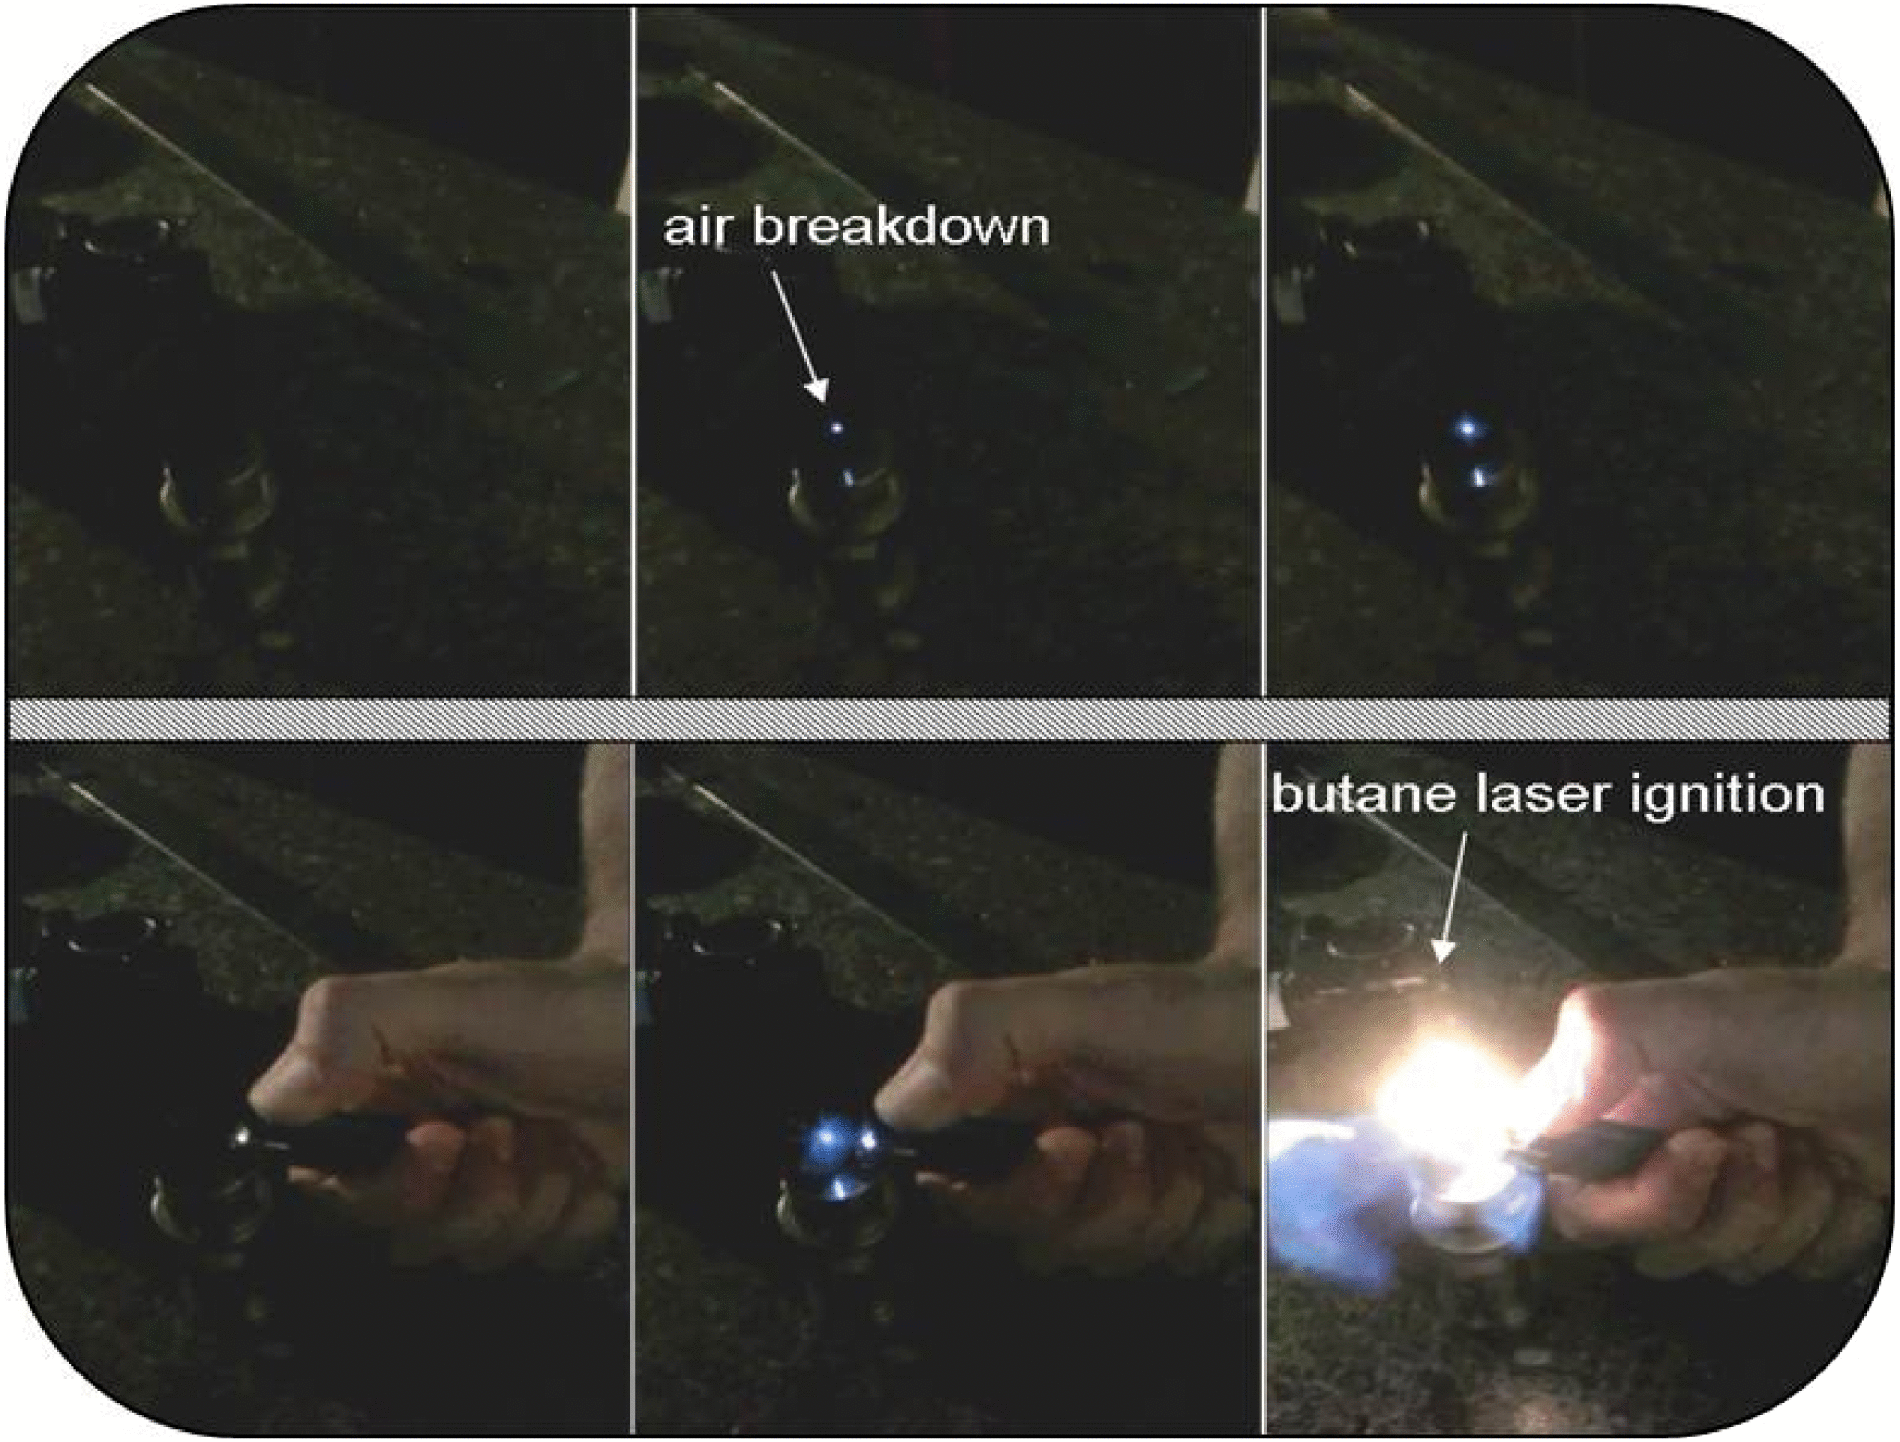
Figure 8 shows the air breakdown induced by the focused beam (top frames), when a laser pulse of 2 mJ or more is delivered by the HC-PCF. As a proof-of-concept of the capabilities of the fibre-delivered laser beam for spark ignition, a jet of butane from a lighter is set near the focal position of the focusing lens. The bottom part of Figure 8 shows three frames illustrating the sequence of spark ignition. Frame one corresponds to the release of the butane in the absence of the pulse. Frames two and three capture the ignition process by laser pulses of energy of 2 mJ or more. For a definitive implementation of our scheme to engine-based applications, further investigation of butane/air mixture laser ignition with different ratio and pressure is required.
Air-breakdown demonstration (power density at the focal point approaching  $\mathrm{TW} / {\mathrm{cm} }^{2} $) at the fibre output after focusing. At the bottom, the pictures show the spark ignition induced[Reference Beaudou, Gerôme, Wang, Alharbi, Bradley, Humbert, Auguste, Blondy and Benabid46].
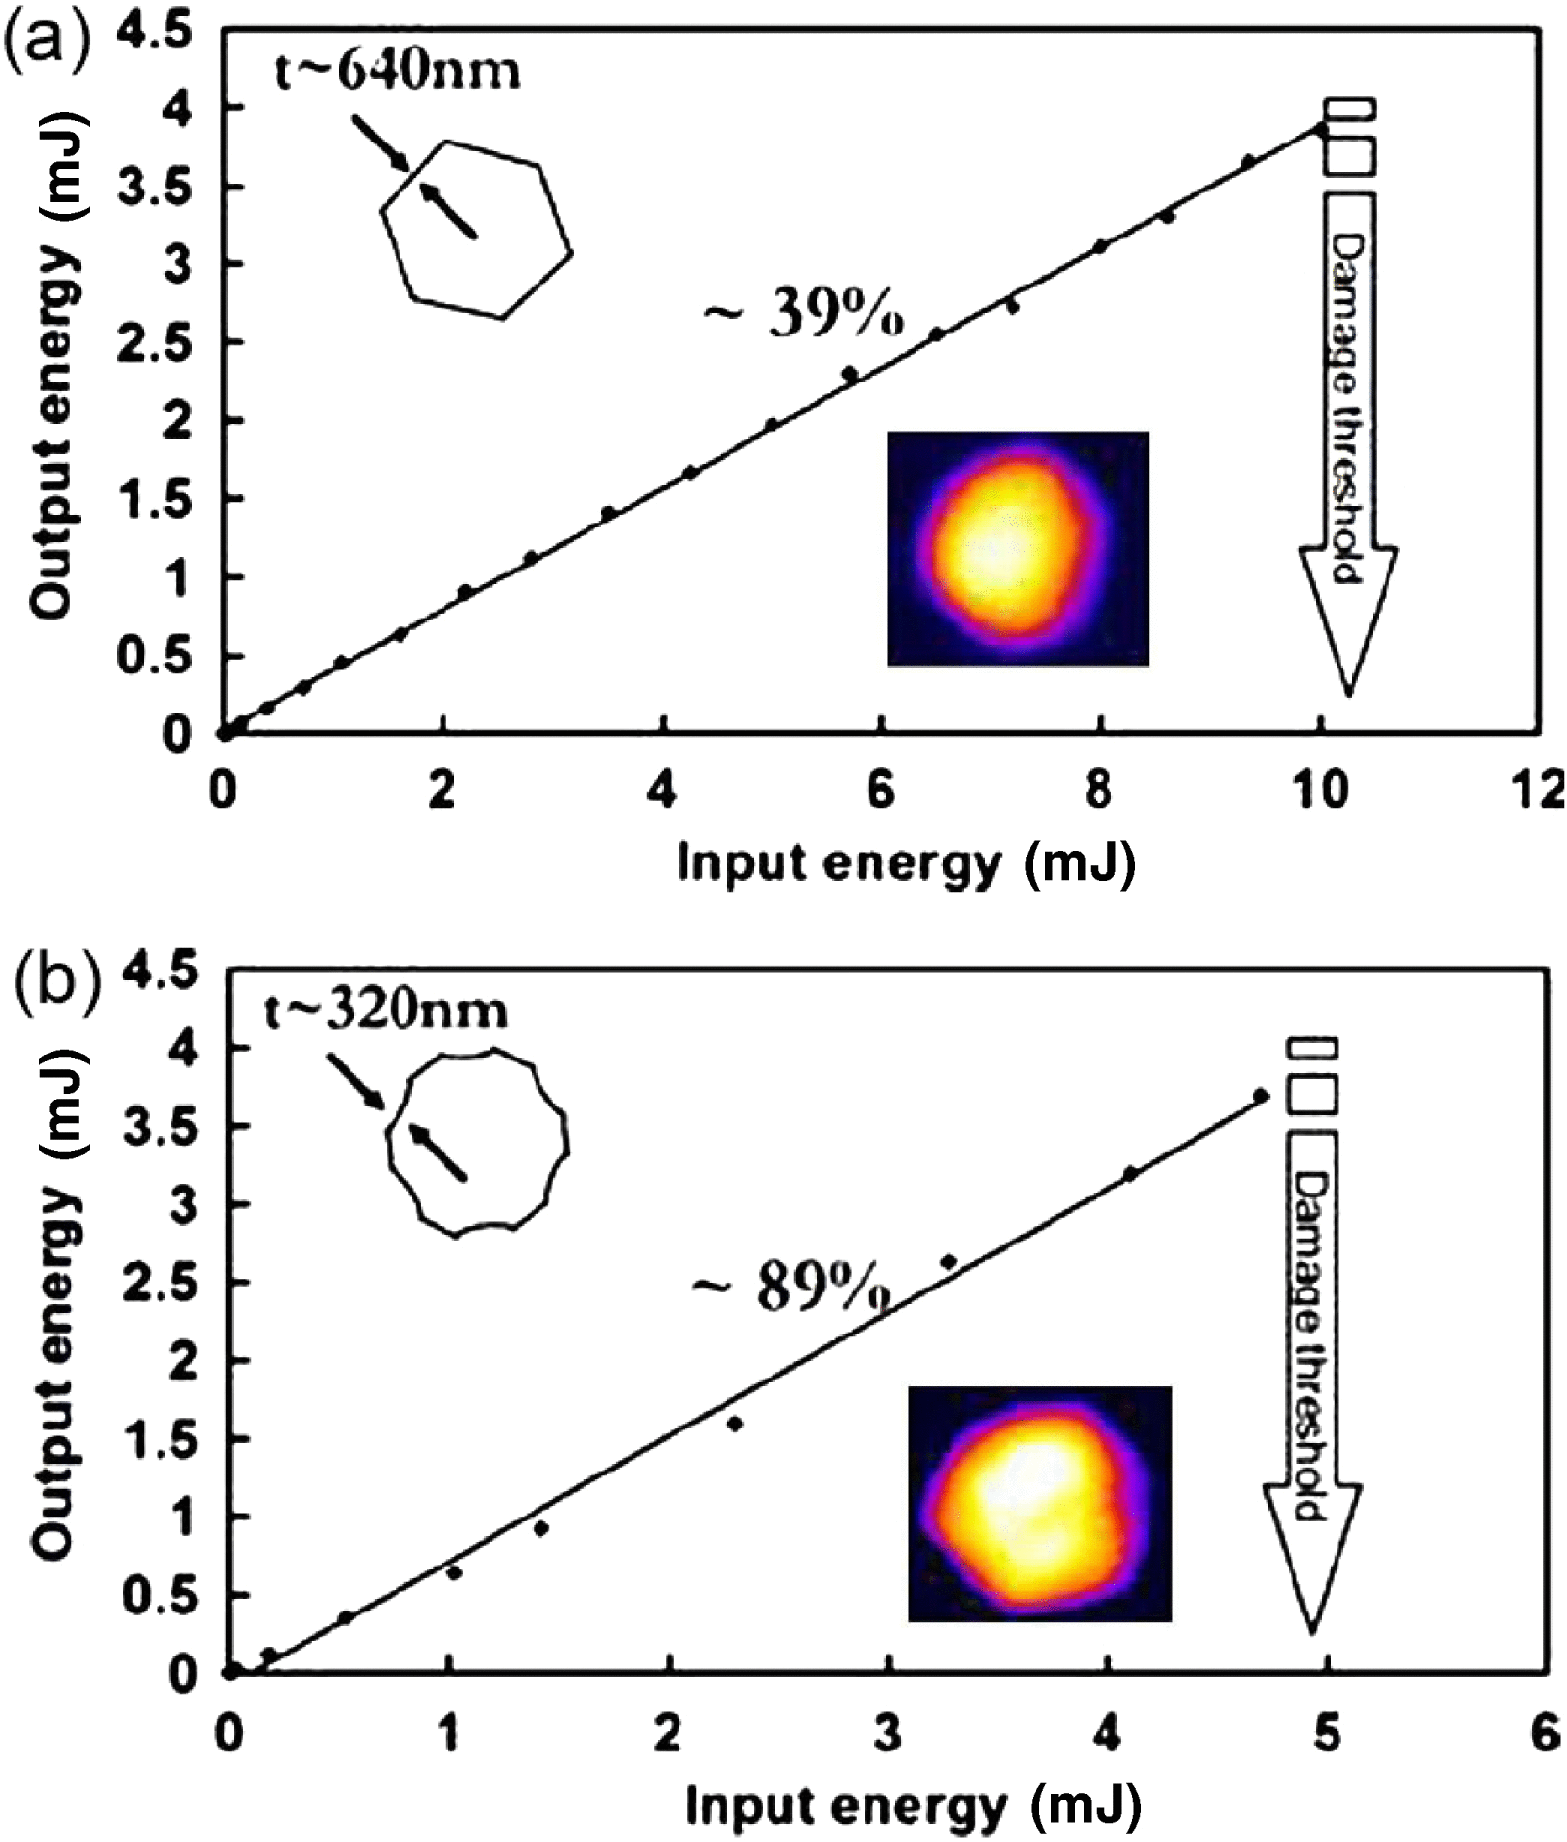
The air breakdown and the ignition were observed to occur at the same energy level with both fibres. However, the two fibres exhibit different characteristic regarding the transmission performance and the energy damage threshold. Figure 9 illustrates this difference. It shows the output energy as a function of the input one for the single-cell fibre (Figure 9(a)) and for the hypocycloid one (Figure 9(b)), respectively. The maximum output energy of 4 mJ-level was achieved for both fibres, but we could see discrepancies in coupling efficiency. The energy coupled in the core is nearly optimal and reaches 89% of the incoming power for the hypocycloid-core HC-PCF, while only 39% is transmitted for the single-core fibre. The lack of available data on thin silica LIDT, along with the presence of contamination (dust), the imperfect coupling conditions and imperfections at the fibre input end are responsible for the discrepancy between the theoretical maximum energy and the experimentally achieved value reported in this paper. The imaging of the reconstructed near field and the far field of the fibre outputs (see insets of Figure 9) indicate a near-Gaussian beam behaviour, thus making HC-PCF an excellent means for a flexible delivery tool for laser-induced spark ignition. The energy level reached is increased by nearly an order of magnitude compared to previous work on PBG guiding HC-PCF[Reference Shephard, Jones, Hand, Bouwmans, Knight, Russell and Mangan35] and can be brought closer to the theoretical limit by improving the set-up and the end facet preparation.
Output energy versus input energy for (a) a one-cell Kagome fibre with a silica core-surround thickness of 640 nm and (b) a seven-cell hypocycloid-core Kagome fibre with a silica core-surround thickness of 320 nm. The coupling efficiency and the damage threshold are indicated on the graphs; inserted in (a) and (b) are near-field intensity patterns recorded at the fibre output[Reference Beaudou, Gerôme, Wang, Alharbi, Bradley, Humbert, Auguste, Blondy and Benabid46].
In conclusion, the high transmitted energy level and good spatial quality allow us to tightly refocus the outgoing beam and overtake the air ionization breakdown threshold. This is, to the best of our knowledge, the first demonstration of HC-PCF delivery for spark-ignition application.
4. Sub-picosecond laser pulse delivery and compression
Ultra-short pulsed (USP) lasers (pulse width  ${\lt }1$ ps) have found many high value applications like micro-machining, surface marking and laser surgery. Since USP lasers produce high peak power (
 ${\gt }1$ MW) even at modest output strength (
 ${\gt }1~\mathrm{\mu} \mathrm{J} $), flexible beam delivery is an issue. Section 2 has roughly illustrated that hypocycloid-core Kagome HC-PCF is suitable for this application. Here, we demonstrate this idea in more detail by transporting a high energy sub-picosecond pulse with no pulse spreading on the one hand and pulse compression on the other hand.
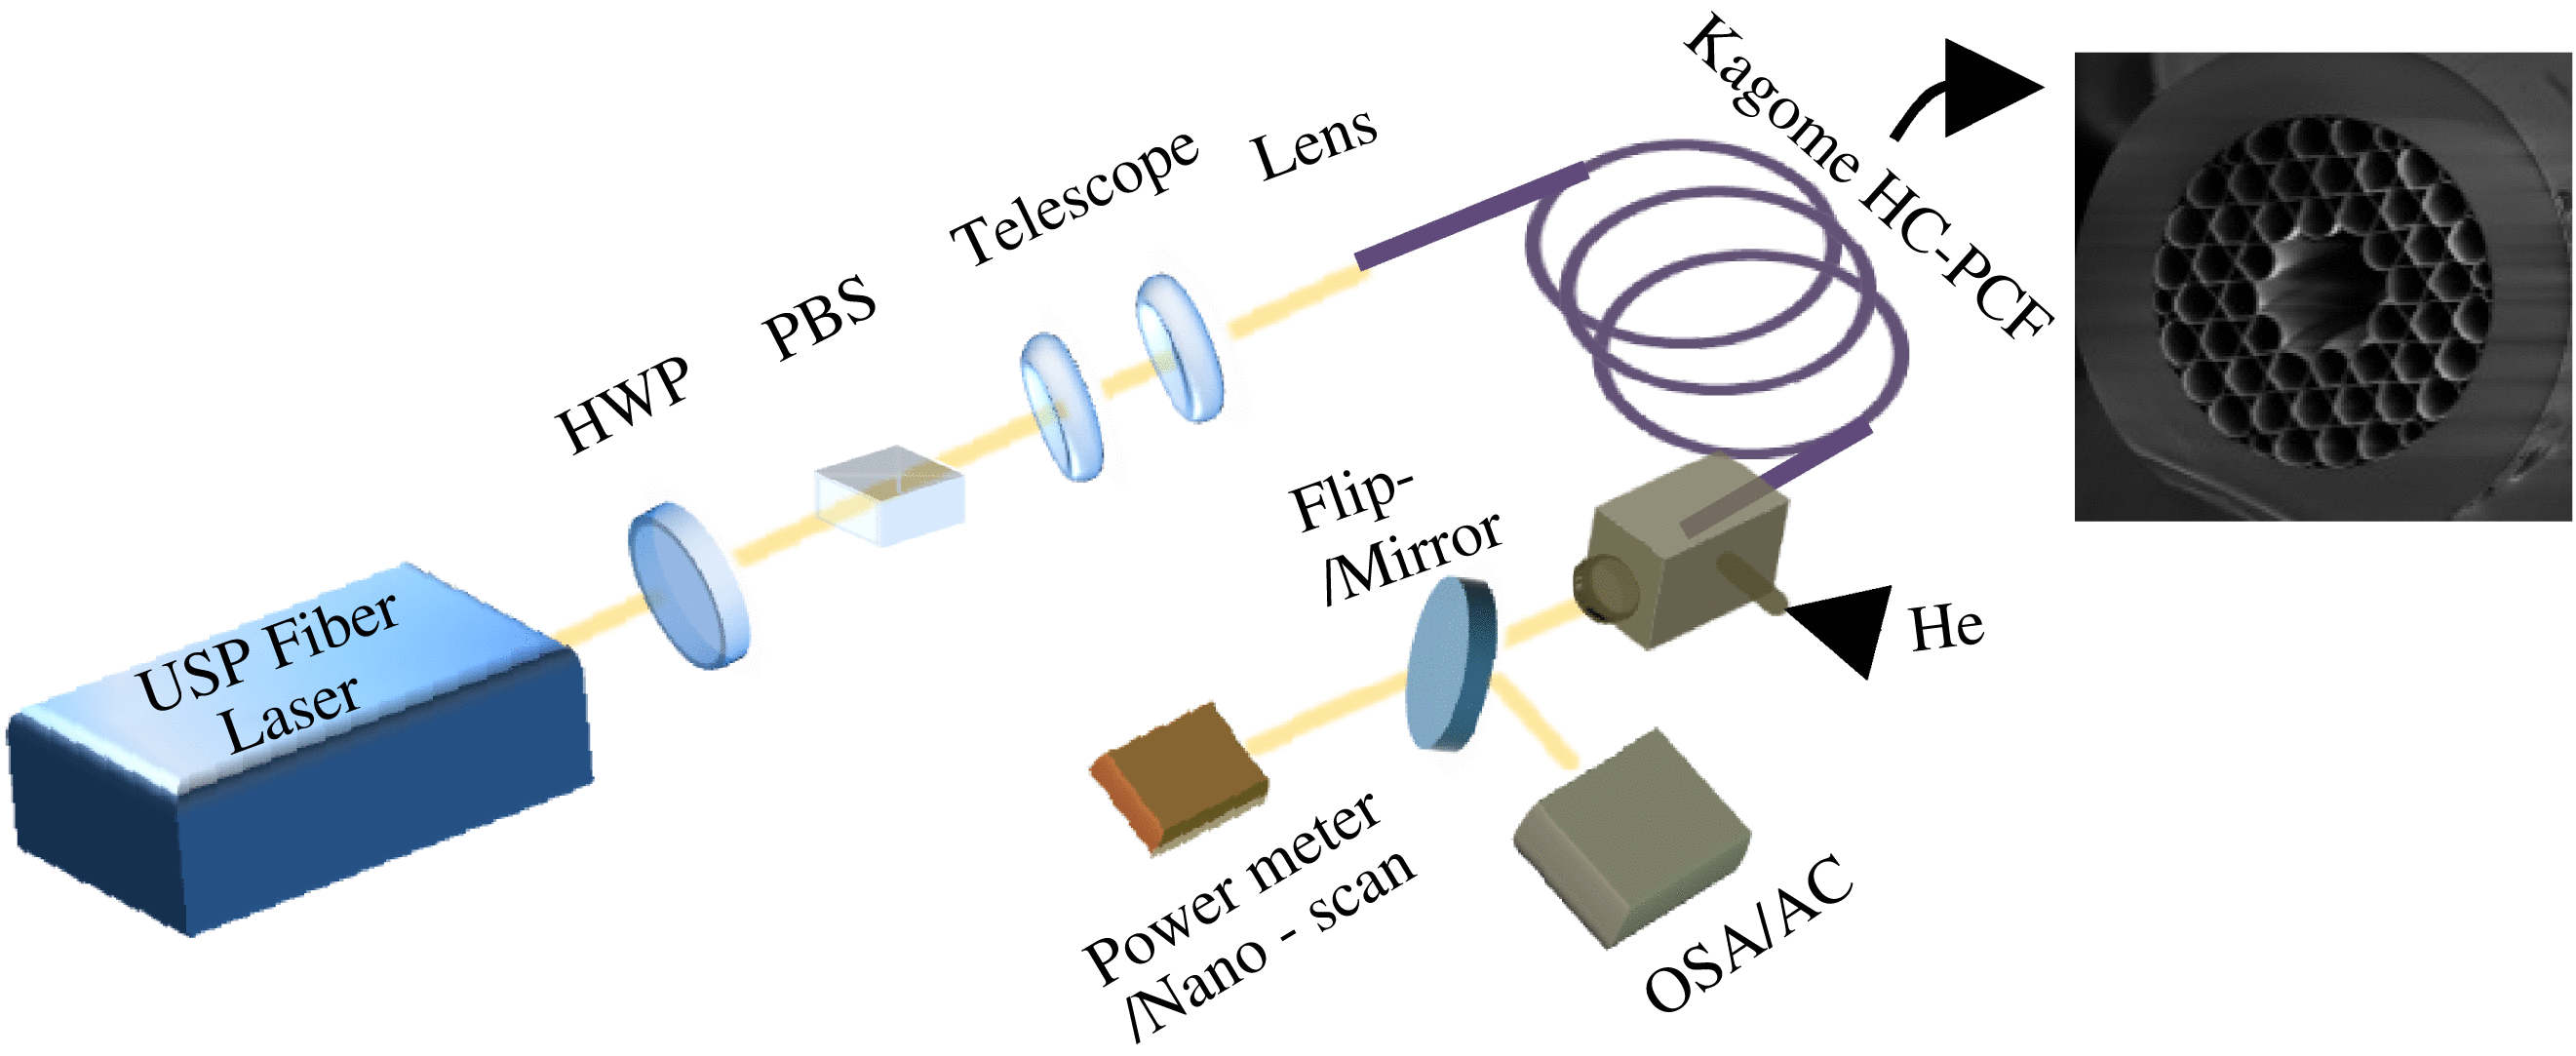
Figure 10 shows the set-up for the pulse-spread-free experiment. The output beam of a USP laser operating at 1550 nm with pulse width in the range of 0.9 and 0.8 ps, a pulse energy of  $105~\mathrm{\mu} \mathrm{J} $ (4.2 W average power) and repetition rate of 40 kHz goes through a half wave plate (HWP) and a polarization beam splitter (PBS) for power attenuation and a telescope for adjusting the beam waist. The collimated beam is then focus onto the entrance facet of a
  ${\sim }2. 3$ m long HC-PCF. By matching the NA of the incoming beam to that of the fibre, a coupling efficiency of
  ${\gt }90\% $ has been achieved. Note that the maximizing of the coupling is done at very low pulse energy (
 ${\sim }0. 5~\mathrm{\mu} \mathrm{J} $) so as to avoid damage to the silica struts of the fibre. After that, the launched energy is slowly increased to minimize the thermal shock which has been observed to cause slight fibre movements and hence fibre damage. This issue would be negated by rigid mounting of the fibre tip and a more aggressive thermal management design. The output of the Kagome fibre is sealed in a chamber and 3.4 bar helium is introduced to the fibre through this chamber. The reason for introducing noble gas to the fibre is motivated by minimizing the effect of nonlinearity in the hollow core and also cooling the fibre end. Helium has a much smaller nonlinear refractive index
  $({n}_{2} \sim 4\times 1{0}^{- 25} ~{\mathrm{m} }^{2} / \mathrm{W} $) than most other noble gases (usually in the order of
  $1{0}^{- 23} ~{\mathrm{m} }^{2} / \mathrm{W} $). Also, positive gas pressure inside the Kagome fibre compared to ambient helps reduce the possibility of dust entering the hollow core and cladding holes which would dramatically increase the likelihood of damage to the fibre. In addition, since the input end is open to air, the gas flow helps cool the fibre facet where the beam generates a modest heat load. To demonstrate this, an infrared thermal camera is used to monitor the temperature at the input fibre facet. Without inert gas injection, the facet temperature is
  ${\lt }4{0}^{\circ } \mathrm{C} $ with 2.8 W output power from the fibre. With inert gas injection, the input fibre facet temperature drops to
  ${\lt }3{5}^{\circ } \mathrm{C} $ at 30 psi. A few centimetres of the coating material is removed from the input end of the fibre, and it is placed inside a V-groove mount with a small amount of thermal paste to increase the thermal conductivity. Finally, a power meter, USP laser intensity autocorrelator (AC), optical spectral analyser (OSA) and a scanning slit beam profiler (Nanoscan) are consecutively positioned at the fibre output port to measure the beam characteristics.
Set-up of the pulse-spread free experiment. HWP: half wave plate; PBS: polarizing beam splitter, OSA: optical spectrum analyser; AC: second harmonic intensity autocorrelator[Reference Wang, Peng, Alharbi, Fourcade Dutin, Bradley, Gérôme, Mielke, Booth and Benabid32].
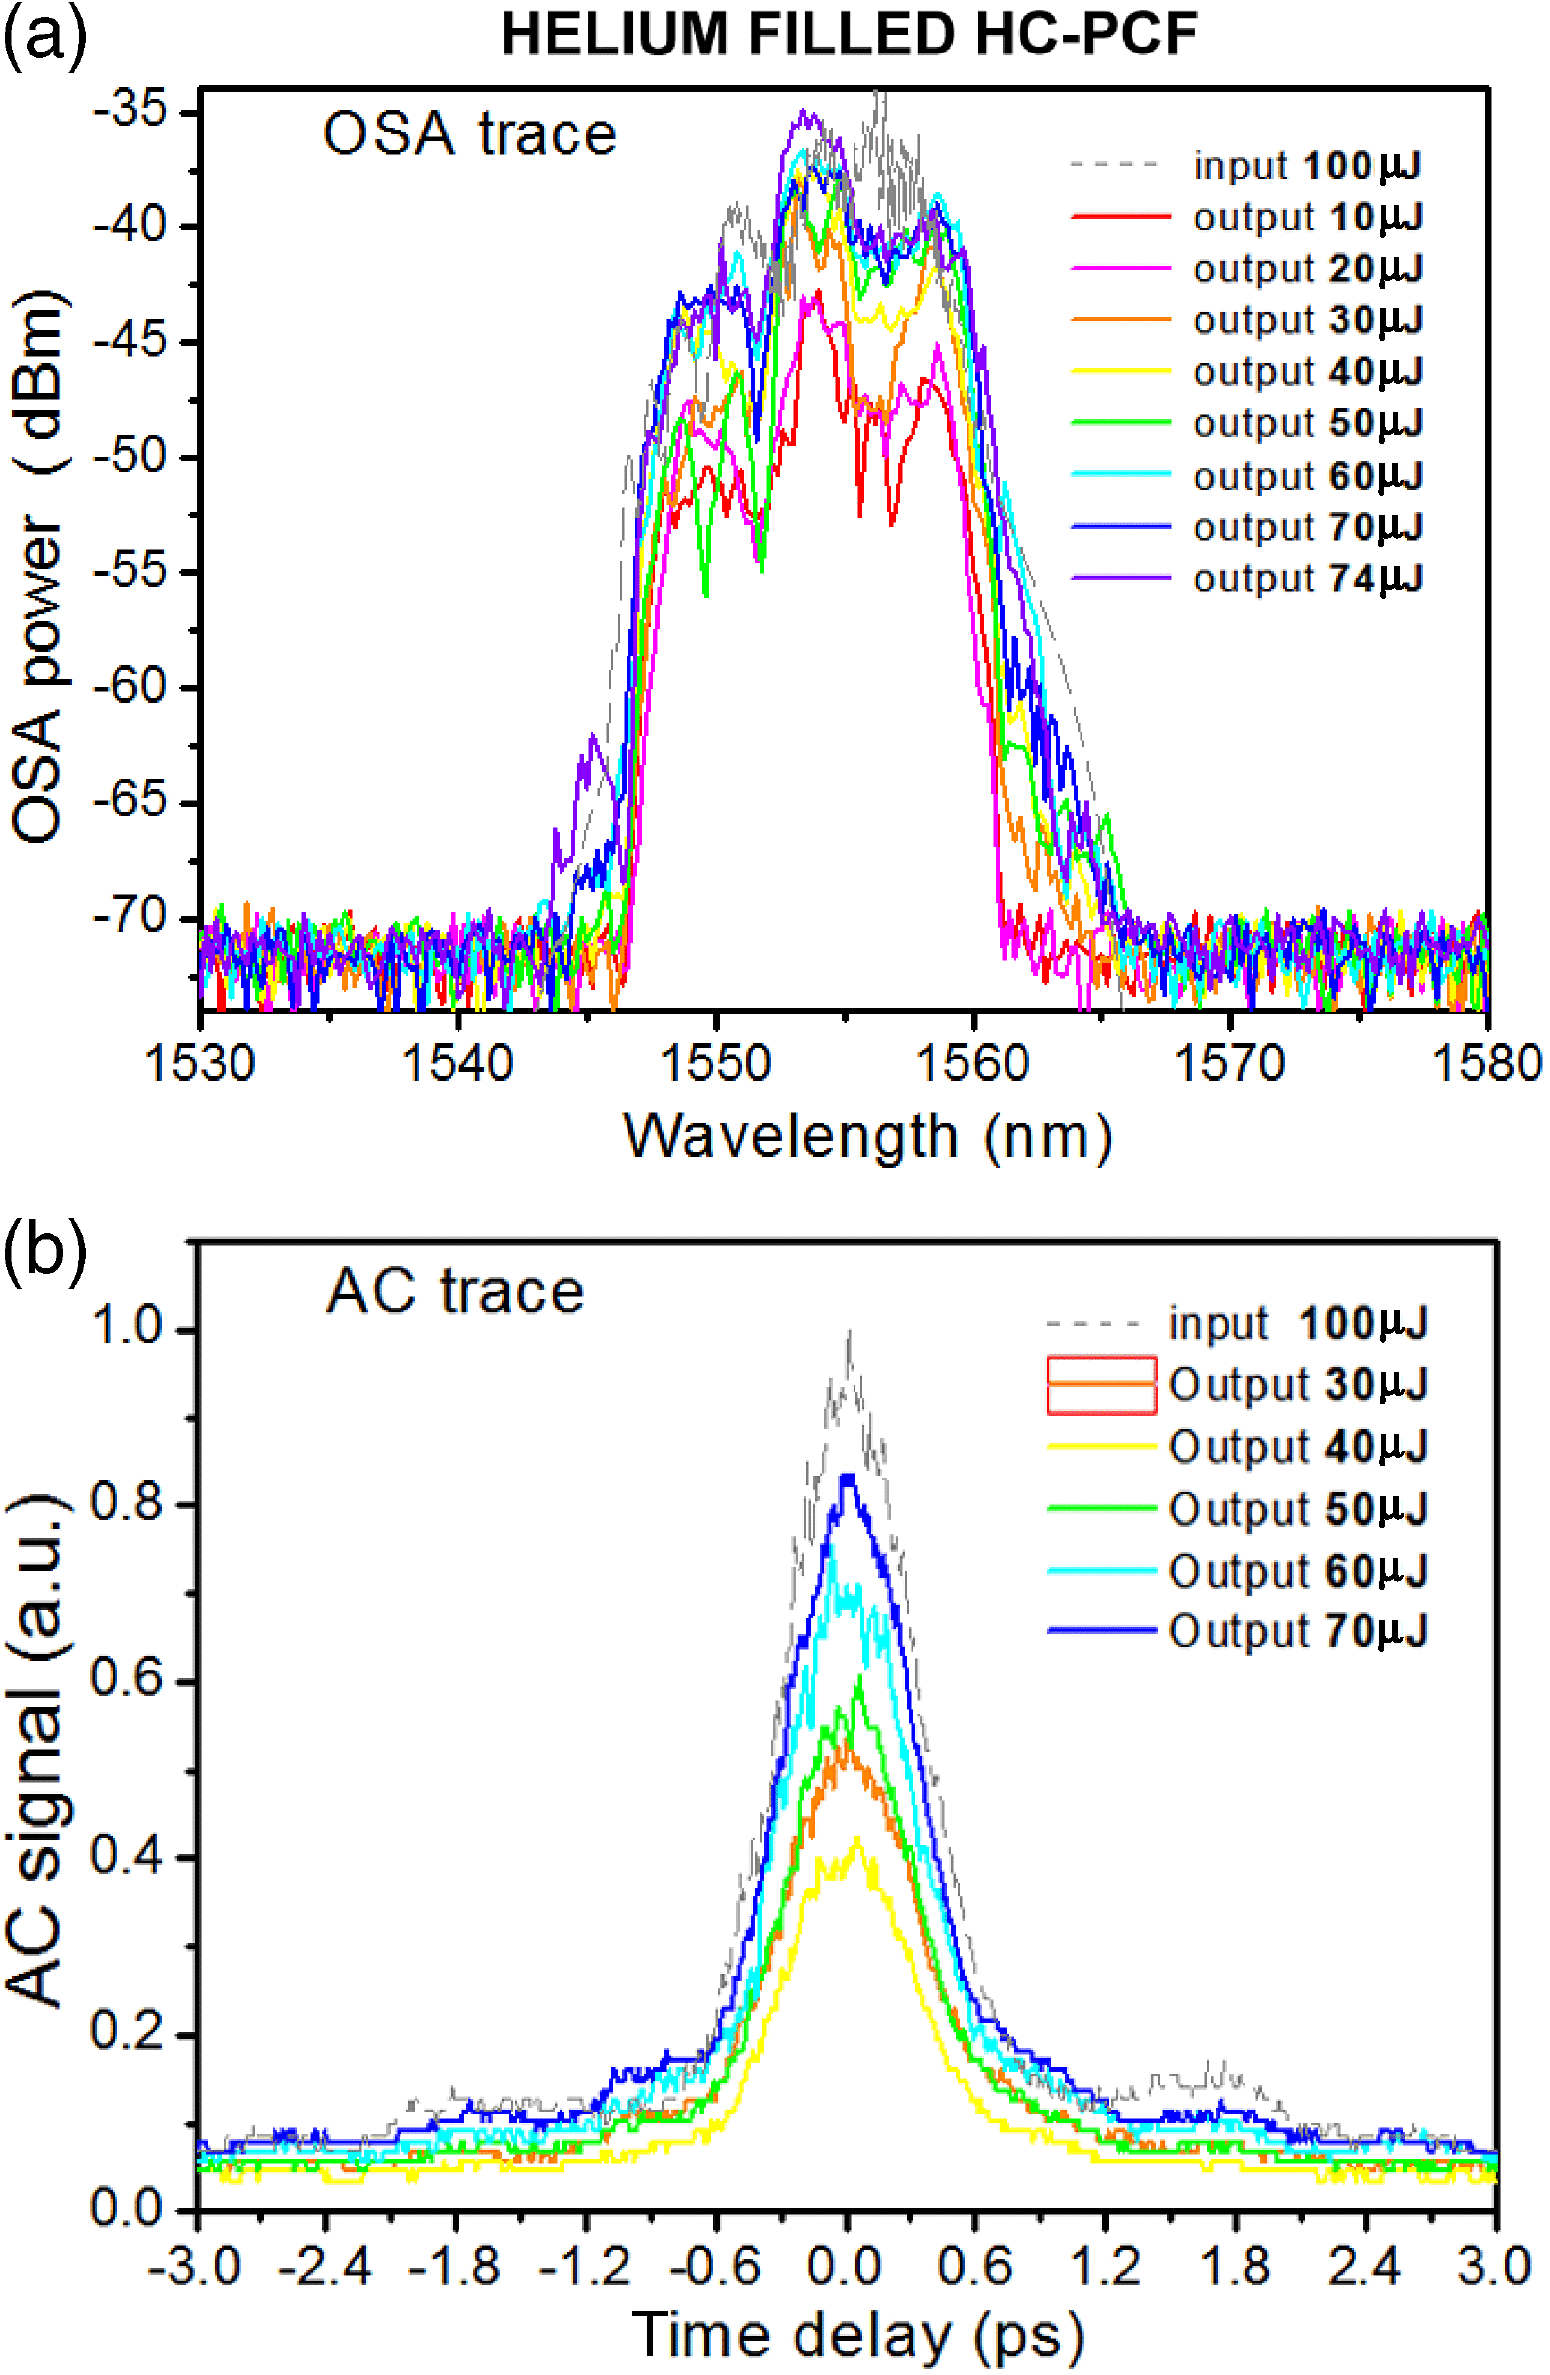
Figure 11 shows the spectral and temporal trace of the delivered pulse with different energies. As a reference, the input pulse is first monitored as shown in the grey dashed curve for (a) the OSA trace and (b) the AC trace. By rotating the HWP at the input, different output pulse energies have been obtained. Figure 11(a) shows the OSA spectrum for output energies varying from 10 to  $74~\mathrm{\mu} \mathrm{J} $ with different coloured curves. One can see that there are minor changes among these spectra. Similarly in Figure 11(b), AC traces with different output energy from 30 to
  $70~\mathrm{\mu} \mathrm{J} $ show negligible changes. The temporal pulse width at FWHM for each AC trace is measured as shown in Figure 12 by solid black square points. The pulses have an FWHM of 830 fs, 837 fs, 803 fs, 854 fs and 844 fs, respectively, all similar to that of the input pulse (850 fs). These results show the shape of the pulse in both the frequency domain and the time domain has been well maintained with insignificant optical nonlinearity and propagation linear dispersion, thanks to the high performance of the fibre. This is so, even when the input peak intensity exceeds
  $5~\mathrm{TW} / {\mathrm{cm} }^{2} $. It is noteworthy the highest output pulse energy of
  $74~\mathrm{\mu} \mathrm{J} $ is limited by the maximum input laser pulse energy of
  ${\sim }100~\mathrm{\mu} \mathrm{J} $. The coupling efficiency here is not as high as 90% (obtained with low input energy), probably because of slight coupling drift. However, with
  $74~\mathrm{\mu} \mathrm{J} $ output pulse energy obtained, no damage to the fibre has been observed. This value is much higher than previously reported ultra-short pulse delivery using HC-PCF which is usually less than
  $10~\mathrm{\mu} \mathrm{J} $[Reference Peng, Mielke and Booth36,Reference Heckl, Baer, Kränkel, Marchese, Schapper, Holler, Südmeyer, Robinson, Tisch, Couny, Light, Benabid and Keller37] . Furthermore, the
  $100~\mathrm{\mu} \mathrm{J} $ pulse transported by the fibre corresponds to a fluence of
  $6~\mathrm{J} / {\mathrm{cm} }^{2} $, which is 3 times larger than the fused silica laser damage threshold with sub-picosecond pulses. It is very likely that the fibre can handle more pulse energy if a more powerful laser is available.
Spectral and temporal profiles of the deliver pulse trains when the fibre is filled with helium. (a) Optical spectra of the fibre input pulses with energy of  $100~\mathrm{\mu} \mathrm{J} $ (grey dashed curve) and output pulses with energies of
  $10~\mathrm{\mu} \mathrm{J} $ (red),
  $20~\mathrm{\mu} \mathrm{J} $ (pink),
  $30~\mathrm{\mu} \mathrm{J} $ (orange),
  $40~\mathrm{\mu} \mathrm{J} $ (yellow),
  $50~\mathrm{\mu} \mathrm{J} $ (green),
  $60~\mathrm{\mu} \mathrm{J} $ (cyan),
  $70~\mathrm{\mu} \mathrm{J} $ (blue) and
  $74~\mathrm{\mu} \mathrm{J} $ (purple). (b) intensity autocorrelation traces of fibre input pulses with energy of
  $100~\mathrm{\mu} \mathrm{J} $ (grey dashed curve) and output pulses with energies of
  $30~\mathrm{\mu} \mathrm{J} $ (orange),
  $40~\mathrm{\mu} \mathrm{J} $ (yellow),
  $50~\mathrm{\mu} \mathrm{J} $ (green),
  $60~\mathrm{\mu} \mathrm{J} $ (cyan),
  $70~\mathrm{\mu} \mathrm{J} $ (blue)[Reference Wang, Peng, Alharbi, Fourcade Dutin, Bradley, Gérôme, Mielke, Booth and Benabid32].
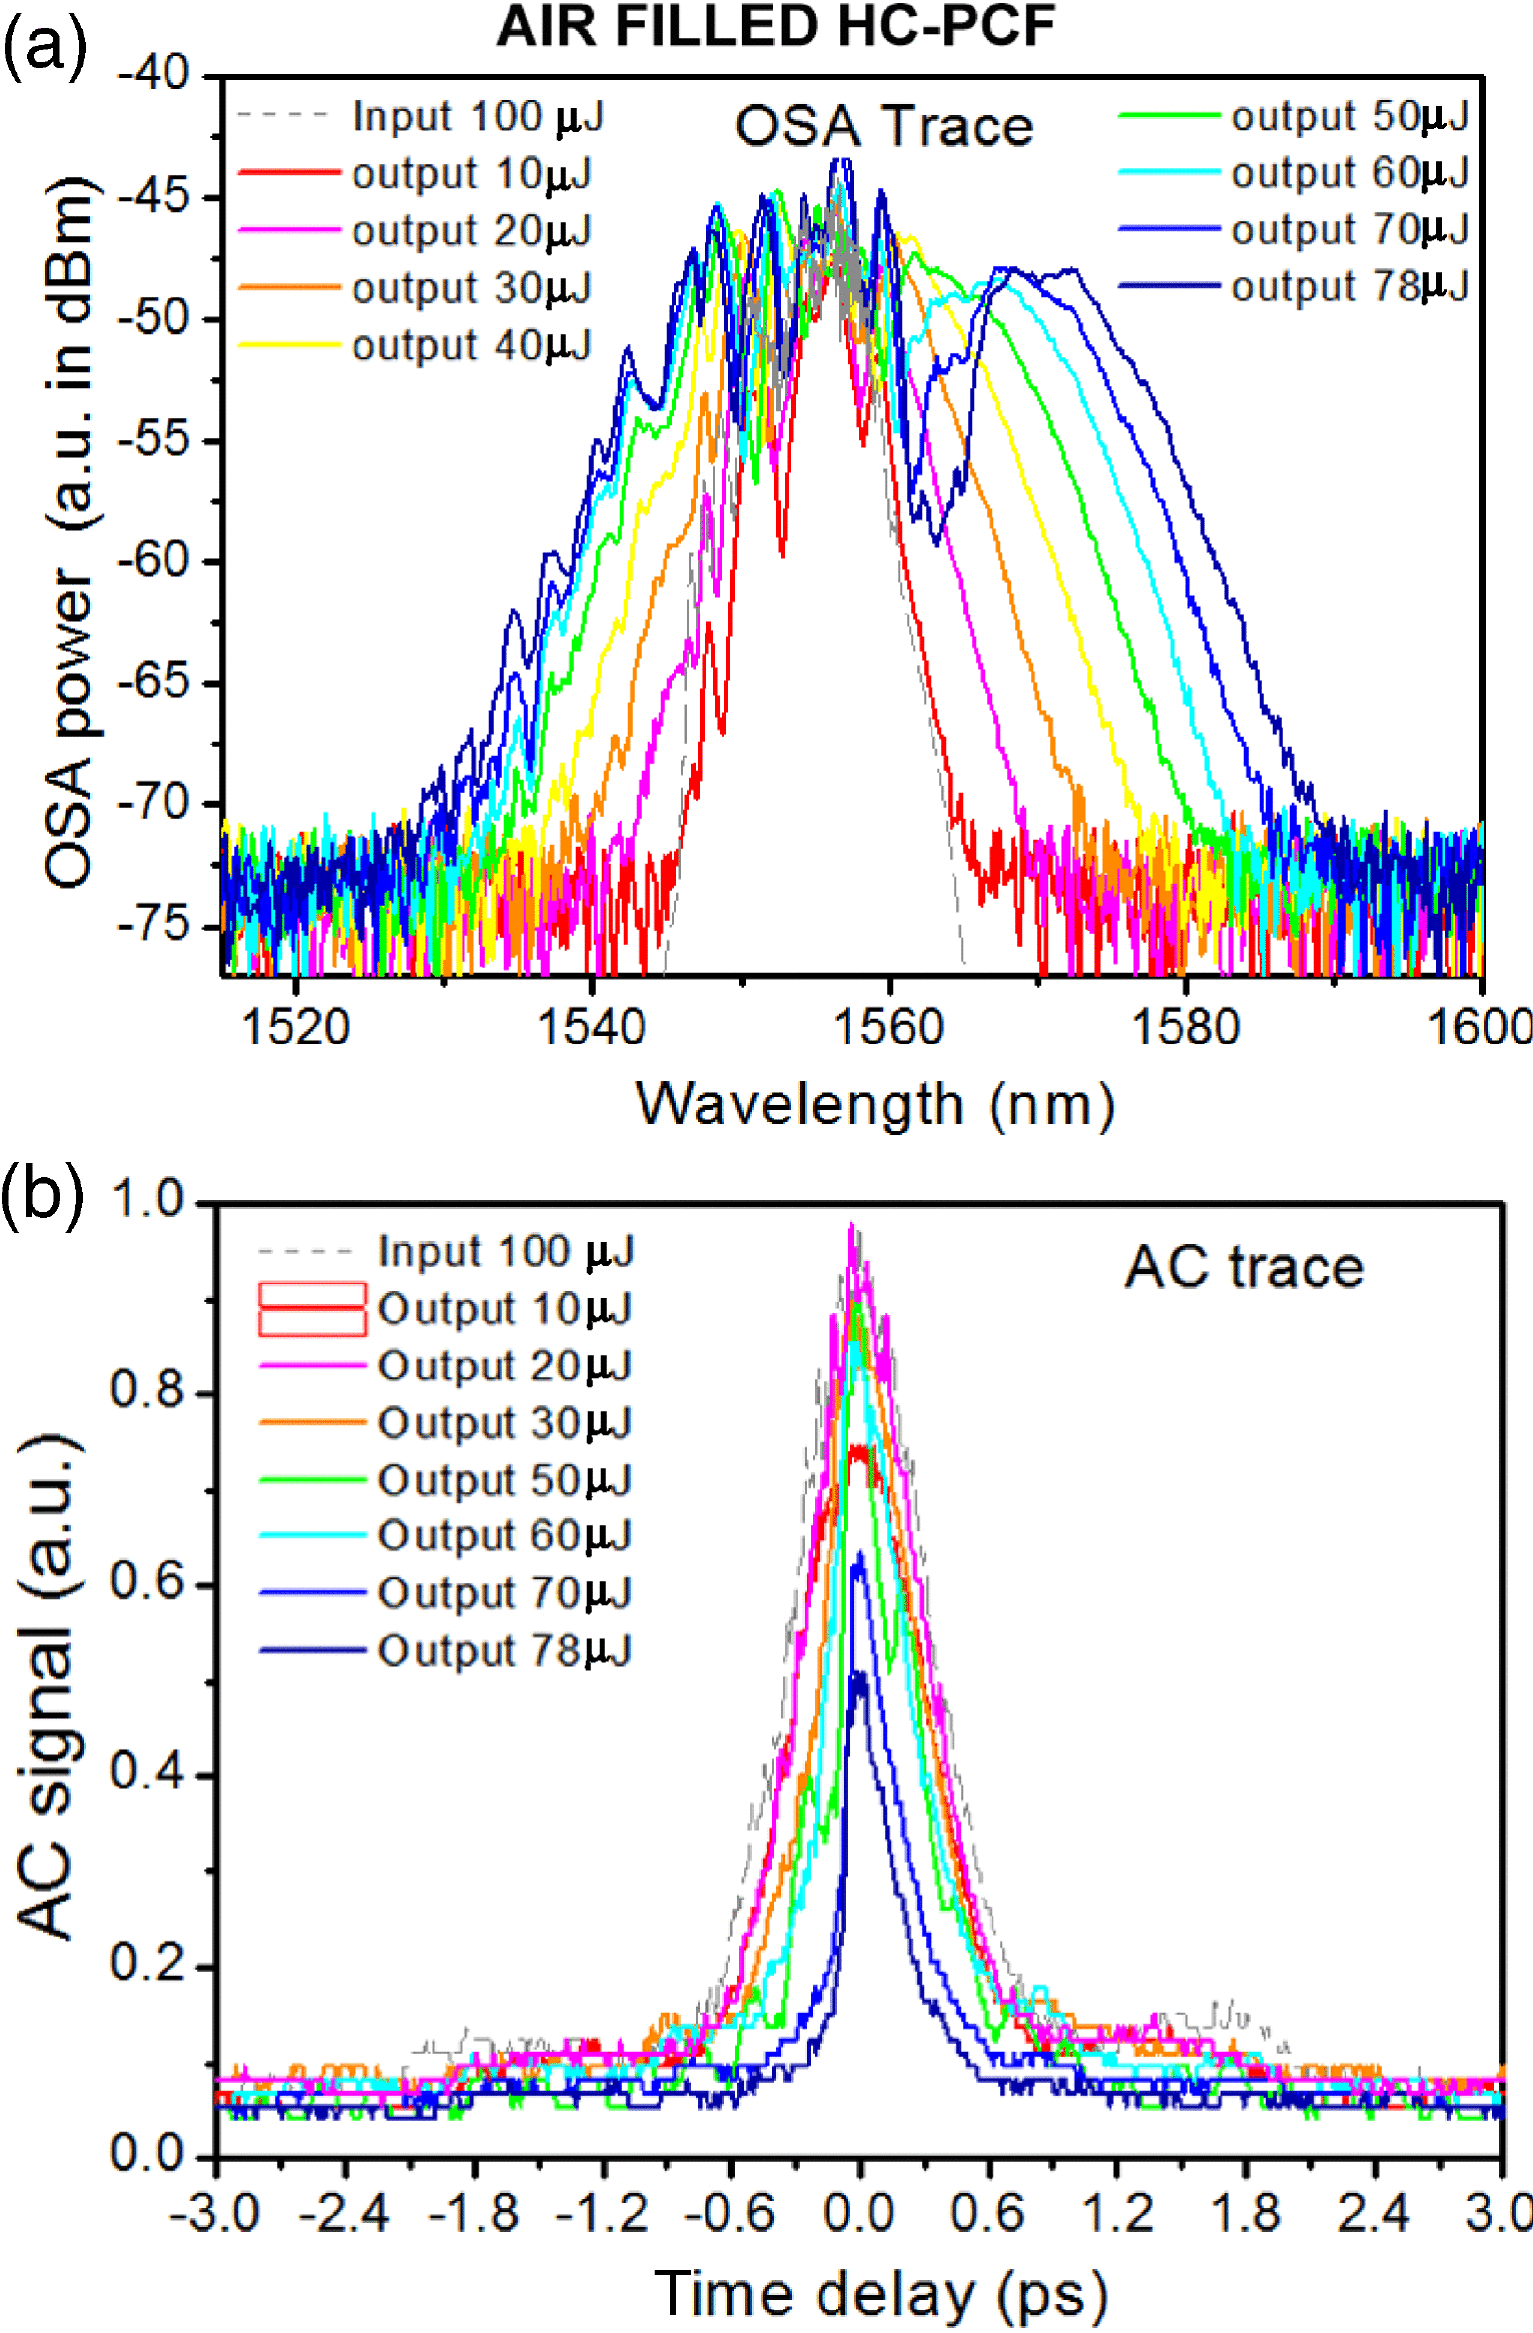
For the pulse compression experiment, the experimental protocol is similar to the one described above except that the Kagome fibre is exposed to the ambient air since air has  ${n}_{2} $ of
 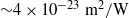 ${\sim }4\times 1{0}^{- 23} ~{\mathrm{m} }^{2} / \mathrm{W} $. Figure 13 summarizes the results. The input pulse shape is shown in the grey dashed curve for both the OSA trace and the AC trace. With
  $10~\mathrm{\mu} \mathrm{J} $ energy, the onset of spectral broadening is observed as shown in Figure 13(a) by the red curve. By increasing the input energy, the broadening of the output spectra is much clearer, proportional to the input pulse energy, as shown in different colours in Figure 13(a). The near-symmetrical broadening of the spectra is indicative of self-phase modulation (SPM) being the dominant optical nonlinear mechanism. This is corroborated with the temporal pulse traces shown in Figure 12(b). Pulse compression down to
  ${\sim }300$ fs has been observed (Figure 13(b) purple curve) when the input pulse energy is at the maximum of
  $105~\mathrm{\mu} \mathrm{J} $ and the output pulse energy is
  $78~\mathrm{\mu} \mathrm{J} $. It is noteworthy that the compression was achieved directly from the fibre output as one would expect from an anomalous dispersive media[Reference Anderson, Desaix, Lisak and L Quiroga-Teixeiro47]. This means a peak power of 240 MW and peak intensity exceeding
  $10~\mathrm{TW} / {\mathrm{cm} }^{2} $, which is more than twice that of the original pulse.
Spectral and temporal profiles of the compressed pulse trains when the fibre is in ambient air. (a) Optical spectra of the fibre input pulses with energy of  $100~\mathrm{\mu} \mathrm{J} $ (grey dashed curve) and output compressed pulses with energies of
  $10~\mathrm{\mu} \mathrm{J} $ (red),
  $20~\mathrm{\mu} \mathrm{J} $ (pink),
  $30~\mathrm{\mu} \mathrm{J} $ (orange),
  $40~\mathrm{\mu} \mathrm{J} $ (yellow),
  $50~\mathrm{\mu} \mathrm{J} $ (green),
  $60~\mathrm{\mu} \mathrm{J} $ (cyan),
  $70~\mathrm{\mu} \mathrm{J} $ (blue) and
  $78~\mathrm{\mu} \mathrm{J} $ (purple). (b) Intensity autocorrelation traces of fibre input pulses with energy of
  $100~\mathrm{\mu} \mathrm{J} $ (grey dashed curve) and output compressed pulses with energies of
  $10~\mathrm{\mu} \mathrm{J} $ (red),
  $20~\mathrm{\mu} \mathrm{J} $ (pink),
  $30~\mathrm{\mu} \mathrm{J} $ (orange),
  $50~\mathrm{\mu} \mathrm{J} $ (green),
  $60~\mathrm{\mu} \mathrm{J} $ (cyan),
  $70~\mathrm{\mu} \mathrm{J} $ (blue) and
  $78~\mathrm{\mu} \mathrm{J} $ (purple). Note that the AC signal intensity is in arbitrary units and does not correspond to the power level[Reference Wang, Peng, Alharbi, Fourcade Dutin, Bradley, Gérôme, Mielke, Booth and Benabid32].
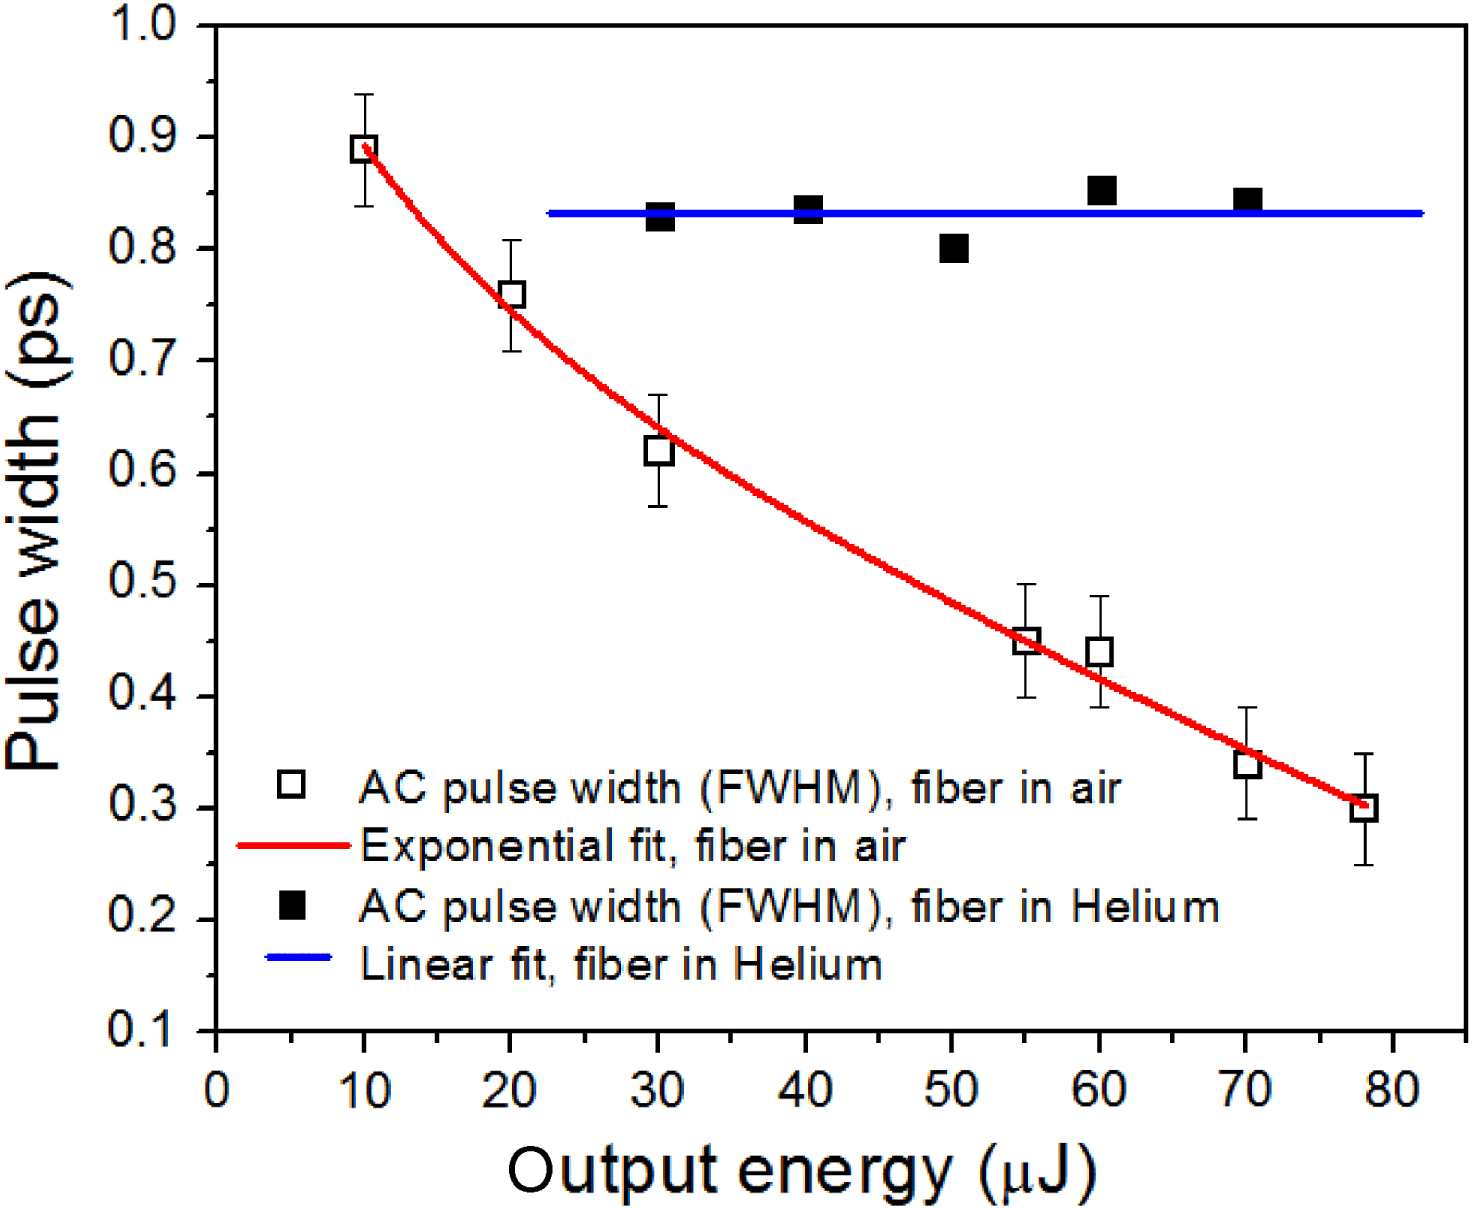
The evolutions of the pulse duration versus pulse energy for both helium-filled fibre and air-filled fibre are plotted in Figure 12, where one can see clearly the faithful pulse transportation (solid black square points) and the pulse compression (open black squared points). In the future, by using a more powerful laser, delivery and compression of a pulse with more energy is possible.
FWHM pulse durations of the output pulses as a function of output pulse energies. Solid black square: fibre in helium. The blue line is a linear fit. Open black square: fibre in air. The vertical line shows the error bar. The red curve is an exponential fit[Reference Wang, Peng, Alharbi, Fourcade Dutin, Bradley, Gérôme, Mielke, Booth and Benabid32].
5. Conclusion
Detailed comparisons between bandgap HC-PCF, conventional Kagome HC-PCF and hypocycloid-core Kagome HC-PCF are carried out in this paper. Hypocycloid-core type Kagome HC-PCF is proved to be an excellent means for high power beam delivery. Millijoule nanosecond laser spark ignition is implemented by using both conventional and hypocycloid-core Kagome HC-PCF. The hypocycloid-core type Kagome HC-PCF is further applied in high power sub-picosecond laser pulse transportation and compression. In the future, by further optimizing the fibre properties, we expect the laser-induced damage threshold be further increased to meet the beam-delivery requirements of increasingly powerful short-pulse lasers.

 Open access