


1. Introduction
There are substantial individual differences in the age and rate at which children acquire vocabulary. These emerge early and increase in magnitude over time (e.g., Fenson et al., Reference Fenson, Dale, Reznick, Bates, Thal, Pethick and Stiles1994). Evidence from the Stanford Wordbank (http://wordbank.stanford.edu) suggests that this variance in vocabulary acquisition is a cross-linguistic phenomenon (Frank, Braginsky, Yurovsky, & Marchman, Reference Frank, Braginsky, Yurovsky and Marchman2017); in 23 different languages, 12-month-olds on the 80th percentile produce an average of 13 words, whereas those on the 20th percentile produce around 1.23 words. Although many of the children with the smallest vocabulary sizes at this age will ultimately be diagnosed with a developmental language disorder, there remain substantial and meaningful developmental differences among children in the typical range. Understanding the causes of these differences is a crucial step towards building comprehensive models of language acquisition. Previous studies of typically developing children have considered whether individual differences in vocabulary development are the result of variance in the children’s environment (e.g., parental input: Hoff, Reference Hoff2006) and cognitive abilities (e.g., speed of linguistic processing: Fernald, Perfors, & Marchman, Reference Fernald, Perfors and Marchman2006; phonological working memory: Gathercole & Baddeley, Reference Gathercole and Baddeley1989; and statistical learning: Kidd, Junge, Spokes, Morrison, & Cutler, Reference Kidd, Junge, Spokes, Morrison and Cutler2018). The aim of the present study was to examine whether the capacity to understand complex dynamic events in the world is also a contributing factor by testing these skills at the earliest stages of vocabulary development. That is, at 9 to 10 months old, do individual differences in representations of the conceptual world form part of the explanation for the variance observed in vocabulary development?
Since the relationship between words and their referents can be seen as largely arbitrary (Saussure, Reference Saussure, Bally, Sechehaye and Harris1916), it is often assumed that word meaning is derived from the visual–spatial understanding of events. Mandler (Reference Mandler1992) argued that perceptual analysis is critical in developing meaning representations that support later language learning. Part of this analysis involves abstraction from the low-level visual input into higher-level image schemas: complex relational representations of events (see Figure 1 for an example of caused motion), which according to cognitive linguistic accounts of linguistic knowledge are central to language representation (Langacker, Reference Langacker1987; Talmy, Reference Talmy1988) and language acquisition (Tomasello, Reference Tomasello2003). Although there is variation across languages in the visual–spatial components that are expressed in language (e.g., Korean verbs distinguish tight/loose fit; Choi & Bowerman, Reference Choi and Bowerman1991), many of the visual features that can be expressed in language are present universally before language acquisition begins (Chang, Choi, & Ko, Reference Chang, Choi and Ko2015; Hespos & Spelke, Reference Hespos and Spelke2004). Therefore, speakers’ shared understanding of language meaning must be based on some shared non-linguistic understanding of events, and visual–spatial information appears to be the most likely source.
An illustration of Michotte’s (Reference Michotte1946) launching display.

In this study, we test the idea that, if language meaning depends on the ability to understand events perceptually, then variation in vocabulary acquisition may depend on variation in visual–spatial event understanding. Since visual perception is a complex system with many subcomponents (Marr, Reference Marr1982), it is necessary to restrict our examination of this relationship to a small set of features. To do this, we selected three aspects of event understanding that have been tested in infants: causality, durational actions, and goal-directed actions. These components were selected to be as abstract as possible, such that they could potentially apply to a wide range of words.
The first feature we examined was causality between two entities, which is critical to distinguish verbs that describe self-generated motion and those that describe externally caused motion (e.g., “the car moved” vs. “he pushed the car”). Nouns are also defined in terms of causal features (e.g., a match is a stick that causes fire when contact is made with another object). Causality is a very general concept that applies across a range of events, but it is most easily seen in scenes of pushing. Research on causality in these types of scenes was pioneered by Michotte (Reference Michotte1946), who tested adult participants on their perception of visual scenes using launching displays illustrated in Figure 1. In these scenes, shape A moved directly towards shape B, which was stationary. When shape A made physical contact with shape B, shape A stopped moving and shape B immediately moved away along the same trajectory. Viewers reliably interpreted these sequences as causal events in which shape A launches shape B into motion, akin to one billiard ball hitting another, even though these were animated static images without any causal link in the motion (Hume, Reference Hume and Beauchamp1748). Similar launching event studies have found that infants can discriminate causal from non-causal events (Leslie, Reference Leslie1982, Reference Leslie1984; Leslie & Keeble, Reference Leslie and Keeble1987; Oakes, Reference Oakes1994; Oakes & Cohen, Reference Oakes and Cohen1990), but that the impression of causality is reduced in adults and children when there is no contact between the objects or when there is a delay in the launching of the second object. For example, Oakes and Cohen (Reference Oakes and Cohen1990) habituated 6- and 10-month-olds to either a causal launch display (Figure 1) or a non-causal delayed launching or no collision display. They were then shown novel non-causal or causal displays, respectively. The 10-month-olds, but not the 6-month-olds, showed a significant increase in looking to the event type that differed in causality from the event seen during habituation. This suggests that, by 10 months, infants can distinguish between causal and non-causal events based on only spatial and temporal characteristics. Importantly, these looking patterns were not attributable to the novelty of the alternative event; when habituated to a non-causal event, the infants dishabituated to a novel causal event but not to a novel non-causal event. According to the authors, this showed that the infants had identified the similarity in causality status between the familiar and novel non-causal events. Other studies have shown that infants as young as 6 months make similar distinctions (Cohen & Amsel, Reference Cohen and Amsel1998; Leslie, Reference Leslie1984), though, in this case, performance was sensitive to the specific objects involved in the events (e.g., changing the agent and patient between trials affected performance; Cohen & Oakes, Reference Cohen and Oakes1993). Overall, this work suggests that infants can already understand some of the features used to identify agents and patients in causal events at the very early stages of language acquisition.
Causal pushing events focus on the brief interaction between objects around contact, but many events require that children aggregate information over a period of time. For example, walking and running can only be distinguished by observing the action over time (running leads to more movement). Likewise, some noun-referents, like snack and meal, can be distinguished by the way that they are performed over time (a meal involves eating over a longer period of time). Thus, another ability that is important for understanding word meaning is the ability to track objects’ interactions over time. This ability is tapped in studies of chasing events (Gao, Newman, & Scholl, Reference Gao, Newman and Scholl2009; Gao & Scholl, Reference Gao and Scholl2011), where participants see identical objects on the screen and must identify the chaser in the event. Participants do this by tracking the angle of motion of all the objects relative to the other objects (the chaser moves towards the chasee). Frankenhuis, House, Barrett, and Johnson (Reference Frankenhuis, House, Barrett and Johnson2013) have shown that 4- and 10-month-old infants can distinguish a chasing relationship from a scene with random motion. By manipulating different aspects of the chasing motion, the authors showed that the preference for chasing was primarily due to two visual cues; the acceleration of the patient to “escape” the agent, and the “heat-seeking” attraction of the agent to the patient. This is consistent with the findings of other infant studies using an eye-tracking paradigm (Galazka & Nyström, Reference Galazka and Nyström2016), and experiments with older children or adult participants (Barrett, Todd, Miller, & Blythe, Reference Barrett, Todd, Miller and Blythe2005; Gao et al., Reference Gao, Newman and Scholl2009; Gao & Scholl, Reference Gao and Scholl2011; Meyerhoff, Papenmeier, Jahn, & Huff, Reference Meyerhoff, Papenmeier, Jahn and Huff2013).
Third, and finally, many word meanings are distinguished by observable physical changes. For example, children come to understand that the word “try” refers to intending to do something, while the phrase “by accident” is used when an action was unintentional (Astington, Reference Astington1986). Work on child social cognition has found that infants can also use motion cues to infer the intentions and goals motivating an agent’s behaviour (e.g., Csibra, Reference Csibra2008; Csibra, Gergely, Bıŕó, Koós, & Brockbank, Reference Csibra, Gergely, Bıŕó, Koós and Brockbank1999; Gergely, Nádasdy, Csibra, & Bíró, Reference Gergely, Nádasdy, Csibra and Bíró1995; Luo, Reference Luo2011; Luo & Baillargeon, Reference Luo and Baillargeon2005; Shimizu & Johnson, Reference Shimizu and Johnson2004; Woodward, Reference Woodward1998). Luo (Reference Luo2011) examined whether 3-month-old infants can attribute goals and preferences to objects that appeared to be inanimate. The infants saw physical object displays containing a moving box positioned between a cone and a cylinder. They were familiarised to a scene in which the box repeatedly approached one of the objects, before being tested on trials where the box either approached the alternative object or continued to approach the original object. It was found that infants watched for longer when the box approached the new object than the old object, even when the location of the target objects was switched (i.e., when the direction of movement towards the new object matched the familiarisation trials). Luo suggested that the infants see the box as having a preference for the old object and hence they were surprised to see it switch goals. Other research has similarly found that infants will attribute goals and intentions to simple shapes (for a review, see Baillargeon, Scott, & Bian, Reference Baillargeon, Scott and Bian2016). Collectively, these studies suggest that the critical feature that triggers the perception of agency is evidence of internal control, such as when a self-propelled agent consistently chooses to approach a goal object, even after it has changed position in the display. Infants also appear to make goal attributions based on an expectation that agents will act rationally; for example, taking the shortest available path to reach the goal object (e.g., Csibra et al., Reference Csibra, Gergely, Bıŕó, Koós and Brockbank1999; Gergely et al., Reference Gergely, Nádasdy, Csibra and Bíró1995).
In sum, infants appear to be capable of using spatial and motion cues to identify physical causality by 10 months (Oakes & Cohen, Reference Oakes and Cohen1990), intentional chasing by 4 months (Frankenhuis et al., Reference Frankenhuis, House, Barrett and Johnson2013), and goal-directed behaviour by 3 months (Luo, Reference Luo2011). However, it is unclear whether there are meaningful individual differences in these abilities; that is, whether some children have a deeper understanding of complex dynamic events or are faster at processing such visual scenes compared to others of the same age. There is reason to think that this may be the case since robust individual differences with developmental implications have been observed in a range of cognitive domains. For example, rate of habituation (i.e., speed of decrement of attention to a repeatedly presented stimulus) and recognition memory (i.e., ability to discriminate between familiar and unfamiliar stimuli) in infants younger than 1 year have been reported, and even shown to meaningfully predict IQ in later childhood (e.g., Bornstein & Sigman, Reference Bornstein and Sigman1986; Kavšek, Reference Kavšek2004; McCall & Carriger, Reference McCall and Carriger1993). Yet, Gampe, Keitel, and Daum (Reference Gampe, Keitel and Daum2015) observed a lack of individual consistency in infants’ anticipatory looking times when they were regularly tested between the ages of 7 and 12 months with an action-perception task where an agent reaches for a ball and drops it into a bucket (see also Melzer, Prinz, & Daum, Reference Melzer, Prinz and Daum2012). Thus, the first aim of the present work was to test whether there are meaningful individual differences in the ability of 9- to 10-month-olds to interpret caused-motion (Oakes & Cohen, Reference Oakes and Cohen1990), chasing interactions (Frankenhuis et al., Reference Frankenhuis, House, Barrett and Johnson2013), and goal-directed behaviour (Luo, Reference Luo2011). Since all three tasks tap into some aspect of the child’s conceptual understanding, it is reasonable to assume that we would expect to find correlations across the three tasks; for example, that children with sophisticated conceptual understanding in one task (e.g., discriminating causal from non-causal motion events) should also demonstrate sophisticated conceptual understanding in another (e.g., discriminating goal-directed from non-goal-directed events).
The three tasks used in the present research used habituation/familiarisation (in the case of caused-motion and goal-directed behaviour) and preferential looking (in the case of chasing) designs. Extracting measures of individual differences in these three tasks presents a methodological challenge. In habituation/familiarisation designs, children are habituated to one stimulus (i.e., a stimulus is repeatedly presented), before being shown a novel stimulus. In preferential looking designs, children are shown two events simultaneously (e.g., a chasing event vs. random movement). In both designs, the outcome measure is a looking-time difference analysed at the group level; if the infants, as a group, tend to look for longer at one event than the other, all infants at that age are credited with the relevant ability. However, to test for individual differences, we need to assess the outcome of these tasks at the participant level. In this study, we used looking-time differences, relying on the assumption that individual looking-time differences are meaningful indicators of an infant’s ability. This assumption is validated by previous research, which has observed robust relationships between vocabulary knowledge and looking times across a range of tasks, including those assessing lexical speed of processing (Fernald et al., Reference Fernald, Perfors and Marchman2006; Lany, Reference Lany2018), recognition memory (Gathercole & Baddeley, Reference Gathercole and Baddeley1989), statistical learning (Kidd et al., Reference Kidd, Junge, Spokes, Morrison and Cutler2018), word segmentation (Singh, Steven Reznick, & Xuehua, Reference Singh, Steven Reznick and Xuehua2012), sentence processing (Mani & Huettig, Reference Mani and Huettig2012), and visual sequence learning (Shafto, Conway, Field, & Houston, Reference Shafto, Conway, Field and Houston2012). Note too, that the use of parametric tests to analyse group behaviour in infant looking-time studies also assumes that individual differences in looking times directly measure performance. For example, in the causal motion study of Oakes and Cohen (Reference Oakes and Cohen1990), the statistical tests used rely on the assumption that a child who dishabituates more (i.e., looks substantially longer at the novel than the habituated event) not only knows more about causal motion than a child who does not dishabituate at all, but also knows more than a child who only dishabituates a little (i.e., only looks a little longer at the novel event). Thus, for present purposes, looking-time differences are treated as direct measurements of infants’ event understanding (to foreshadow the results, the findings suggest that this may not be a legitimate assumption; the implications of this for the interpretation of looking-time measures more generally are considered further in the ‘General discussion’).
The second aim of the present research was to determine whether infants’ ability to interpret complex events influences their ability to learn new words. All theories of language acquisition assume that visual–spatial event understanding is an important part of language acquisition (Goldin-Meadow & Mylander, Reference Goldin-Meadow and Mylander1998; Landau & Jackendoff, Reference Landau and Jackendoff1993; Mandler, Reference Mandler1992; Tomasello & Vaish, Reference Tomasello and Vaish2013). To date, the nature of this relationship has not been tested. In this work, we examined whether individual differences in looking times on our three event perception tasks at 9–10 months predicted overall vocabulary size, and action verb vocabulary size, both concurrently and longitudinally.
In sum, the goal of this study was to determine whether there are individual differences in infants’ ability to represent dynamic causal events in visual scenes and whether these differences contribute to individual differences in vocabulary size. Infants aged between 9 and 10 months took part in three studies designed to investigate their ability to interpret dynamic causal events; a caused-motion event (Oakes & Cohen, Reference Oakes and Cohen1990), a chasing event (Frankenhuis et al., Reference Frankenhuis, House, Barrett and Johnson2013), and a goal-directed event (Luo, Reference Luo2011). Infants were tested at 9–10 months, since this is the point at which children are starting to learn to comprehend, if not produce, words. Thus, their ability to learn may be influenced by their conceptual representations. By the age tested, above-chance performance at the group level is observed in all three of the original versions of these tasks. Whilst 9–10 months is an older age than was tested in the original versions of two of these tasks (goal-directed behaviour and intentional chasing), there is no empirical reason to assume that there will be no meaningful variation in their understanding at a later time-point. First, we assessed whether the group effects reported by the original authors could be replicated. Second, we tested whether looking-time behaviour in these tasks provided reliable, and correlated, measures of individual differences in ability. Finally, we examined whether individual differences correlated with concurrent and later vocabulary size. The results of our planned analyses are dependent on two critical assumptions about how event knowledge can be measured in infants. First, it is commonly, and implicitly, assumed that looking times linearly reflect knowledge, such that longer looking times are indicative of a deeper understanding of the stimulus. The second assumption is that the type of looking preference (novelty or familiarity) is meaningful. In a series of exploratory analyses and simulations, we tested the validity of these assumptions.
2. Method
We tested whether 10-month-old infants could interpret dynamic events in three tasks requiring the attribution of caused-motion, chasing, and goal-directed action. Data on vocabulary size were collected at multiple time-points using parent-completed questionnaires and the full Bayley Scales of Infant and Toddler Development, Third Edition (BSID-III; Bayley, Reference Bayley2006) was administered at 16–17 months.
2.1. participants
These studies form part of a larger longitudinal project in the northwest of England called the Language 0–5 Project. Ninety-five typically developing monolingual participants were recruited to take part at the outset of the project (see <https://osf.io/wdy7c/>). The three experimental studies presented here were completed in a single session when the participants were aged between 9 and 10 months. A total of 78 infants (41 females) attended this session (mean age = 9;24 months, range = 9;12–10;18).
2.2. materials and procedure
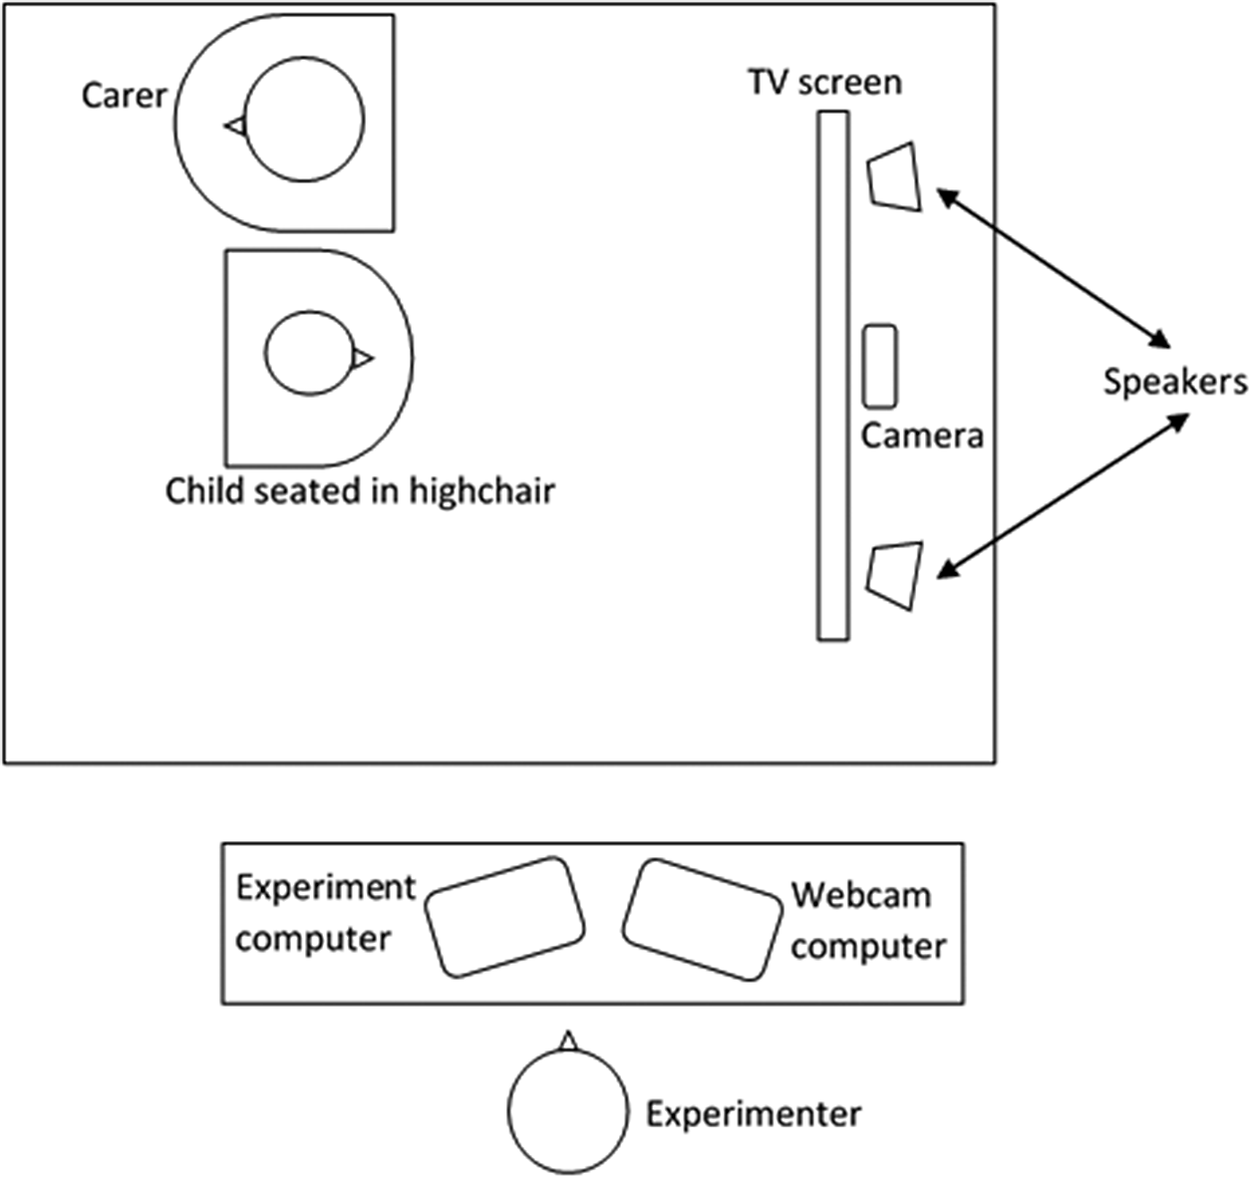
For all three studies, infants were seated either in a high-chair (with their caregiver to their left facing away from the screen) or on their parents’ lap 60cm away from a widescreen TV (3846  $ \times $ 1080). During testing, infants were allowed a dummy/pacifier or snack if required. Studies were presented using the Look program (Meints, Plunkett, & Harris, Reference Meints, Plunkett and Harris2008), and controlled by an experimenter monitoring the infant’s behaviour via a webcam (see Figure 2 for set-up). In all tasks, trials were initiated by the experimenter when the infant was looking towards the screen, although there were differences in the durations the stimuli were presented for and in how trials were terminated (further details are provided in the next section). These differences between tasks were maintained to adhere to the original designs as closely as possible. As we were testing older children than in the original studies and on multiple tasks in a single session, we aimed to replicate every task as closely as possible so as to minimise the reasons for any failure to replicate. Each task was presented twice during the session, with presentation order organised into three pairings. All infants completed the tasks in the same order, with each task presented both in the first and second position within a pairing. Between pairings, there was a short play break where infants left the testing booth and played with the experimenter and their caregiver. The duration of the break between pairings varied for each infant (M = 10:22 minutes, range = 1:43–22:10 minutes). The structure of the testing session was as follows:
1. Task 1a and Task 2a
2. Play break
3. Task 3a and Task 1b
4. Play break
5. Task 2b and Task 3b
Diagram of the laboratory set-up.
2.3. task 1: distinguishing causal from non-causal motion
The first task was an adaptation of Oakes and Cohen (Reference Oakes and Cohen1990) used to assess infants’ ability to distinguish between causal and non-causal events with novel inanimate objects. Oakes and Cohen presented infants aged 6 and 10 months with four different scenes of real-world objects interacting in different ways: two of the videos demonstrated two different non-causal events, one a casual event, and one a single object control event. There were two phases to each testing session, a habituation phase and a test phase. In the habituation phase, infants were shown a maximum of 20 trials displaying either the causal event or one of the non-causal events. Individual trials terminated if the infant looked away for 500 milliseconds (ms), and the habituation phase ended when the infants’ looking time in a block of 4 trials reduced below 50% of the looking time in the first four trials. Following habituation, all four events were presented, starting with the habituated event and ending with the control event. The infants showed an increase in looking to the event type they were not habituated to. Most importantly for our study, when habituated to a non-causal event, the infants increased looking to a novel causal event but not a novel non-causal event.
In the current study, we adapted the Oakes and Cohen (Reference Oakes and Cohen1990) design in three ways. First, we presented computer-generated clips of inanimate abstract 3D shapes instead of videotaped real objects, allowing us to control the characteristics of the events more carefully. Similar computer-generated stimuli have been used successfully in previous studies with younger infants (e.g., 4-month-olds; Schlottmann, Ray, & Surian, Reference Schlottmann, Ray and Surian2012). Second, we implemented a familiarisation procedure in place of habituation. We presented infants with 10 trials, each with a maximum duration of 21 seconds. Trials terminated at 21 seconds or earlier if infants looked away for two seconds continuously. Third, we ran only one condition, all infants were familiarised to a non-causal event and then tested on all four event types. In this condition, knowledge of causality is most clearly observed by increased looking to the novel causal but not the novel non-causal event.
2.3.1. Visual stimuli
Four event sequences were created based on the description in Oakes and Cohen (Reference Oakes and Cohen1990). Events were four seconds in duration and were repeated five times in each presentation. All sequences began with both objects still on screen for one second (Figure 3A). Then object A (e.g., yellow cube) moved towards object B (e.g., green cylinder) for one second. The movement of object B away from object A lasted for one second (Figure 3D). The crucial difference between the events occurred at the mid-point of the sequence. In the direct launching event (causal event), objects A and B touched and object B immediately moved away from A (as if pushed by A; Figure 3B). In the delayed launching event, the objects touched for one second before object B moved away (non-causal event 1; Figure 3B). In the indirect launching event, object A did not touch object B. Object B moved away as object A’s movement ended (non-causal event 2; Figure 3C).
Screenshots of the caused-motion stimuli showing (1) direct causal launching, (2) delayed non-causal launching, (3) no contact non-causal launching. In the direct launching trials (1), both objects are shown still on screen for 1 second (A). The first object moves towards the second object and stops upon contact (B); the second object then immediately moves away from the first to the other side of the screen (C) and then pauses for 1 second (D). In the delayed non-causal trials (2), there is a 1-second pause after contact (B–C). In the no contact trials (3), the objects never physically connect (C).

Between each sequence, a blank screen was displayed for 200ms. Event clips were created using Processing 2 software (https://processing.org) and portrayed inanimate objects: a yellow cube, green wheel, and a purple hammer in set one, and a blue cylinder, red ball, and green pyramid in set two. The objects in set one always moved from left to right on the screen and the (non-causal) familiarisation event was indirect launching. The objects in set two always moved from right to left and the (non-causal) familiarisation event was delayed launching. Half of the infants saw the set one objects first and half saw the set two objects first. In individual differences designs it is crucial to minimise item variance to ensure that any variation is due to differences between participants. We implemented a reduced counterbalancing procedure to map onto the counterbalancing in the original design without introducing too much variation into our individual differences design.
2.3.2. Procedure
Infants were shown 10 familiarisation trials in which a non-causal event was displayed. Looking duration was recorded online; a button was held down by an experimenter watching the infant via a webcam for as long as the infant was attending to the screen. Trials terminated if the infant looked away from the screen for longer than two consecutive seconds. Following familiarisation trials, four test trials began. All infants saw the familiarised non-causal event as the first test trial, followed by the causal event (novel), a new non-causal event (novel), and finally the single object control event (novel). Each test trial had a maximum duration of 21 seconds or ended when the infant looked away from the screen for two seconds continuously.
2.4. task 2: distinguishing chasing from random motion
Task 2 was based on the first experiment in Frankenhuis et al. (Reference Frankenhuis, House, Barrett and Johnson2013) and was used to determine whether infants show a preference for chasing interactions over random movement sequences involving two coloured circles on the screen. We implemented the multiple cues version of this task, to provide infants with the most complete example of chasing.
2.4.1. Visual stimuli
The stimuli used in this task were provided by Frankenhuis et al. (Reference Frankenhuis, House, Barrett and Johnson2013) and are identical to the stimuli used in their study one. Each video presented two discs, one red and one green, for a fixed duration of 20 seconds. In the chasing video, the discs depicted either the motion of a chaser or of an evader. Both discs had a turning rate of 5% and there was a 5% probability of changing direction with each pixel moved. The chaser disc approached the evader at a constant velocity of .6 pixels per frame in a ‘heat-seeking’ manner, reducing the distance between the two discs. When this distance was within 80 pixels, the evader would ‘flee’ by increasing to 4 times its baseline speed (.3 pixels per second) and turn away from the chaser. There were approximately 15 fleeing episodes per 20-second display. Control videos presented the discs moving independently. On occasions where the discs came within 60 pixels of each other, the slower one would change direction but there was no change in velocity and turning rates were lower (.005%). Thus, the videos differed on three dimensions: acceleration, turning rate, and attraction (see Figure 4).
A diagram of the chasing task. Both event types are presented side by side in a preferential looking task.

2.4.2. Procedure
Infants saw 12 trials in total, 6 in each task pairing. On each trial two videos were presented simultaneously side by side in front of the infant; one video depicted random movement (control display) and one chasing movement (target display). Trials played for a fixed duration of 20 seconds. Between trials, a smiley face appeared on screen. Trials were coded offline frame-by-frame (40 frames per second) using Score, part of the Look package (Meints et al., Reference Meints, Plunkett and Harris2008).
2.5. task 3: identifying goal-directed movement
The third task we used was an adaptation of Luo (Reference Luo2011) to identify whether infants attribute psychological goals to non-human agents. There were four phases in the task, each ended when the infant looked away for two seconds consecutively or the maximum looking time of 60 seconds was reached. In phase one, infants saw two orientation trials where a single object moved across the screen. In phase two, five familiarisation trials involving three objects, positioned to the right, centre, and left, were presented. The centre object moved towards one of the other objects and paused on contact until the trial ended. Phase three showed a still image where the left- and right-positioned objects were reversed, and the centre stimulus was absent. Phase four consisted of two test trials. In one, the box moved in the opposite direction to familiarisation but towards the same object (old goal event). In the other, the box moved in the same direction but towards the alternative object (new goal event). Luo found that infants looked longer to the new goal event than the old goal event. This was explained as the infants having attributed a psychological goal to the central object’s movement towards a particular object.
In our version of this task, we followed the same procedure but made two modifications. First, the familiarisation trials were a fixed duration of eight seconds. Second, computer-generated on-screen stimuli were used instead of real object live-action scenes.
2.5.1. Visual stimuli
A series of computer-generated scenes involving shapes were created to match, as closely as possible, the scenes described by Luo (Reference Luo2011). The stimulus set 1 presented a blue cone acting as the agent, a red diamond as the target and a yellow box as the distracter (Figure 5F), and stimulus set 2 included a green pyramid as the agent, an orange bowl as the target and a purple cross as the distractor (Figure 5A–E).
Screenshots of the goals stimuli showing (A) the single object orientation trial, (B) the familiarisation event, (C) the static display with the objects in different positions, (D) the new goal trial, (E) the old goal trial, and (F) the static novel object display.

Two orientation trials were created. In the first of these, the ‘agent’ moved from the left of the screen to the centre and back again. In the second, the ‘agent’ moved from the right of the screen to the centre and back again (Figure 5A). In both cases, the movement cycle lasted six seconds and was shown twice, resulting in a total trial duration of 12 seconds. During familiarisation trials, all three objects were presented with no movement for one second before the ‘agent’ moved towards the ‘target’ and away from the ‘distractor’ (Figure 5B). This movement lasted for three seconds. This final frame, with the ‘agent’ positioned next to the ‘target’, remained on screen for a further four seconds. The display event presented a still image of the ‘target’ and ‘distractor’ only, but in switched positions (Figure 5C). Finally, two test trials were created. In the old goal event, the ‘agent’ moved towards the ‘target’ and remained there for a maximum of 55 seconds (Figure 5E). In the new goal event, the ‘agent’ moved towards the ‘distractor’ and remained there for a maximum of 55 seconds (Figure 5D). In both test trials, the shapes were static for one second before the movement began, and the movement lasted for three seconds.
2.5.2. Procedure
Looking times were recorded online via a button held down by an experimenter observing the infant via a webcam. Infants were first presented with two orientation trials. Next, infants were shown five familiarisation trials with a fixed duration of eight seconds. Display trials followed the familiarisation and lasted a maximum of 59 seconds, ending when infants looked away for 2 consecutive seconds or the maximum duration was reached. Finally, two test events were presented: in pairing one, the old goal event was presented first, and in pairing two, the new goal event was presented first. Test events lasted a maximum of 59 seconds, or until the infant looked away for 2 seconds consecutively.
2.6. vocabulary measures
The UK-CDI (Alcock, Meints, & Rowland, Reference Alcock, Meints and Rowland2020) was administered at 8, 9, 11, 12, 15, 16, and 18 months. The UK-CDI is a checklist of the most common gestures and words, which captures UK English-speaking infants’ early communicative repertoire and is suitable for use between 9 and 18 months. Caregivers are asked to select ‘never’, ‘sometimes’, or ‘often’ for gesture items and to indicate whether their child ‘understands’ or ‘understands and says’ the vocabulary items (total possible score for both receptive and expressive vocabulary = 396). Caregivers were asked to complete the checklist before the visit, either via an online link or on a paper form according to their preference. Those who did not complete it before the visit were given a paper form to complete during the session. The UK-CDI has been standardised for the UK population and has good validity and reliability (see Alcock et al., Reference Alcock, Meints and Rowland2020).
2.7. cognitive measures
At 16–17 months the BSID-III (Bayley, Reference Bayley2006) was administered. The BSID-III is made up of five subscales measuring language, cognition, social-emotional, motor, and adaptive behaviour. The cognitive subscale used here comprises 91 items that assess sensorimotor development (e.g., squeezing an object), exploration and manipulation (e.g., finding a hidden object), and pretend play (e.g., demonstrating relational play with toys). The technical manual accompanying this test reports a high degree of reliability (average reliability of .91 for the cognitive scale) and validity (each item within a scale correlated more strongly with that scale than with other scales). Children are awarded a 1 for each correctly performed item.
3. Results
3.1. group level analyses
In the first of our planned analyses, we wanted to test whether we replicated the original results in each of the event-understanding tasks. For all three tasks, the dependent measure was the raw looking times in milliseconds on a continuous normal distribution. Linear mixed-effects models were fit to the looking times of each task using the lme4 1.1-21 package (Bates, Mächler, Bolker, & Walker, Reference Bates, Mächler, Bolker and Walker2015) with the nloptwrap optimizer algorithm in R version 3.6.1 (R Core Team, 2019). All of the models were initially fitted with the maximal random effects structure (Barr, Levy, Scheepers, & Tily, Reference Barr, Levy, Scheepers and Tily2013) but, if the data were unable to support the model, random slopes were removed in a predetermined sequence until convergence was achieved. The highest-order interaction terms were removed first, starting with those that explained the least amount of variance. If the model still did not converge once the interactions were removed, the random slope of block was removed before the random slope of display type, irrespective of the amount of variance explained by each term, due to the greater theoretical importance of the latter. All of the statistics for the three replication models are presented in Table 1, and the final random effect structure of each model is described in detail below. In addition to the model fit statistics, marginal and conditional  $ {R}^2 $ are reported as effect sizes. These effect sizes denote the proportion of the variance explained by the model with the inclusion (conditional $ {R}^2 $) and exclusion (marginal $ {R}^2 $) of the model random effect structure (Johnson, Reference Johnson2014; Nakagawa, Johnson, & Schielzeth, Reference Nakagawa, Johnson and Schielzeth2017; Nakagawa & Schielzeth, Reference Nakagawa and Schielzeth2013). Bootstrap resampling (R = 1000) was used to compute 95% confidence intervals (CIs) for the model estimates and their associated p-values (Luke, Reference Luke2017). The observed effects are illustrated in Figure 6 and the statistics are reported in Table 1.
The results of the mixed-effect models testing whether the group-level effects were replicated in the three tasks

Causality Model Fit: BIC = 8022, AICc = 7983,  $ {R}_m^2 $ = .0291, $ {R}_c^2 $ = .1590
Chasing Model Fit: BIC = 32924, AICc = 32886,  $ {R}_m^2 $ = .0380, $ {R}_c^2 $ = .1598
Goals Model Fit: BIC = 4966, AICc = 4945,  $ {R}_m^2 $ = .0089, $ {R}_c^2 $ = .0747
Pirate plots to show the results of the conceptual task replications.

For the caused-motion task, display type (familiar non-causal, novel causal, novel non-causal) was entered as a centred factor with two contrasts. The first contrast compared looking times for the familiar non-causal trial with the novel non-causal trials, to test whether the infants defamiliarised to a display with different spatio-temporal features but the same non-causal status. The second contrast determined whether the infants defamiliarised to a caused-motion event, comparing looking times in the familiar non-causal trial to the novel causal trial. Additionally, block (1/2) was entered as an effect coded factor, which was crossed with display type to establish whether looking behaviour changed between the first and second presentations. The maximal model supported by the data included subject as a random intercept, with the random slope of the familiar/causal contrast. The outcome of this analysis was consistent with the findings of Oakes and Cohen (Reference Oakes and Cohen1990); after familiarisation to a non-causal display, the infants’ looking times increased when presented with a novel causal display, but not when presented with a novel non-causal display. Furthermore, while looking times appeared to be higher in block 1 than block 2, there were no interactions between the display contrasts and block, suggesting that the observed group differences in looking times did not vary between the two presentations.
In the chasing task, display type (chasing vs. non-chasing) and block (1/2) were included as fully crossed effect coded fixed factors. Since the chasing task implemented a preferential looking design in which the participants were presented with both display types concurrently over six independent trials, trial (1–6) was included as an additional random intercept. The maximal model that converged included both subject and trial as random intercepts but did not include random slopes for these terms. Consistent with the results of Frankenhuis et al. (Reference Frankenhuis, House, Barrett and Johnson2013), the model showed that the participants looked for longer at the chasing than the non-chasing display. There was a main effect of block, reflecting a reduction in overall looking time in block 2. However, there was no interaction between block and display type, suggesting that the group preference for the chasing display was consistent.
Finally, in the goal-directed behaviour task, display type (old goal vs. new goal) and block (1/2) were entered into the model as fully crossed effect coded predictors. The random-effects structure supported by the data included subject as a random intercept with the display type contrast as a random slope. The results did not reproduce the findings of Luo (Reference Luo2011); looking duration for trials where the agent approached a new goal was not significantly different from looking duration for trials where it approached the old goal. There was also no difference in overall looking between blocks 1 and 2, nor was there an interaction between block and the display condition, suggesting that looking preferences did not vary between the blocks.
Our version of the goals task made three methodological changes to Luo’s (Reference Luo2011) original design, which may have contributed to the difference in results: the participants were 6 to 7 months older than the infants tested by Luo (10 months compared to 2–3 months); we used computer-generated stimuli rather than live object presentation; and we reduced the duration of the familiarisation trials from a maximum of 60 seconds to a fixed 8-second period. To rule out this third change as an explanation for our failure to reproduce Luo’s result, we ran a closely matched follow-up study with a separate sample of 26 infants (15 girls) aged 9 to 12 months (Median = 321 days, Range = 274–369 days). This version used the same stimuli as our first reproduction attempt but implemented an infant-controlled familiarisation phase closely aligned to Luo’s procedure. In this version of the task, the familiarisation trials could last up to 60 seconds. Trials were terminated either when the child looked away for 2 seconds continuously or the maximum duration was reached. The results of this second experiment did not reproduce Luo’s findings either, but were consistent with the results of our first task (see online materials at <https://osf.io/mjv73/>). In Luo’s work, large effect sizes were reported for the differences in looking times between the new goal and old goal trials (exp.1: Cohen’s d = 0.8; exp.2: Cohen’s d = 0.7). Using bootstrap simulations (R = 10000), confidence intervals were computed for the Cohen’s d observed in our two reproduction attempts. The observed effect sizes were considerably smaller and the CIs did not capture the effects reported in Luo’s study (attempt 1: Cohen’s d = –0.07 [–0.31, 0.18]; attempt 2: Cohen’s d = 0.07 [–0.34, 0.49]). In sum, it appears that the results of the caused-motion and chasing tasks reproduced the group effects reported by the original authors (Frankenhuis et al., Reference Frankenhuis, House, Barrett and Johnson2013; Oakes & Cohen, Reference Oakes and Cohen1990) while the goal-directed behaviour task did not (Luo, Reference Luo2011).
3.2. individual differences and relationships with vocabulary development
Our second set of planned analyses assessed whether there are meaningful individual differences in 9- to 10-month-olds’ ability to interpret dynamic events and whether these differences influence vocabulary development. The difference in looking times to the target and control displays in each task was used as a measure of infants’ understanding. For the caused-motion task, this was total looking time in the novel causal trial minus total looking time in the novel non-causal trial. For the chasing task, it was the looking time to the chasing display minus looking time to the random movement display. For the goal-directed behaviour task, it was the total looking time during the new goal trial minus total looking time in the old goal trial. We performed a series of Pearson’s correlations that were bootstrapped (R = 10000) to obtain 95% confidence intervals and accurate p-values. We can infer that there is a meaningful direction-specific relationship between two measures when they produce a high Pearson’s r coefficient, 95% CIs that do not cross zero, and a low p-value.
We first examined whether the infants’ performance in block 1 correlated with their performance in block 2 within each task. These correlations found no evidence of consistency; all three tasks yielded 95% CIs that crossed zero and had high p-values (all ps > .217, see Table 2). This suggests that, at the individual level, the infants responded differently in each presentation of the three tasks. This lack of consistency may be due to fatigue effects since overall looking times were lower in the second block for both the caused-motion and chasing tasks, or to carry-over effects from having seen similar displays, albeit with different objects, in block 1. It may also be that the looking-time difference scores were not representative of individual differences in understanding. It is not possible to disentangle these explanations on the basis of the current data but, considering these results, all subsequent analyses were performed using the data from each block separately.
Looking-time correlations for each task across blocks 1 and 2

Our next analysis tested whether the infants’ looking behaviour was driven by a common understanding of dynamic events shared between the tasks. Following the same analytical procedure as above, we tested whether the infants showed a consistent preference direction and magnitude for the target/control display across the three tasks. However, these analyses showed no reliable relationships in looking behaviour in either block (see Table 2). The infants who, for example, strongly discriminated causal from non-causal motion events were not the same individuals who demonstrated strong preferences in the chasing or goal-directed behaviour tasks.
Finally, we tested whether the separate abilities measured by the tasks were related to vocabulary development. The infants’ task difference scores were combined with three separate measures of vocabulary obtained from the UK-CDI questionnaire at six different age points (9, 11, 12, 15, 16, and 18 months), total comprehension vocabulary, total productive vocabulary, and action word comprehension. Correlations were calculated for both the block 1 and block 2 difference scores following the same procedure as the previous analyses. The purpose of these correlations was not to directly test our hypotheses, but to identify whether a more rigorous confirmatory growth curve analysis (GCA) was merited. This would provide a method of estimating change in vocabulary size over time as a function of individual differences in the looking-time difference scores (Mirman, Reference Mirman2014; Mirman, Dixon, & Magnuson, Reference Mirman, Dixon and Magnuson2008). Specifically, the correlations served as preliminary checks for potential relationships in the data to identify the parameters to include in a full GCA model (e.g., the caused-motion but not the goal-directed behaviour scores).
However, these correlation analyses found no consistent relationships between the task and vocabulary measures (see Tables 3 and 4). The strongest relationships were between the chasing task and the total comprehension and action word comprehension scores, but the effects occurred in opposite directions in each block and none of the p-values reached the traditional significance threshold (cf. McShane, Gal, Gelman, Robert, & Tackett, Reference McShane, Gal, Gelman, Robert and Tackett2019). One should also consider that a total of 162 correlations were performed, so approximately eight correlations with a traditionally significant p-value would be expected to occur by chance under the null hypothesis. The main implication of these analyses is that there was no strong evidence of a relationship between vocabulary development and looking-time preferences in the three event perception tasks.
Pearson’s R [95% CIs] to show the correlations between task performance in block 1 and the target UK-CDI vocabulary scores

* p < .05, *** p < .001
Pearson’s R [95% CIs] to show the correlations between task performance in block 2 and the target UK-CDI vocabulary scores

* p < .05, *** p < .001
3.3. exploratory analyses and simulations
The present results suggest that visual event understanding at 10 months does not predict concurrent vocabulary size and ongoing vocabulary development. Additional exploratory analyses were performed on the block 1 data for the caused-motion and chasing tasks. These two datasets were selected since both tasks replicated the original group-level effects, while also providing examples from familiarisation and preferential-looking designs. Although the results of our planned analyses found no evidence of a relationship between vocabulary size and the understanding of dynamic events, they made two critical assumptions about how such knowledge would be expressed. First, it was assumed that this knowledge exists on an interval scale that is directly expressed through the infants’ looking times. For example, an infant with an 800ms preference for the chasing display is considered twice as knowledgeable as an infant with a 400ms preference. The second assumption is that the direction of the preference is meaningful; that is, an infant with a 200ms preference for the novel causal display is treated as having more knowledge about caused-motion events than an infant with a 200ms preference for the novel non-causal display (i.e., a difference score of –200ms). We tested the validity of these assumptions in a series of exploratory analyses and simulations.
The first simulation considered whether an individual infant’s dynamic event understanding should be expressed categorically rather than continuously. The looking-time difference scores calculated for the planned analyses were used to classify each infant as having either a target display preference (i.e., longer looking at novel causal or chasing display), a control display preference (i.e., longer looking at the novel non-causal or random motion display), or no preference. These categories represented levels on a response type factor, coded with Helmert contrasts. The first contrast compared the infants with a target preference to those with a control preference, to explore whether categorical differences in response direction may predict vocabulary development. The second contrast pooled the infants showing either a target or control preference and compared them to the group showing no preference. This comparison considers whether the infants who make a distinction between the two display types, regardless of the stimulus they prefer, have a larger vocabulary size than those who looked at both displays equally.
When converting a continuous variable into a categorical factor, it is necessary to determine the boundaries of each category. To avoid making assumptions about where this threshold occurs, we simulated a range of boundaries by iteratively raising the no-preference limit in looking-time increments representing 1% of the standard deviation of each sample (caused-motion increments = 63ms; chasing increments = 24ms). Both the caused-motion and chasing simulations were initialised with a no-preference upper boundary at SD  $ \times $ 0.05 (i.e., a very small effect size; Sawilowsky, Reference Sawilowsky2009) and terminated at SD $ \times $ 0.5 (i.e., a medium effect size; Cohen, Reference Cohen1992). With each iteration, separate bootstrapped linear regression models (r = 1000) were fit to the total comprehension scores for each of the six UK-CDI age-points (9, 11, 12, 15, 16, and 18 months), with the response type factor as a predictor. These simulations found no evidence that non-linear looking preferences were related to comprehension vocabulary; the t-ratios for each contrast were small and inconsistent across the different ages in every iteration (see online materials at <https://osf.io/mjv73/>).
The second simulation considered the possibility that looking-time differences are only partially related to vocabulary size; that there may be a difference threshold where the relationship diminishes. To explore whether such a threshold exists, a second simulation iteratively examined the relationship between looking times and total comprehension vocabulary in participants who had difference scores below a set threshold. In a similar procedure to the first simulation, the inclusion limit was incrementally increased by 1% of the standard deviation for the entire sample, thus more data were included with each iteration. For both tasks, the simulations were initialised with an inclusion threshold of SD  $ \times $ 0.05 and terminated at SD $ \times $ 2.5. For every iteration, bootstrapped linear regression models (r = 1000) were fit to the total comprehension vocabulary for each of the six assessed ages. Unlike the planned analyses, preference direction was entered as a separate predictor from the continuous looking-time scores. Specifically, the absolute value of the infants’ looking times was taken as a measure of their response magnitude, with the direction of this score representing their stimulus preference as an effect coded factor. Consistent with the results of the first simulation, the analyses produced no evidence of a threshold; small and variable t-ratios were observed throughout the analysis (see online materials at <https://osf.io/mjv73/>).
A third simulation assessed whether there was a relationship between dynamic event understanding and vocabulary development that includes both linear and non-linear components. The previous simulation examined whether there is a linear relationship between event understanding and vocabulary that disappears beyond a certain threshold. This third simulation considered whether this threshold marks a transition in the relationship from linear to categorical. Following a similar procedure to the previous simulations, the switch point was incrementally increased by 1% of the standard deviation of the sample, starting at a threshold of SD  $ \times $ 0.2 and terminating at a limit equal to SD $ \times $ 1. This threshold was used to split the data into linear and non-linear components. The proportion of the dataset being treated as linear increased as the simulation progressed. When a difference score exceeded the limit, its value was replaced with the mean looking time of the data above the threshold. Thus, all looking behaviour above the threshold was treated as statistically equivalent. No transformations were applied to difference scores that fell below the threshold. For each iteration, the data were fit with the same bootstrapped linear regression models as the second simulation (r = 1000), with separate predictors for difference scores and preference type. Consistent with the previous simulations, these analyses found no evidence to support a non-linear switching point in the relationship between looking times and vocabulary (see online materials at <https://osf.io/mjv73/>).
We found that 10-month-old infants can distinguish between displays showing caused-motion or non-causal events, and between chasing interactions and random movement. However, their precise looking behaviour in these tasks appears to have no meaningful relationships with vocabulary development (measured by the UK-CDI) or other tasks measuring different event perception abilities. Given these results, it is possible that looking behaviour in these familiarisation and preferential looking tasks does not directly correspond to the infants’ depth of understanding of the stimulus and is not suitable for measuring individual differences. In our fourth exploratory analysis, we considered whether the Pearson’s r coefficients observed in our planned analyses (see Tables 3 and 4) could be replicated in a simulation that treated looking times as meaningful effects at the group level, but randomly distributed at the individual level. Consistent with the previous analyses, only the block 1 data from the caused-motion and chasing tasks were used. For each iteration, the data were randomly reshuffled at the trial level so that each participant’s task difference scores no longer corresponded to their vocabulary scores. By reshuffling the data, we were able to retain the group effects observed in the replication analyses, while concurrently assessing whether the individual looking times that produced these effects have a meaningful relationship with vocabulary size. For each of the six UK-CDI age-points (9, 11, 12, 15, 16, and 18 months), the caused-motion and chasing difference scores were reshuffled 10,000 times and a Pearson’s correlation was computed with the mismatched total comprehension scores. This produced a distribution of Pearson’s r coefficients, which was used to calculate the probability of the correlations observed in our planned analyses, or larger, under the hypothesis that looking times were truly random. The outcome of these simulations (see Figures 7 and 8) suggests that many of these correlations have a high probability of occurrence under the computed distribution, especially those for the later assessment ages. Some of the early correlations with the chasing task showed a low probability but remained possible under the simulated distribution. Therefore, many of the relationships between looking-time scores and vocabulary have a medium to high probability of occurrence if the task measures do not reliably capture any meaningful individual differences in the understanding of dynamic events.
Histograms of the correlation coefficients computed in the causality random reshuffle simulation. The dashed lines represent the observed correlation coefficients with their p-values based on the generated distribution.

Histograms of the correlation coefficients computed in the chasing random reshuffle simulation, with dashed lines to show the observed correlation coefficients and their p-values on the simulated distribution.

The fifth analysis tested whether the problem might lie in the looking-time measures themselves. Since the looking-time differences used in the analyses produced no reliable relationships, it is possible that these scores were unsuitable as measures of individual differences in event understanding. Thus, the same analytical procedure used in the UK-CDI vocabulary analyses above was used to examine whether there was a relationship between the looking-time difference scores extracted from the three visual tasks and the BSID-III cognitive development subscale administered when the infants were aged 16–17 months, on the basis that an individual’s event understanding might reasonably be expected to correlate with global cognitive ability. However, no reliable relationships were observed between the task looking times and cognitive development scores (see Table 5).
Correlations between task performance and Bayley cognitive development scores at 16 months

Finally, a sixth analysis examined whether an alternative measure derived from these tasks would be more reliable. Since many studies have reported that the rate of habituation is stable within individuals over time (e.g., Bornstein & Benasich, Reference Bornstein and Benasich1986; Colombo, Mitchell, Coldren, & Freeseman, Reference Colombo, Mitchell, Coldren and Freeseman1991; McCall & Carriger, Reference McCall and Carriger1993), the infants’ total looking times during the familiarisation stages of the caused-motion and goal-directed behaviour tasks were calculated and correlated across blocks 1 and 2 within each task. The scores for each block were then individually correlated with the three measures of vocabulary size (total comprehension, total production, and action words) at all six assessment age-points. There was no evidence of individual consistency within each task, nor were there any notable relationships with vocabulary (see online materials at <https://osf.io/mjv73/>), suggesting that the absence of individual differences effects in the present work cannot be attributed to the specific measures entered into these analyses.
4. General discussion
Most theories of language acquisition assume that visual–spatial perceptual processing is important for constructing shared language meaning (Goldin-Meadow & Mylander, Reference Goldin-Meadow and Mylander1998; Landau & Jackendoff, Reference Landau and Jackendoff1993; Mandler, Reference Mandler1992; Tomasello & Vaish, Reference Tomasello and Vaish2013). Without this ability, there would be nothing to ensure that the meaning of “chase” was similar across individuals. The goal of the present research was to examine this assumption using a longitudinal individual differences design. We tested whether there were meaningful individual differences in the ability of 9- to 10-month-old infants to interpret three dynamic events, and whether these differences influenced vocabulary acquisition. Ours is the first study to explicitly test the relationship between conceptual development and language acquisition at the age when language is starting to be learned by children (i.e., just before their first birthday), and in multiple conceptual understanding tasks.
Analysis one was a conceptual replication of three tasks that assessed dynamic event understanding. Our 9- to 10-month-olds could distinguish between causal and non-causal movement, consistent with the findings of Oakes and Cohen (Reference Oakes and Cohen1990) and others (Leslie & Keeble, Reference Leslie and Keeble1987). They also demonstrated a preference for chasing events over a concurrently presented display showing random movement, consistent with Frankenhuis et al. (Reference Frankenhuis, House, Barrett and Johnson2013). In contrast, across two experiments, we found no evidence that 9- to 10-month-olds infer object preferences in the movement of abstract shapes (Luo, Reference Luo2011). There are two potential explanations for this discrepancy. One is the age difference; Luo tested 2- and 3-month-olds, so our 9- to 10-month-olds may have found the task too easy and extracted the relevant information from the scenes very quickly. This is likely to mean that the looking times do not reflect their knowledge. The second explanation concerns the stimuli. We used on-screen animated objects, which showed movement with a smooth consistent velocity. Luo used physical objects in a wooden box display, with the central agent controlled by a human experimenter. It is possible that human experimenters unconsciously varied the speed of motion of the objects, which could create a greater impression of animacy, helping the infants to interpret the behaviour as goal-directed. Further work is needed to address these issues.
Our second and third set of analyses tested whether there were reliable and correlated individual differences in looking behaviour across the three tasks, and whether these differences were related to vocabulary size. We observed no consistency in individual performance on the same task at the two time-points, no relationships in looking behaviour between the three different tasks, and nor was there any evidence of a link between task performance and vocabulary or cognitive ability. Although the failure to observe consistency across the two time-points (blocks) might be explained by fatigue (due to the duration of the session) or transfer effects (since the infants watched similar displays, albeit with different objects, in both blocks), this cannot adequately explain the failure to find a relationship across tasks, or with vocabulary. The looking times in the second block of each task were shorter; however, the overall pattern of results was consistent. The group effects were present in both blocks and the relationships with language and between tasks were absent. Our exploratory analyses confirmed the absence of such meaningful relationships in our data. We used statistical simulations to consider different explanations about why we might have failed to observe relationships between vocabulary development and our looking-time measures: first, that knowledge of causal relationships is categorical; second, that the magnitude of the difference and not its direction is reflecting knowledge; third, that there is a threshold beyond which knowledge is no longer captured by looking-time differences; and finally, that the relationship is non-linear or has non-linear components. We found no evidence of any relationships between these tasks and language development within any of our simulations. Indeed, our fourth simulation revealed that our findings were highly probable on a distribution of Pearson’s r coefficients computed by randomly shuffling the infants’ looking times and correlating them with vocabulary. In our fifth exploratory analysis, we determined if the individual looking times derived from the tasks relate to global cognitive ability. If such a relationship with cognitive development had been observed, this would have provided clear evidence that the looking-time measures we were using had indeed captured variation in infants’ knowledge of direct causality, agency, and intention. However, since we did not observe any relationships, using looking times from these tasks as measures of knowledge may be inappropriate. Thus, in our sixth and final exploratory analysis, we tested whether another measure would provide more reliable individual level scores: infants’ total looking time during familiarisation. There was no change in the pattern of results.
Considering the cumulative findings of these analyses, there are three possible explanations for the present results. The first is that looking-time differences in these tasks are meaningful, but each is capturing a different ability, so we fail to see relationships between these tasks. The second, not mutually exclusive, explanation is that looking times are meaningful but these abilities have no effect on children’s vocabulary learning. On this account, although children do need to be able to interpret events to learn the associated words, the necessary knowledge has already been acquired by the earliest age we measured their vocabulary (i.e., 9–10 months). However, a third explanation is that looking-time differences are not a reliable measure of an individual infant’s understanding. We consider this final explanation to be the most plausible, in the light of the results of our a priori and exploratory analyses.
This conclusion raises broader questions about how to use looking times as a measure of individual variation (see Hedge, Powell, & Sumner, Reference Hedge, Powell and Sumner2017). One question concerns experimental design. To find a group effect, we need to minimise between-subject variance, but to capture individual differences, we need high between-subject variance (Hedge et al., Reference Hedge, Powell and Sumner2017). Thus, the very methodological decisions that lead to success in group designs may reduce our chances of identifying meaningful individual differences. Furthermore, it should be noted that in the caused-motion and goal-directed behaviour tasks, the looking-time differences were derived from a single trial of each display (e.g., novel causal vs. novel non-causal). Prior work that has found relationships between looking-time measures and other aspects of development (e.g., IQ; McCall & Carriger, Reference McCall and Carriger1993) have used measures over multiple presentations of the same stimuli. Thus, those looking times may be less influenced by attentional and environmental factors than the ones used in these analyses. That said, the chasing task and our exploratory analyses using rate of familiarisation both calculated individual differences aggregated over multiple trials. Still, neither of these produced evidence of relationships within the tasks, between the tasks, or with vocabulary.
Another question concerns the age of testing. For infants to demonstrate success in a group design, most of the group need to show an effect in the predicted direction. However, in an individual differences design, we are looking for the highest variance possible, which may be when group performance is at chance. Thus, at the age at which we find group effects, individual variance may no longer be large enough to measure meaningful differences in performance. In our case, if we had tested infants younger than 9–10 months of age, and managed to capture the transitionary period of the development of causal understanding, individual differences might have emerged.
A third question concerns the fact that we know very little about the underlying drivers of looking behaviour in these tasks, which means it is difficult to make predictions on an individual level. Looking-time difference measures are based on the premise that children with a more mature understanding of dynamic events will show bigger looking differences (i.e., will look for substantially longer at one event than the other) than those with immature or emerging knowledge. Yet, an infant with a more mature understanding may, in fact, extract the relevant information in the events quickly, and then spend the rest of the time looking at both displays. Alternatively, an infant with an immature or emerging concept of causality may take longer to extract relevant information, and thus may explore one scene more than the other. In other words, the underlying strategies that drive looking-time behaviour may not yield the expected results. Much more work is needed to understand the relationship between looking-time behaviour and the knowledge and processes that drive this behaviour in infants.
5. Conclusion
In summary, we successfully replicated the results of two of the three tasks: Oakes and Cohen’s caused-motion task and Frankenhuis’ chasing task, but not Luo’s goal-directed behaviour task. Planned analyses revealed no relationships between these tasks or with vocabulary size. Exploratory analyses also found no relationship with a measure of cognitive development. Simulations explored four explanations and converged on a consensus that there were no relationships with language within our data. These findings raise important questions about how to convert experimental group designs into individual differences designs, and how to interpret infant looking-time behaviour. We propose that differences in infants’ ability to interpret dynamic events at 9–10 months of age are not causally implicated in explaining individual variation in vocabulary acquisition, at least in typically developing children.


 Open access