


The dietary assessment of infants and young children is influenced by unique respondent and observer considerations, including a limited cognitive ability to self-report dietary intake, irregular patterns of intake (small portions, snacking and plate wastage) and use of primary caregivers as proxy reporters(Reference Livingstone and Robson1–Reference Ortiz-Andrellucchi, Henríquez-Sánchez and Sánchez-Villegas3). During the first 1000 d, dietary patterns and habits change more rapidly than at any other time during the life course, and there is an increased risk of inadequate nutrient intakes(Reference Livingstone and Robson1,Reference Livingstone, Robson and Wallace4,Reference Andersen, Lande and Arsky5) . In order to overcome the limitations associated with early life dietary assessment, it is essential that the selected tool can provide a reliable estimation of food and nutrient intake(Reference Roman-Viñas, Ortiz-Andrellucchi and Mendez2).
FFQ are valuable in assessing usual intake, as they are relatively inexpensive, convenient and have a lower respondent burden compared with other measurement tools(Reference Gibson6); however, they are prone to systematic error in the form of under or over-reporting at an individual level(Reference Carroll, Pee and Freedman7). FFQ should be specific to the population of interest, with food lists that are an accurate reflection of dietary intake(Reference Willett8). In a review of the literature, semi-quantitative FFQ have been judged to be acceptable instruments for estimating intakes of Ca, Zn, Fe, vitamin C(Reference Roman-Viñas, Ortiz-Andrellucchi and Mendez2,Reference Lovell, Bulloch and Wall9) and vitamin D(Reference Roman-Viñas, Ortiz-Andrellucchi and Mendez2) in infants and young children, with good validity and reproducibility for estimating dietary intakes at a group level(Reference Lovell, Bulloch and Wall9).
In order to interpret dietary data with confidence, FFQ should be compared with a more accurate measure of dietary intake within the population to which it is being applied(Reference Carroll, Pee and Freedman7). Validation with or without additional calibration is often performed in sub-populations of larger cohorts, to establish the relationship between reported intake and true usual intake(Reference Carroll, Pee and Freedman7). Calibration provides an adjustment factor for dietary data obtained from a more biased and less accurate instrument, such as an FFQ using information from a reference instrument (i.e. a 24HR) that provides a less biased, more accurate estimate of actual intake(Reference Rosner, Willett and Spiegelman10–12). Use of a non-validated (±un-calibrated) FFQ may result in miss-estimation of energy, macro and micronutrient intake and identification of inaccurate relationships between intake and disease outcome(Reference Carroll, Pee and Freedman7,Reference Fumagalli, Pontes Monteiro and Sartorelli13,Reference Cade, Thompson and Burley14) .
The Growing Up Milk – Lite (GUMLi) trial is a multi-centre, double-blinded, randomised control trial of 160 healthy, 1-year-old children in Auckland, New Zealand (n 108) and Brisbane, Australia (n 52) conducted in 2015–2017. The primary outcome of the GUMLi trial was to evaluate the effect of consuming a reduced protein GUMLi compared with unfortified cows’ milk consumed as part of a whole diet on body composition at 2 years of age(Reference Wall, Hill and Lovell15). The Eating Assessment in Toddlers FFQ (EAT FFQ)(Reference Taylor, Heath and Galland16) is an adapted version of the interviewer-administered, semi-quantitative FFQ developed for the Southampton Women’s Survey(Reference Marriott, Inskip and Borland17). Previous evaluation of the validity of the EAT FFQ in 12- to 24-month-old children (mean age 16·8 months) showed good reproducibility and acceptable to good validity for ranking children’s nutrient intakes, with an ability to identify children that were at the extremes of the nutrient intake distribution(Reference Watson, Heath and Taylor18). The aim of the present study was to evaluate the validity of the EAT FFQ used in the GUMLi trial (GUMLi EAT FFQ) and estimate the calibration factors using a sub-sample of the GUMLi trial cohort.
Methods
Trial registration
The trial was registered with the Australian New Zealand Clinical Trials Registry (no. ACTRN12614000918628) on 27 August 2014.
Study sample and design
Children from the GUMLi trial, conducted from 2015 to 2017, participated in a study to re-evaluate the validity of the GUMLi EAT FFQ and estimate calibration factors. Primary caregivers were invited to participate in the present study at month 6 post-randomisation, when their child was 18 months old. Decision not to participate in this study did not affect participation in the main GUMLi trial. The reference method was a record-assisted 24-h recalls (24HR), randomly administered on non-consecutive days between months 7 and 11 post-randomisation. Ethical approval for the main trial was obtained from The Northern B Health and Disability Ethics Committee, Ministry of Health, New Zealand (14/NTB/152) and The University of Queensland Medical Research Ethics Committee, Brisbane, Australia (2014001318), with post-approval amendment obtained in both centres for the present study. The study was conducted according to the guidelines laid down in the Declaration of Helsinki. Written informed consent was obtained from primary caregivers.
Data collection
Participant sociodemographic characteristics were collected via caregiver-completed questionnaires at baseline. For the purpose of clarity, the FFQ described in this study is referred to as the GUMLi EAT FFQ. The GUMLi EAT FFQ was completed at five time points during the 12-month GUMLi trial period (baseline, months 3, 6, 9 and 12 post-randomisation) using an interviewer-administered technique. After completing the FFQ at month 6, primary caregivers were invited to take part in an optional series of single record-assisted 24HR, performed at months 7, 8, 10 and 11 post-randomisation. These two dietary assessment methods were utilised to monitor differences in dietary intake, over the course of the intervention. Available data from the GUMLi EAT FFQ completed at months 9 and 12 and single 24HR at months 8 and 11 were used in the analyses. The single 24HR completed at months 7 and 10 were not used in the analysis of this paper, however, were used to monitor differences in dietary intake over the course of the intervention in the main GUMLi trial and in an assessment of diet quality(Reference Lovell, Milne and Jiang19).
The GUMLi EAT FFQ (test method)
The methodology used to validate the original EAT FFQ has been described in detail(Reference Watson, Heath and Taylor18). Biomarkers of Fe and vitamin D status were a secondary outcome for the GUMLi trial; therefore, changes were made to the original EAT FFQ to reflect this. It is well established that NZ and Australian children have low vitamin D status, with dietary sources of vitamin D being poor, due to limited fortification and lack of mandatory supplementation(20). Foods that were natural sources of Fe and vitamin D in the NZ and Australian food supply were added or identified in the original EAT FFQ. Following this, it was then necessary to evaluate the validity of the questionnaire in estimating vitamin D intakes in the GUMLi trial population. Changes to the original EAT FFQ have provided a more useful tool for further use in wider NZ and Australian paediatric populations. For example, foods such as oily fish (fresh or tinned) were added to the meat and alternatives food group. Foods in the FFQ known to influence Fe status included milk, meat (with the addition of liver), cereals, fruits and green vegetables. Due to high levels of plate wastage experienced in this age group, the FFQ distinguished between the amount of food offered and the amount eaten(Reference Watson, Heath and Taylor18). This allowed parents to visualise how much their child actually ate, rather than the amount offered, in an attempt to prevent over-reporting(Reference Taylor, Heath and Galland16). Portion size was described in natural portions, e.g. one slice of bread or in terms of the child’s palm volume (length × width × thickness), a methodology unique to the EAT FFQ(Reference Taylor, Heath and Galland16,Reference Watson, Heath and Taylor18,Reference Mills, Skidmore and Watson21) . Palm thickness was measured using an anthropometer (model 012901; Lafayette Instrument Company). New palm measurements were taken each time the ninety-nine-item GUMLi EAT FFQ was administered (baseline, months 3, 6, 9 and 12 post-randomisation) to capture child growth and changing portion sizes throughout the trial.
Record-assisted 24 h recalls (reference method)
Due to lack of a ‘gold standard’ in dietary assessment, FFQ are frequently validated against alternative methods such as food records or 24HR(Reference Cade, Thompson and Burley14). For the present study, the mean of two record-assisted 24HR was used as an ‘alloyed gold standard’ (imperfect reference instrument)(Reference Bennett, Landry and Little22) to investigate the validity of the GUMLi EAT FFQ compared with 24HR. Compared with dietary records such as the weighed food record, 24HR are easy to use, are less expensive and are less burdensome for participants(Reference Gibson6). These are important considerations within the context of a longitudinal trial. The record-assisted 24HR differed from a standard 24HR, in that the day was pre-defined and primary caregivers kept a written record for the 24-h period preceding their phone interview. This methodology was used in a pilot study for the New Zealand Children’s Nutrition Survey(Reference Watson23) and the Australian Children’s Nutrition and Physical Activity Survey(24). Primary caregivers received written instructions on how to complete the record-assisted 24HR and used a record template. The single 24HR were collected on randomly allocated days (3 weekdays and 1 weekend day). All primary caregivers received a text reminder the day before. Four single 24HR were collected by a trained dietitian at months 7, 8, 10 and 11 post-randomisation, following a standardised three-step multiple pass procedure, using open-ended questions and neutral probes(Reference Blanton, Moshfegh and Baer25). If, during the 24-h recording period, children were in the care of another supervising adult, e.g. childcare centre, a form adapted from the Feeding Infants and Toddlers Study, ‘Foods Fed by Other Adults’(Reference Briefel, Reidy and Karwe26,Reference Devaney, Kalb and Briefel27) , was completed. Breastfeeding was recorded as time (minutes) and quantity estimated using a conversion factor of 10 ml/min, with a maximum of 10 min of breastfeeding or 100 ml breastmilk(Reference Emmett, North and Noble28,Reference Lennox, Sommerville and Ong29) . A food model booklet was used as a visual aid to assist with quantifying recall items and describe serving sizes. This booklet was adapted and reproduced with permission from the USA Department of Agriculture and the Commonwealth Scientific and Industrial Research Organisation(24,30) . The Commonwealth Scientific and Industrial Research Organisation modified this booklet for use in the Children’s Nutrition and Physical Activity Survey in Australia, and validation showed moderate to strong correlations between weighed and recalled portions, providing a reasonable interpretation of actual consumption at a group level(31). Within 24 h of completing the record for the 24HR, parents or caregivers were phoned by the study research dietitian. This record was used as the ‘first pass’ or ‘quick list’ for the parent/caregiver during the phone call. Recalls were then checked for completeness and the presence of any inconsistent or extreme responses during the third pass.
Data management
Data collected by the FFQ were transformed into frequency of intake per d, and nutrient intakes were calculated as previously described(Reference Watson, Heath and Taylor18). Nutrient analyses were performed using a custom written MATLAB® program (MathWorks Inc.)(32), verified by hand calculations. All record-assisted 24HR were entered into FoodWorks® version 9 (Xyris Software)(33) by a dietetic student at the University of Auckland. Data entry was double-checked by the supervising trial research dietitian. Caregivers who were unable to provide recipes or accurate volumes of food were excluded from the analysis. The use of supplements and medicines that would influence nutrient intakes was entered into FoodWorks®(33). The New Zealand FOODfiles 2016 database(34) was used to analyse the Auckland recalls and AUSNUT 2013 database(35) to analyse Brisbane recalls. The decision was made to use an Australian database to allow for correct selection of Australian-specific commercial young child food products and brands. Nutrient intake from consumption of the trial milks according to participant randomisation (group A; cows’ milk and group B; GUMLi) was manually entered into FoodWorks®(33) as a new food using the nutrient profile supplied by the manufacturer (Danone Pty) (online Supplementary Table S1).
Statistical analyses
Data analyses were performed using SPSS version 26 (IBM Corp)(36) and SAS version 9.4 (SAS Institute Inc.)(37). All statistical tests were two-sided at the 5 % significant level. Baseline demographic characteristics were compared between participants included in the analysis and those excluded using a two-sample t test (Table 1). Continuous data are presented as means and standard deviations and categorical data presented as numbers and percentages. Means for absolute energy and nutrient intakes for the GUMLi EAT FFQ (months 9 and 12) and four 24HR (months 7, 8, 10 and 11) were summarised and compared at two time points (month 9 FFQ v. average of months 7 and 8 24HR and month 12 FFQ v. average of months 10 and 11 24HR). Nutrient data were log-transformed to normalise the frequency distributions. In addition, nutrients were energy-adjusted using the energy density method (which divides nutrient intake by total energy intake).
Baseline demographics of children from the Growing Up Milk – Lite (GUMLi) trial, who participated in the validation and calibration study sub-sample (n 97) v. those who did not participate (n 63)*
(Numbers and percentages; mean values and standard deviations)
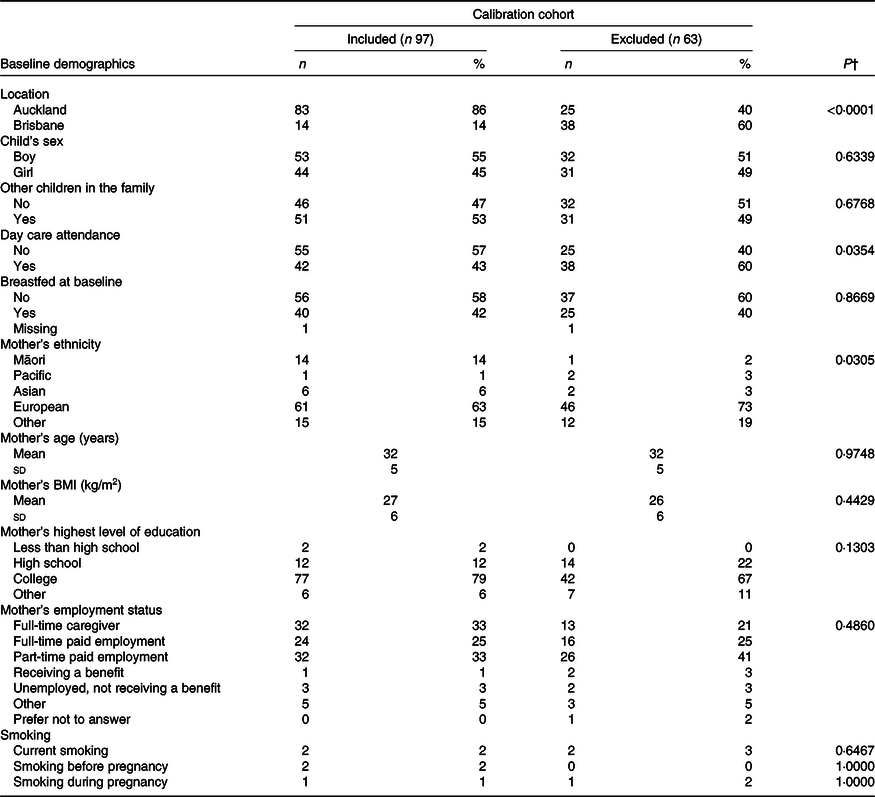
24HR, 24-h recall.
* Participants that did not participate in the study due to either declining to participate in 24HR data collection (n 18), withdrawal from the core GUMLi trial (n 14) or completed <4 × 24HR (n 31).
† χ 2 Test of Fisher’s test was used to test the difference between groups for categorical variables; the two-sample t test or Kruskal–Wallis test was used to compare the means between groups for continuous variables. The level of significance was set at P < 0·05.
Evaluation of validity
To assess the validity of the FFQ, dietary intakes of eleven nutrients (energy, total fat, carbohydrate, protein, fibre, Ca, Fe, Zn, vitamin B12, vitamin C and vitamin D) were compared with 24HR data at each time point. Pearson’s rank correlation coefficients and 95 % CI were calculated to assess the association between nutrient intakes estimated by the FFQ and average of two 24HR at each time point. To reduce the impact of extreme nutrient intakes, correlation analyses were based on the ranks of log transformed and energy-adjusted nutrient values. To account for within-person variation in the 24HR, correlation coefficients were corrected for attenuation to reduce the effect of random error in the comparison methods. The de-attenuated Pearson correlation coefficients were calculated as previously described(Reference Willett38,Reference Rosner and Willett39) , using a random effects model to remove within-person variation found in the 24HR using the following formula:
 $${r_t} = {r_0}\surd (1 + r/n)^{(38)},$$
where r t is the corrected correlation between energy-adjusted nutrient intakes derived from the GUMLi EAT FFQ and 24HR, r 0 is the observed correlation, r is the ratio of estimated within-person and between-person variations in nutrient intake derived from two 24HR and n is the number of repeated 24HR (n 2). Correlations of <0·30 were considered ‘poor’; correlations of 0·30–0·49 were considered ‘acceptable’ and 0·50–0·70 were considered ‘good’(Reference Willett8,Reference Masson, MCNeill and Tomany40) . Weighted kappa (κ) values were calculated to measure the agreement between the two assessment methods for each participant according to classification into quartiles. Degree of agreement was classified according to the following categories: 0·00–0·20, 0·21–0·40, 0·41–0·60, 0·61–0·80 and 0·81–1·00, defined as slight, fair, moderate, substantial and almost perfect agreement, respectively(Reference Landis and Koch41). Exact classification was defined as the GUMLi EAT FFQ and 24HR categorising the diet into the same quartile.
Calibration
Assessing calibration involves the estimation of a factor that associates the data obtained from the 24HR (reference method) with the data obtained from the FFQ (predictor)(Reference Rosner, Willett and Spiegelman10). Calibration analyses were performed using linear regression on the study sample adjusting for sex, and treatment group, estimating a ‘calibration factor’ as the regression slope (λ) with 95 % CI(Reference Rosner, Willett and Spiegelman10). This analysis was performed on the log-transformed, energy-adjusted nutrient intake levels. Calibrated GUMLi EAT FFQ measurements can then be calculated as:
 $${\rm{FF}}{{\rm{Q}}} = {\rm{24H}}{{\rm{R}}_{{\rm{mean}}}} + \lambda \left( {{\rm{FFQ }}-{\rm{ FF}}{{\rm{Q}}_{{\rm{mean}}}}} \right){^{(42)}},$$
where FFQmean and 24HRmean are the population mean intakes, measured by the GUMLi EAT FFQ and 24HR, respectively.
Results
Population characteristics
A total of 160 children participated in the GUMLi trial across both study centres (Auckland n 108, Brisbane n 52). At month 6, post-randomisation, fourteen participants had withdrawn from the main trial. All remaining participants (n 149) were eligible to participate in the calibration sub-study, of which, eighteen (12 %) declined to participate and thirty-one (21 %) completed less than four 24HR, resulting in complete exclusion from the analysis. Ninety-seven (65 %) participants completed four 24HR, which were matched with their corresponding FFQ at two time points (months 9 and 12 post-randomisation). No significant differences in baseline characteristics were observed between the participants included in the analysis (n 97) and those excluded (n 63) (Table 1), except for centre location (P < 0·001), day care attendance (P = 0·0354) and mother’s ethnicity (P = 0·0305). The distributions of absolute daily nutrient intakes are shown in Tables 2 and 3, where most nutrients measured by The GUMLi EAT FFQ had wider distributions compared with the average of two 24HR at both time points.
Absolute daily nutrient intakes, correlation, agreement and cross-classification for nutrient intake according to the month 9 Growing Up Milk – Lite (GUMLi) EAT Food FFQ and averaged (months 7 and 8) 24-h recalls (24HR) in 18- to 23-month-old children participating in the GUMLi trial (2015–2017) (Mean values and standard deviations; κ values and 95 % confidence intervals)
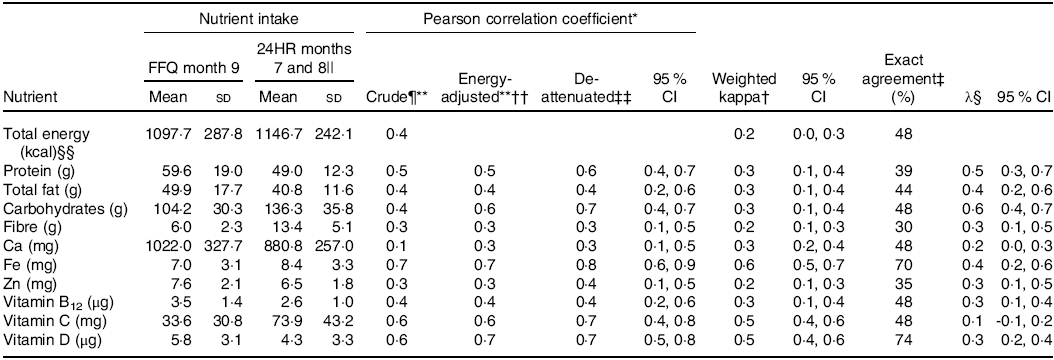
* Pearson correlation coefficient – crude coefficients, energy-adjusted and de-attenuated – between intakes measured by GUMLi EAT FFQ month 9 and average 24HR (months 10 and 11). Poor (<0·30); acceptable (0·30–0·49); and good (0·5–0·7)(Reference Willett8).
† Weighted kappa (κ) calculated to evaluate the agreement between methods and correct classification into quartiles. Slight agreement (0·00–0·20); fair agreement (0·21–0·4); moderate agreement (0·41–0·60); substantial agreement (0·61–0·80); almost perfect agreement (0·81–1·00)(36).
‡ Exact agreement: percentage of children with diets classified by the FFQ into the same quartile as the average 24HR. If the two methods were completely unrelated, 25 % correct classification would be expected by chance(Reference Willett8).
§ Calibration coefficient equals the slope (λ, 95 % CI) from the linear regression of the average 24HR measured intake on the corresponding GUMLi EAT FFQ intake, adjusted for sex and treatment group.
|| Values are average of two 24HR (months 10 and 11).
¶ Crude value.
** Log transformed.
†† Energy-adjusted (density method).
‡‡ De-attenuated coefficient corrected for with person day-to-day variation using the following formula  ${r_t} = {r_0}\surd (1 + r /n)$(Reference Willett38).
§§ To convert kcal to kJ, multiply by 4·184.
Absolute daily nutrient intakes, correlation, agreement and cross-classification for nutrient intake according to the month 12 Growing Up Milk – Lite (GUMLi) EAT Food FFQ and averaged (months 10 and 11) 24-h recalls (24HR) in 18- to 23-month-old children participating in the GUMLi trial (2015–2017) (Mean values and standard deviations; κ values and 95 % confidence intervals)
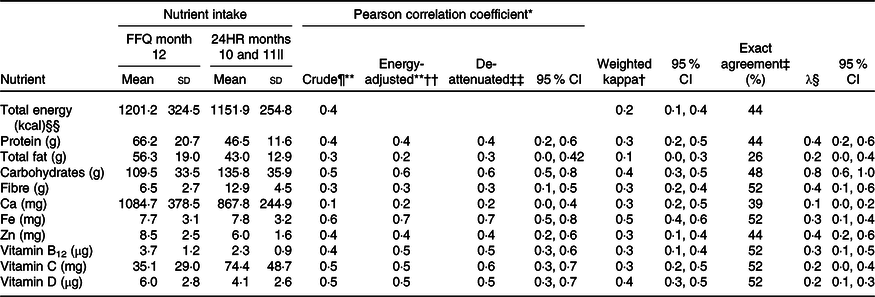
* Pearson correlation coefficient – crude coefficients, energy-adjusted and de-attenuated – between intakes measured by GUMLi EAT FFQ month 9 and average 24HR (months 10 and 11). Poor (<0·30); acceptable (0·30–0·49); and good (0·5–0·7)(Reference Willett8).
† Weighted kappa (κ) calculated to evaluate the agreement between methods and correct classification into quartiles. Slight agreement (0·00–0·20); fair agreement (0·21–0·4); moderate agreement (0·41–0·60); substantial agreement (0·61–0·80); almost perfect agreement (0·81–1·00)(36).
‡ Exact agreement: percentage of children with diets classified by the FFQ into the same quartile as the average 24HR. If the two methods were completely unrelated, 25 % correct classification would be expected by chance.(Reference Willett8).
§ Calibration coefficient equals the slope (λ, 95 % CI) from the linear regression of the average 24HR measured intake on the corresponding GUMLi EAT FFQ intake, adjusted for sex and treatment group.
|| Values are average of two 24HR (months 10 and 11).
¶ Crude value.
** Log transformed.
†† Energy-adjusted (density method).
‡‡ De-attenuated coefficient corrected for with person day-to-day variation using the following formula rr = r0 √(1 + r/n)(Reference Willett38).
§§ To convert kcal to kJ, multiply by 4·184.
Evaluation of validity
Table 2 shows validation analyses of the 9 month GUMLi EAT FFQ compared with the average of the 2 (months 7 and 8) 24HR. Pearson correlation coefficients for unadjusted intakes ranged from 0·1 (‘poor’) for Ca to 0·7 (‘good’) for Fe (Table 2). Energy adjustment increased correlations, ranging from 0·3 (‘acceptable’) for Ca and 0·7 (‘good’) for Fe. The ratio of within- to between-participant variation in the 24HR ranged from 1·1 to 1·5, indicating that residual random day-to-day variation in 24HR intakes attenuated the association between the average 24HR and GUMLi EAT FFQ measures. Energy-adjusted de-attenuated Pearson correlation coefficients increased with correction for this attenuation effect (Table 2), ranging from 0·3 (‘acceptable’) for Ca and fibre and 0·8 (‘good’) for Fe. Weighted kappa (κ) values on the nutrient quartiles ranged from 0·2 (Zn) to 0·6 (Fe) and were all statistically significant for energy and nutrients (Table 2). The percentage of exact agreement into the same quartile by the FFQ and average 24HR ranged from 30 % (fibre) to 74 % (vitamin D).
Table 3 shows validation analyses of the 12 month GUMLi EAT FFQ compared with the average of the 2 (months 10 and 11) 24HR. Pearson correlations coefficients for unadjusted intakes ranged from 0·2 (‘poor’) for Ca to 0·6 (‘good’) for Fe. The ratio of within- to between-participant variation in the 24HR ranged from 1·1 to 1·5, again indicating that residual random day-to-day variation in 24HR intakes attenuated the association between the average 24HR and GUMLi EAT FFQ measures. Energy-adjusted de-attenuated Pearson correlation coefficients increased with correction for this attenuation effect (Table 3), ranging from 0·3 (‘acceptable’) for fibre and 0·7 (‘good’) for Fe. The weighted κ values on the nutrient quartiles ranged from 0·1 (total fat) to 0·5 (Fe) and were statistically significant for all energy and nutrients, except total fat (Table 3). The percentage of exact agreement into quartiles by the FFQ and 24HR ranged from 26 % (total fat) to 52 % (fibre, Fe, vitamin B12, vitamin C and vitamin D).
Calibration
Both administrations of the GUMLi EAT FFQ at months 9 and 12 overestimated intakes of protein, total fat, Ca, vitamin B12, Zn and vitamin D by ≥15 % and underestimated intakes of carbohydrate, fibre and vitamin C by ≥15 % and Fe at the month 9 administration (Tables 2 and 3). For all nutrients, the linear regression of the average 24HR against both GUMLi EAT FFQ, adjusting for sex and group allocation resulted in slope estimates (λ calibration coefficients) that ranged from 0·1 (vitamin C) to 0·6 (carbohydrates) at month 9 and 0·1 (Ca) to 0·8 (carbohydrates) at month 12 (Tables 2 and 3). Mean (SD) dietary intakes of the ten nutrients (excluding energy) estimated by the FFQ, average 24HR and calibrated FFQ values are displayed in Table 4. The calibrated means estimated for the GUMLi EAT FFQ were close to those estimated by the 24HR, however, had lower standard deviations.
Absolute daily nutrient intakes estimated by the Growing Up Milk – Lite (GUMLi) EAT Food FFQ and averaged 24-h recalls (24HR) at two time points and predicted GUMLi EAT FFQ values adjusted for sex and group allocation for children 18 to 23 months of age participating in the GUMLi trial (2015–2017) (Mean values and standard deviations)
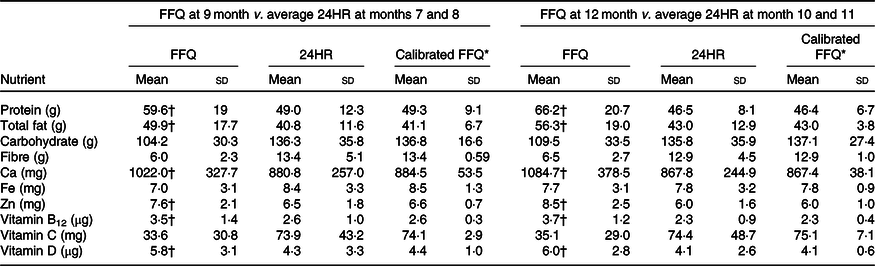
* Calibration regression for energy and nutrients, using equation FFQ’ = 24HRmean + λ (FFQ – FFQmean)(Reference Johansson, Hallmans and Wikman42).
† The FFQ value is >15 % different than the 24HR value.
Discussion
The EAT FFQ was originally adapted for use in 12- to 24-month-old New Zealand toddlers residing in the South Island of New Zealand(Reference Watson, Heath and Taylor18). After altering the original EAT FFQ, to ensure that food sources of vitamin D were captured (secondary outcome of the GUMLi trial), re-estimation of the validity and calculation of calibration factors were conducted in this sub sample of 18- to 23-month-old-children (n 97) participating in the GUMLi trial. The GUMLi EAT FFQ remained a valid tool for ranking young children’s nutrient intakes. The estimated calibration factors can be used in further research to correct the mean energy and nutrient estimations and estimate relative risks for quantitative differences in nutrient intakes measured when using the GUMLi EAT FFQ.
Although participation in this study was an optional component of the main GUMLI trial, important baseline characteristics were similar between those included in this study and those who were excluded (except for study centre, day care attendance and mother’s ethnicity). Therefore, these findings can be considered mostly representative of the entire GUMLi cohort, but should not be extrapolated beyond the population in which the GUMLi EAT FFQ was validated.
Accurate dietary assessment in young children is challenging, with several considerations unique to this age group, including use of proxy reporters to estimate usual intake and highly changeable dietary intakes and dietary patterns(Reference Livingstone and Robson1,Reference Livingstone, Robson and Wallace4) . Because of this, evaluation of the validity of dietary assessment tools such as the FFQ in providing accurate estimates of energy and nutrient intakes are scare in children under the age of two. Repeated record-assisted 24HR measurements were used to provide an estimate of participants’ true nutrient intake, whereby the random errors are assumed to be statistically uncorrelated between measurements (i.e. average 24HR compared with GUMLi EAT FFQ) and that the measurements from the two instruments are linearly related to true intake levels(Reference Kaaks, Riboli and van Staveren11,Reference Bennett, Landry and Little22) . De-attenuated Pearson correlation coefficients (Tables 2 and 3) provided an unbiased estimate of the correlation between the GUMLi EAT FFQ and participants’ true usual intake. Two record-assisted 24HR measurements were used with one administration of the GUMLi EAT FFQ. Record-assisted replicated 24HR were used to encourage high response rates (in an aim for representativeness of the sample), allowed parents to pre-record intake (in the setting of multiple carers being involved in participant daily intake) and could be administered over the telephone (particularly important for mothers of participants whom had returned to work). Most validation studies (n 7) in this age group of interest use weighed food records as the reference method(Reference Andersen, Lande and Arsky5,Reference Marriott, Inskip and Borland17,Reference Watson, Heath and Taylor18,Reference Andersen, Lande and Trygg43–Reference Rankin, Levy and Warren46) and four studies used replicated 24HR to validate FFQ in young children, as used in the present study to assess food and nutrient intake in children under two(Reference Parrish, Marshall and Krebs47–Reference Palacios, Rivas-Tumanyan and Santiago-Rodríguez50).
Both original EAT FFQ validity studies concluded that the FFQ overestimated all ten nutrients compared with the 5 d weighed diet record, indicating that the tool was not appropriate for estimating individual intakes(Reference Watson, Heath and Taylor18,Reference Mills, Skidmore and Watson21) . This study showed that the GUMLi EAT FFQ gave higher mean values than the 24HR for six out of ten nutrients measured. Across all validation studies conducted in this age group, FFQ were reported to overestimate most(Reference Andersen, Lande and Trygg43,Reference Blum, Wei and Rockett48,Reference D’Ambrosio, Tiessen and Simpson49) or all(Reference Andersen, Lande and Arsky5,Reference Marriott, Inskip and Borland17,Reference Parrish, Marshall and Krebs47,Reference Palacios, Rivas-Tumanyan and Santiago-Rodríguez50) nutrient intakes. Unique respondent and observer considerations must be considered when determining whether the random errors between the FFQ and participant’s true usual intake estimates are uncorrelated, including high volume plate wastage, highly variable total food intake, reliable report of food consumed at home v. away from home and use of surrogate reporters may all contribute to the systematic overestimation of intake that occurs with FFQ measurements in young children(Reference Livingstone, Robson and Wallace4,Reference Lovell, Bulloch and Wall9) , and it is not known whether the unique portion size estimation method used in the GUMLi EAT FFQ further increased the systematic overestimation of nutrient intake. Whether 24HR also systematically over or underestimate nutrient intake when used in in children under the age of two is not currently known, but has been reported in adult populations(Reference Black and Cole51–Reference Goldberg, Black and Jebb53). The effect of nutrient over or underestimation with FFQ or 24HR administration will result in de-attenuated correlation coefficients that may be an over or underestimation of the correlation between FFQ measurements and true usual intake(Reference Johansson, Hallmans and Wikman42).
De-attenuated and energy-adjusted correlation coefficients for nutrients from the GUMLi EAT FFQ and 24HR showed an average increase of 12 % at month 9 and 19 % at month 12 and mostly fell within the range or were higher than results reported in other multi-nutrient FFQ validation studies conducted in this age group(Reference Andersen, Lande and Arsky5,Reference Marriott, Inskip and Borland17,Reference Watson, Heath and Taylor18,Reference Andersen, Lande and Trygg43–Reference Palacios, Rivas-Tumanyan and Santiago-Rodríguez50) , including the previous EAT FFQ validation(Reference Watson, Heath and Taylor18). It is possible that increasing the number of non-consecutive record days in order to provide estimated nutrient intakes over a longer period of time and capture episodically consumed foods may result in obtaining correlation coefficients closer to 0·9. Particularly for nutrients like Fe, Ca, protein and dietary fibre, where a greater number of days are required to provide a more accurate estimate of usual intake(Reference Willett8,Reference Nelson, Black and Morris54,Reference Pereira, Araujo and Lopes55) . Vitamin D intake is not commonly measured in this age group, however, has been reported by Andersen et al. (Reference Andersen, Lande and Arsky5,Reference Andersen, Lande and Trygg43) to be 0·16 (95 % CI 0·45, 0·73) at 12 months of age and 0·53 (95 % CI 0·45, 0·73) at 2 years of age and 0·71 (95 % CI 0·61, 0·78), mean age 9 months by Palacios et al. (Reference Palacios, Rivas-Tumanyan and Santiago-Rodríguez50). In this study, we reported Pearson coefficients of 0·7 (95 % CI 0·50, 0·80) at month 9 and 0·5 (95 % CI 0·30, 0·70) at month 12 of the GUMLi EAT FFQ administration. The agreement for categorisation into quartiles was determined using the weighted kappa (κ) after data deattenuation and ranged from 0·2 (fibre and Zn) to 0·6 (Fe) at month 9 and 0·1 (total fat) to 0·5 (Fe) at month 12. Agreement across quartiles, measured by mean exact classification, was 47·2 %, higher than the previous EAT FFQ validation (mean 40·1 %)(Reference Watson, Heath and Taylor18) and two other validation studies in children 12(Reference Andersen, Lande and Arsky5) and 24 months old(Reference Andersen, Lande and Trygg43). For secondary outcome nutrients of the GUMLi trial, exact agreement was 70 % (Fe) and 74 % (vitamin D) at month 9 and 52 % for both Fe and vitamin D at month 12. These values are higher than that reported by Andersen et al. in a population of 24-month-old children, where exact agreement for Fe was 47 and 42 % for vitamin D(Reference Andersen, Lande and Arsky5). Therefore, the authors conclude that the GUMLi EAT FFQ remained able to rank individuals with reasonable accuracy for all nutrients at both GUMLi EAT FFQ time points, however, remained inappropriate to assess absolute intake.
The calibration provided an estimate of the measurement error associated with the GUMLi EAT FFQ using the 24HR as a less biased, more accurate (‘alloyed gold standard’) instrument. We estimated the calibration factor (λ) using linear regression of 24HR (reference measurement) on the GUMLi EAT FFQ (main study measurement). The validity of this method of correction is based on the assumptions that random errors in the FFQ and 24HR are not correlated, that the relationship between the reference method (24HR) and main study method (GUMLi EAT FFQ) is linear (using log-transformed, energy-adjusted intakes) and that the 24HR provides a true reflection of mean nutrient intakes in our population. Most calibration coefficients reported in the present study were <0·50 after energy adjustment, which in nutrition research indicates a large degree of attenuation due to random errors in the GUMLi EAT FFQ measurements(Reference Kipnis, Freedman and Brown56,Reference Millen, Midthune and Thompson57) .
This is the first study that calibrates dietary intake data from an FFQ that has been designed specifically for children living in New Zealand and Australia. This method produced coefficients that can be used to correct mean energy and nutrient intakes estimated by GUMLi EAT FFQ administration in order to provide a more accurate estimate of the expected ‘true’ nutrient intake or a measure of the assessment of association between dietary intake and disease(Reference Bennett, Landry and Little22,Reference Rosner and Willett39,Reference Araujo, Yokoo and Pereira58) . The calibration of the GUMLi EAT FFQ designed for children 12–24 months of age allowed us to obtain mean nutrient intakes that were similar to those obtained from the 24HR reference method; however, there was a reduction in the data dispersion, seen as a decrease in standard deviations. The decrease in standard deviation of calibrated data has previously been reported(Reference Kaaks, Riboli and van Staveren11,Reference Carithers, Talegawkar and Rowser59–Reference Hoffmann, Kroke and Klipstein-Grobusch61) . Other studies calibrating FFQ in adolescents and adults obtained a similar range of calibration factors as reported in the present study. Calibration factors have been estimated to be as low as −0·07 for Fe by Slater et al. (Reference Slater, Marchioni and Voci62) to 1·13 for alcohol in adult men(Reference Johansson, Hallmans and Wikman42). For the secondary outcomes of the GUMLi trial, calibration factors for Fe were 0·4 at month 9 and 0·3 at month 12, within the ranges reported in adolescent and adult populations(Reference Kaaks, Riboli and van Staveren11,Reference Carithers, Talegawkar and Rowser59–Reference Hoffmann, Kroke and Klipstein-Grobusch61) . Few studies have assessed vitamin D calibration factor estimates. Carithers et al. (Reference Carithers, Talegawkar and Rowser59) reported calibration factors of 0·45 for men and 0·47 for women, higher than the 0·1 and 0·2 at month 9 and 12 of the GUMLi trial. It is difficult to make direct comparisons in calibration factors estimated for vitamin D, as the study by Carithers et al. (Reference Carithers, Talegawkar and Rowser59) was performed in the USA, where significantly more foods are fortified with vitamin D compared with New Zealand and Australia(Reference Shrapnel and Truswell63). However, the calculated calibration factors could be useful in future research, where dietary intake is the explanation variable when determining the association between diet and disease(Reference Kaaks, Riboli and van Staveren11,Reference Kaaks and Riboli64) .
Strengths and limitations
This is the first study to calibrate dietary intake data measured by an FFQ designed to measure usual dietary intake in 12- to 24-month-old children. Calibration factors provide a measure of the extent of the GUMLi EAT FFQ measurement error and have provided a factor to correct the estimated mean energy and nutrient intakes. The record-assisted 24HR was selected in an attempt to eliminate unintentional misreporting and provides a more accurate assessment of the participating child’s intake; however, it is possible that by pre-allocating the 24HR day and allowing an initial record to be made, this may have impacted on increased motivation for better child feeding practices. Use of multiple 24HR as the ‘alloyed gold standard’ has residual error and systematic bias(12,Reference Bennett, Landry and Little22) . The difficulties faced by parents in estimating portion sizes using their child’s palm volume and the potential for this method of portion estimation exacerbating nutrient overestimation could be strengthened by using photographs of their children holding specific food in their palms to gauge quantity at each FFQ time point to reduce bias in the reporting of food intake portions. Reliance on participant memory creates potential for measurement error, which was mitigated by the use of a single well-trained interviewer to elicit high levels of detail and useful nutritional data(Reference Bennett, Landry and Little22). It was therefore assumed that multiple record-assisted 24HR would be prone to less systematic bias than the GUMLi EAT FFQ whilst also attempting to minimise participant burden during participation in the wider GUMLi randomised controlled trial. Nutrient intakes were positively skewed; therefore, logarithmic transformations were performed to increase normality and reduce the influence of extreme intake values before calculating Pearson coefficients(Reference Bennett, Landry and Little22). Performing validation and calibration statistics allowed both random and systematic error to be addressed(Reference Bennett, Landry and Little22); however, it is likely that there may be some positive correlation between the random errors in the GUMLi EAT FFQ and 24HR (an imperfect reference method), which would result in an overestimation of the calibration factor (λ) calculated(Reference Kipnis, Freedman and Brown56,Reference Kipnis, Midthune and Freedman65) . Use of energy-adjusted nutrient densities (as used in the present study) may be one method of addressing correlation of random error between assessment tools. As with most validation studies, these results may not be generalisable to other populations.
Although the EAT FFQ used a unique method of estimating portion sizes, it is possible that describing portion sizes according to the size of their child’s palm was confusing for some caregivers and may have resulted in an over-estimation of quantities eaten. As reported in the original validation study(Reference Watson, Heath and Taylor18), the GUMLi EAT FFQ was administered to primary caregivers only, regardless of whether their child attended day care. This resulted in an estimation of food eaten away from primary caregivers, potentially contributing to over-estimation of usual nutrient intakes. To mitigate some of the bias associated with using a 24HR to measure dietary intake (i.e. memory of consumption and accurate reporting of portion sizes), a ‘Foods fed by other adults’ record sheet was used to record intake during the 24HR period when the child was in the care of another adult, consuming meals that are not under parental control(Reference Baranowski, Sprague and Baranowski66). An adapted ‘Food Model Booklet’ was used as a visual aid for caregivers during the 24HR period to provide further assistance with portion estimation. This booklet has previously been validated for use in the Children’s Nutrition and Physical Activity Survey, with moderate to strong correlations between weighed and recalled portions(24). However, remains a crude measure for portion estimation.
The use of biomarkers that have a strong and independent relationship with dietary intake is the most preferable way to validate dietary assessment method and explore the relationship between true, usual intake and self-reported intakes; however, recovery markers are not available for all nutrients(Reference Potischman and Freudenheim67). Collecting recovery biomarkers for energy (using doubly labelled water) or protein (urinary nitrogen) intakes was not feasible in our population of 18- to 23-month-old children, who were already participating in an intensive longitudinal randomised controlled trial. Fe and vitamin D status at 24 months of age were secondary outcomes of the main trial and have recently been reported(Reference Lovell, Davies and Hill68). Correlation biomarkers of serum nutrients are also a useful measure of validity(12), and in this study, measures of Fe and vitamin D status were available from blood samples collected at baseline and on completion of the trial. However, these biomarkers were not useful to this analysis, as data from reported intakes were used from month 8 following randomisation and not baseline where the sample was obtained. Determining the correlations between serum and dietary measures of Fe and vitamin D would be useful for further indication of the GUMLi EAT FFQ validity.
In conclusion, the GUMLi EAT FFQ had a similar estimated level of validity compared with other FFQ measurements in children under 2 years of age. The GUMLi EAT FFQ remained a useful tool to rank the nutrient intakes of young children living in Australia and New Zealand in the latter half of the second year of life, where dietary intakes may be more reflective of the family diet. The calibration factors from this study can be used to correct for attenuation and regression dilution bias of nutrient densities in future studies, particularly when relating relative risk estimates to disease outcomes.
Acknowledgements
The GUMLi trial received an investigator-initiated grant from Danone Pty Ltd. The funder had no role in data collection, analysis and interpretation of the study.
P. S. W. D., C. R. W. and C. C. G. developed the GUMLi trial. A.-L. M. H., M. M., R. J. H., C. R. W. and P. S. W. D. wrote the study protocol. A.-L. M. H., M. M., T. M. and R. J. H. conducted the study. A.-L. M. H. and C. R. W. wrote the manuscript. A.-L. M. H., Y. J. and R. X. C. conducted the statistical analyses of the data. All authors read and approved the final manuscript.
C. R. W. has received honoraria for presentations and consultations from Danone, Nutricia, Pfizer and Fonterra. C. C. G. has received honoraria for consultations from Fonterra. A.-L. M. H. has no conflicts of interest. A. L. L. has no conflicts of interest. T. M. has no conflicts of interest. Y. J. has no conflicts of interest. R. X. C. has no conflicts of interest.
Supplementary material
For supplementary material referred to in this article, please visit https://doi.org/10.1017/S0007114520002664


