


Body composition is acknowledged as a key health and performance parameter for those participating in sport(Reference Mathisen, Ackland and Burke1). A recent review found that increased body fat (BF) was negatively associated with race times, average running speed and training volume, while lean mass gains were mainly attributed to positively influencing endurance-based metrics(Reference Mathisen, Ackland and Burke1). Therefore, quantifying fat mass and fat-free mass has become a fundamental measure within many sports. Over the last decade, the most commonly used method to assess the body composition (BC) of trained individuals is the skinfold (SKF) assessment under the International Society for the Advancement of Kinanthropometry (ISAK) accreditation(Reference Mathisen, Ackland and Burke1,Reference Meyer, Sundgot-Borgen and Lohman2) . SKF fall under the procedure of surface anthropometry, also including measures of body mass (BM), stature, lengths, breadths and circumferences(Reference Stewart, Marfell-Jones and Olds3). These field-based measures, specifically SKF, are favourably used due to their low cost, practical ease of use, compact user-friendly equipment and non-invasive nature(Reference Ackland, Lohman and Sundgot-Borgen4,Reference Kasper, Langan-Evans and Hudson5) .
Surface anthropometric (SA) measures are indirect in nature, acting as a surrogate measure to assess BC. SKF follow the two-compartmental (2C) model. This model assesses the body as two distinct parts: fat mass and fat-free mass(Reference Behnke and Wilmore6,Reference Withers, Laforgia and Heymsfield7) . Particularly with SKF, the assumption is that the standardised measuring sites have a linear relationship with total body subcutaneous fat and that the subcutaneous fat is directly related to total BF(Reference Stewart, Marfell-Jones and Olds3). There are a number of technical limitations associated with SA measures, specifically SKF and circumferences. These include anthropometrist experience, anatomical landmarking and equipment used. Previous research highlighted that a 1 cm variance from the standardised ISAK SKF sites significantly impacts outcome measures, emphasising the significance of site location, tester training and protocol adherence(Reference Hume and Marfell-Jones8). Additionally, anthropometrist accuracy when performing and repeating measures can be accounted for through technical error of measurement (TEM), establishing an error margin associated with each measure. To that end, the ISAK training and standardised procedures are recommended to mitigate errors.
While technical error can be easily accounted for, biological variation due to daily activities (food ingestion, fluid intake and physical activity) can be more difficult to account for. A common recommendation for standardising BC assessment is ensuring that the individual being measured presents in an overnight fasted, well-rested and euhydrated state(Reference Meyer, Sundgot-Borgen and Lohman2). Despite the recommendation for standardised procedures, research suggests that non-standardised procedures appear to provide similar results as standardised, specifically for the SKF method(Reference Kerr, Slater and Byrne9). Literature demonstrates that hydration status does not significantly impact measures of SKF, primarily due to the indirect nature of the 2C model(Reference Norton, Hayward and Charles10). In addition to this, research by Kerr et al. (Reference Kerr, Slater and Byrne9) established that SKF assessment remained reliable from standardised to non-standardised procedures in active males. SKF were found to be the most robust method across varying hydration levels, meal ingestion, activity levels and free-living when compared with fat estimates from other methods including air displacement plethysmography and dual-energy x-ray absorptiometry(Reference Kerr, Slater and Byrne9). This study remains the only study to investigate the impact of daily activities on the reliability of the SKF assessment. There is a paucity of available information on the possible impact of non-standardised procedures on SA assessment, inclusive of body circumferences, in the female population. Due to the known physiological differences between the sexes, it is not necessarily appropriate to apply the present data on males to females(Reference Hirsch, Smith-Ryan and Trexler11).
Collecting BC data on the athletic population in line with the recommended guidelines presents logistical concerns for practitioners. Due to the training and nutritional demands of sporting activities, there is a short period in the early morning when this population is fasted and rested, making it difficult to assess BC measures, particularly for those following a strict regimen. A recent survey found that only 32 % of practitioners working with athletes worldwide adhere to pre-test standard guidelines for BC assessment(Reference Mathisen, Ackland and Burke1). Despite this, it currently remains unclear if standardised v. non-standardised procedures reap differing results for SA assessment in trained females. Provided that the technical error is appropriately accounted for, establishing the within-day agreement of SKF and circumferences could allow for the measures to be collected outside of standard practice. This could allow for the measures to be reliably conducted at any time of the day, without the need for individuals to attend in a standardised state. Therefore, the aim of this study was to assess the within-day absolute and relative agreement between standardised and non-standardised measures of BM, SKF and circumferences in a group of trained females.
Methods
Design
SA measurements were taken on two separate occasions on the same day under a (1) standardised condition – morning (07.00–09.00), overnight fasted, no exercise for 12 h, euhydrated, with bladder and bowel void, and (2) non-standardised condition – 9–10 h later in the evening, ad libitum food, fluid and physical activity. Participants were instructed to live as normal between measurements. Each testing session was conducted using identical testing methods, measuring urine osmolality for hydration, BM, stature, SKF and circumferences. Measurements were performed by the same ISAK level 1 anthropometrist with 2 years of experience. All assessments were performed with strict adherence to ISAK protocols to minimise intra-rater variability. This study was conducted according to the guidelines laid down in the Declaration of Helsinki, and ethical approval was granted by the South East Technological University’s ethics committee (Ref: 312). Prior to participation, written informed consent and medical screening forms were obtained for all participants.
Participants
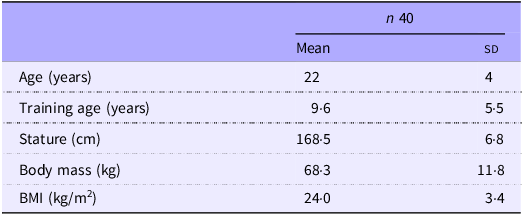
Forty females (aged 22· (sd 4·) years) participated in this study. Volunteers were recruited via the university’s health science courses, sport societies and local sports clubs. All participants were categorised as trained/developmental (Tier 2) as per the McKay et al. (Reference McKay, Stellingwerff and Smith12) framework and were actively training ≥ 3 d per week and competing in their respective sport. Participants were healthy and not pregnant. Descriptive data for all participants (n 40) are presented in Table 1. The sports represented were athletics (n 5), camogie (n 8), Gaelic football (n 8), soccer (n 9), basketball (n 3), powerlifting (n 3), Irish Dancing (n 2), rugby (n 1) and karate (n 1). A total of twenty participants were naturally menstruating, and twenty were using a contraceptive (oral contraceptive pill: n 16, intrauterine device: n 2, implant: n 2). Phases of the cycles (natural and oral contraceptive pill cycles) were recorded; however, they were not controlled for.
Participant characteristics

Data for body mass and stature are presented as measures taken during the standardised measure. Data are presented as means and standard deviations.
Standardised procedure protocol
Participants were required to attend the standardised measurement in a controlled and standardised state. They attended the session in the early morning between 07.00 and 09.00, post wake, and were instructed to fast overnight (8–12 h), abstain from high intensity training for 12 h prior and attend in a euhydrated state (Figure 1)(Reference Meyer, Sundgot-Borgen and Lohman2). To ensure adequate hydration post sleep, it was recommended to participants to void their bladder, as normal, upon waking and then sip 500 ml of water up to 1 h prior to testing. Participants were instructed not to overdrink immediately prior to the assessment.
Schematic of measurement sessions from standardised to non-standardised conditions. Legend: Standardised measurement – fasted, rested, hydrated. Non-standardised measurement – post ad libitum (free-living).

Non-standardised procedure protocol
Participants were required to attend the non-standardised measurement later the same day in a non-standardised state (Figure 1). They were instructed to return to the laboratory approximately 9–10 h later, in the evening (mean time between sessions: 9·5 h). For the time between the two measurement sessions, they were instructed to live ad libitum (continue their day with free-living).
Surface anthropometry
BM was collected with no footwear and minimal clothing using a digital scale (Seca GmbH 784). BM was recorded to the nearest 0·01 kg. Stature was measured using a digital stadiometer (Height Measure, Seca GmbH 213) and recorded to the nearest 0·01 cm.
SKF measurements were collected following ISAK guidelines(Reference Stewart, Marfell-Jones and Olds3). The eight SKF sites – triceps, subscapular, biceps, iliac crest, supraspinale, abdominal, thigh and medial calf – were taken from the right side of the body. Measurements were recorded to the nearest 0·2 mm using a calibrated Harpenden calliper (HaB Direct, Harpenden Calliper). Two measurements were taken at each site to ensure intra-rater consistency, and the mean was used. If the second measurement was more than 5 % from the first, a third measurement was taken, and the median was used for analysis. The sum of eight SKF (∑8 SKF) was calculated.
Circumference measures were collected as per ISAK guidelines at six sites(Reference Stewart, Marfell-Jones and Olds3). Sites included arm relaxed, arm flexed and tensed, waist, hips, mid-thigh and calf. Measurements were recorded to the nearest 0·1 cm using an anthropometric tape measure (Lufkin W606PD Executive Diameter Pocket Tape Measure). Two measurements were taken at each site, and the mean was used. If the second measurement was more than 1 % from the first, a third measurement was taken, and the median was used for analysis.
Mean % intra-tester TEM was calculated for the anthropometrist for all measures (standardised measure 1 and standardised measure 2) as described by Perini et al. (Reference Perini de Oliveira, De Oliveira and Santos Ornellas13). Mean TEM for ∑8 SKF was 1·6 % and 1 % for all other measures.
Statistical analyses
Group means and sd were calculated for all measures across standardised and non-standardised procedures. These data were compared, and changes in the mean were calculated (mean non-standardised procedure minus mean standardised procedure). Typical error (TE) was calculated between the standardised measure and the non-standardised measure by ${{SD} \over {\sqrt 2 }}$
, where sd was the pooled sd from both measures. Relative reliability was assessed by computing ICC and 95 % CI for all measures using Statistical Product and Service Solutions (version 28.0, SPSS Inc.), based on a two-way mixed effects model with absolute agreement as only one tester conducted the measurements. Single measures intra-class correlation coefficient (ICC) were reported. Data were tested for normal distribution using the Shapiro–Wilk test. Where data were normal, a paired samples t test was used to determine if differences existed between the means of all measures under standardised v. non-standardised procedures. Where data were not normal, a log transformation using the log10 function was applied to raw data, and a paired samples t test was subsequently used (all data are presented in the raw form). The criteria for significance were set using α level P ≤ 0·05. Bland–Altman(Reference Bland and Altman14) plots were generated for ∑8 SKF as the primary outcome measure for SKF and all circumference sites.
${{SD} \over {\sqrt 2 }}$
, where sd was the pooled sd from both measures. Relative reliability was assessed by computing ICC and 95 % CI for all measures using Statistical Product and Service Solutions (version 28.0, SPSS Inc.), based on a two-way mixed effects model with absolute agreement as only one tester conducted the measurements. Single measures intra-class correlation coefficient (ICC) were reported. Data were tested for normal distribution using the Shapiro–Wilk test. Where data were normal, a paired samples t test was used to determine if differences existed between the means of all measures under standardised v. non-standardised procedures. Where data were not normal, a log transformation using the log10 function was applied to raw data, and a paired samples t test was subsequently used (all data are presented in the raw form). The criteria for significance were set using α level P ≤ 0·05. Bland–Altman(Reference Bland and Altman14) plots were generated for ∑8 SKF as the primary outcome measure for SKF and all circumference sites.
Results
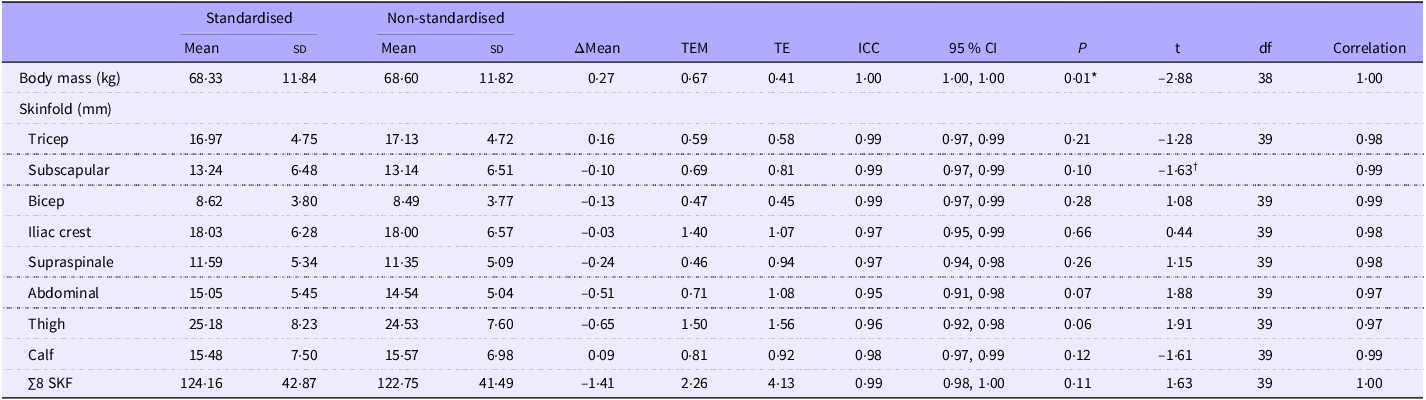
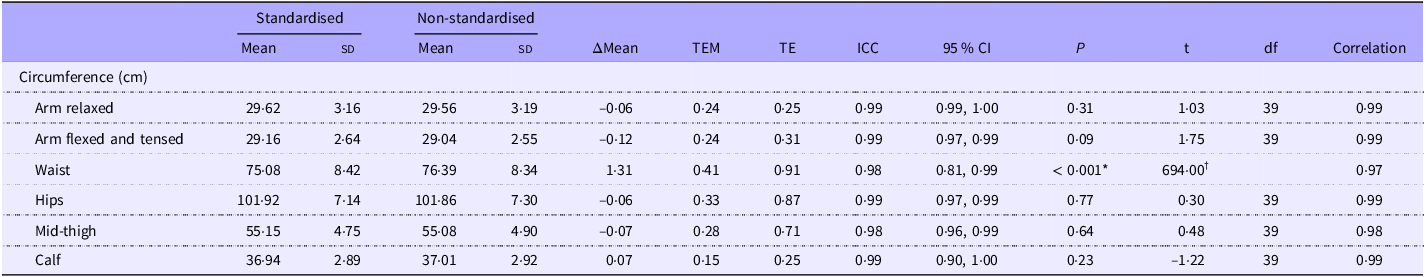
BM and SKF measures across standardised and non-standardised conditions are represented as means (sd) in Table 2. Circumference measures are presented in Table 3.
Standardised and non-standardised raw data (mean (sd)), calculated error indices (TEM and TE), reliability statistics (ICC and 95 % CI) and t test statistics for BM and SKF measures

TEM, technical error of measurement; TE, typical error; ICC, intra-class correlation coefficient; BM, body mass; SKF, skinfold.
*Denotes the non-standardised measure was significantly different from the standardised measure (P < 0·05). For the subscapular SKF measure, a Wilcoxon signed-rank test was used, denoted by † (Spearman correlation used, df not reported).
Standardised and non-standardised raw data (mean (sd)), calculated error indices (TEM and TE), reliability statistics (ICC and 95 % CI) and t test statistics for circumference measures

TEM, technical error of measurement; TE, typical error; ICC, intra-class correlation coefficient; BM, body mass; SKF, skinfold.
*Denotes the non-standardised measure was significantly different from the standardised measure (P < 0·05). For waist circumference, a Wilcoxon signed-rank test was used, denoted by † (Spearman correlation used, df not reported).
The change in the mean of BM from standardised to non-standardised (+0·27 kg) was smaller than the calculated error margins (TEM = 0·67 kg and TE = 0·41 kg) (Table 2). Relative reliability for BM was excellent (ICC = 1·00 (1·00, 1·00)). A statistically significant change was recorded for BM from the standardised to non-standardised measure (68·33 (sd 11·84) kg v. 68·60 (sd 11·82) kg, respectively, P = 0·01).
The change in overall group means for all individual SKF sites was smaller than the calculated TEM and TE (Table 2). Excellent reliability measures were recorded for each individual site. No significant change in group means was recorded for individual sites.
The ∑8 SKF was lower for the non-standardised measure when compared with the standardised measure (122·75 mm v. 124·16 mm, respectively). The change in the mean (–1·41 mm) was lower than both calculated error margins (TEM = 2·26 mm and TE = 4·13 mm). Excellent reliability was noted for ∑8 SKF (ICC = 0·99 (0·98, 1·00)). No significant difference was recorded between the overall group means for the ∑8 SKF (P = 0·11).
Mean change for five of six circumference measures (arm relaxed, arm flexed and tensed, hips, mid-thigh and calf) was smaller than the calculated TEM and TE for each measure (Table 3). Excellent reliability measures were demonstrated for arm relaxed, arm tensed, hips, mid-thigh and calf. No significant differences were reported between group means for circumference measures of arm relaxed, arm flexed and tensed, hips, mid-thigh and calf. The change in the mean from the standardised to non-standardised condition for waist circumference (+1·31 cm) was greater than the calculated error indices of TEM and TE (0·41 cm, 0·91 cm, respectively). An excellent reliability statistic was recorded for waist circumference (ICC = 0·98) with slightly larger 95 % CI limits (0·76, 0·99). A significantly greater group mean was recorded for the non-standardised waist circumference measure when compared with the standardised measure (76·39 (sd 8·34) v. 75·08 (sd 8·42) cm, respectively, P ≤ 0·001).
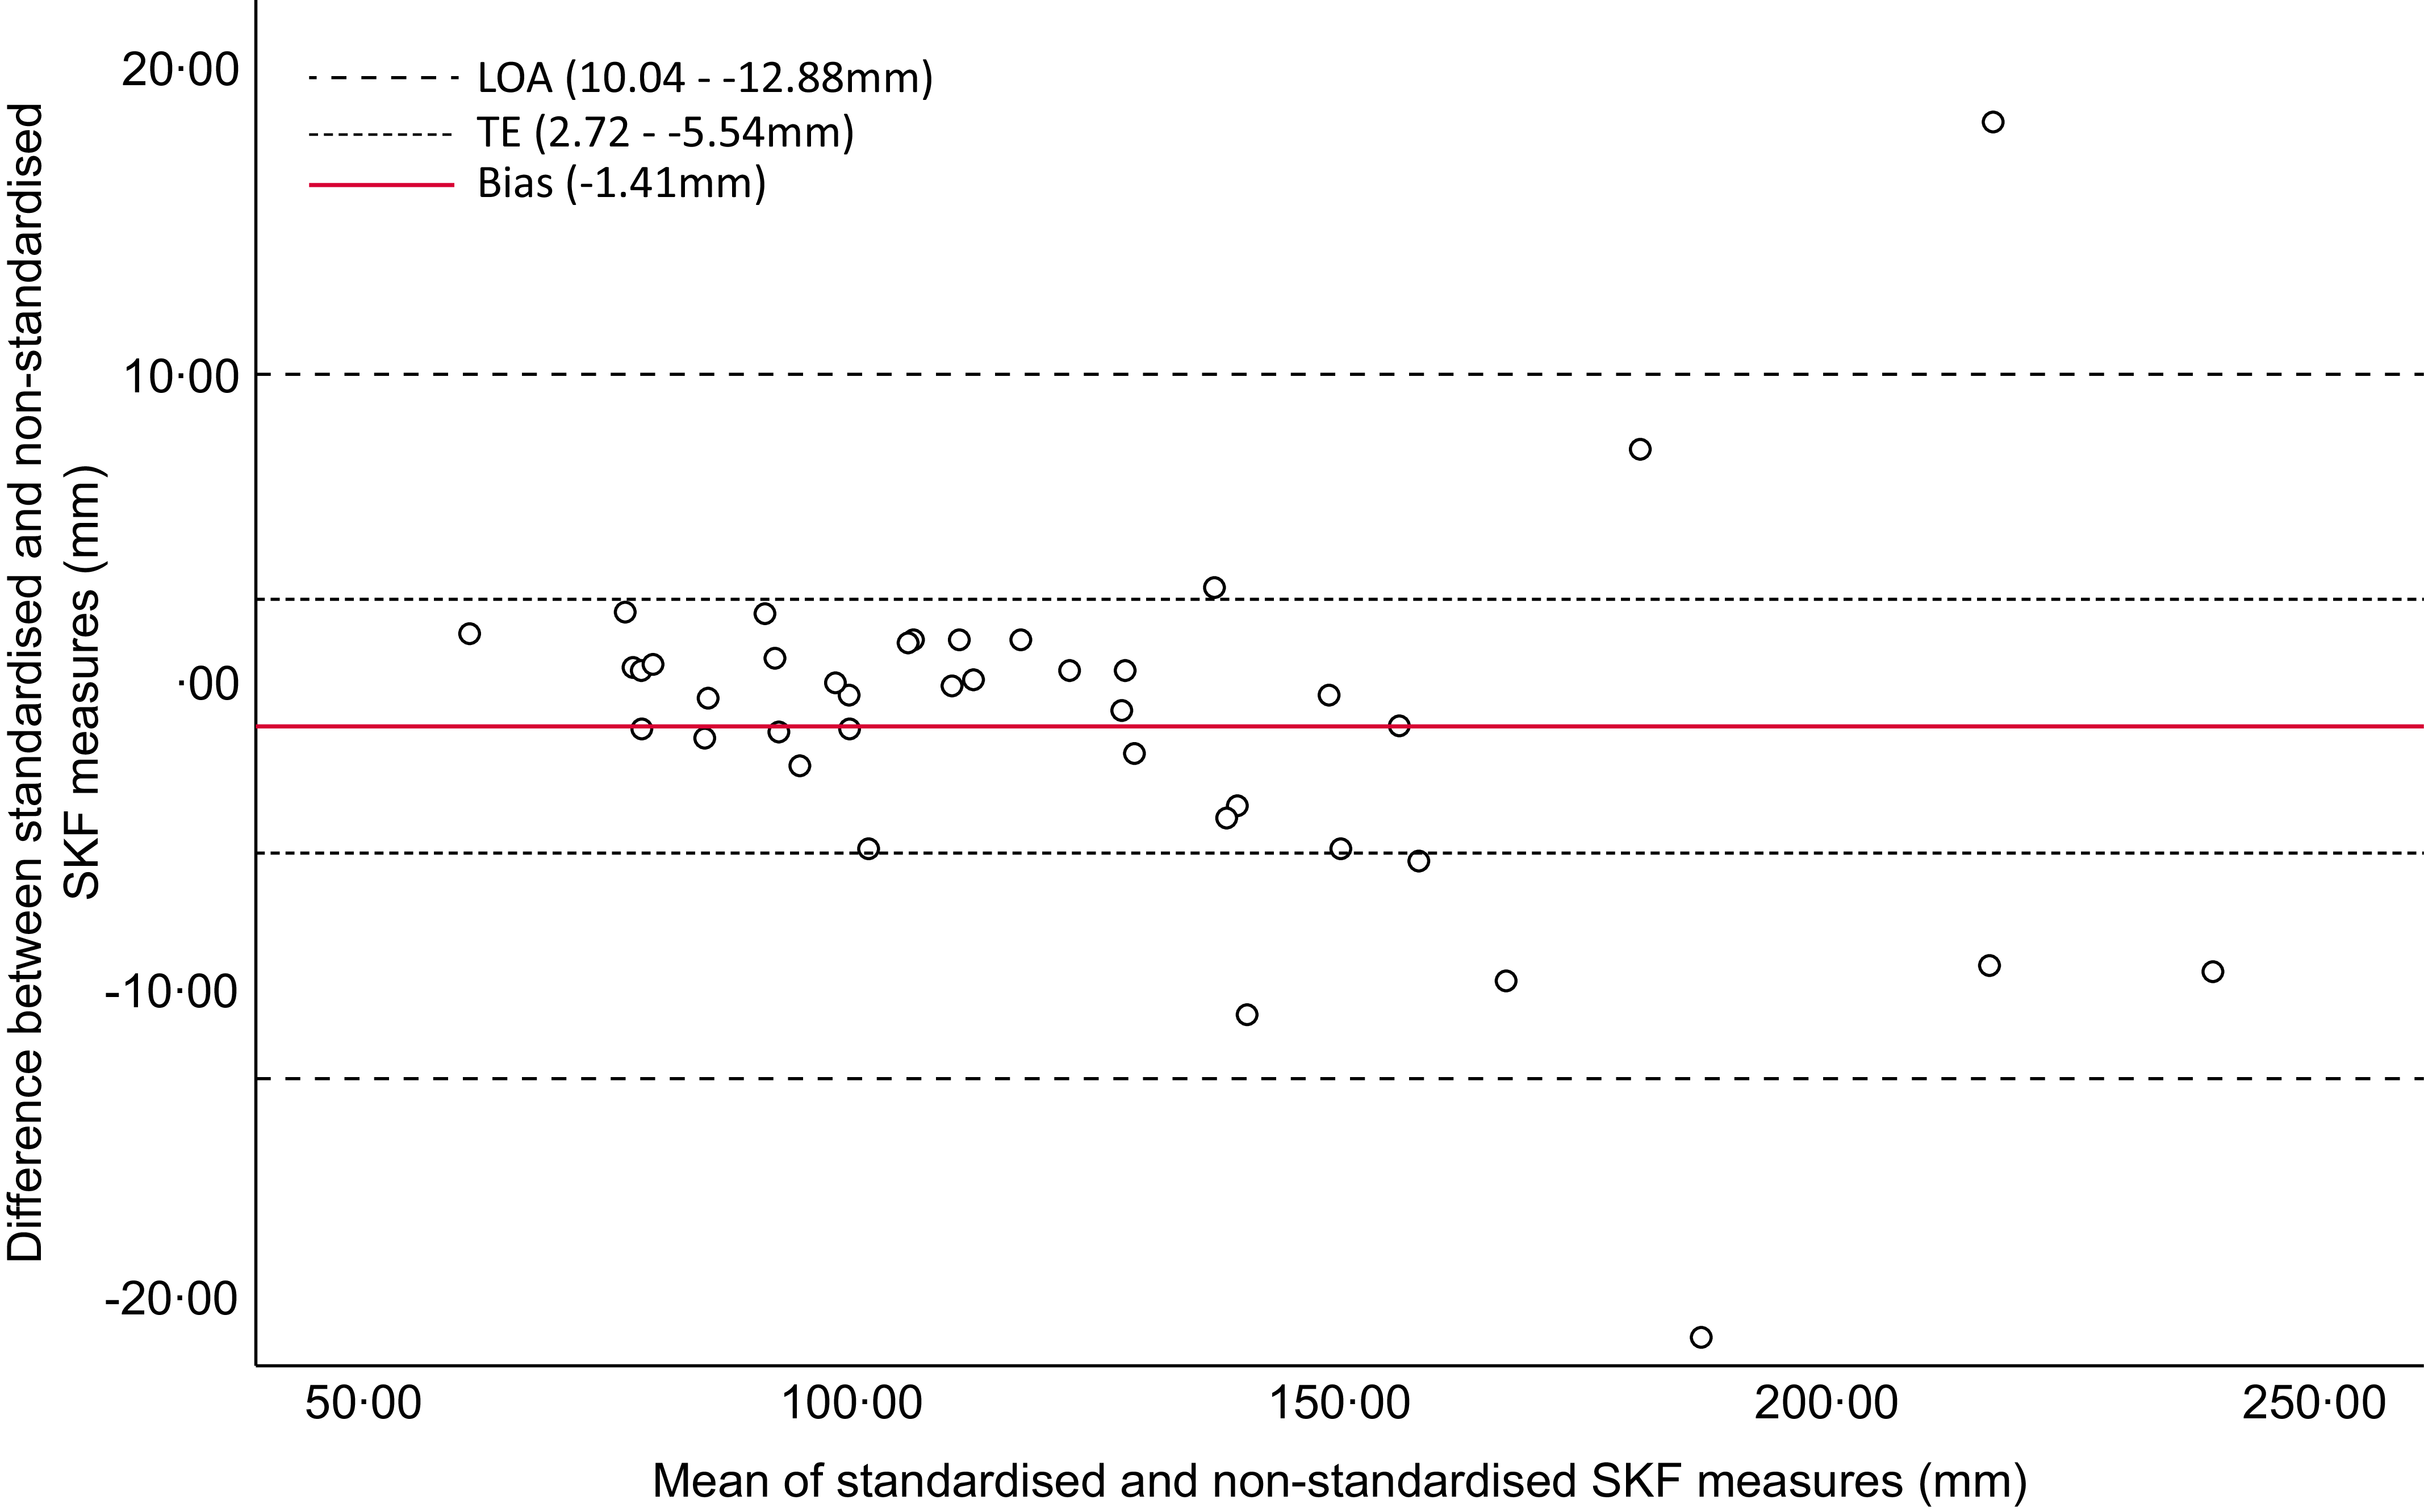
The Bland–Altman plot (Figure 2) for the ∑8 SKF indicates good agreement between standardised and non-standardised measures. The Bland–Altman plot includes 95 % limits of agreement and calculated TE for the measure. Excellent agreement, a mean difference (bias) within the calculated TE range and limits of agreement, is demonstrated in participants with ∑8 SKF < 136 mm. Bland–Altman plots (Figure 3) demonstrate good agreement but varying levels of individual variability.
Bland–Altman plot with typical error (TE) and 95 % limits of agreement (LOA) between standardised and non-standardised measures for the sum of eight skinfold (∑8 SKF) sites.

Bland–Altman plots with typical error (TE) and 95 % limits of agreement (LOA) between standardised and non-standardised circumference measures for (a) arm relaxed, (b) arm flexed and tensed, (c) waist, (d) hips, (e) thigh and (f) calf circumference.

Discussion
This is the first study to examine the influence of daily activities on SA measures in trained females. The aim of the present study was to assess the agreement between standardised and non-standardised SA outcome measures, throughout the same day. The primary finding of this study suggests that group mean SKF outcome measures, both individual sites and ∑8 SKF, had a high level of agreement between both conditions in individuals with lower levels of BF (∑8 SKF < 136 mm). The majority of circumference measures (arm relaxed, arm tensed, hips, thigh and calf) were also robust across both timepoints. However, findings portray that while SKF and five of six circumference sites show consistent agreement, measures of BM and waist circumference show higher levels of variability throughout the day.
Recent research, assessing the influence of biological error on SA measures in active males, found ∑8 SKF to be reliable across standardised and non-standardised conditions(Reference Kerr, Slater and Byrne9). The authors concluded that surface anthropometry, reported in its raw form (mm), produced the most reliable measures when taken throughout the day when compared with other 2C, 3C and 4C methods. Similar to Kerr et al. (Reference Kerr, Slater and Byrne9), this present study found that the change in the overall group mean of ∑8 SKF from the standardised to non-standardised measure was smaller than both calculated TEM and TE. This demonstrates that the change in ∑8 SKF was not meaningful when compared with the measurement error associated with the anthropometrist or the specific test, suggesting a high level of agreement across varying presentation states. Provided all other standard protocols are adhered to (e.g. trained anthropometrist, ISAK protocol adherence and calibrated equipment), this measure can be reliably taken later in the day. In addition to being the first study to investigate this topic on trained females, it is the first study of its kind to report the agreement between individual SKF sites. Similar to ∑8 SKF, the eight individual SKF sites demonstrated excellent reliability and high levels of agreement between measures taken under varying conditions.
The SKF method follows the 2C model of BC assessment that only estimates fat mass and thus may explain why outcome measures remain reliable across varying presentation states. SKF are a measure of subcutaneous fat, which serves as a long-term energy reserve. Subcutaneous fat accumulation represents a metabolic sink where triglycerides are stored, from the formation of excess fatty acids and glycerol, occurring in response to energy balance and metabolic demands(Reference Freedland15). The accumulation of these fat stores can be a lengthy process, resulting from a long-term mismatch of energy intake and output. Therefore, subcutaneous fat stores may not be directly impacted by acute caloric ingestion throughout the course of one day. With that, greater variability (‘noise’) in the data is identified in participants with ∑8 SKF > 136 mm (Figure 2). In this context, individuals with greater levels of adiposity elicit greater variability between standardised and non-standardised measures. Despite measures being performed by an ISAK-trained anthropometrist and in line with ISAK procedures, skin compressibility can be largely inconsistent within individuals(Reference Clarys, Martin and Drinkwater16). It is also not unusual to see large variances and error margins in SKF measures, specifically with those who have greater fat mass levels(Reference Kasper, Langan-Evans and Hudson5), due to inaccuracies in identifying anatomical landmarks, difficulty pinching larger areas, compression of subcutaneous fat, anthropometrist experience and calliper limitations. These factors are recognised sources of error in SKF assessment and likely explain the wider limits of agreement observed in the Bland–Altman plot for ∑8 SKF. To that end, emphasis is placed on choosing the most appropriate BC assessment method for specific populations. With reference to this specific cohort, it is suggested that due to the discrepancies noted between measures for individuals with ∑8 SKF > 136 mm, standard pre-test guidelines should be adhered to, or alternatively, a better-suited method should be used (specifically dual-energy x-ray absorptiometry).
Five of six circumferences (arm relaxed, arm flexed and tensed, hips, thigh and calf) showed mean changes smaller than the calculated error measures, with no significant changes detected throughout the day. These findings suggest that daily activities may not acutely impact these circumference outcome measures. However, when assessing individual changes in circumference measures via Bland–Altman plots (Figure 3), considerable individual variability was evident. This likely reflects the inherent sensitivity of circumference measurements to factors such as posture and landmark placements. Practitioners should therefore be aware of the potential intra-individual variance when interpreting repeat circumference measures, even when changes are not significant.
Waist circumference displayed good to excellent reliability (ICC = 0·98) but with a wider 95 % CI (0·76, 0·99) than other measures. A significantly greater waist circumference was recorded for the non-standardised compared with the standardised measure (76·39 (sd 8·34) cm v. 75·08 (sd 8·42) cm, respectively, P ≤ 0·001). Daily changes in waist circumference can be attributed to the reduction of stomach muscle tone, known as gastric accommodation. This process reduces stomach muscle tone to allow for expansion and the temporary storage of food until gastric emptying occurs post-digestion(Reference Janssen, Verschueren and Giao Ly17). Due to the influence of daily eating habits and fluid intake, it is suggested that, in order to obtain a true waist circumference value, the measures should be collected in a standardised state.
BM displayed excellent relative reliability (ICC = 1·00, (1·00, 1·00)) and the change in the group mean was less than the calculated error margins. However, BM was significantly higher for the non-standardised measure, later in the day, when compared with the standardised measure (68·60 (sd 11·82) kg v. 68·33 (sd 11·84) kg, respectively, P = 0·01). The possibility of a type I error must be considered. Given that the change in the mean was small, relative to measurement error, the statistical significance may not correspond to a meaningful or practical change within this cohort. BM can be directly influenced by environmental factors, including the ingestion of food, fluid intake and activity. A high-carbohydrate diet elicits significant increases in muscle glycogen stores(Reference Bussau, Fairchild and Rao18), and higher muscle glycogen levels have been associated with increased water retention within the muscle(Reference Jeukendrup19). These changes in muscle glycogen stores and fluid retention can evoke acute changes in BM throughout the day. Kerr et al. (Reference Kerr, Slater and Byrne9) recorded a higher BM later in the day and concluded that due to biological error, BM should be collected in a standardised manner. The present study corroborates these findings, specifically when accuracy is required. However, practitioners must be aware that possible changes in BM from a standardised to a non-standardised measure may not represent a meaningful change beyond the measurement noise.
From a practical standpoint, best practice pre-test guidelines may not always be adhered to due to a multitude of factors, specifically when working with the athletic population. Collecting measures first thing in the morning, fasted and rested, presents logistical issues for large squads or individuals that adhere to strict training and nutritional schedules. These pre-test guidelines not only present a constraint on the individual being measured but also on the anthropometrist, as they limit the time of testing to the morning only. To that end, the present findings suggest that measures of SKF and circumferences (arm relaxed, arm flexed and tensed, hips, mid-thigh and calf) do not have to be limited to the early-morning standardised guidelines, specifically for more lean individuals. This insight into the consistency of SA measures across the day in individuals with lower BF levels gives confidence to trained practitioners collecting data outside of best practice pre-test conditions. This is particularly useful in an applied practice where individuals may only be available for assessment later in the day. For individuals with greater levels of adiposity, measures should be collected in a standardised state, or alternatively, a better-suited BC measure should be chosen (e.g. dual-energy x-ray absorptiometry). Anecdotal evidence suggests a recent shift toward the use of corrected girths to calculate muscle girths of the arm, thigh and calf in athletes. These updated procedures in applied practice eliminate the use of waist and hip circumferences in the athletic population, thus limiting the concern associated with the influence of daily food and fluid ingestion on waist circumference throughout the day.
Limitations of this study include the heterogeneity in BC outcome measures within the chosen cohort. It is acknowledged that participants in the present study represented various sport types, which may have influenced BC characteristics. However, between-sport comparisons were not conducted due to small subgroup sizes. Variability in BC measures was observed across the sample, namely, ∑8 SKF, contributing to non-normal data distribution. Future research with larger sample sizes and/or sport- and position-specific samples may allow for normally distributed data. Despite this, these data are arguably more representative of the entire population of females who participate in competitive sport at a sub-elite level due to the spread of the data. An additional factor to consider is that the reproductive phase was not controlled for within this study. Although beyond the scope of the study, it is acknowledged that female-specific sex hormones, namely, oestrogen and progesterone, may have an impact on BC outcome measures between phases(Reference Hicks, Mclester and Esmat20). As all measurements were collected within a single day, participants were assessed within the same phase of their reproductive cycle. Consequently, the impact of hormonal fluctuations on BC measures was minimised within the acute testing period. However, further investigation into this topic is warranted, and there should be a specific focus on possible changes in BC measures between phases and across consecutive menstrual cycles, with a longitudinal study design.
This study also had several strengths. This study provides a basis for reliably collecting SA (excluding waist circumference) data outside of pre-test standard conditions in individuals with ∑8 SKF < 136 mm, which is repeatedly being done within the field. This study also highlights how measures of BM and waist circumference may be influenced by daily food and fluid intake and activity and thus should be performed in a standardised state to ensure accuracy. These key findings highlight the translation of this research into a real-world, applied context. As the current sample characteristics may represent a limitation due to varying sport types, predominantly lower BF and sub-elite classification, future research should explore measurement reliability in elite-level athletes who are likely to have different food, fluid and training habits from the current cohort. Future research should also focus on exploring the reliability of SA measures across a broader range of athlete profiles, including those with greater BM and adiposity. Understanding error margins and cut-off points for the use of SA assessment, specifically SKF assessment, would provide valuable insights into the usefulness of the method in diverse sporting populations. The findings of this study are generalisable to settings where SKF assessments are performed by ISAK-accredited anthropometrists. While results may differ from those taken by practitioners who are trained through other accreditation organisations, it is strongly recommended that trained assessors conduct SKF measures to ensure reliability and validity.
To the best of our knowledge, this is the first study investigating the within-day agreement between standardised and non-standardised SA measures in trained females. SKF data presented in this study are in accordance with available data on active males presented by Kerr et al. (Reference Kerr, Slater and Byrne9). In conclusion, SKF and circumference measures, with the exception of waist circumference, were not significantly affected during the non-standardised condition following ad libitum food, fluid and activity, particularly in leaner individuals. Provided all other standard procedures are followed and the anthropometrist’s TEM is acceptable, these measures can reliably be taken at any time of day. This lessens the burden of the time restriction associated with early morning, fasted and rested standards on individuals, teams and practitioners. By addressing the influence of daily food, fluid and activity routines on SA assessment, this study contributes to both the growing body of BC literature and practices in an applied context.
Acknowledgements
The authors would like to thank the participants who gave their time to this research study. The authors would like to thank Aoife Russell for her technical support throughout data collection.
This research was supported by the Higher Education Authority in Ireland through the South East Technological University in Carlow, under the South East Regional Development scholarship fund. The funding programme board had no input into the design, conduct or interpretation of the findings of the research study.
P. F. and S. J. C. were responsible for conceptualisation. N. B. O’C., P. F. and S. J. C. contributed to the study design. N. B. O’C. was responsible for participant recruitment, data collection, data analysis, data interpretation and writing of the original draft. P. F. and S. J. C. supervised the study and reviewed the manuscript. All authors read and approved the final manuscript.
The authors have no relevant conflicts of interest to declare.


 Open access