

The food nutrition label, also known as the nutrition information panel, which describes the nutrient content of a food, is required on most pre-packaged foods in many countries(1). In the USA, food manufacturers were required by law to provide consumers with accurate and reliable food product information since 8 May 1994(2). Similar regulations and guidelines on food nutrition labelling quickly took place in Canada, Australia and the European Union countries. In the 2004 WHO report, food nutrition labelling regulations were established in fifty-five of seventy-four countries and areas (74·3 %), with ten countries reinforcing the regulations as mandatory(1). It was not until January 2008 when China published its first Chinese Food Nutrition Labeling Regulation (CFNLR) endorsed by the Chinese Ministry of Health(3). Based on this regulation, all pre-packaged foods were included except for: (i) foods that are usually consumed ≤10 g/d (10 ml/d); (ii) pre-packaged raw fresh foods, including raw meat, fish, vegetables, fruit, etc.; (iii) foods in small packages with a surface area of 100 cm2 or less; (iv) foods cooked or made on site; and (v) foods with alcohol by volume of ≥0·5 %. Energy (calorie), fat, carbohydrate, protein and sodium are the key items that must be labelled, while SFA, cholesterols, sugar, fibre, vitamins and microelements are recommended to be labelled. Before this new regulation went into effect on 1 May 2008, food nutrition labelling was provided by the manufacturers on a voluntary basis.
While obesity might have traditionally been considered as a Western problem, it has become a worldwide problem, including China(Reference Wang and Lobstein4). In China, the national average prevalence of overweight and obesity has increased steadily over the past two decades, reaching 30 % nationwide with over 50 % among adults in major cities in 2002(Reference Wang, Mi and Shan5). The growing obesity epidemic is in part due to the changing food environment and people’s dietary intake, including the increasing consumption of foods with high fat, sugar and energy, such as snacks and sweetened beverages. Improving nutrition knowledge is an important strategy to promote healthy eating as well as for the prevention and management of obesity. Food nutrition labelling is an important tool for public nutrition education. Some studies have reported the beneficial effects of using nutrition labels on food intake(Reference Kreuter, Bernnan and Scharff6–Reference Weaver and Finke9). For example, individuals who used nutrition labels to assist food purchasing decisions reported a lower fat but higher fruit and vegetable intake(Reference Kreuter, Bernnan and Scharff6, Reference Neuhouser, Kristal and Patterson7). However, a recent study using a quasi-experimental approach to control for selection bias reported that the nutrition facts panel had a moderate beneficial impact on people’s dietary intake in the USA, and nutrition labels were found to be used by people with better nutrition knowledge(Reference Beydoun and Wang10, Reference Variyam11). Thus, population-based, effective public nutrition education is needed to help people make informed and healthy food choices to address the growing obesity epidemic. Potentially, food nutrition labelling can help achieve this goal.
While more rigorous regulations on critical issues such as trans fatty acid (TFA) in China are anticipated, the consumer’s right to accurate nutrition information is equally, if not more, important. A recent study(Reference Fu, Yang and Yuan12) showed that labelling information on TFA in food products sold in China remained scarce and some might be of questionable accuracy. The authors were surprised to identify the extraordinarily high TFA in products manufactured by internationally known popular brands being marketed in China. Inevitably, as the processed food market in China continues to grow, new food products introduced and marketed by international food manufacturers may have a significant impact on local consumers’ taste and demand. The impact might be further extended as many local food manufacturers often aspire to international suppliers’ practice. However, to our knowledge, this has not been studied in China.
The present study aimed to describe food labelling practice in China based on direct observational data collected in Shanghai as well as the data published in the literature. We also examined a variety of factors that might affect food nutrition labelling, especially the corporate origins, namely enterprises from mainland China, Taiwan and Hong Kong or international suppliers. We hypothesized that food products made by domestic manufacturers might have a lower nutrition labelling rate based on the assumption that manufacturers from areas with more developed economies are more integrated into the global market and regulatory requirements. In addition, we examined the food nutrition labelling practice for some selected nutrients such as saturated fat, TFA and fibre as well as for high-energy-density (calorie) and high-fat foods. Our findings can help unfold the current nutrition labelling practice in China, while ushering in future efforts in reinforcing the implementation of CFNLR.
Methods and materials
Data collected in Shanghai between December 2007 and January 2008 were analysed and compared with the findings from the Beijing study using data collected around 2000(Reference Feng, Yang and Shi13). To identify studies that examined food nutrition labels in China published between January 1980 and July 2008, a thorough literature search was conducted using keywords such as food nutrition label, food nutrition panel and China in both PubMed and the ‘Chinese Biology and Medicine Library’ (the most comprehensive biomedical research-related electronic database in China). The Beijing survey was the only study that we have identified in our literature search that provided related detailed information. Another study(Reference Fu, Yang and Yuan12) examined only the labelling of TFA-related information. Shanghai and Beijing are the two largest cities in China. The data from Shanghai and Beijing would provide a good indicator of the best food labelling practice in China, i.e. likely to be better than rural areas and inland provinces.
Data collection in Shanghai
We collected nutrition information of pre-packaged foods at a main chain Wal-Mart supermarket in Shanghai. The supermarket offered a wide variety of foods and household products for daily grocery shopping. The foods sold in this store were commonly consumed in Shanghai as well as in many other areas in China. We chose to survey only ready-to-eat food, which can be consumed directly or only needs to be moderately heated before consumption.
Data were collected in the supermarket after our written application was approved by Wal-Mart; however, we were not allowed to take photographs of the food samples. All the labelling information could only be recorded on the pre-designed data collection sheets. Our data collectors had received specific training before conducting the tasks.
Based on our direct observation and the product list provided by the store, we collected information on food products regarding their names, brands, manufacturers and nutrition labels. In particular, the information we collected included whether having a nutrition label, whether labelled with saturated fat, TFA or fibre, and the values of energy (calorie), fat, carbohydrate and protein content. Food items sampled in the survey are described in Appendix 1. Note that, regardless of the manufacturers being international, domestic or from Taiwan and Hong Kong, all the food products surveyed in our Shanghai study were made in factories in mainland China.
The 2002 Beijing study
The study collected information of food nutrition labels of about 378 pre-packaged foods in ten categories (see Appendix 2 and Table 1). All these foods were on the most commonly consumed food list of similar products in Beijing. The authors argued that their findings could help represent the situation in China(Reference Feng, Yang and Shi13).
Comparison of food nutrition labelling practice among food items examined in the two surveys in Shanghai and Beijing
FNL, food items with any nutrition labelling; N/A, not applicable.
*Food category was based on the Beijing study, which did not provide data on specific food items and subcategories in each food category (Feng et al.(Reference Feng, Yang and Shi13)); subcategory was only used in the Shanghai survey based on the food category system of the 2004 China Food Composition (YangReference Yang(14)) and that of the USA (USDA National Nutrient Database for Standard Reference(15)).
†Percentage of FNL in per food category: Proportion of FNL among sampled items in each category (%) = number of FNL within each category/total number of sampled food items within the related food category.
‡Proportion of food items by category (%) = number of sampled food items in each food category/total number of sampled food items (n 850).
§Composition of FNL by category (%) = number of FNL within each category/total number of FNL (n 301).
||Alcohol and dairy products were not included in the Shanghai survey.
Food grouping system (food categories)
Two food grouping systems were included in our study (see Appendix 2 and Table 1): (i) the one used in the Beijing study, which enabled us to compare and contrast with the findings from the Beijing survey; and (ii) our modified system, which allowed us to further examine specific perspectives of the food nutrition labelling practice. This modified system included the type of food products and their respective nutrient composition.
In our modified food grouping system, the sampled food items were grouped based on the food category system listed in the 2004 China Food Composition (Reference Yang14), as well as the food system in the USA, published in 2006(15). To be consistent with the Beijing study system, some of our food categories were separated while others were combined.
Data analysis
Differences in the food nutrition labelling practice across different distribution scales of manufacturers were compared using χ 2 tests. In addition, we defined ‘high-energy-density foods’ as >1673 kJ/100 g (400 kcal/100 g) based on the recommendations of the Food and Drug Administration (FDA) and ‘high-fat foods’ if the food contained >35 % of its total energy from fat(16, 17). Among food items with nutrition labels, we examined the percentage of high-energy-density foods and high-fat foods. The percentages of foods labelled with selected nutrients such as saturated fat, TFA and fibre were calculated. Data management and statistical analyses were carried out using Excel 2000 (Microsoft Corp., Redmond, WA, USA) and the SAS statistical software package version 9·2 (SAS Institute, Cary, NC, USA). P < 0·05 was considered statistically significant.
Results
The percentages of food items with nutrition labels were displayed for each of the two surveys (Table 1). The overall labelling rate was low in both surveys − 30·9 % in Shanghai v. 29·7 % in Beijing − excluding baby foods. The proportions of food items with nutrition labels varied considerably across food categories. Unlike baby foods, of which all products carried a nutrition label, snack foods had a very low labelling rate.
Based on our Shanghai survey, except for baby foods, products with special nutrition claims had the highest labelling rate (89·2 %), followed by soyabean products (75 %), beverages (58·5 %), grain products (33·5 %), snacks (20·5 %) and meat and fish products (10·3 %). Among 232 food items with nutrition labels, the respective numbers of food items labelled with energy, carbohydrate, protein and fat content were 197 (84·9 %), 200 (86·2 %), 217 (93·5 %) and 202 (87·1 %). The percentages of food items labelled with SFA (8·6 %), TFA (4·7 %) and fibre (12·1 %) were very low.
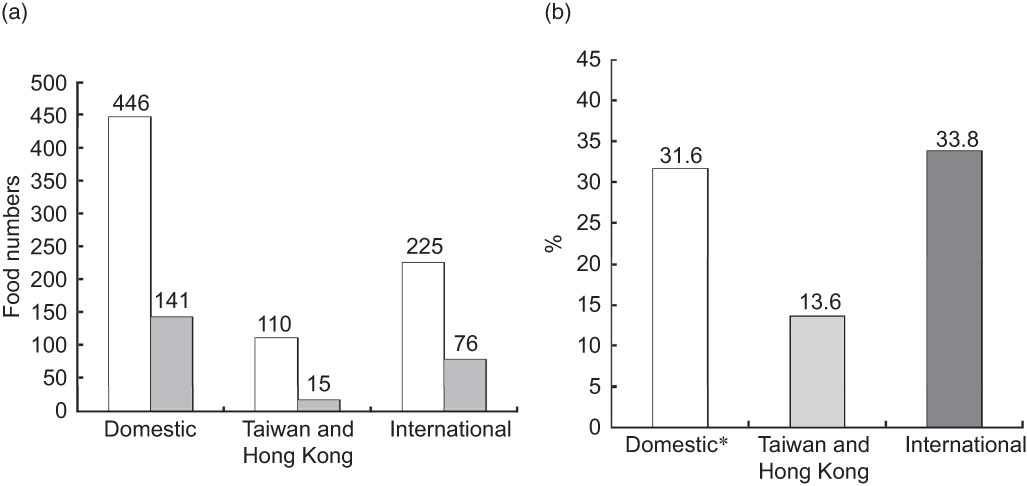
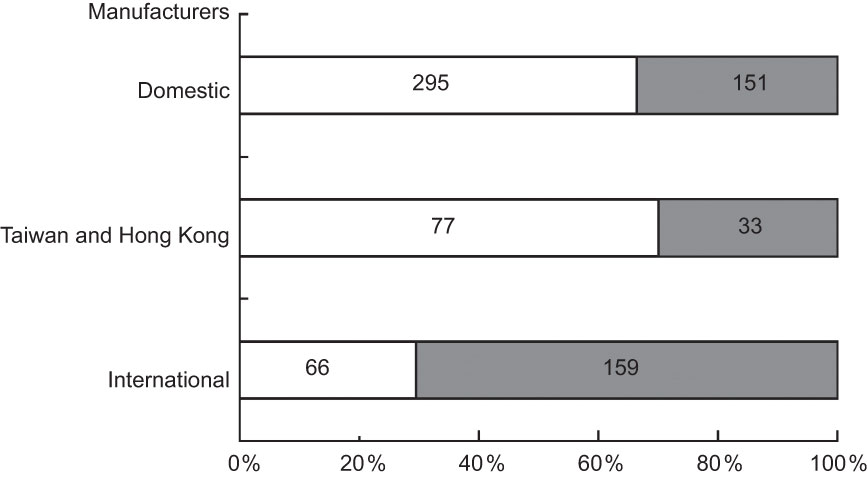
Food nutrition labelling practice regarding foods sold in our surveyed store differed by type of manufacturer (P < 0·001), although the overall labelling rate between domestic and international manufacturers was not significantly different (P = 0·572; Fig. 1). In all the food categories except foods with special nutrition claims, the differences across manufacturers were significant (Table 2).
Differences in food nutrition labelling practice by manufacturer: (a) total number of food items sampled (![]() ) and those with nutrition labels (
) and those with nutrition labels (![]() ); (b) percentage of food items with nutrition labels. Manufacturers: Domestic, food corporations in mainland China; Taiwan and Hong Kong, food corporations in Taiwan or Hong Kong; International, international corporations; percentage of food items with nutrition labels = food items with nutrition labels/total number of foods surveyed. *Based on χ 2 test, the difference across the three types of manufacturers was significant (P < 0·001), but the difference between the mainland and international manufacturers was not significant (P = 0·572)
); (b) percentage of food items with nutrition labels. Manufacturers: Domestic, food corporations in mainland China; Taiwan and Hong Kong, food corporations in Taiwan or Hong Kong; International, international corporations; percentage of food items with nutrition labels = food items with nutrition labels/total number of foods surveyed. *Based on χ 2 test, the difference across the three types of manufacturers was significant (P < 0·001), but the difference between the mainland and international manufacturers was not significant (P = 0·572)
Food nutrition labels by food category and type of manufacturer: the Shanghai surveyFootnote *
FNL, food items with nutrition labelling; N/A, not applicable.
* The food items did not include baby food (n 781).
† Proportion of food items by category (%) = number of sampled food items in each food category/total number of sampled food items.
‡ Proportion of FNL among sampled items in each category (%) = number of FNL within each category/total number of sampled food items within the related food category.
§ Proportion of FNL among sampled items in each category was compared across three manufacturers using the χ 2 test.
|| Proportions were compared using Fisher’s exact test.
¶ Difference was compared between domestic and international manufacturers.
Close to one-half (42·1 %) of all food items with nutrition labels were high-energy-density foods, whereas 34·0 % of the products were high-fat foods. Considering snack foods alone, the products identified as high in energy density and high in fat were 91·2 % and 76·9 %, respectively (Table 3). Compared with domestic manufacturers, the international manufacturers produced more snacks and beverages than other food categories. The ratios of the numbers of snacks and beverages to other foods produced by international manufacturers, Taiwan and Hong Kong manufacturers and domestic manufacturers were 2·41, 0·43 and 0·51, respectively (Fig. 2). Of all the food items with nutrition labels produced by domestic manufacturers, the number of products identified as high in energy density and high in fat was much less (almost by half) than that of the international brands (Table 3).
High-energy-density and high-fat foods among food items with energy/fat labels: the Shanghai surveyFootnote *
%E, percentage of energy.
a,b,c Significant difference between amainland China and Taiwan manufacturers, bmainland China and international manufacturers, cTaiwan and international manufacturers (P < 0·05).
* The food items with energy/fat labels did not include baby food.
† Total number of food items with energy label is given in parentheses.
‡ Number of high-energy-density foods (or high-fat foods)/total number of food items with energy (or fat) labelling.
§ Total number of food items with fat and energy labels is given in parentheses.
|| Across-group comparison was conducted by the χ 2 test.
Comparison of the percentages of snack and beverage foods (![]() ) to other foods (
) to other foods (![]() ) among food manufacturers with different ownership. Manufacturers: Domestic, food corporations in mainland China; Taiwan and Hong Kong, food corporations in Taiwan or Hong Kong; International, international corporations
) among food manufacturers with different ownership. Manufacturers: Domestic, food corporations in mainland China; Taiwan and Hong Kong, food corporations in Taiwan or Hong Kong; International, international corporations
Discussion
It has been argued that nutrition labelling should be an important element of nutrition policy and should be envisaged in the larger perspective of consumer education. On the other hand, some experts have argued that nutrition labelling might not be cost-effective or appropriate in countries or areas where lack of sufficient food is the primary public health problem, or where the educational level is inadequate to allow consumers to read or fully understand the information(Reference Van den Wijngaart18). Therefore, food nutrition labelling has not been mandated in a number of countries, and the practice of food nutrition labelling varies across and within countries(1).
Our study has several important findings regarding this important public health issue, which is under-studied in developing countries including China. First, with data collected in the main large superstores in Shanghai and Beijing, the two largest cities in China, we found that the overall food nutrition labelling rate among non-baby food items was very low, only approximately 30 %. Given the fact that food items from the surveyed superstores in Shanghai were generally scrutinized under more rigorous quality control standards, we expect that the nutrition labelling rate would be even lower among foods sold in small non-chain stores and in other small cities and rural areas in China. One will expect some positive changes in the food labelling rates post-regulation in China in the near future. However, we suspect that the changes might not be as significant as one may expect due to the fact that CFNLR is not mandatory and it will take time for food manufacturers to make related changes in their products.
Second, compared with the 2002 Beijing study, the overall nutrition labelling rate in our 2007–2008 Shanghai survey improved little (30·9 % v. 29·7 %) during this period and their overall rates were similar. However, most of the nutrition labelling rates for different food categories in Shanghai were slightly higher. This difference between the overall rate (similar in both cities) and food category-specific rates (higher in Shanghai) could be attributed to the differences in food category composition between the two surveys. For example, in general, dairy products and alcohol have higher nutrition labelling rates than other foods, but they were not included in our Shanghai survey. Note that some of these differences between the two surveys may also be ascribed to the following factors: (i) some foods consumed in the two cities were different. Shanghai is located in South China, while Beijing is in the North. People’s food consumption habits vary considerably across regions in China. Although most food products in the food markets in these two cities are from manufacturers all over the country, regional differences still exist. (ii) There are differences in sample sizes and sampling methods. In the Beijing study, all of the 378 items sampled were the most commonly consumed foods in their respective categories, while our Shanghai survey examined all the foods (850 items) on the shelves on the survey day in a main Wal-Mart supermarket.
Third, we found that unhealthy food items such as high-energy-density and high-fat food items were less likely to have nutrition labels than other healthier food items. For example, the proportion of food items with nutrition labelling was only 1·1 % among salty snacks, which include crispy rice, crispy corns, fried potato sticks, potato chips and other salty snacks prepared by frying.
Fourth, different from what we expected, food items marketed by the manufacturers owned by Taiwan, Hong Kong and international companies had a surprisingly lower labelling rate than those by domestic manufacturers. We had expected that the former would have a better labelling rate, since food nutrition labelling is mandatory in their home areas. Our study echoes the findings from a recent study regarding food labelling of TFA in foods sold in China (see below)(Reference Fu, Yang and Yuan12). In contrast, in the USA, a 2000–2001 Food Label and Package Survey conducted by the US FDA Center for Food Safety and Applied Nutrition showed that the nutrition label compliance rate reached 98·3 % with the 1281 FDA-regulated processed, packaged food samples drawn for the study, whereas the remaining 1·7 % of products were in fact exempt from nutrition labelling requirements(Reference Legault, Brandt and McCabe19).
This dramatic difference in the food labelling rates between products sold in China and the USA is indicative of how critical a role food nutrition labelling polices play when it comes to affecting food manufacturers’ labelling practice. Since 1987, China has mandated a series of food regulations, including the Pre-packaged Food with Nutrition Claim Labeling Regulations, Alcohol Drinks Labeling Regulations and Baby Food Labeling Regulations (BFLR), which requires that all baby foods be labelled with their nutrient composition on the package. From the present study, it can be seen that the BFLR requirement was met by all of the manufacturers. Therefore, it is obvious that to ensure high compliance of food quality and safety, mandated regulatory approaches have a positive influence on the products sold in China.
Fifth, our data also highlighted concerns regarding the labelling of several critical nutrients. Energy, fat, carbohydrate, protein and sodium are considered the key items that must be labelled based on food nutrition labelling regulations in several countries. However, our Shanghai data showed that among the food items with nutrition labels, still approximately 7–15 % did not label energy, fat, carbohydrate or/and protein. The labelling rates of saturated fat (8·6 %), TFA (4·7 %) and fibre (12·1 %) remained very low. Vigorous efforts should be made by consumers and related policy makers to promote the labelling of these nutrients in China.
Take TFA as an example. After examining ninety-seven of the most popular national brand food products on the Chinese market to profile their fatty acid composition, a recent study reported that TFA (> 0·5 % of fat content) was found in 80 % and 33 % of the Western- and Chinese-style food products, respectively. However, none of the ninety-seven products were labelled for TFA(Reference Fu, Yang and Yuan12). Owing to their adverse effect on health, saturated fat and TFA have drawn more attention than other nutrients. In July 2003, the US FDA issued a regulation requiring manufacturers to list TFA on the nutrition facts panel of foods and some dietary supplements, which became mandatory on 1 January 2006(20). Our findings, as well as those of Fu et al.(Reference Fu, Yang and Yuan12), show that a mandatory regulation for TFA labelling will be critical in China to allow consumers to identify the presence of TFA in the products.
Sixth, we also found that among all snack foods sampled in the surveyed store in Shanghai, the percentage of high-energy-density (≥1673 kJ/100 g (400 kcal/100 g)) and high-fat (>35 % of energy from fat) foods was significantly higher than the percentage of such foods across all categories (91·2 % and 76·9 % v. 42·1 % and 34·0 %, respectively). Hence, it is apparent that nutrition labelling should be made mandatory for critical food categories such as snack foods in order to help inform the consumers about the potential risks when making their food choices.
In addition, the types of food products marketed in our surveyed store differed remarkably between domestic manufacturers and others. Among foods from domestic manufacturers, snacks and beverages contributed 33·6 %, compared to 70·7 % among those from non-domestic manufacturers. We also found that a higher proportion of food products from Taiwan, Hong Kong and other international manufacturers was made up of high-energy-density food and high-fat food compared with domestic manufacturers (approximately 50–60 % v. 20–30 %). The tendency of food products marketed by these non-domestic manufacturers may have some undesirable effect on the local residents’ dietary intakes. As a result of China’s economic reform and growing global trade(21), the Western food industry has marketed aggressively in China. This may have helped introduce new food processing techniques as well as new food products. On the other hand, it might also carry some profound yet undesirable impacts on the local food market and food production practices. With relatively higher profits and longer shelf-life compared with other food categories, in addition to improved transportation and distribution, snack and beverage foods are more likely to be introduced to the Chinese food market by non-domestic manufacturers. The aggressive marketing strategies commonly employed by international corporates have quickly woven these unhealthy food products into Chinese children’s diet, in particular in urban areas where new consumer demand continues to be on the rise. In order to compete for profit, local manufacturers may tend to upgrade their technology and produce similar ‘junk’ foods to meet local consumers’ taste and demand.
Although we have attempted to include as many food products and information as possible, the present study has several limitations. First, we could only obtain data from two major cities in China, and these data probably have pictured a better situation than the actual national average. Second, all the foods surveyed in our Shanghai study came from one major supermarket, which was not representative of all foods sold in the city. In addition, the Beijing study did not provide details regarding specific food items in each food category, which limited our comparison between these two surveys.
In conclusion, our study shows that the food nutrition labelling rate in China is very low, even with food products sold in major cities and in large chain supermarkets (only about 30 %). Unhealthy food items have an even lower nutrition labelling rate. Of those food items with nutrition labels, a considerable proportion (7–15 %) did not label energy, fat, carbohydrate or protein. The labelling rates of several selected nutrients such as saturated fat, TFA and fibre are extremely low. Foods sold by food manufacturers from Taiwan, Hong Kong and international companies in China were less likely to carry nutrition labels than those by domestic manufacturers; and they marketed more processed and unhealthy (e.g. high energy and high fat content) food products. Mandated regulation of food nutrition labelling is necessary in China to help promote nutrition awareness and healthy eating as well as to help influence food production and marketing. Future research is needed to monitor the changes in food nutrition labelling practice in China after the recent CFNLR went into effect, which is expected to help improve food nutritional labelling practice.
Acknowledgements
The present study was supported in part by the Shanghai Municipal Public Health System Three-year Action Plan (2007–2009), the Johns Hopkins Bloomberg School of Public Health, the Johns Hopkins Center for a Livable Future and The Nestle Foundation. The authors declare no conflicts of interest. Y.T. contributed to the study design, data collection and analysis, interpretation of results, write-up and revision of the paper, and obtaining funding support and administration; Y.W. contributed to the study design, data analysis, interpretation of results, write-up and revision of the paper and obtaining funding support and administration; Q.T. contributed to the study design, data collection, revision of the paper and obtaining funding support; J.L. contributed to the data analysis and revision of the paper; and Y.M.L. contributed to the revision of the paper. The authors thank Yuting Sun for her contribution in the data collection during her internship at the Clinical Nutrition Center, Xinhua Hospital, Shanghai Jiao Tong University Medical School.
Appendix 1
Food items sampled in the Shanghai survey
The number of food items is provided in parenthesis for each category. These categories were used in the present analysis.

Appendix 2
Comparison of the food grouping systems used in the Beijing and Shanghai studies
*The Beijing study did not provide data on specific food items included in each food category (Feng et al.(13)).
†The Shanghai study used the grouping system based on the food category system of the 2004 China Food Composition (Yang(Reference Yang14)) and that of the USA (USDA National Nutrient Database for Standard Reference(15)).
‡The Shanghai study did not collect data on alcohol and dairy products.
§Some of our food subcategories were merged for comparison between the two studies.


