

Decades of research on the demand for populist radical right (PRR) parties have documented their overrepresentation among the lower and lower-middle classes, whether defined in terms of education, income, occupation, or marketable skills (Kitschelt Reference Kitschelt1995; Minkenberg Reference Minkenberg2000; Oesch and Rennwald Reference Oesch and Rennwald2018; Rydgren Reference Rydgren2012; for reviews, see Berman Reference Berman2021; Golder Reference Golder2016; Mudde Reference Mudde2007; Rydgren Reference Rydgren2007). Scholars consider the reason for this pattern to lie in part in the penalties and rewards associated with major transformations in the economy and society, such as the postindustrial transition, the technological revolution, and globalization (Betz Reference Betz1994; Kriesi Reference Kriesi, Kitschelt, Lange, Marks and Stephens1999), an argument that EU policy makers also support (Buti and Pichelmann Reference Buti and Pichelmann2017). These phenomena are said to exacerbate inequalities and create a divide between so-called winners and losers, resulting in the emergence of a new dimension of political conflict or even cleavage (Kriesi et al. Reference Kriesi, Grande, Lachat, Dolezal, Bornschier and Frey2008; for a review, see Ford and Jennings Reference Ford and Jennings2020).
Nonetheless, whether these phenomena matter because of the very economic disadvantage they engender among the population remains disputed. The argument that worsening material conditions may foster support for the PRR is not straightforward (Gidron and Mijs Reference Gidron and Jonathan2019), because financial resources may matter for their relative value than their absolute value. Following this line of reasoning, the PRR would perform better among citizens whose economic position within the social hierarchy is in decline. This has raised speculation among scholars about economic status loss being a key driver of PRR voting. Research based on voters’ self-reported subjective perceptions tends to confirm such an argument (Bonikowski Reference Bonikowski2017; Cramer Reference Cramer2016; Gidron and Hall Reference Gidron and Hall2017; Hochschild Reference Hochschild2016). Yet, objective evidence is scant (Lindh and McCall Reference Lindh and McCall2020), thus leaving unresolved the source of economic-based support for the PRR.
To address this shortcoming, the research presented in this article assesses whether facing economic status loss may induce voters to endorse the PRR. Going beyond subjective perceptions, I developed a novel positional measure of income, which I rely on to quantify changes in economic status over time. For this purpose, I chose social class as my unit of analysis, given the relevance the literature attributes to group deprivation for shaping political behavior. Shifting the focus from absolute individual conditions to relative collective ones enabled me to gauge economic status loss as a distinct—and equally salient—experience from financial loss. Finally, I tested how voters responded to changes in economic status by leveraging individual-level electoral data from the European Social Survey (ESS) from 23 elections held between 2008 and 2019 in 11 European countries, combined with information on class-level income dynamics from the EU Statistics on Income and Living Conditions (EU-SILC) survey provided by Eurostat.
Literature Review
A voluminous literature investigates why the PRR enjoys broader support among the lower middle class (for reviews see Berman Reference Berman2021; Golder Reference Golder2016; Mudde Reference Mudde2007; Rydgren Reference Rydgren2007).Footnote 1 Originally, this debate was polarized along two axes. A first strand of scholarship contended that PRR voters are driven by cultural concerns, mainly the threat of mass immigration and the crisis of national identity (Achterberg and Houtman Reference Achterberg and Houtman2006; Frank Reference Frank2004; Norris and Inglehart Reference Norris and Inglehart2019; Oesch and Rennwald Reference Oesch and Rennwald2018). A second strand argued that, although PRR parties mostly compete on a cultural dimension, economic motivations of voting are also worthy of consideration. Since the advent of globalization and rapid technological change, in conjunction with welfare retrenchment, unemployment has become a more common experience, the demand for flexible and cheap labor has increased, and the wage-earning middle class has been “squeezed.” Ultimately, these changes are responsible for the rise in PRR support, as a wealth of research argues (Anelli, Colantone, and Stanig Reference Anelli, Colantone and Stanig2021; Arzheimer Reference Arzheimer2009; Autor et al. Reference Autor, Dorn, Hanson and Majlesi2020; Colantone and Stanig Reference Colantone and Stanig2018; Kriesi et al. Reference Kriesi, Grande, Lachat, Dolezal, Bornschier and Frey2008; for reviews, see Guriev and Papaioannou Reference Guriev and Papaioannou2020; Rodrik Reference Rodrik2018, Reference Rodrik2021; Scheiring et al. Reference Scheiring, Serrano-Alarcón, Moise, McNamara and Stuckler2024; Walter Reference Walter2021).
Yet, this explanation for the relation between unfavorable economic transformations and increasing PRR support remains disputed. One obvious factor is the experience of individual disadvantage. Yet, although some studies find that voters facing unexpected financial loss have higher chances of PRR voting, other studies observe that these voters can also demand further redistribution of wealth and thus turn to left-wing parties (Gidron and Mijs Reference Gidron and Jonathan2019; Margalit Reference Margalit2013, Reference Margalit2019b; Naumann, Buss, and Bähr Reference Naumann, Buss and Bähr2016; Stockemer, Lentz, and Mayer Reference Stockemer, Lentz and Mayer2018; Wiertz and Rodon Reference Wiertz and Rodon2019). This emerged most clearly during the 2008 financial crisis (Bartels and Bermeo Reference Bartels and Bermeo2014; Hutter and Kriesi Reference Hutter and Kriesi2019). Similar discussions can be found in the political economy literature on the political outcomes of job risk (Iversen and Soskice Reference Iversen and Soskice2001; Rehm Reference Rehm2009; see, for a review, Margalit Reference Margalit2019a).
Thus, a third strand of scholarship suggests that cultural and economic reasons should not be thought as mutually exclusive: This is because economic transformations may have consequences that are not exclusively financial, which may then explain the success of the PRR. More concretely, these transformations may induce a loss in social status among voters who are relatively less rewarded by these changes (Antonucci et al. Reference Antonucci, Horvath, Kutiyski and Krouwel2017; Bonikowski Reference Bonikowski2017; Gidron and Hall Reference Gidron and Hall2017; Rydgren Reference Rydgren2012). The critical point is that this loss of status can occur even if voters are not losers in absolute terms. This paradox can be explained by relative deprivation theory (Runciman Reference Runciman1966). Regardless of actual material loss, citizens may perceive themselves as facing a relative economic deterioration if the rest of society is improving its condition relative to them (Burgoon et al. Reference Burgoon, van Noort, Rooduijn and Underhill2019; Kurer and van Staalduinen Reference Kurer and van Staalduinen2022; Rooduijn and Burgoon Reference Rooduijn and Burgoon2018).
Despite much debate around status politics, whether the PRR has greater success among voters facing status loss still lacks sound empirical confirmation (Lindh and McCall Reference Lindh and McCall2020). Most previous studies refer to status (loss) without directly measuring it; when they do, they resort to measures based on subjective perceptions, which may not accurately reflect the real situation.
On the one hand, certain studies propose that economic transformations such as automation and greater international trade lead to increased PRR support because they undermine voters’ social status (Ballard-Rosa, Jensen, and Scheve Reference Ballard-Rosa, Jensen and Scheve2022; Gallego, Kurer, and Schöll Reference Gallego, Kurer and Schöll2021; Im et al. Reference Im, Mayer, Palier and Rovny2019; Kurer Reference Kurer2020; arrow a in figure 1). Researchers in this area speculate that these transformations may matter more for the relative loss they engender (though without quantifying it) beyond or even without causing financial loss. For instance, many workers affected by robotization may go into (early) retirement without experiencing unemployment or financial loss (Cortes Reference Cortes2016). Yet working in “endangered” occupations spurs far-right support, supposedly because those jobs become devalued: The status associated with them decreases. A similar argument is put forward in inequality research. Increasing inequality and the uneven distribution of economic growth are found to favor the PRR (Engler and Weisstanner Reference Engler, Weisstanner, Careja, Emmenegger and Giger2020a, Reference Engler and Weisstanner2020b; Green, Hellwig, and Fieldhouse Reference Green, Hellwig and Fieldhouse2022; Han Reference Han2016; Rooduijn and Burgoon Reference Rooduijn and Burgoon2018; Weisstanner Reference Weisstanner2020). Once again, relative disadvantage is thought to be the key mechanism. Rising macrolevel inequality is thought to undermine the status of certain citizens because it devalues their position within the economic hierarchy. Unfortunately, these studies do not directly measure voters’ social status, thus making it the missing link between economic transformations and PRR support.
Theoretical Approaches in Extant Research on Status Politics

On the other hand, extensive research—using both ethnographic and survey analysis—has approached social status from a subjective perspective, showing that voters of the PRR are more prone to considering that their supposedly rightful place in society is crumbling (Cramer Reference Cramer2016; Eribon Reference Eribon and Lucey2013; Gest Reference Gest2016; Gest, Reny, and Mayer Reference Gest, Reny and Mayer2018; Gidron and Hall Reference Gidron and Hall2020; Hochschild Reference Hochschild2016; Im et al. Reference Im, Wass, Kantola and Kauppinen2023; Lamont Reference Lamont2000; Williams Reference Williams2017; figure 1, arrow b). Hence, these studies focus on subjective perceptions of status decline. Scholars adopting this approach speculate that the origin of this subjective experience may be the degradation of voters’ economic standing. More precisely, growing within-country inequalities in the Western world adversely affect the status of a significant portion of citizens (Jackson and Grusky Reference Jackson and Grusky2018; Nolan and Weisstanner Reference Nolan and Weisstanner2022); this loss of status eventually fosters feelings such as anger or resentment that are electorally beneficial for the PRR. Yet, empirical investigation stops at subjective perceptions. Hence, whether such perceptions objectively reflect declining status remains an open question.
This article provides evidence of the assertion that PRR parties are more successful in engaging voters facing status loss; to do so it directly measures this feature, without resorting to subjective perceptions of it. In this attempt, it complements three previous research efforts that went in a similar direction. The first is Burgoon et al. (Reference Burgoon, van Noort, Rooduijn and Underhill2019), which measured status loss by studying the economic performance of income decile groups with respect to the rest of society. As discussed later, this strategy considers that positions in society are ranked and that the distances between these positions can change. However, I argue for a group-based approach to status based on social classes. Secondly, in contrast, social mobility research views status in terms of shifts of individuals from a higher social class to a lower one across generations (Ares and van Ditmars Reference Ares and van Ditmars2023; Ciccolini and Härkönen Reference Ciccolini and Härkönen2021; Kurer and van Staalduinen Reference Kurer and van Staalduinen2022; McNeil and Haberstroh Reference McNeil and Haberstroh2023; Peugny Reference Peugny2006; van Ditmars Reference Van Ditmars2020) but considers the ranking of classes as fixed over time—despite it being reasonable to assume that the status of the working class has worsened. Finally, the approach followed in in-progress research from Derndorfer (Reference Derndorfer2023) acknowledges that social classes do change their position, although it has a narrower focus on the middle-income segment of the population.Footnote 2
Theory
Conceptualizing Economic Status Loss
To grasp the individual-level experience of the economic phenomena that we know to be at the basis of PRR support, I leverage the concept of economic status, which I consider as one element among others contributing to one’s social status, where both characteristics are objective. As mentioned, the PRR voting literature has mostly focused on the latter and has done so from a subjective perspective. Such a well-known perspective—even though it is subjective and lacks an economic focus—is the point of departure of the conceptual framework I discuss here.
As anticipated, I build on the work of Gidron and Hall (Reference Gidron and Hall2017, S61) who, in the vein of Ridgeway (Reference Ridgeway2014) but explicitly deviating from Weber (Reference Weber, Roth and Wittich1968), develop the concept of subjective social status, which they define as “the level of social respect or esteem people believe is accorded them within the social order.” It is the subjective perception of the more objective feature of social status. I define it as the “relative position” of a subject (i.e., an individual or a group) “in a social hierarchy” in which subjects “are ordered on an inferiority-superiority scale with respect to the comparative degree to which they possess or embody some socially approved or generally desired attribute or characteristics” (Benoit-Smullyan Reference Benoit-Smullyan1944, 151). Each attribute or characteristic involves a type of status that contributes to one’s overall social status (Lenski Reference Lenski1954). The attribute and the type of status I seek to analyze here are, respectively, economic resources and economic status. Footnote 3 I define the latter as the relative position within a social hierarchy ordering subjects on an inferiority–superiority scale with respect to the comparative degree to which they possess economic resources. As Ridgeway (Reference Ridgeway2014, 2) puts it, “People often want money as much for the status it brings as for its exchange value.” Thus, economic resources are at the basis of economic status, but the two concepts do not coincide (Mérola and Helgason Reference Mérola and Helgason2016).
Since the nineteenth century, a long-standing tradition in heterodox economics has acknowledged the different logic underpinning economic resources and economic status (Marx Reference Marx2008). Veblen (Reference Veblen1899)—and later Hirsch (Reference Hirsch1976), Sen (Reference Sen1983), and Frank (Reference Frank1985)— developed the notion of positional goods; that is, goods where the value depends on their distribution in society. Under the label of relative income, the study of economic status has found various applications in economics (Duesenberry Reference Duesenberry1949; Luttmer Reference Luttmer2005; for reviews, see Clark, Frijters, and Shields Reference Clark, Frijters and Shields2008; Genicot and Ray Reference Genicot and Ray2020; Verme Reference Verme2018). These contributions highlight that individuals evaluate their economic resources not only in absolute terms but also in view of those possessed by others.
Thus, one main feature distinguishes economic status from economic resources. Because a subject’s economic status depends on others’ resources, the scale of economic status in a society is virtually inexpansible (Hirsch Reference Hirsch1976; Milner Reference Milner1994). In laypeople’s terms, it is not possible for everyone to get richer and simultaneously acquire more economic status. This implies that economic status is structured as a zero-sum game: Someone’s gain in status coincides with someone else’s loss. It is thus clear that an improvement in material circumstances does not translate straightforwardly into a gain in economic status. If one’s positive economic performance is not accompanied by others’ equal economic performance, economic growth generates winners and losers in economic status terms.
The relevance of the distinction between economic status and economic resources goes well beyond the conceptual and methodological level because zero-sum games are relevant for political action (Jackson and Grusky Reference Jackson and Grusky2018). Individuals tend to think of the status quo—that is, the current distribution of resources among society and the corresponding hierarchy—as justified (for a review, see Jost, Banaji, and Nosek Reference Jost, Banaji and Nosek2004). This implies that changes in the extant hierarchy represent a deviation from a legitimate order and therefore are seen as unfair, thus spurring a feeling of resentment that is electorally consequential. Voters perceiving themselves as being treated unfairly are likely to turn to the PRR because it promises to punish the rulers, reestablish the good ol’ order, and restore dignity to those who have been deprived. This also reveals a fundamental divergence between the PRR and the radical or populist left. They both seek deep social change but do so from opposite normative bases: The left considers the extant socioeconomic order to be unjustified (March Reference March2011; Rooduijn et al. Reference Rooduijn, Burgoon, van Elsas and van de Werfhorst2017). As a result, material concerns, rather than status concerns, are especially salient to far-left voting, as the 2008 financial crisis also demonstrated.
Overall, the distinction between economic resources and economic status appears more relevant than extant political science research has recognized so far in its empirical quantitative analyses. Accounting for this distinction may further contribute to explaining the paradox of why PRR supporters seemingly vote “unnaturally” and against their economic interests (Achterberg and Houtman Reference Achterberg and Houtman2006). Thus, my study distinguishes economic resources (loss) from economic status (loss) to improve our understanding of PRR voting.
The Political and Economic Relevance of Class Deprivation
Traditionally, analyses of economic status have focused on individual circumstances. Yet research in social and political psychology demonstrates that loss matters more politically when it is lived as a group experience (for a review, see Smith and Ortiz Reference Smith, Ortiz, Walker and Smith2001). This is because individuals tend to blame themselves for misfortunes that are confined to their own lives but criticize the system and react politically when facing group deprivation (Miller et al. Reference Miller, Gurin, Gurin and Malanchuk1981; Verba and Nie Reference Verba and Nie1972). Despite much interest in group deprivation, the consequences of between-group inequality have been an understudied topic for a long time compared to individual disadvantage (Achen and Bartels Reference Achen and Bartels2016), although this has begun to change in the last decade (Cramer Reference Cramer2012). Scholars have increasingly paid attention to the electoral consequences of economic decline at the level of various social groups (Abou-Chadi and Kurer Reference Abou-Chadi and Kurer2021; Ciccolini Reference Ciccolini2023; Cramer Reference Cramer2016; Evans and Ivaldi Reference Evans and Ivaldi2021; Rodríguez-Pose Reference Rodríguez-Pose2018).
This study complements extant approaches by considering the relatively neglected factor of social class.Footnote 4 Despite a general interest in class-based politics (for a review, see Lindh and McCall Reference Lindh and McCall2020), the issue of class deprivation has received more theoretical than empirical investigation, with the notable exception of Kurer et al. (Reference Kurer, Häusermann, Wüest and Enggist2019). This is surprising because this issue is not new, as shown by classics in political sociology. My concept of class economic status loss is akin to Bourdieu’s (Reference Bourdieu1974, Reference Bourdieu1984) notion of group trajectory or slope, which he used with reference to the declining petit bourgeoisie involved in the Poujadiste movement. Similarly, Lipset (Reference Lipset1959, Reference Lipset1960) identified the cause of fascism in the economic status anxieties of the German and Italian middle classes that were squeezed by the expansion of large industries and the political empowerment of the working class. There is no reason to expect that this evidence has become obsolete, given the persistent relevance of class politics today (Gingrich and Häusermann Reference Gingrich and Häusermann2015; Oesch and Rennwald Reference Oesch and Rennwald2018).
My class-based approach is also grounded in recent evidence—which finds confirmation in my data presented later—that rising economic disparity between social classes is a critical factor driving current trends in income inequality (Albertini, Ballarino, and De Luca Reference Albertini, Ballarino and De Luca2020; Mouw and Kalleberg Reference Mouw and Kalleberg2010; Tomaskovic-Devey et al. Reference Tomaskovic-Devey, Rainey, Avent-Holt, Bandelj, Boza, Cort and Godechot2020; Weeden et al. Reference Weeden, Kim, Di Carlo and Grusky2007; Wodtke Reference Wodtke2016). In other words, such trends result from the relative deterioration of the economic situation of one class vis-à-vis others. These contributions complement well the burgeoning literature about the growing gap between the rich and the rest of society and its electoral consequences (Burgoon et al. Reference Burgoon, van Noort, Rooduijn and Underhill2019; Gethin, Martínez-Toledano, and Piketty Reference Gethin, Martínez-Toledano and Piketty2021; Piketty Reference Piketty2020). Yet, they also exceed it to a certain extent, because they use as the analytical unit occupational social classes, which are social groups, rather than income groups that are statistical units (Goldthorpe Reference Goldthorpe2010). I contend that such a class-based approach may be especially fruitful in studying voters’ reactions to these inequalities (Jackson and Grusky Reference Jackson and Grusky2018).
Hypotheses
In the analysis that follows, I test the hypothesis that economic status loss experienced at the class level is associated with greater electoral support for the PRR, as the literature suggests.Footnote 5 I do not expect a similar relation to hold for right-wing centrist competitors, because loss is generally known to trigger populist, radical, or anti-establishment reactions. I do not expect it to hold for leftist parties either, not even populist or radical ones. As explained earlier, this is because these parties propose to increase the living standard of the poor, which would translate into a loss in status for the rest of society that would be “squeezed from below.” Accordingly, material concerns, rather than status ones, have been shown to be salient to radical-left voting.
Because the PRR mainly competes on the cultural dimension, and status loss elicits demand for dignity (not for economic compensation), I expect greater cultural conservatism among voters facing economic status loss—in line with evidence on voting choice. I do not have strong prior expectations regarding voters’ economic stances. For the same reasons, one should not expect a relation as great as for the cultural dimension, yet the fear of being surpassed by the poor might lead voters to adopt right-leaning positions.
Methods
Data and Case Selection
The study of class-level economic status and its implications requires detailed individual-level information on occupation, income, and voting choice. For this purpose, I draw on two sources.Footnote 6 My core analysis relies on data from the European Social Survey (ESS 2019), a cross-country study at the European level conducted biannually. It has been used extensively in electoral studies in Europe because it gathers data on relevant socioeconomic characteristics, such as employment status and occupation, and on voting behavior. Regarding the latter, I recoded ESS respondents’ voting choices using the dataset PartyFacts (Döring and Regel Reference Döring and Regel2019). I restricted my sample to voters who either were actively working or were unemployed but had worked in the past. Because the ESS does not provide sufficiently detailed information on income, I leveraged high-quality data from the EU Statistics on Income and Living Conditions (EU-SILC) provided by Eurostat (2021). EU-SILC is the most suitable dataset for my purpose given the accuracy of its individual-level data on income and occupations, its yearly and cross-country coverage, and its remarkably large sample size. Both sets of data are collected based on random sampling. Further information on my data choices is provided in online appendix A.
In my main analysis, I studied electoral outcomes from 2008 to 2019 from 11 European countries: Austria, Belgium, Switzerland, Spain, Finland, France, Italy, the Netherlands, Norway, Sweden, and the United Kingdom. For each national election, two criteria guided my case selection strategy: data availability constraints and the presence of relevant PRR options in the political landscape.Footnote 7 I provide further information on this strategy in online appendix A and test its sensitivity for my conclusions in the robustness checks. Ancillary analyses covered previous elections and the following West European countries: Cyprus, Germany, Greece, Ireland, Iceland, and Luxembourg.Footnote 8 I focused on countries in Western Europe because of the similarity of their economic and political contexts and the more extensive literature on class stratification, class operationalization, and class voting in this region. For the sake of external validity, I also included—based on the same selection criteria—four countries from Central and Eastern Europe as a robustness check: Estonia, Hungary, Poland, and Slovakia.
I identified PRR parties using the PopuList classification (Rooduijn et al. Reference Rooduijn, van Kessel, Froio, Andrea, de Lange, Halikiopoulou, Lewis, Mudde and Taggart2019), which follows Mudde’s (Reference Mudde2007) definition and is based on experts’ judgment. Accordingly, these parties are characterized by “a core ideology that is a combination of nativism, authoritarianism, and populism” (26). The group of far-right parties distinguish themselves from extreme-right parties by their opposition to liberal democracy, rather than to democracy as a whole.Footnote 9 The data allowed for temporal variation in the classification of a party as PRR. A list of the examined parties is in online appendix B.
My main analysis covered 23 elections relying on ESS data from rounds 4–9
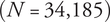 $ \left(N=\mathrm{34,185}\right) $
and on EU-SILC income data from 2003 to 2019. The sample of the main regression analysis included voters who declared having voted and who disclosed their choice.
$ \left(N=\mathrm{34,185}\right) $
and on EU-SILC income data from 2003 to 2019. The sample of the main regression analysis included voters who declared having voted and who disclosed their choice.
Measuring Economic Status
I tested the relation between economic status and voting by using a novel measure I term positional income. It indicates the relative economic position of a subject—a social class in this case—in the social hierarchy by quantifying its distance from the richest and the poorest in society; that is, from the top and the bottom of the overall income distribution.Footnote 10 To compute this distance, my measure draws on and synthesizes existing approaches in the literature on relative measures of income (Sen Reference Sen1983; Verme Reference Verme2018); like Jenkins (Reference Jenkins2011), it acknowledges that social positions are ranked, and like Burgoon et al. (Reference Burgoon, van Noort, Rooduijn and Underhill2019) it recognizes that positions within the ranking are not equidistant (see online appendix C for a more thorough comparison of Burgoon and coauthors and my approaches). However, the closest measure of positional income is clearly Lupu and Pontusson’s (Reference Lupu and Pontusson2011) measure of skew, which is itself an extension of the 90:10 ratio often used in economic inequality research.
Skew was originally developed to measure the relative position of the middle class by quantifying the distance of the median citizen—the fiftieth percentile of the income distribution—from the richest (i.e., the last decile) and the poorest (i.e., the first one) in a given society. It divides the 90:50 ratio by the 50:10 ratio. I build on the intuition that this method can be arguably used to measure the relative position of any group in society, not just the middle class.
Although online appendix C provides a more extensive theoretical and methodological discussion on the subject, the computation of positional income for a given class in a given context can be succinctly described as follows:
 $$ {\displaystyle \begin{array}{l}\hskip-5em Positional\ Income=\\ {}\ln \left(\frac{distance\ from\ the\ poor}{distance\ from\ the\ rich}\right)=\\ {}\ln \left(\frac{class\ income/{10}^{th}\; percentile}{90^{th}\; percentile/ class\ income}\right)\end{array}} $$
Positional income of one class is computed as the logarithm of the ratio of its distance from the poorest (i.e., the first income decile) to its distance from the richest (i.e., the last income decile), where each of these distances is itself expressed in terms of ratio. Hence, it is expressed in a metric that represents the logarithm of the ratio of one distance to another. Concretely, a value of 0 indicates equidistance from the two poles (i.e.,
 $ ratio=1 $
). If a given social class is twice as distant from the poor as from the rich (i.e.,
$ ratio=1 $
). If a given social class is twice as distant from the poor as from the rich (i.e.,
 $ ratio=2 $
), its positional income is roughly
$ ratio=2 $
), its positional income is roughly
 $ 0.7 $
(
$ 0.7 $
(
 $ \simeq \ln (2) $
); conversely, if the distance from the poor is half the distance from the rich (i.e.,
$ \simeq \ln (2) $
); conversely, if the distance from the poor is half the distance from the rich (i.e.,
 $ ratio=0.5 $
) positional income is equal to roughly
$ ratio=0.5 $
) positional income is equal to roughly
 $ -0.7 $
(
$ -0.7 $
(
 $ \simeq \ln (0.5) $
). The logarithmic transformation ensures that the index has desirable properties: The zero point is meaningful, and positive and negative values are symmetric. In short, positional income measures the relative position of a social class with respect to the wealthy and the have-nots. Considering both references simultaneously gives a more comprehensive synthetic view of a social class’s position, rather than the approach of Burgoon et al. (Reference Burgoon, van Noort, Rooduijn and Underhill2019) that considers them one at a time and of Derndorfer (Reference Derndorfer2023) that contemplates only one reference.
$ \simeq \ln (0.5) $
). The logarithmic transformation ensures that the index has desirable properties: The zero point is meaningful, and positive and negative values are symmetric. In short, positional income measures the relative position of a social class with respect to the wealthy and the have-nots. Considering both references simultaneously gives a more comprehensive synthetic view of a social class’s position, rather than the approach of Burgoon et al. (Reference Burgoon, van Noort, Rooduijn and Underhill2019) that considers them one at a time and of Derndorfer (Reference Derndorfer2023) that contemplates only one reference.
Subsequently, I assess economic status change by computing unit changes in positional income over a given time span of
 $ T $
years. Specifically, positional income change at a given time point
$ T $
years. Specifically, positional income change at a given time point
 $ {t}_0 $
is computed as the unit difference in positional income between the said time point
$ {t}_0 $
is computed as the unit difference in positional income between the said time point
 $ {t}_0 $
and
$ {t}_0 $
and
 $ T $
years earlier:
$ T $
years earlier:
 $$ {\displaystyle \begin{array}{l}\hskip-5em \Delta \hskip0.35em {Positional\ Income}_{t_0}={Positional\ Income}_{t_0}\\ {}\hskip10em -{Positional\ Income}_{t_{-T}}\end{array}} $$
Therefore, it is a difference score measure, and it is expressed as a unit change. Its interpretation is intuitive. It takes value 0 if there has been no change in positional income for a given class. It takes a positive value if the said class has moved closer to the rich than to the poor, meaning that its economic status has improved.Footnote 11 In contrast, if the class has moved closer to the poor than to the rich, its position has devalued, and positional income change is negative. In short, a decrease in positional income over time substantively indicates an economic status loss.
Such a method ensures that positional income remains constant over time if, despite income growth, distances between positions within the social ranking remain unaltered, because all the quantities of equation 1 would be multiplied by the same number. If such distances change, winners and losers emerge. This is consistent with my theoretical distinction between economic status change and economic growth.
Operationalization of Positional Income Change
The units of analysis for measuring economic status are social classes; they are operationalized following Oesch’s (Reference Oesch2006) class scheme, consistent with the definition I provided earlier. In contrast to competing measures, it effectively accounts for two important features of postindustrial economies that are relevant for electoral politics: increasing heterogeneity within the middle class and the emergence of nonindustrial lower-skilled occupations. It does so by drawing group boundaries based on the required level of marketable skills and the different work logics involved. In my data, I distinguish 15 classes.
The computation of class-level positional income change using EU-SILC data can be succinctly summarized in three steps: (1) estimating per-class average absolute income levels (based on information on real household equivalized yearly disposable income), (2) converting absolute levels into positional levels, and (3) computing changes over time (see online appendix C for descriptive statistics of this measure). I opt for a five-year time span in my main analysis and try out different choices in the robustness checks.
Model
My main analysis is based on the following logistic regression model with robust standard errors:
 $$ {\displaystyle \begin{array}{c}\hskip-7em \mathrm{logit}\left[\Pr \left({PRRvote}_i=1\right)\right]={\beta}_0+{\beta}_1\Delta {PosInc}_i\\ {}\hskip8em +{\beta}_2\Delta {AbsInc}_i+{\beta}_3\Delta {AbsInc}_i^2\\ {}\hskip6em +{\beta}_4{AbsInc}_i+{\beta}_5{AbsInc}_i^2\\ {}\hskip2em +{\beta}_6{\mathbf{Class}}_i+{\beta}_7{\mathbf{X}}_i\\ {}\hskip6em +{\beta}_8{\mathbf{Cntry}}_i+{\beta}_9{\mathbf{Round}}_i\end{array}} $$
The dependent variable
 $ \left({PRRvote}_i\right) $
is a dummy identifying whether the respondent (
$ \left({PRRvote}_i\right) $
is a dummy identifying whether the respondent (
 $ i $
) has voted for a PRR party—classified as described earlier—rather than any other party in the last election. My chief independent variable is positional income change
$ i $
) has voted for a PRR party—classified as described earlier—rather than any other party in the last election. My chief independent variable is positional income change
 $ \left(\Delta {PosInc}_i\right). $
Because this variable correlates with absolute income change
$ \left(\Delta {PosInc}_i\right). $
Because this variable correlates with absolute income change
 $ \left(\Delta {AbsInc}_i\right) $
by construction, I control for the latter (see also online appendix C on this matter). The same goes for class-specific absolute income level
$ \left(\Delta {AbsInc}_i\right) $
by construction, I control for the latter (see also online appendix C on this matter). The same goes for class-specific absolute income level
 $ \left({AbsInc}_i\right) $
, expressed in logged purchasing power parities. For both variables, the model includes both a linear and a quadratic term. It includes social class fixed effects
$ \left({AbsInc}_i\right) $
, expressed in logged purchasing power parities. For both variables, the model includes both a linear and a quadratic term. It includes social class fixed effects
 $ \left({\mathbf{Class}}_i\right) $
to control for stable characteristics and voting patterns by class, as well as a set of individual-level characteristics
$ \left({\mathbf{Class}}_i\right) $
to control for stable characteristics and voting patterns by class, as well as a set of individual-level characteristics
 $ \left({\mathbf{X}}_i\right) $
: age, gender, education, and migration background. The model additionally includes country and survey round effects
$ \left({\mathbf{X}}_i\right) $
: age, gender, education, and migration background. The model additionally includes country and survey round effects
 $ \Big({\mathbf{Cntry}}_i $
and
$ \Big({\mathbf{Cntry}}_i $
and
 $ {\mathbf{Round}}_i\Big) $
. I applied survey weights (see online appendix D for further details on variables operationalization) and tested the sensitivity of my strategy by performing a series of robustness checks.
$ {\mathbf{Round}}_i\Big) $
. I applied survey weights (see online appendix D for further details on variables operationalization) and tested the sensitivity of my strategy by performing a series of robustness checks.
Results
Economic Status Loss: Descriptive Evidence
I first present an overview of my data on income dynamics in Europe from the early 2000s onward. Figure 2 tracks the yearly evolution of average income levels by each social class in Sweden (see online appendix C for data from the other countries). It also plots estimates of the first and the last decile of the overall income distribution: the financial welfare of the poorest and the richest, respectively, in Swedish society. Drawing on such information, I computed positional income estimates, which are plotted in figure 3.
Income Dynamics in Sweden (2003–19): Absolute Income
Note: The graph shows class-level averages of yearly equivalized household disposable income estimates, as well as the first and last decile of the entire distribution. Real income estimates are in constant 2010 local currency unit (Swedish krona). Values are log-transformed, but the axis is labeled in natural units. Figures from samples of 20–49 observations are flagged with a cross to comply with Eurostat data confidentiality policy.

Income Dynamics in Sweden (2003–19): Positional Income
Note: The graph shows class-level positional income estimates. Red-colored figures on the vertical axis are substantively meaningful values (see online appendix C). Figures from samples of 20–49 observations are flagged with a cross to comply with Eurostat data confidentiality policy.

In figure 2, we observe that all Swedish social classes experienced a clear increase in income levels until at least 2014. Such a pattern was particularly pronounced among higher-level managers (+37%) and sociocultural professionals (+26%), although the low-skilled service working class also enjoyed clear-cut growth (+18%).
Yet, looking at income levels from a relative perspective yields a less cheerful picture. The uptrend experienced by low-skilled service workers was not so different from that of the poorest in society (+15%) and was far less than the increase experienced by the wealthiest (+35%). Thus, members of the low-skilled service working class improved their material conditions at the same pace as the poorest, thus remaining equidistant from them, but not as fast as the richest, resulting in a wider gap. This trend is clearly reflected in figure 3, which shows positional income with a drop of
 $ 0.12 $
units.Footnote
12
$ 0.12 $
units.Footnote
12
Conversely, the growth rate of sociocultural professionals’ income (+26%) was comparatively closer to that of the richest (figure 2). Higher-level managers (+37%) even exceeded it, albeit slightly. Therefore, sociocultural professionals managed to maintain equidistance from the top and the bottom of the socioeconomic hierarchy, which reflects little change in positional income (figure 3). They gained ground over the have-nots, though without bridging the gap with those wealthier. Higher-level managers in turn managed to do both, with a change in positional income of 0.18 units.
To sum up, Swedish society generally enjoyed increasing economic welfare at the beginning of the twenty-first century, but it did not bring a relative improvement for everyone. Although some classes gained on all counts, others gained objectively while losing positionally. Interestingly, these dynamics were consistent with macroeconomic data based on aggregate measures like GDP and the Gini coefficient (OECD 2015). Sweden experienced sustained economic growth, yet inequality also increased. Hence, Swedish society simultaneously became richer and more unequal. My class-level data provide fine-grained information about who has gained and lost, which is critical to investigating individual voters’ choices. The data reveal that Sweden is no exception: Throughout Europe, the working classes experienced a decline in positional income (figure 4).
Positional Income: Focus on the Working Class (Cross-Country Average)
Note: Yearly class-level positional income estimates are averaged across countries.

Main Regression Analysis
Regression results for the main model are shown in table 1. To facilitate interpretation of its data, I computed the average marginal effect (AME) of my main independent variable, positional income change, on the probability of voting for the PRR. The coefficient is equal to
 $ -0.14 $
 $ \left(p<0.01\right) $
: It is statistically significant and is in the expected direction. A one-unit increase in positional income over time decreases the probability of voting for a PRR party by
$ \left(p<0.01\right) $
: It is statistically significant and is in the expected direction. A one-unit increase in positional income over time decreases the probability of voting for a PRR party by
 $ 14 $
percentage points, holding other variables constant.Footnote
13 Expressed in a different metric, a one SD increase in positional income decreases the probability of far-right voting by
$ 14 $
percentage points, holding other variables constant.Footnote
13 Expressed in a different metric, a one SD increase in positional income decreases the probability of far-right voting by
 $ 1.7 $
percentage points. For reference, this corresponds to slightly less than half the AME (
$ 1.7 $
percentage points. For reference, this corresponds to slightly less than half the AME (
 $ 3.9 $
percentage points) of a one SD increase in education—a well-known predictor of the outcome of interest that captures several factors such as schooling and marketable skills.Footnote
14 It is also four times that observed in Burgoon et al. (Reference Burgoon, van Noort, Rooduijn and Underhill2019): 0.4 percentage points for a one SD increase.Footnote
15 One could speculate that the better performance of my predictor comes from the dual advantages of adopting a more overarching measure of inequality—considering the top and the bottom of the social hierarchy simultaneously, instead of separately—and choosing social groups (social class) as the unit of analysis (see online appendix C for a more thorough discussion). In short, PRR parties disproportionately gain voters among social classes facing economic status loss—those who have moved further away from the affluent than from the poor.
$ 3.9 $
percentage points) of a one SD increase in education—a well-known predictor of the outcome of interest that captures several factors such as schooling and marketable skills.Footnote
14 It is also four times that observed in Burgoon et al. (Reference Burgoon, van Noort, Rooduijn and Underhill2019): 0.4 percentage points for a one SD increase.Footnote
15 One could speculate that the better performance of my predictor comes from the dual advantages of adopting a more overarching measure of inequality—considering the top and the bottom of the social hierarchy simultaneously, instead of separately—and choosing social groups (social class) as the unit of analysis (see online appendix C for a more thorough discussion). In short, PRR parties disproportionately gain voters among social classes facing economic status loss—those who have moved further away from the affluent than from the poor.
 $ \varDelta $
Positional Income and PRR Voting (Average Marginal Effect)
$ \varDelta $
Positional Income and PRR Voting (Average Marginal Effect)

Note: Individual-level controls are age, gender, education, and migration background. Standard errors in parentheses.
*
 $ p<0.05 $
; **
$ p<0.05 $
; **
 $ p<0.01 $
; ***
$ p<0.01 $
; ***
 $ p<0.001 $
.
$ p<0.001 $
.
A graphical representation of these results is provided in figure 5, which shows the predicted probability of PRR voting at different levels of positional income change. The average change in positional income is close to zero. PRR parties score 14% among voters experiencing the most typical decrease in positional income, but this figure drops to 11% among those experiencing the most typical increase. The magnitude of these figures is nonnegligible, given the average level of PRR support (12%).
 $ \varDelta $
Positional Income and PRR Voting (Predicted Probabilities)
$ \varDelta $
Positional Income and PRR Voting (Predicted Probabilities)
Note: Results refer to the logistic model shown in table 1. The central red line corresponds to the mean (
 $ \mu $
), whereas the side ones are
$ \mu $
), whereas the side ones are
 $ \mu \pm 1 SD $
. The background line plots the distribution of
$ \mu \pm 1 SD $
. The background line plots the distribution of
 $ \Delta $
positional income.
$ \Delta $
positional income.

Subsequently, I tested whether my results are driven by any of the two main competitors of the PRR: the left and the center-right (see online appendix D for their operationalization). Doing so allowed me to ensure that a drop in positional income influences voters to choose a far-right party over any alternative option. I ran a set of logistic regressions on the same sample using the same predictors as the main model. Results from these regressions are reported in figure 6 as average marginal effects on the probability of voting for each different option. To facilitate its interpretation, the graph also plots the predicted vote share for each party family across different levels of the predictor.Footnote 16 As we can observe, both the left and the center-right performed worse among voters experiencing a drop in positional income. It follows that the overall association observed in the main analysis is not driven by any specific competitor of the PRR.
 $ \varDelta $
Positional Income and Voting (Average Marginal Effect and Cumulative Predicted Probability)
$ \varDelta $
Positional Income and Voting (Average Marginal Effect and Cumulative Predicted Probability)
Note: The graph plots the predicted probability of voting for each party at different levels of positional income change estimated from a multinomial model. Values in parentheses are the average marginal effect of positional income change on the probability of voting for a given party family based on a series of logistic regressions. The results of these are shown in table 1 for the PRR and table 1 in the online appendix for the other options. *,
 $ p<0.05 $
; **
$ p<0.05 $
; **
 $ p<0.01 $
; ***
$ p<0.01 $
; ***
 $ p<0.001 $
.
$ p<0.001 $
.

More specifically, when disaggregating the left-wing family into social democratic and green parties, I observed a significant (positive) coefficient in the case of the former and a null result in the latter, although I cannot exclude that this difference might be due to the limited number of cases in which a green competitor is present (see table E.2 in the online appendix). Additional results on the populist left and the far left are presented later.
Yet, one may still speculate whether the observed association between economic status loss and PRR voting may be due to an outflow of voters from the left or the center-right to abstention. This scenario is plausible insofar as economic status loss might hinder the credibility of these two parties without benefiting the PRR, possibly because of the stickiness of electoral preferences. If that were the case, the earlier results would be an artifact—a product not of an electoral gain by the PRR but rather a loss by its competitors. To address this concern, I performed an additional logistic regression on electoral participation. It appears unaffected by positional income change (see table E.3 in the online appendix). This result gives me confidence that the association between changes in economic status and voting choice is not driven by changes in turnout. In a nutshell, voters opt for voice rather than exit when facing loss, and they do so by supporting the PRR.
I also checked for potential heterogeneities in the observed association between economic status loss and PRR voting (figure 7). I did not observe a gender-based difference: The coefficients of both men and women are statistically significant, and the difference between the two is virtually zero. The same goes for natives and non-natives. Interestingly, I did observe variability based on education. The overall coefficient is seemingly driven by voters with lower and medium levels of education, whereas voters with tertiary education may be immune to economic status loss. Recognizing that this variable may partly capture more than just education, such as skills or values, I suggest two possible (non-mutually exclusive) interpretations. First, because status has both an objective and a subjective component—meaning that it exists objectively but has then to be acknowledged by individuals—the latter component must go through individual judgment, which is conditional on one’s mindset. That mindset, in turn, is a cause and a consequence of one’s educational level. Thus, we may speculate that voters with different educational levels reach different subjective readings of their economic status. Second, it may plausible that highly educated voters are less concerned by economic status because they can draw on other types of status, such as prestige. Either way, both interpretations further justify my endeavor to investigate the social meaning of economic resources beyond their absolute value for voters.
 $ \varDelta $
Positional Income and PRR Voting: Heterogeneous Effects (Conditional Marginal Effect)
$ \varDelta $
Positional Income and PRR Voting: Heterogeneous Effects (Conditional Marginal Effect)
Note: Representative values for education: 9, 13, and 17 years of education. *
 $ p<0.05 $
*; **
$ p<0.05 $
*; **
 $ p<0.01 $
; ***
$ p<0.01 $
; ***
 $ p<0.001 $
.
$ p<0.001 $
.

I additionally check for potential context-dependent heterogeneities (figure E.1 in the online appendix). Country-specific coefficients do not deviate significantly from the average (panel a). Neither do survey-round-specific ones (panel b), except for the fourth round; however, that round only included one election, which is insufficient to infer heterogeneity.
In sum, I find that changes in class-level economic status, which I measure through positional income change, are negatively correlated with PRR voting. The magnitude of this relation is socially relevant. The result is not driven by either the left or the center-right taken individually: both are affected. In addition, I find no relation with turnout. The association is more evident among voters with lower levels of education, although I found no gender-based heterogeneity.
My empirical strategy relies on class-level information, which may introduce two concerns. One may suspect that the observed “effect” of class-level changes on voting is a mere average of individual-level ones. If one had information on individual-level changes, one would observe a stronger “effect” of economic status loss on voting. Or one might question the credibility of the observed findings, given that, as certain scholars claim, class structure no longer reflects the allocation of economic opportunities in society. Although the ESS—like similar major cross-country surveys—does not contain detailed individual-level information on income, I can test whether the observed association depends on the diversity of income levels in each social class; that is, the within-class standard variation. This is not the case (figure E.2, panel a in the online appendix), which provides suggestive evidence that class-level dynamics are politically salient even when individual-level situations tend to deviate from them. If anything, variation matters (moderately) only for the precision of the estimates (figure E.2, panel b), measured in terms of the standard error of the income averages; the coefficient approaches zero as the reliability of my survey-based estimates decreases, which is normal. These results come as no surprise, given the established economic importance of class, as presented earlier in the literature review. Based on my data from the EU-SILC, I estimate the level of income stratification (Zhou Reference Zhou2012) by social class in European societies to be 0.29. This implies that there is a 65% chance that a randomly selected worker in a higher class will earn more than a randomly selected worker in a lower class. Income stratification by class is comparable to the one by education (0.34) and citizenship status (0.27), but it is clearly higher than the one by age (0.08), gender (0.03), region (0.17), and industrial sector (0.15).
Finally, I report the results of several robustness tests in online appendix E and briefly discuss the main findings here. First, my conclusions are robust to alternative model specifications: controlling for positional income instead of absolute income, not controlling for either of the two, not using survey weights, clustering standard errors either by social class or by country, performing a linear probability model, performing a multilevel model with class random effects, and controlling for occupation rather than social class (table E.7). Second, I used alternative data manipulation strategies: not winsorizing income data, further addressing reliability for income estimates from small samples, splitting the class of clerks based on skills as in the original scheme, and restricting the sample to adults aged at least age 30 (table E.8). Third, I included four countries from Central and Eastern Europe: Estonia, Hungary, Poland, and Slovakia (table E.9). All these tests yielded comparable results. Fourth, I applied different thresholds to select elections with successful PRR parties and different time spans to compute the change in positional and absolute income: Results remained significant provided that one could exploit enough cases (i.e., elections) and enough variation in the dependent variable (figure E.3). Incidentally, this allowed me to extend my investigation to Denmark and Greece.
Additional Regression Analyses
To seek confirmation about the association between economic status loss and PRR voting, I investigated the impact of positional income change on political attitudes, positions, ideology, and preferences (see online appendix D for their operationalization). Figure 8 shows the AME of a one-unit change in positional income change on a set of standardized variables: A drop in positional income is associated with further cultural conservatism.Footnote
17 More precisely, it fuels hostile attitudes toward migrants, as well as criticism of the European Union. The magnitude of the coefficients is not impressive, though it is still relatively valuable in terms of yielding insights: a one SD increase in positional income change leads to a
 $ 0.04 $
standard deviation decrease in cultural conservatism (which corresponds to
$ 0.04 $
standard deviation decrease in cultural conservatism (which corresponds to
 $ -0.4 $
for a one-unit increase), which is just short of one-fifth of the equivalent for education (
$ -0.4 $
for a one-unit increase), which is just short of one-fifth of the equivalent for education (
 $ -0.21 $
).
$ -0.21 $
).
 $ \varDelta $
Positional Income and Political Attitudes, Positions, Ideology, and Preferences (Average Marginal Effect)
$ \varDelta $
Positional Income and Political Attitudes, Positions, Ideology, and Preferences (Average Marginal Effect)
Note: Results refer to models reported in table E.4 in the online appendix. Dependent variables are standardized. *
 $ p<0.05 $
; **
$ p<0.05 $
; **
 $ p<0.01 $
; ***
$ p<0.01 $
; ***
 $ p<0.001 $
.
$ p<0.001 $
.

I did not observe any association between positional income change and left–right self-placement. This could be easily explained by the fact that the median far-right voter tends to declare being close to the center (position 7 on a 0–10 scale) in the analyzed data; this observation finds confirmation in other survey studies (Mayer and Haegel Reference Mayer, Haegel, Herman and Muldoon2019).Footnote
18 Similarly, I found no association with right-leaning economic orientation.Footnote
19 Yet it should be noted that economic status loss boosts opposition to redistribution. A one SD increase in positional income change is associated with a
 $ 0.02 $
standard deviation increase in anti-redistribution preferences, which is almost one-fourth of the equivalent for (class-level) absolute income
$ 0.02 $
standard deviation increase in anti-redistribution preferences, which is almost one-fourth of the equivalent for (class-level) absolute income
 $ (0.11) $
. This is a novel important finding, because it provides further empirical evidence for why voters experiencing economic status loss do not respond by voting for left-wing parties, which champion redistributive policies, as do voters experiencing material loss.
$ (0.11) $
. This is a novel important finding, because it provides further empirical evidence for why voters experiencing economic status loss do not respond by voting for left-wing parties, which champion redistributive policies, as do voters experiencing material loss.
Yet, one may still doubt that there are distinctive consequences of economic status loss compared to material deprivation. Although previous studies have shown that the latter is not associated with PRR voting at the individual level, my data allowed me to provide further confirmation from class-level information. As table E.5 in the online appendix shows, absolute income change and absolute income level do not lead to a significant shift in PRR voting. Hence, we can conclude that, as expected, economic status loss, not a deterioration of material circumstances, explains class alignment to PRR parties.
Finally, the reader may wonder whether economic status loss might engender a generic populist and radical reaction among voters, without any relation to politics on the right. I considered this question and performed the same analysis on different electoral outcomes (see online appendix D for the operationalization and table E.6). A drop in positional income does make populist voting more likely, yet this outcome also includes PRR voting. In fact, when I tested the same association using populist left voting only, the coefficient was not significant. In addition, far-left parties found lower support among voters facing economic status loss. These results come as no surprise. As mentioned earlier, the profound social change that both the PRR and the radical left seek has opposite normative bases in the two cases, and material concerns, rather than status ones, have been shown to be salient to radical left voting.
Conclusion
Citizens’ resentment at losing out to the rest of society is commonly regarded as the foundation of demand for the PRR. Yet whether this motive has an objective economic basis remains disputed. Addressing this question is of key concern because both scholars and policy makers have an interest in clarifying the mechanism linking economic changes to voter behavior. This article investigated the role of collective economic status loss as a driver of PRR voting, as suggested by inquiries into voters’ perceptions and the political consequences of economic inequalities.
By drawing on individual-level data from the ESS and EU-SILC from 23 elections across 11 Western European countries, I demonstrated that PRR parties are most successful among social classes facing a decrease in economic status; that is, a deterioration of their economic position within the social hierarchy. The magnitude of the association is substantial. My data also provide evidence that the left and the center-right are likewise harmed, to the benefit of the PRR, with no change in turnout.
This evidence emerged because I leveraged a novel positional measure of income, which quantifies the relative economic position of a social class in the social hierarchy, particularly its distance from the top and the bottom of it. Such a measure captures economic status loss as a distinct experience with respect to financial loss; it also enables the identification of which groups in society face status loss so their electoral preferences can be studied. Following this, my analysis leads to results that are not only coherent with but also stronger than those observed in Burgoon et al. (Reference Burgoon, van Noort, Rooduijn and Underhill2019), possibly because of the dual advantages of adopting a more overarching measure of inequality and choosing social classes as the unit of analysis.
Additional analyses reveal that economic status loss boosts culturally conservative stances. Interestingly enough, it also boosts anti-redistribution preferences. This is a novel insight, because the opposite is true for those experiencing financial loss, which extant research has focused on. I suggest this may be because, when economic resources are portrayed as a zero-sum game, those facing relative loss would be further harmed by governments bringing relief to the have-nots: This would shift the balance in favor of the latter, further exacerbating voters’ fear of ending up in last place (Kuziemko et al. Reference Kuziemko, Buell, Reich and Norton2014).
To sum up, my research empirically corroborates the widespread (though poorly proved) argument that the inequality trends observed in postindustrial economies do foster disadvantage, thereby creating a breeding ground for PRR support. Nonetheless, it also clarifies that such disadvantage is not merely financial in nature, as previous studies suggested. On the contrary, PRR parties enjoy broader support among voters suffering from a collective downgrade of their relative economic standing. On the whole, my work lends support to previous warnings that relative deprivation, more than economic hardship, motivates PRR voting. Hence it complements well similar research explaining the resurgence of far-right populism in terms of wage stagnation or the hollowing out of the middle class (Antonucci et al. Reference Antonucci, Horvath, Kutiyski and Krouwel2017; Chauvel Reference Chauvel2020; Derndorfer Reference Derndorfer2023; Kurer Reference Kurer2020; Kurer and Palier Reference Kurer and Palier2019; Nolan and Weisstanner Reference Nolan and Weisstanner2020).
This study makes two theoretical contributions. First, it expands our knowledge of the nature of the demand-side explanations of PRR support. A sole focus on material disadvantage obscures a relevant part of the economic motives for PRR voting. Yet, I join other social scientists in considering that the dispute in scholarly and public debate around whether far-right voters are motivated more by cultural or economic reasons is a flawed one. This is because voters give a cultural reading to economic phenomena, namely those that they experience firsthand. In the case considered here, they interpret their material circumstances through the lens of status, thus going beyond absolute rationality. This translates into voting for parties that mainly campaign on cultural issues, rather than economic ones, and making a rightward shift on the cultural dimension. The observed heterogeneity of this education-based effect yields suggestive evidence that voters internalize material economic facts and construct a subjective “cultural” interpretation, which may thus vary depending on one’s interpretive tools.
Second, this study provides insight into the political consequences of economic inequalities. Its conclusions are consistent with recent accounts about the relevance of widening within-country economic gaps for electoral politics. Yet it takes a step forward in establishing a more plausible link between aggregate phenomena and individual experience. It does so by adopting a meso-level approach, quantifying the extent to which specific social groups in each national context have gained or lost ground compared to the rest of society and studying these groups’ voting behavior. Additionally, acknowledging citizens’ status reading of economic resources allows us to better understand why, in contrast to rational expectation (Meltzer and Richard Reference Meltzer and Richard1981), leftist parties do not systematically benefit from increasing inequalities (Lupu and Pontusson Reference Lupu and Pontusson2011; Pontusson and Rueda Reference Pontusson and Rueda2010). Voters facing status loss do not demand more redistribution (which the left champions) but instead the opposite.
In conclusion, my study confirms that competition for economic resources is not over: Because it has been transformed into a quest for recognition and identity, it latently fuels the dimension of politics. It also produces a conundrum faced by leftist parties competing with the PRR. On the one hand, they may want to reverse the widespread rising trend in income inequality. Based on my research, as well as by others, that a significant share of ordinary citizens do not get to enjoy the benefits of economic growth goes against the interests of leftist parties. Yet, progressively redistributive policies may not represent an adequate solution. Status politics is not about material hardship, and voters facing status loss demand the very opposite of a redistribution of wealth, as my analysis has empirically demonstrated. A workaround might be to create further high-quality jobs or at least to ensure their creation. Yet because policy makers have limited control over job creation (Baccaro and Pontusson Reference Baccaro and Pontusson2016; Hassel and Palier Reference Hassel and Palier2021), this contradiction is not easily solvable, and economic inequalities are likely to keep on fueling PRR parties’ success.
Supplementary material
To view supplementary material for this article, please visit http://doi.org/10.1017/S1537592724002858.
Acknowledgments
The author thanks the journal editors; three anonymous reviewers; Juho Härkönen, Nonna Mayer, Ellen M. Immergut, Tarik Abou-Chadi, Jan Rovny, Thomas Kurer, Raffaele Grotti, Levente Littvay, Michelle Jackson, Brian Burgoon, and Bilyana Petrova; those who attended EPSA, ECSR, SISP, and SISEC conferences; seminar participants at the EUI (PBC and IWG), Sciences Po (CEE and CRIS), City University (ESS HQ), and HHU Düsseldorf; and participants in the Politics and Society Workshop Series (Milano Statale and Duisburg-Essen) for their helpful comments and suggestions. A poster presentation of this article was awarded the prize for the best poster at the 2022 SISEC annual meeting.
Competing Interests
The author has none.
Data Availability Statement
The replication package for this article, including code and data, is available in Dataverse at https://doi.org/10.7910/DVN/I6WHFT. Data from the European Social Survey are publicly available on the study website on registration. Eurostat does not allow the dissemination of the micro-data from the EU Statistics on Income and Living Conditions. This study is based on data from Eurostat, EU Statistics on Income and Living Conditions microdata 2004-2020, reference years 1999–2019, release 2 in 2021, DOI https://doi.org/10.2907/EUSILC2004-2020V.1. The responsibility for all conclusions drawn from the data lies entirely with the author.


 Open access