

Eating patterns may contribute to the obesity epidemic along with the effects of energy imbalance. In particular, a shift in eating patterns away from the three-meals-a-day model and towards more of a ‘grazing pattern’( Reference Piernas and Popkin 1 ) and an increase in snacking in recent years( Reference Kerr, Rennie and McCaffrey 2 ) have been proposed to promote obesity( 3 ). The prevalence of snacking among adults in the USA increased from 71 to 97 % between 1997/1998 and 2003/2006, and the contribution of snacks to energy intake increased from 18 to 24 %( Reference Piernas and Popkin 1 ). Equivalent information on adults in the UK has not been published thus far.
Early investigations often reported an inverse association between eating frequency and adiposity, which was later attributed to reporting bias and the effects of post hoc changes in dietary patterns as a consequence of weight gain( Reference Bellisle, McDevitt and Prentice 4 ). However, snacking frequency may nonetheless be associated with total adiposity or a pattern of fat deposition, as thus far inconsistent findings, both positive( Reference Howarth, Huang and Roberts 5 , Reference Bes-Rastrollo, Sanchez-Villegas and Basterra-Gortari 6 ) and null( Reference Hampl, Heaton and Taylor 7 , Reference Mills, Perry and Reicks 8 ), for an association between snacking frequency and BMI, as the only measure of adiposity, have been reported in adults.
Investigating snacking behaviour has many challenges. First, there is lack of an agreed definition of which meals constitute a snack. Second, there is ambiguity in the terminology as snacking frequency has not been distinguished from consumption of snack foods. Third, snacking frequency has been associated with increases in both ‘healthy’ and ‘unhealthy’ food choices( Reference Hartmann, Siegrist and van der Horst 9 ). Furthermore, physical activity (PA) may confound the associations between snacking and adiposity – for example, sedentary behaviour has been positively associated with consumption of energy-dense snacks and inversely associated with fruit and vegetable consumption( Reference Pearson and Biddle 10 ), both of which may be consumed as snacks.
The aim of this study was to investigate the association between self-defined snacking frequency and adiposity measures among adult men and women.
Methods
Study population
The Fenland Study is an on-going population-based study designed to investigate the interactions between genetic and lifestyle factors on the risk of obesity and related metabolic traits. Volunteers born between 1950 and 1975 were recruited from general practice lists in and around Cambridgeshire in the East of England. Recruitment began in 2005, and data were available on 10 452 participants at the time of analyses, with a response rate of 27 %.
Exclusion criteria included prevalent diabetes, pregnancy or lactation, inability to walk unaided, psychosis or terminal illness. All volunteers gave their written informed consent, and the study was approved by the Cambridge Local Research Ethics Committee.
Participants were invited to attend one of the three testing sites (Ely, Wisbech or Cambridge) for a single visit, where on the test day they completed a number of questionnaires and assessments as detailed below.
Exposure: snacking frequency
Participants completed an eating pattern questionnaire in which they were asked to describe the meals or snacks that they usually eat during a 24-h period, using a grid that was divided into 2-h slots and offered four choices of meal type: main meal (e.g. meat with potatoes, pizza, lasagne, fish and chips, burgers, fried breakfast), light meal (e.g. porridge, cereal, toast, sandwiches, soup, salad, omelette), snack (e.g. biscuits, cake, fruit, sweets, chocolate, crisps, nuts, ice-cream) and drink-only snack (e.g. drinks with some milk or sugar in; not ‘low-calorie’ drinks or water). No instruction was given as to whether the 24-h period should be a weekday or a weekend day. Participants were given the option of choosing more than one meal type per time slot. Snacking frequency was calculated as the frequency of food-only snacks that the participant reported. Drink-only snacks were not included due to suggested differences in the satiating effects of foods and drinks( Reference Drewnowski and Bellisle 11 ). The analyses were adjusted for frequency of consumption of other meal types to assess the independent association of snacking frequency and measures of adiposity.
Outcomes: anthropometric and body composition measurements
At the test site facility, weight and height were measured barefoot and wearing light clothing using standardised procedures. BMI was calculated as weight (kg) divided by the square of height (m2). Waist circumference was measured mid-point between the lowest rib margin and the iliac crest to the nearest 0·1 cm with a non-stretchable, fibre-glass insertion tape (D-loop tape; Chasmors Ltd).
Body composition was assessed using dual-energy X-ray absorptiometry (DEXA; Lunar Prodigy Advanced fan beam scanner (GE Healthcare)) and ultrasonography (LOGIQ e ultrasound system (GE Healthcare)), and has been described in detail elsewhere.( Reference Stolk, Wink and Zelissen 12 , Reference Rolfe Ede, Loos and Druet 13 ) Percentage total body fat was estimated from DEXA using a three-compartment model (fat mass, fat-free mass and bone mineral mass). Visceral and subcutaneous abdominal fat thicknesses (cm) were determined using ultrasound.
Covariates
Demographic and lifestyle variables were collected using a self-administered questionnaire.
Dietary covariates
Self-reported habitual dietary intakes over the previous year were estimated using a validated 130-item semi-quantitative FFQ( Reference Bingham, Welch and McTaggart 14 ). Participants were asked to report the frequency of consumption of a ‘medium serving’ on a nine-point scale from ‘never or once per month’ to ‘more than six times per d’ and were asked to complete supplementary questions on milk, breakfast cereal and the type of fat used for baking and frying. Food intake frequency was converted to food (g/d), energy and nutrient intakes using the FFQ EPIC Tool for Analysis( Reference Mulligan, Luben and Bhaniani 15 ). Foods that could conceivably be consumed as snacks (snack-type foods) were identified from the FFQ and it included fruits, vegetables, yoghurts, nuts, crisps, cakes, biscuits, chocolate, ice-cream and sweets. These were included as covariates in an attempt to rule out confounding by food type in the association between snacking frequency and adiposity.
Plasma vitamin C (µmol/l), an objective marker of fruit and vegetable intake( Reference Dehghan, Akhtar-Danesh and McMillan 16 ), was used here as an indicator of dietary quality in line with the inclusion of promoting fruit and vegetable consumption in food-based dietary guidelines( 17 , 18 ). Plasma vitamin C levels were assessed from fasting blood samples collected into heparin-containing tubes and stabilised with metaphosphoric acid (10 %) and measured by fluorometric assay within 2 months.
Physical activity and sedentary behaviour covariates
PA was objectively assessed over 6 d using a combined heart rate and movement sensor( Reference Brage, Brage and Franks 19 ), with individual calibration of heart rate performed using a treadmill test( Reference Brage, Ekelund and Brage 20 ). Data from free-living were pre-processed( Reference Stegle, Fallert and MacKay 21 ) and modelled using a branched equation framework( Reference Brage, Brage and Franks 22 ) to estimate intensity time-series, which were summarised over time as daily Physical physical activity energy expenditure (PAEE) (kJ/kg per d).
A validated questionnaire, the Recent Physical Activity Questionnaire( Reference Besson, Brage and Jakes 23 ), was used to assess usual total PA in the previous 4 weeks. From this, we assessed screen time (hours of TV or video watched per day) as a measure of sedentariness.
Statistical analysis
After the exclusion of participants who had not completed the 24-h eating pattern questionnaire (n 339) and those who reported no usual eating occasions (n 21), data from 10 092 participants remained available for analysis. Participants with missing data were retained for analyses; missing categorical data (marital status, n 2826; intentional dieting, n 2500) were coded as missing, and for missing continuous data (alcohol consumption, n 175; years of education, n 210) the cohort median value was applied.
Analyses were performed using Stata (version 13; Stata Corp.).
Population characteristics by snacking frequency are presented as mean values (standard deviations) or medians (interquartile ranges) for continuous variables and as numbers (percentages) for categorical variables, and differences by frequency of snacking were examined using ANOVA or a Kruskal–Wallis test for difference or the χ 2 test for heterogeneity.
Associations between snacking frequency (per unit difference) and body composition were examined using multiple linear regression models. Analyses stratified by sex were conducted a priori because previous literature suggested different snacking behaviours by sex( Reference Hartmann, Siegrist and van der Horst 9 , Reference Smith, Blizzard and McNaughton 24 ) and current analyses showing significant interaction between sex and snacking frequency on body composition parameters (P<0·05). A pragmatic approach was used to account for potential confounders including demographic, lifestyle, social, dietary and PA factors. Model 1 was adjusted for age (years), smoking status (never, former and current), alcohol intake (units/d), age at completion of full-time education (years), test site (Cambridge, Ely, Wisbech) and other eating occasions (frequency/d); model 2 was further adjusted for energy intake (MJ/d), plasma vitamin C (µmol/l) as a marker of fruit and vegetable intake providing an objectively measured indication of dietary quality, PAEE (kJ/kg per d) and screen time. Occupational social class (routine/manual, intermediate/higher managerial and administrative/professional occupations), marital status (single, married, widowed, separated or divorced) and household income level (<£20 000, £20 000–£40 000 or >£40 000) were also considered but were not significant when entered into the model.
A priori, we tested for interaction between snacking frequency and each of BMI (<25 or ≥25 kg/m2) and PAEE (< or ≥median: 51·7 kJ/kg per d), in relation to body composition measures.
Sensitivity analyses
BMR was estimated using Schofield’s equations( 25 ). The ratio of energy intake to BMR (EI:BMR) was calculated for each individual. Those with an EI:BMR ratio of <1·14 were classified as under-reporters of energy intake according to cut-off limits developed by Goldberg et al. ( Reference Goldberg, Black and Jebb 26 ). Regression analyses were repeated excluding those who under-reported energy intake.
To investigate the potential effect of intentional dieting on associations with snacking frequency, we compared findings of the analysis of participants who self-reported being on a weight-loss diet with those who reported not being on a diet.
Results
Characteristics
Among all, 84 % of the women and 75 % of the men reported snacking at least once per day (range=0–12 times/d). Women reported higher snacking frequency than men (Table 1). Individuals with higher snacking frequency exhibited greater total eating occasions, frequency of other eating occasions and were younger and had higher PAEE compared with their lower snacking frequency counterparts. Higher snacking frequency was associated with lower social class, shorter education duration, lower alcohol intake and being an ex-smoker.
Characteristics of participants by frequency of snackingFootnote *: the Fenland Study, UK (n 10 092) (Mean values and standard deviations; medians and interquartile ranges (IQR); numbers and percentages)

EI, energy intake.
* Snacking frequency was estimated using an eating pattern questionnaire reflecting usual eating habits over a 24-h period (see the ‘Methods’ section).
† ANOVA or a Kruskal–Wallis test for differences by frequency of snacking or χ 2 test for heterogeneity.
‡ Total eating occasions=main meal+light meal+snack+drink-only snack.
§ Due to some missing data, numbers do not always add to 10 092 participants.
Snacking frequency and adiposity
In the adjusted analyses, among women, snacking was positively associated with BMI, waist circumference and visceral and subcutaneous abdominal fat thickness, and was inversely associated with body fat percentage in men (Table 2). Further adjustment (model 2) attenuated the association with body fat percentage in men to null.
The association between snacking frequencyFootnote * (per unit increase) and measures of adiposity by sex: the Fenland Study, UK (n 10 092) (Mean values and standard deviations; β coefficients and 95 % confidence intervals from multiple linear regression analysis)

* Snacking frequency was estimated using an eating pattern questionnaire reflecting usual eating habits over a 24-h period. Energy intake was estimated using a FFQ (see the ‘Methods’ section).
† Model 1 adjusted for age (years), alcohol (units/d), smoking status (current smoker/non-smoker), age at completing full-time education (years), test site (Cambridge, Ely, Wisbech), main meal (frequency/d), light meal (frequency/d) and drink-only snack (frequency/d)
‡ Model 2: model 1+plasma vitamin C (µmol/l), energy intake (MJ/d), physical activity energy expenditure (kJ/kg per d) and screen time (h)
There was no significant interaction between snacking frequency and PAEE (P<0·05) on any body composition measure in men or women. There was, however, a significant interaction between snacking frequency and BMI on waist circumference, body fat percentage and subcutaneous abdominal fat in both men and women (all P<0·001) and on visceral fat in women only (P=0·002).
Stratified analysis was conducted where an interaction was significant, using model 2. Among normal-weight individuals (BMI<25 kg/m2), there was an inverse association between snacking and body fat percentage in both sexes and between snacking and waist circumference in men (Fig. 1). In contrast, among the overweight or obese subjects (BMI≥25 kg/m2), there was a positive association between snacking frequency and waist circumference and subcutaneous fat thickness in women and with waist circumference in men (Fig. 1).
The association between snacking frequency (per unit increase) and measures of adiposity by sex and BMI status: The Fenland Study, UK (n 10 092). Data are β-coefficients and 95 % confidence intervals from multiple linear regression analysis. Comparison uses model 2, which is adjusted for age (years), alcohol (units/d), smoking status (current smoker/non-smoker), age at completing full-time education (years), test site (Cambridge, Ely, Wisbech), main meal (frequency/d), light meal (frequency/d), drink-only snack (frequency/d), plasma vitamin C (µmol/l), energy intake (MJ/d), physical activity energy expenditure (kJ/kg per d) and screen time (h). No interaction with BMI was noted between snacking and visceral fat thickness in men. Snacking frequency was estimated using an eating pattern questionnaire reflecting usual eating habit over a 24-h period. Energy intake was estimated using a FFQ (see the ‘Methods’ section).

Snack-type foods
Given the interaction between snacking frequency and BMI, we also examined the differences in the intake of snack-type foods (derived from the FFQ) by BMI status using t test or the Mann–Whitney U test, as appropriate. Those who were overweight or obese had higher intakes of crisps, chocolates, ice-cream and sweets and lower intakes of yoghurt and nuts compared with their normal-weight counterparts (P<0·05) (Table 3).
Snack-type food intakesFootnote * by BMI status: the Fenland Study, UK (n 10 092) (Mean values and standard deviations; medians and interquartile ranges (IQR))
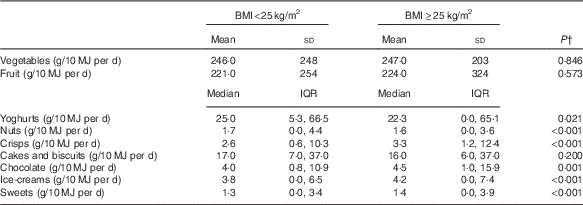
* Snack-type food intakes were estimated using a FFQ (see the ‘Methods’ section).
† The t test or the Mann–Whitney U test for difference.
Moreover, to account for possible confounding by the type of food consumed as a snack, we additionally adjusted the stratified analysis for intakes of snack-type foods. This adjustment did not appreciably change the associations; however, when intakes of snack-type foods were added to the unstratified models, which included a BMI×snacking frequency interaction term, all associations were attenuated to null (results not shown).
Sensitivity analyses
Exclusion of those categorised as probable energy under-reporters (n 4661) did not appreciably change the direction, size or statistical significance of the observed associations, nor did any of the sensitivity analyses. Among those intentionally dieting (12 % of women and 3 % of men), there were no significant associations between snacking frequency and body composition measures, whereas associations among men and women who were not intentionally dieting were similar to those for all men and women (results not shown).
Discussion
In this large population-based study, we found that snacking frequency was inversely associated with measures of adiposity in normal-weight men and women, but was positively associated among the overweight or obese. Adjustment for overall dietary quality and PA did not affect these associations nor did adjusting for type of snack within the BMI groups. However, differences in the choice of snack between those who were normal weight and those who were overweight or obese informed the opposing direction of association by BMI status.
Results in context
To the best of our knowledge, this is the first study to examine snacking and adiposity measures other than BMI and to adjust for objectively measured PAEE and objectively measured fruit and vegetable intake as an indicator of dietary quality. Sex differences in the frequency of snacking and in the contribution of snacks to dietary intakes have been reported elsewhere( Reference Hartmann, Siegrist and van der Horst 9 , Reference Bertéus Forslund, Torgerson and Sjostrom 27 ). In the present study, a higher frequency of snacking was associated with higher obesity (BMI) and body composition measures (waist circumference, subcutaneous abdominal fat and visceral fat thickness) in women but not among men. These observed sex differences were removed when we stratified by BMI status. After stratification, we found that snacking was inversely associated with total body fat in men and women of normal weight and with waist circumference in men of normal weight, but was positively associated with waist circumference and subcutaneous fat thickness in women who were overweight or obese. No significant associations between snacking frequency and visceral fat were apparent.
Snacking frequency has been associated cross-sectionally with increases in both ‘healthy’ and ‘unhealthy’ food choices, and different dietary patterns have been identified within high-frequency snacking groups( Reference Hartmann, Siegrist and van der Horst 9 ). Other evidences from cross-sectional studies have suggested a modest association between snacking and a more nutrient-dense diet( Reference Zizza and Xu 28 ), and higher intakes of vitamins, carotenoids and minerals( Reference Zizza, Arsiwalla and Ellison 29 ). Snacking is also associated with eating more in general and choosing a wider variety of foods, resulting in a more balanced intake of nutrients( Reference Whybrow and Kirk 30 ). The categorical term ‘snacks’ includes energy-dense and nutrient-poor foods, which are commonly referred to as snack foods, and also low energy-dense and high-fibre foods such as fruits. It is also generally thought that increased snacking is associated with lower PA levels, but the causal mechanism and the direction of the relationship remain uncertain. Bertéus Forslund et al.( Reference Bertéus Forslund, Torgerson and Sjostrom 27 ) concluded that high PA could not explain high-energy intake and snacking, having found that energy intake was higher with higher snacking frequency, irrespective of PA level, but it has also been suggested that the effects of snacking on weight gain may be mediated by PA through increased energy requirements( Reference Drummond, Crombie and Kirk 31 ). This disparity in the relationship between snacking frequency and dietary intakes and PA has been suggested as masking, and thus preventing the detection of an association between snacking and obesity or weight gain( Reference Howarth, Huang and Roberts 5 – Reference Mills, Perry and Reicks 8 , Reference Whybrow and Kirk 30 ). However, we found that accounting for the interaction with BMI status allowed for the detection of an association. There were different snack-type food intakes between the two groups, with those who were overweight or obese consuming less yoghurt and nuts and more ice-cream, sweets, chocolate and crisps compared with their normal-weight counterparts. One possible explanation for the different associations between BMI groups is differential gut hormone responses that different foods or nutrients may elicit. Gut hormones are known to both curb and increase appetite – for example, ghrelin may increase appetite and oxyntomodulin and peptide YY3-36 may increase satiation( Reference Murphy and Bloom 32 ). In addition, a previous study has shown that healthy, non-obese adults may maintain a normal body weight by compensating for the consumption of snacks with increased PA or reduced energy intake at other meals( Reference Viskaal-van Dongen, Kok and de Graaf 33 ).
Reporting bias
The potential of intentional dieting contributing to the differential trends by BMI status was discussed at a symposium( Reference McCrory and Campbell 34 ) in 2012 and is supported in the present analysis as women with higher BMI reported lower energy intakes. Overall, our findings do not suggest that intentional dieting was driving the associations; however, we acknowledge that the number of individuals on a weight-loss diet in these analyses was small, and thus the effect of snacking among those on a diet may warrant further investigation.
As one of the major causes of dietary under-reporting is the failure to report foods eaten between meals( Reference Poppitt, Swann and Black 35 ), reporting bias has the potential to create spurious results in any analysis of snacking. Consistent with this, we found that the percentage of energy under-reporters decreased as reported snacking frequency increased. However, the associations of snacking frequency with BMI and body composition remained similar after excluding potential under-reporters. This is in contrast with the eating frequency research, where the associations were attenuated to null when under-reporting was accounted for( Reference Bellisle, McDevitt and Prentice 4 ). In addition, it is possible that participants associate snacking with weight gain, which may cause selective under-reporting of snacking frequency by those who are overweight or obese, thus causing the differential associations, although reported snacking frequencies did not differ by BMI status in the present study.
Strengths and limitations
The Fenland Study has a large population-based sample drawn from Cambridgeshire, which is representative of the general England population in terms of smoking and PA levels and somewhat healthier than the England average for obesity levels and healthy eating( 36 ). The strengths of the study are the use of many objective and precise measures of body composition, including DEXA and abdominal ultrasound, the inclusion of plasma vitamin C as an objectively measured marker of fruit and vegetable intake reflecting dietary quality and the inclusion of objectively measured PAEE. Our approach to analysis was rigorous, as we investigated possible under-reporting, intentional dieting and interaction by BMI and PAEE, allowing us to account for and exclude many alternative explanations for an association between snacking frequency and adiposity.
A further strength is that the present analysis may better reflect usual snacking behaviour of participants, capturing what they deem to be snacks. Although often defined as foods eaten between meals, there is no physiological basis to distinguish a meal from a snack( Reference Chamontin, Pretzer and Booth 37 ). A biologically based definition has been proposed: eating during a period of satiety rather than simply eating between meals( Reference McCrory and Campbell 34 ), while self-definition by participants has also been advocated( Reference Booth 38 ). In this study, participants were asked to describe their usual eating patterns for a 24-h period, giving information on the time of the day and the frequency of consumption of each meal type, whereas other studies have recorded snacking during a specific period of time or derived frequencies from food intake records where the researcher decides meal types.
This study has certain limitations. Its cross-sectional nature prevents the direction of the association from being determined, and we could not investigate the association of snacking with weight change. We were unable to validate the eating pattern (snacking frequency) questionnaire or examine the definition of a snack, drawing no distinction between eating between meals or eating in a state of satiety and relying on participants’ interpretation of what constitutes a snack. As eating pattern data (24-h eating pattern questionnaire) were collected separately from dietary intake data (FFQ), the energy and nutrient content of the snacks and which specific foods were eaten as snacks could not be determined. We did, however, make approximations using the FFQ data. We did not include drink-only snacks when estimating snacking frequency, as we considered snacking on foods and drinks to have different satiating effects; however, the analyses were adjusted for drink-only snack frequency. Although our assessment was comprehensive, data on eating patterns and dietary intake were self-reported and are subject to measurement error and bias that accompany such subjective assessment. We adjusted for a range of relevant potential confounding factors but residual confounding could not be ruled out.
Conclusion
In conclusion, snacking frequency was inversely associated with measures of adiposity in normal-weight men and women, but was positively associated in those who were overweight or obese. The differential association by BMI group may be due to differences in the choice of snack. The promotion of healthy snack choices could contribute to anti-obesity public health initiatives.
Acknowledgements
The authors are grateful to all the Fenland Study volunteers for their time and help and to the general practitioners and practice staff for help with recruitment. The authors thank the Functional groups of the MRC Epidemiology Unit, including the Fenland Study Co-ordination team, the Field Epidemiology team, the data management team and the laboratory team. The authors also thank Emanuella De Lucia Rolfe for anthropometry, DEXA and ultrasound data, and Kate Westgate and Stefanie Mayle for assistance with physical activity data processing. Biochemical assays were performed by the National Institute for Health Research, Cambridge Biomedical Research Centre, Core Biochemistry Assay Laboratory and the Cambridge University Hospitals NHS Foundation Trust, Department of Clinical Biochemistry.
The Fenland Study is funded by the Wellcome Trust and the Medical Research Council. Support from Medical Research Council programmes MC_UU_12015/1 and MC_UU_12015/5 is acknowledged.
The authors’ responsibilities were as follows: L. O’C. performed the statistical analyses and drafted the manuscript. N. G. F. and L. O’C. conceived the current research question, and N. G. F. provided input on the data analysis and interpretation of results. N. J. W., N. G. F., S. J. G. and S. B. are principal investigators of the Fenland Study and are responsible for the overall design and management of the study, with N. J. W. as chief investigator. All the authors contributed to the critical revisions and have read and approved the final version of the manuscript.
There are no conflicts of interest.


 Open access