

Introduction
The common hippopotamus Hippopotamus amphibius is a semi-aquatic artiodactyl of sub-Saharan Africa (Kingdon, Reference Kingdon1979; Eltringham, Reference Eltringham1999) and, historically, was widely distributed throughout the region (Eltringham, Reference Eltringham1999; Feldhake, Reference Feldhake2005; Lewison & Oliver, Reference Lewison and Oliver2008). Five evolutionary units have been described based on morphological differences (Ansell, Reference Ansell, Meester and Setzer1971; Grubb, Reference Grubb and Oliver1993; Eltringham, Reference Eltringham1999) but only three of these are genetically different (Okello et al., Reference Okello, Nyakaana, Masembe, Siegismund and Arctander2005).
The range of the hippopotamus has become increasingly restricted in recent decades, a contraction that has been accompanied by substantial declines in abundance, with the most recent estimates suggesting population declines of 7–20% during 1996–2004 (Eltringham, Reference Eltringham1999; Lewison & Oliver, Reference Lewison and Oliver2008). Although the causes of these declines are documented and well understood (habitat loss, exploitation and conflicts with people), they continue to operate and appear unlikely to be eliminated in the near future, amplifying the need to develop effective conservation measures for the hippopotamus.
Recent estimates suggest that c. 125,000–148,000 hippopotamuses currently occur in fragmented populations in rivers, lakes and other wetlands of eastern, western and southern Africa (Oliver, Reference Oliver1993; Lewison & Oliver, Reference Lewison and Oliver2008). Of the 36 countries where the common hippopotamus is known to occur, 20 have confirmed declining populations, seven have populations of unknown status, nine have stable populations and three (Algeria, Egypt and Mauritania) have experienced recent extinctions (Lewison & Oliver, Reference Lewison and Oliver2008). Based on the estimated global population, coupled with intensifying threats of poaching for meat and ivory (Weiller et al., Reference Weiller, De-Meulennaer and Vanden-Block1994; Williamson, Reference Williamson2004; Conservation, 2006), progressive habitat loss and persecution because of conflicts with people, the hippopotamus was categorized as Vulnerable on the IUCN Red List in 2006 (Lewison & Oliver, Reference Lewison and Oliver2008).
Despite its Vulnerable status and ecological significance, and rising conflicts with people, the hippopotamus has not been well studied or monitored in many parts of its range, including Kenya where the species has been officially protected since the 1920s (Kenya Game Department, 1953). Monitoring is necessary to understand the factors underpinning population dynamics and hence to develop an understanding of how the hippopotamus influences, and is influenced by, changes in riparian habitats (Field, Reference Field1970; Thornton, Reference Thornton1971; Lock, Reference Lock1972; Eltringham, Reference Eltringham1999) and responds to land-use changes, climate change and variability, and conflicts with humans. The paucity of data on hippopotamus population status and dynamics in Kenya is due in part to the difficulty and high costs of counting a nocturnal, semi-aquatic mammal inhabiting river systems that are often fringed by dense riparian woodlands. It is this difficulty that has primarily limited hippopotamus population monitoring in the Mara Region of Kenya, where regular aerial monitoring and occasional ground counts of other herbivores have been conducted over the last 3 decades (Stelfox et al., Reference Stelfox, Peden, Epp, Hudson, Mbugua, Agatsiva and Amuyunzu1986; Broten & Said, Reference Broten, Said, Sinclair and Arcese1995; Ottichilo et al., Reference Ottichilo, De Leeuw, Skidmore, Prins and Said2000; Homewood et al., Reference Homewood, Lambin, Coast, Kariuki, Kikula and Kivelia2001; Serneels et al., Reference Serneels, Said and Lambin2001a; Reid et al., Reference Reid, Rainy, Ogutu, Kruska, McCartney and Nyabenge2003; Ogutu et al., Reference Ogutu, Piepho, Dublin, Bhola and Reid2009). Hippopotamuses were counted only five times in the Masai Mara River systems between 1958 and 2006 compared to > 50 times for the other large herbivores of the Mara Region (Talbot & Stewart, Reference Talbot and Stewart1964; Ottichilo et al., Reference Ottichilo, De Leeuw, Skidmore, Prins and Said2000; Ogutu et al., Reference Ogutu, Piepho, Dublin, Bhola and Reid2009; Kenya Wildlife Service, unpubl. data; Department of Resource Surveys and Remote Sensing of Kenya, unpubl. data). These counts reveal important patterns of temporal variation in the population abundance of the hippopotamus in the area and emphasize its importance for the dynamics of the Serengeti–Mara ecosystem (Darling, Reference Darling1961; Olivier & Laurie, Reference Olivier and Laurie1974; Karstad, Reference Karstad1984; Reid et al., Reference Reid, Rainy, Ogutu, Kruska, McCartney and Nyabenge2003).
Our objectives in this study were to establish the current status of the hippopotamus population in the Mara Region and to investigate how the population has changed both spatially and temporally. We present data on hippopotamus population abundance in the Mara Region since 1971, and compare the temporal patterns to those of sympatric megaherbivores (elephant Loxodonta africana, black rhino Diceros bicornis and giraffe Giraffa camelopardalis) over the same period. We evaluate the effects of land use on this hippopotamus population and examine the implications of continuing changes in land use on the conservation and management of the species in the Serengeti–Mara ecosystem.
Study area
The Mara Region in south-west Kenya is bounded by the Serengeti National Park in Tanzania to the south and the Siria escarpment to the west (Fig. 1). This region forms the northernmost limit of the Serengeti–Mara ecosystem straddling the Kenya–Tanzania boundary. The ecosystem comprises several wildlife conservation administrations and conservation–pastoralist multiple land-use zones in the two countries (Sinclair & Arcese, Reference Sinclair, Arcese, Sinclair and Arcese1995). The c. 5,500 km2 Mara includes the c. 1,530 km2 Masai Mara National Reserve and the adjacent pastoral ranches of Koyiaki, Olkinyei, Siana, Lemek and Ol Chorro Oiroua with a combined total of c. 4,000 km2. The Mara receives a mean total annual rainfall of c. 600 mm in the south-east rising to 1,200 mm in the north-west (Norton-Griffiths et al., Reference Norton-Griffiths, Herlocker and Pennycuick1975). Rainfall is bimodal, with the short rains falling during November–December and the long rains during January–June, although January and February are often dry. The vegetation is predominantly grassland, with isolated scrublands and woodlands, especially along drainage lines and on hilltops (Epp & Agatsiva, Reference Epp and Agatsiva1980).
Masai Mara National Reserve and the adjoining pastoral ranches, showing the Mara River and its tributaries.
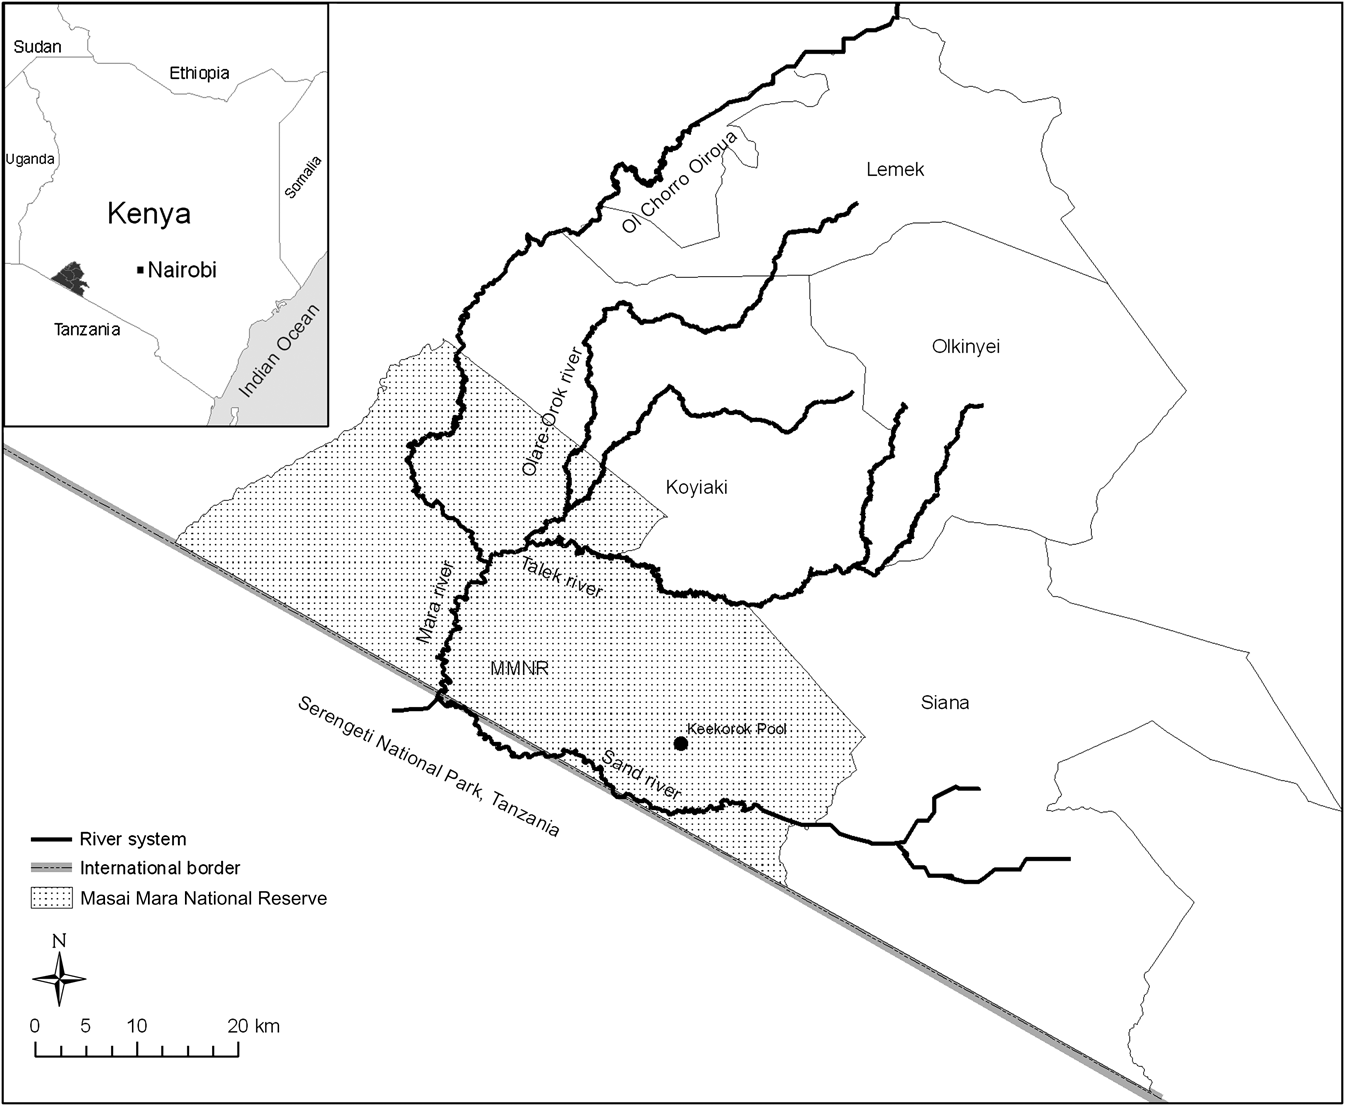
Several rivers and numerous streams drain the Mara but the Mara River, traversing both Kenya and Tanzania, is the only river that flows all year. The Sand, Talek and Olare Orok rivers are the main tributaries of the Mara River and are largely seasonal. The Mara River is c. 396 km long and its flow through the Masai Mara National Reserve and Serengeti National Park sustains a large variety of abundant wildlife, including hippopotamus, crocodile Crocodylus niloticus, wildebeest Connochaetes taurinus, Burchell’s zebra Equus burchelli and Thomson’s gazelle Gazella thomsoni. This wildlife assemblage supports a robust tourism industry in the Mara. However, wildlife populations there are facing many water-related problems, including increasing water shortages and declining water quality linked to expanding irrigated cultivation, unregulated water extraction, and deforestation of the Mau Forest catchments of the Mara River (Mati et al., Reference Mati, Mutie, Gadain, Home, Van de Walle and Carle2005).
Marked declines in herbivore numbers in the Mara have been attributed to their progressive exclusion from pastoral ranches by land-use changes, including expansion of mechanized and subsistence agriculture and settlements, which have affected > 8% of the Mara and caused land cover changes on up to 36% of the adjoining pastoral ranches (Homewood et al., Reference Homewood, Lambin, Coast, Kariuki, Kikula and Kivelia2001; Serneels et al., Reference Serneels, Said and Lambin2001b; Lamprey & Reid, Reference Lamprey and Reid2004; Mati et al., Reference Mati, Mutie, Gadain, Home, Van de Walle and Carle2005). These changes have probably intensified competition between livestock and wild herbivores on the pastoral ranches of the Mara. Moreover, settlement of the formerly semi-nomadic Masai pastoralists (Kimani & Pickard, Reference Kimani and Pickard1998, Western et al., Reference Western, Groom and Worden2009) and the associated intensification of land use and grazing by large numbers of livestock on the pastoral ranches has accelerated range degradation and fragmentation, including along riparian habitats. Rising temperatures and recurrent droughts (Ogutu et al., Reference Ogutu, Piepho, Dublin, Bhola and Reid2007) have amplified herbivore mortalities in the Serengeti–Mara ecosystem.
Methods
Ground, boat and aerial survey methods have been used to count hippopotamuses (Petrides & Swank, Reference Petrides and Swank1965; Olivier & Laurie, Reference Olivier and Laurie1974; Marshall & Sayer, Reference Marshall and Sayer1976; Viljoen, Reference Viljoen1980; Karstad, Reference Karstad1984; Tembo, Reference Tembo1987; Norton, Reference Norton1988; Smart, Reference Smart1990; Bhima, Reference Bhima1996) but accurate counts have been obtained only with ground surveys (Tembo, Reference Tembo1987; TAWIRI, 2001). We conducted ground counts of hippopotamus along the Mara River of Kenya, its three main tributaries and one major water pool during September–November 2006. This period was chosen because it spans the late dry season when water levels in the rivers are lowest and visibility of hippopotamuses in the water is highest.
We divided the study area into river sections using a 1:50,000 map. Three observers walked quietly along the river banks and, upon sighting individuals or groups of hippopotamuses, recorded the total number, group size and number of calves, with the aid of binoculars. We distinguished calves by their small body size relative to adults and subadults. We assumed that the number of individuals counted in a group accurately represented the size of the group, based on calibration trials conducted at the Keekorok Pool with a known number of hippopotamuses. Locations of all individuals and groups were determined with a global positioning system.
We tested for differences in expected group sizes between regions of the Mara River within the Masai Mara National Reserve, pastoral ranches, and Mara River tributaries within the Reserve using a negative binomial regression model assuming a negative binomial error distribution and log link function (Edwards & Berry, Reference Edwards and Berry1987). We performed multiple pairwise comparisons of expected group sizes between regions and used simulation adjustment for multiplicity. We synthesized the denominator degrees of freedom for Wald F-tests using Kenward & Roger’s (Reference Kenward and Roger1997) method for small sample sizes. All models were fitted with the SAS procedure GLIMMIX (SAS Institute, 2006). To compare the expected percentage composition of calves inside and outside the Reserve as well as in the tributaries, we used a logistic regression assuming binomial error distribution and a logit link function. We conducted multiple comparisons of the expected percentage composition of calves across regions and adjusted the tests for multiplicity using simulation adjustment. We used χ2 goodness-of-fit tests to examine differences in hippopotamus densities between regions and years and analysed temporal trends in abundance by computing percentage change in abundance between consecutive counts.
Results
We counted 4,170 individuals along 155.3 km of the Mara River system and at one pool. As we walked long sections of the same river in a day the chances of double counting, although hard to eliminate entirely, were probably low. Counts made in 1971 (Olivier & Laurie, Reference Olivier and Laurie1974) and 1980 (Karstad, Reference Karstad1984) within the Masai Mara National Reserve indicated that the population increased by 169.6% during this time, i.e. a mean annual growth rate of 18.8% (Table 1). Between 1980 and 2006 the population did not increase within the reserve but increased outside the reserve by 359.4%. The overall increase of the population in the Mara River inside and outside the reserve combined was 49.9% for this period, i.e. a mean annual growth rate of 3.1%, during which new groups apparently spread upstream to the pastoral ranches (Fig. 2). Our count in 2006 represents a biomass of 26,677 kg km-1 of river, assuming a unit weight for a hippo of 1,000 kg (Coe et al., Reference Coe, Cumming and Philipson1976).
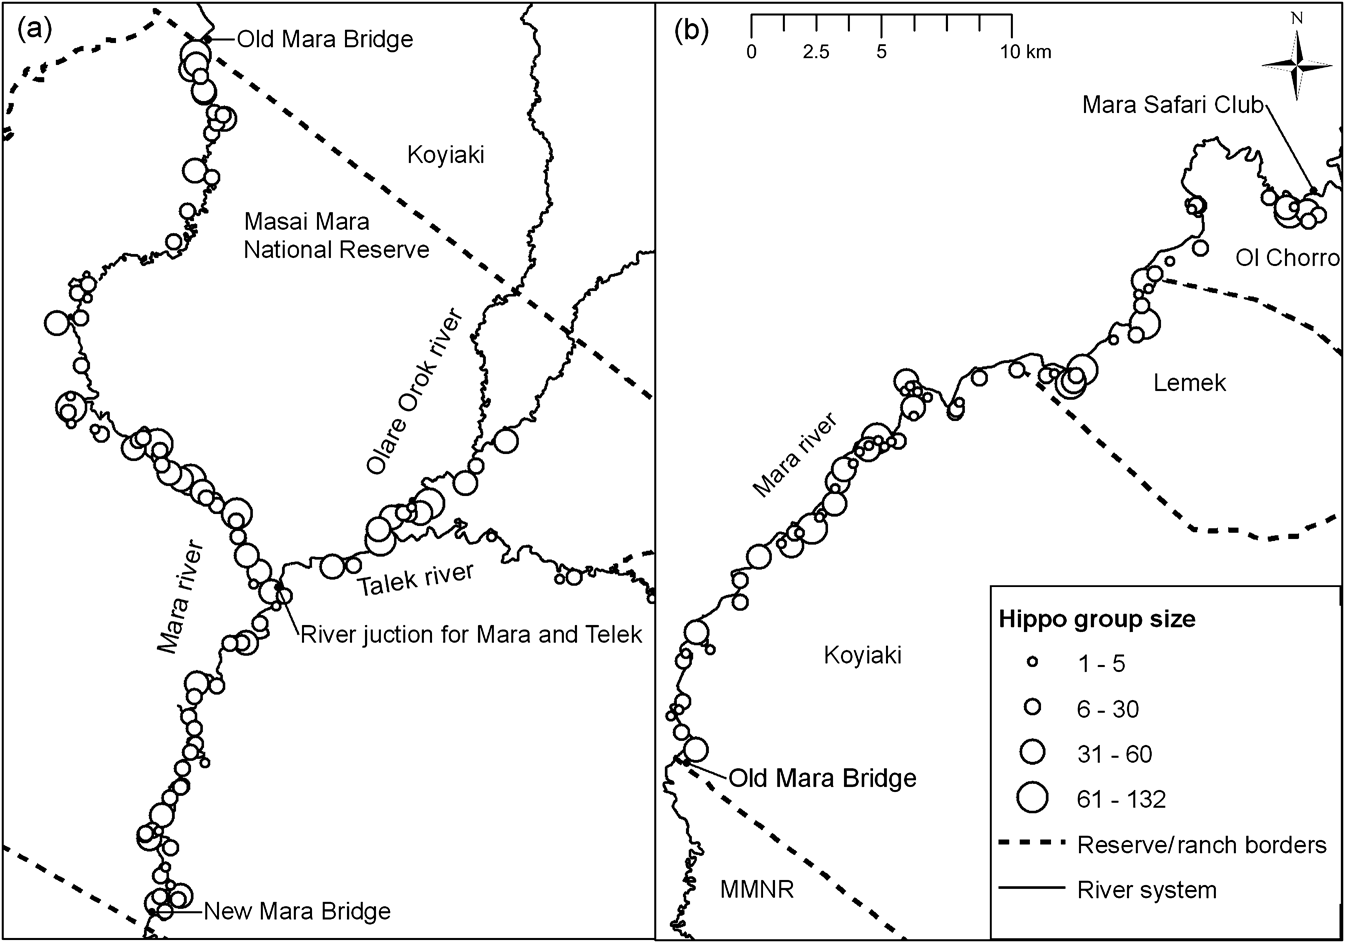
Spatial distribution of hippopotamus Hippopotamus amphibius in the Masai Mara National Reserve (a) and Pastoral Ranches (b) in 2006.
Number of hippopotamuses counted (with percentage increase compared to previous count), km of river surveyed and density of hippopotamus per km of river in the Mara Region (Figs 1 & 2) between 1971 and 2006. Blank cells indicate absence of surveys.

1 Counts made in July–August 1971
2 Both ground and aerial counts
3 Counts made in August–October 1980
4 New groups established after 1982
The density of hippopotamuses in 2006 was 36.1 and 34.4 km-1 of river within and outside the Masai Mara National Reserve, respectively. A χ2 goodness-of-fit test indicated a significant difference in densities between these two stretches of the Mara River (![]() , P > 0.05) and over time in the Reserve (
, P > 0.05) and over time in the Reserve (![]() , P > 0.05, Table 1). We counted 171 groups of 1–132 individuals (Fig. 3). Although group sizes appeared large in the Mara River tributaries (95% confidence limits = 18.7–42.5 compared to the Mara River within, 20.2–31.7, and outside, 17.3–27.5, the Reserve), differences in group sizes among the three regions were not significant (F 2, 168 = 0.73; P = 0.48).
, P > 0.05, Table 1). We counted 171 groups of 1–132 individuals (Fig. 3). Although group sizes appeared large in the Mara River tributaries (95% confidence limits = 18.7–42.5 compared to the Mara River within, 20.2–31.7, and outside, 17.3–27.5, the Reserve), differences in group sizes among the three regions were not significant (F 2, 168 = 0.73; P = 0.48).
Percentage frequency distribution of hippopotamus group sizes in the Mara region in 2006.

The ratio of calves to 100 adults was 9 : 100 (Reserve), 10 : 100 (pastoral ranches) and 6 : 100 (tributaries). Even though the percentage composition of calves was lower for tributaries (95% confidence limits = 3–9%), compared to the Reserve (7–10%) or the pastoral ranches (8–10%), logistic regression analysis showed that the expected percentage composition of calves did not differ across regions (F 2, 147 = 1.87; P = 0.59) nor were there significant pairwise differences among regions.
Discussion
The hippopotamus population size reported here represents the minimum number of individuals in the part of the Mara River we surveyed. The estimated apparent annual growth rate is high, and may suggest immigration from outside, but is biologically achievable for the hippopotamus. Similar growth rates have been reported for the hippopotamus in Luangwa River in Zambia (Marshall & Sayer, Reference Marshall and Sayer1976) and Lundi River in Zimbabwe (O’Connor & Campbell, Reference O’Connor and Campbell1986). This apparent growth rate could be partially attributed to protection in the Masai Mara National Reserve and the opportunity for range expansion upstream in the Mara River to the pastoral ranches. The hippopotamus typically has an adult male : female ratio of 1 : 1 (Smuts & Whyte, Reference Smuts and Whyte1981), compared to 1 : 2 typical of most large mammals, a gestation period of 8 months (Marshall & Sayer, Reference Marshall and Sayer1976; Smuts & Whyte, Reference Smuts and Whyte1981), which is short given its large body size, and a high fecundity of 0.55 (on average, a mature female hippo can produce a calf every 21.8 months; Laws & Clough, Reference Laws and Clough1966; Smuts & Whyte, Reference Smuts and Whyte1981). These factors all contribute to a high potential for rapid population increase when conditions are favourable. The high rate of apparent population growth reinforces the observation that hippopotamus populations are not often limited by diseases or predation but rather by the availability of suitable habitat and forage (O’Connor & Campbell, Reference O’Connor and Campbell1986), with the latter being relatively abundant in less disturbed sections of the Mara (Boutton et al., Reference Boutton, Tieszen and Imbamba1988; Onyeanusi, Reference Onyeanusi1988).
Hippopotamus density increased three-fold in the Masai Mara National Reserve, from 12.3 km-1 of river in 1971 to 36.1 km-1 of river in 2006 but with marked differences in densities between regions (Reserve = 36.1, pastoral ranches = 34.4, Talek River = 3.4 and Olare Orok River = 48.1 km-1 of river). These densities are likely to vary between seasons; elevated water levels allow groups to spread out as pools enlarge without a corresponding change in the overall hippo density.
The estimated density of 36.1 km-1 of river within the Masai Mara National Reserve is higher than the 20.2 km-1 reported for Liwonde National Park in Malawi in 1993 (Bhima, Reference Bhima1996) and the 21.6 km-1 reported for Luangwa River in Zambia in 1970 (Marshall & Sayer, Reference Marshall and Sayer1976) but similar to the 39.7 km-1 of river reported for the Luangwa River in 1983 (Tembo, Reference Tembo1987). However, similar direct comparisons with estimates of hippopotamus densities in other water bodies are often complicated by differences in habitat suitability (Olivier & Laurie, Reference Olivier and Laurie1974; Eltringham, Reference Eltringham1999).
The similarities in expected group sizes across regions complicate identification of high-quality hippopotamus habitat; nonetheless, the relatively large group sizes in the tributaries and pastoral ranches may indicate overcrowding because there are few suitable pools (Olivier & Laurie, Reference Olivier and Laurie1974; Klingel, Reference Klingel, Kayanja and Edroma1991; Viljoen, Reference Viljoen1995) or compression by land-use changes, humans and their livestock. Although we counted at the end of the dry season when most surface water dries out in the Mara and the distribution of hippopotamuses is more restricted, the counts suggest that the Mara River offers more favourable water conditions for hippopotamuses during the dry season compared to its tributaries, as indicated by the moderate group sizes and wider distribution of the groups encountered, suggesting less crowding. However, land-use changes and livestock herding may be adversely affecting hippopotamuses in the section of the Mara River within the pastoral ranches and its tributaries, where hippopotamuses form relatively large groups (Mara River 17.3–31.7; tributaries 18.7–42.5).
The ratio of calves to adults represents the apparent juvenile recruitment rate, although not all calves and adults are likely to be counted in any census and some subadults grouped with adults may not have reached breeding age. However, a high calf : adult ratio is not necessarily indicative of a fast growing population because the actual rate of population growth is not only a function of this ratio but also of juvenile and subadult recruitment and mortalities. The observed ratio for the Mara hippopotamuses of 9 : 100 is almost twice the 4.8 : 100 reported for Luangwa River in Zambia in 1983 (Tembo, Reference Tembo1987). Although the percentage composition of calves did not differ among regions the tributaries had a noticeably lower ratio, probably because of overcrowding that may depress population growth.
The numerical and spatial changes in the Mara hippopotamus population thus suggests the population is expanding but may also indicate increasing concentration of hippopotamuses in the Mara River because of contraction and compression caused by deterioration and truncation of their habitats from human activities. Moreover, if destruction of the Mara River catchments and increasing water extraction has progressively reduced overall water availability in the watershed, thus increasing the possibility of sighting hippopotamuses and yielding higher counts, then the changes are unlikely to indicate a true population increase.
The density of the hippopotamus in the Masai Mara National Reserve in 2006 was similar to that reported for 1980, implying a stable population in the Reserve. But significant population expansion was evident in the pastoral ranches, where hippopotamus density increased five-fold from 6.8 to 34.4 hippopotamuses km-1 of river. Various authors (Sayer & Rakha, Reference Sayer and Rakha1974; Marshall & Sayer, Reference Marshall and Sayer1976; Smuts & Whyte, Reference Smuts and Whyte1981; O’Connor & Campbell, Reference O’Connor and Campbell1986) have suggested that improved environmental conditions, most notably above average rainfall, improve conception and subsequent calf survival and recruitment of the hippopotamus through provision of adequate food and suitable shelter, resulting in high population growth. Our results, however, indicate that the Mara hippopotamus population increased against a background of deteriorating habitat conditions related to recurrent droughts, rising temperatures and progressive habitat desiccation (Ogutu et al., Reference Ogutu, Piepho, Dublin, Bhola and Reid2007), and fundamental land-use changes (Homewood et al., Reference Homewood, Lambin, Coast, Kariuki, Kikula and Kivelia2001; Serneels et al., Reference Serneels, Said and Lambin2001a; Lamprey & Reid Reference Lamprey and Reid2004; Mati et al., Reference Mati, Mutie, Gadain, Home, Van de Walle and Carle2005; Ogutu et al., Reference Ogutu, Piepho, Dublin, Bhola and Reid2009).
The observed increase in the hippopotamus population is inconsistent with the contemporaneous declines in the populations of mammalian herbivores weighing < 1,000 kg in the Mara (Ottichilo et al., Reference Ottichilo, De Leeuw, Skidmore, Prins and Said2000; Homewood et al., Reference Homewood, Lambin, Coast, Kariuki, Kikula and Kivelia2001; Serneels et al., Reference Serneels, Said and Lambin2001a; Ogutu et al., Reference Ogutu, Piepho, Dublin, Bhola and Reid2009). Of the three other sympatric megaherbivores (animals weighing > 1000 kg, Owen-Smith, Reference Owen-Smith1988) in the Mara, only the elephant population has increased (Dublin, Reference Dublin, Sinclair and Arcese1995; Kenya Wildlife Service, unpubl. Data); black rhino and giraffe populations have declined. The increase in elephant numbers has been attributed to an influx of elephants escaping from poachers in the Serengeti from the late 1970s to early 1990s (Dublin & Douglas-Hamilton, Reference Dublin and Douglas-Hamilton1987). The declines in giraffe and rhino populations have been attributed to declining woodland cover (Dublin, Reference Dublin, Sinclair and Arcese1995, Lamprey & Reid, Reference Lamprey and Reid2004), poaching (Walpole et al., Reference Walpole, Morgan-Davies, Milledge, Bett and Leader-Williams2001), habitat alteration, fragmentation and loss because of privatization of land tenure, expanding settlements, cultivation, and settlement of the formerly semi-nomadic Masai and consequent intensification of land use (Homewood et al., Reference Homewood, Lambin, Coast, Kariuki, Kikula and Kivelia2001; Serneels et al., Reference Serneels, Said and Lambin2001a; Ogutu et al., Reference Ogutu, Piepho, Dublin, Bhola and Reid2009). Displacement of giraffe and rhinos by pastoral livestock in the Mara might also have contributed to the declines (Mukinya, Reference Mukinya1973; Walpole et al., Reference Walpole, Morgan-Davies, Milledge, Bett and Leader-Williams2001; Ogutu et al., Reference Ogutu, Piepho, Dublin, Bhola and Reid2009). The increase of the hippopotamus population on the pastoral ranches of the Mara, although probably reflecting population growth, could also reflect exclusion of hippopotamuses from parts of their former range in the adjacent pastoral areas because of progressive habitat loss and declining water levels in the Mara River. Given that the hippopotamus is a grazer whereas giraffe and black rhinos are browsers and elephant is a mixed grazer–browser, hippopotamuses could respond differentially to environmental changes compared to other megaherbivores. However, habitat degradation, fragmentation and loss due to land-use change and poaching are unlikely to be the cause of the increase in hippopotamuses because many other mammalian grazers have declined in the Mara, suggesting that contrasting feeding styles alone are insufficient to account for these differences.
It is unlikely that rainfall was responsible for the expansion of the hippopotamus population in the Mara because, despite fluctuating widely, rainfall did not increase consistently between 1971 and 2006 (Ogutu et al., Reference Ogutu, Piepho, Dublin, Bhola and Reid2007). A potential contributing factor could have been conversion of woodlands into grasslands in the Mara by elephants and fire (Dublin, Reference Dublin, Sinclair and Arcese1995) and humans (Lamprey & Reid, Reference Lamprey and Reid2004) and maintenance of these grasslands by hippopotamuses and other herbivores. Together with protection in the reserve and pastoral ranches this could have offered suitable conditions for hippopotamuses to thrive. However, this does not explain why populations of sympatric herbivores declined concurrently. Given the persistent declines in numbers of the other herbivores, deteriorating habitat conditions and increasing pressure on water and other habitat resources, the high density of the hippopotamus is most likely indicative of range contraction and compression in the Mara.
The increase in hippopotamus density in the pastoral ranches suggests these areas play an important role in sustaining the population. However, land-use changes on the ranches and destruction of forests in the Mau catchments of the Mara River will, unless regulated, restrict the distribution of the hippopotamus population, and reduction in the volume and quality of water in the Mara River and its tributaries will lead to a decline in density. This may have significant spillover effects on other mammalian grazers that are dependent on the grazing lawns maintained by hippopotamuses. Regular monitoring of the Mara hippopotamus population is therefore required to improve our understanding of the response of the species to land-use and climate changes. Because the Mara River is transnational, effective management, conservation and monitoring of the hippopotamus in the Serengeti–Mara ecosystem require close collaboration between relevant institutions in Kenya and Tanzania.
Acknowledgements
We thank Charles Matankory and Sospeter Kiambi for assistance with fieldwork and for arranging field logistics, the Kenya Wildlife Service rangers for providing security during fieldwork, wardens of the Masai Mara National Reserve and the management of the Koyiaki and Lemek pastoral ranches for allowing us unlimited access to these areas, and Dr Richard H. Lamprey for useful discussions that helped improve this article. EK was supported by the Netherlands Fellowship Programme and the University of Groningen, through the Government of Kenya, and by the Frankfurt Zoological Society.
Biographical sketches
Erustus Kanga is an ecologist with research interests in environmental conservation and management, climate change vulnerability assessments and mappings, and the links between species and ecosystems, especially the conservation and ecology of tropical forests and savannahs and their threatened species. Joseph Ogutu is an ecologist and statistical modeller with experience in modelling population dynamics of African herbivores. Han Olff's research interests are in plant-herbivore interactions, macroecology and bio-complexity, including the effects of herbivores on vegetation diversity and plant competition, feedbacks of vegetation characteristics on herbivore population and community processes, and biodiversity theory. Peter Santema is a biologist, currently studying stress hormones, reproduction and cooperative behaviour in meerkats. He has a keen interest in ornithology, with field experience working on the fairy-martin, the Seychelles warbler, blue tits, the purple-crowned fairy-wren and nightingales.


