


1 Introduction
Irreversible turbulent mixing has an important influence on many physical processes in the ocean. In the deep ocean this mixing is needed to close the meridional overturning circulation and it helps to set the abyssal stratification (e.g. Ferrari Reference Ferrari2014; Cessi Reference Cessi2019). Waterhouse et al. (Reference Waterhouse, MacKinnon, Nash, Alford, Kunze, Simmons, Polzin, St. Laurent, Sun and Pinkel2014) also highlight strong regional variability in mixing rates inferred from observations, both in abyssal regions and in the thermocline. The spatial inhomogeneity of turbulent mixing in the ocean therefore presents a key challenge in locally quantifying the vertical transport of important tracers such as heat, carbon and nutrients.
The vast majority of energy input to the ocean comes from the tides and large-scale surface forcing by winds (Wunsch & Ferrari Reference Wunsch and Ferrari2004). The closure of the global ocean energy budget, however, requires dissipation by viscosity at millimetre scales. A significant fraction of the energy input to the ocean is dissipated in turbulent boundary layers near the top and bottom of the ocean. Energy that is not dissipated close to these boundaries typically propagates away into the interior of the ocean as internal gravity waves. For example Waterhouse et al. (Reference Waterhouse, MacKinnon, Nash, Alford, Kunze, Simmons, Polzin, St. Laurent, Sun and Pinkel2014) estimate that 69 % of the energy input into the internal wave field is not dissipated locally but is instead dissipated in the interior of the ocean. Away from the boundaries the empirical Garrett–Munk (GM) spectrum (Munk Reference Munk, Warren and Wunsch1981) describes the distribution of energy in internal waves well in a surprisingly wide range of oceanic environments. Energy transfer within the large-scale part of the GM spectrum is explained by Müller et al. (Reference Müller, Holloway, Henyey and Pomphrey1986) as weakly nonlinear resonant wave–wave interactions.
At high wavenumbers energy in the GM spectrum scales as  $E\sim m^{-2}$ with vertical wavenumber $m$. This scaling is observed up to a ‘cutoff wavenumber’, beyond which a vertical energy spectrum of $m^{-3}$ is measured (Gargett et al. Reference Gargett, Hendricks, Sanford, Osborn and Williams1981). At yet smaller scales an inertial range scaling as $m^{-5/3}$ associated with isotropic turbulence can be observed with sufficiently high resolution measurements. The intermediate range of scales for which $E\sim m^{-3}$ is sometimes associated with the breaking of internal waves; in particular that of high-frequency (in the sense of having frequency close to the buoyancy frequency $N$) internal gravity waves (see e.g. Eckermann Reference Eckermann1999). Although the fundamental breaking mechanisms of internal gravity waves by shear and convective instabilities can be described as in Thorpe (Reference Thorpe2018), the strongly nonlinear interactions that transfer energy to and between these small-scale waves are less well understood. The $m^{-3}$ scaling is readily obtained from dimensional analysis if one assumes that $N^{-1}$ is the dominant time scale, leading to $E(m)\sim L^{3}T^{-2}\sim N^{2}m^{-3}$, where $L$ and $T$ are the relevant length and time scales respectively. This suggests that buoyancy does indeed have a dominant effect on the dynamics at these scales.
The strongly nonlinear motions at small scales can also be considered as a state of ‘stratified turbulence’, although there is by no means consensus in the oceanographic and fluid dynamical literature as to what precisely is meant by this term. Often (see for example Gregg et al. Reference Gregg, D’Asaro, Riley and Kunze2018) ‘stratified turbulence’ in an oceanographic context is used to describe any turbulent flow affected by stratification. In a fluid dynamical context on the other hand, Riley & Lindborg (Reference Riley and Lindborg2008) use it to describe the particular distinguished limit of  $Fr_{h}=U_{h}/NL_{h}\ll 1$, $Re_{h}=U_{h}L_{h}/\unicode[STIX]{x1D708}\gg 1$ and $Re_{h}Fr_{h}^{2}\gg 1$ (where $U_{h}$ and $L_{h}$ are horizontal velocity and length scales and $\unicode[STIX]{x1D708}$ is the kinematic viscosity of the fluid). This particular regime is also referred to as ‘strongly stratified turbulence’ (Brethouwer et al. Reference Brethouwer, Billant, Lindborg and Chomaz2007; Maffioli Reference Maffioli2017; Zhou & Diamessis Reference Zhou and Diamessis2019) or alternatively ‘layered anisotropic stratified turbulence’ (Falder, White & Caulfield Reference Falder, White and Caulfield2016).
Furthermore turbulence in the stratified ocean interior is strongly intermittent in both space and time. Baker & Gibson (Reference Baker and Gibson1987) show that turbulent dissipation rates are often log-normally distributed, which leads to regions of high stratification such as the thermocline exhibiting the highest intermittency. This presents a great challenge in sampling the ocean to determine the nature of turbulent flows relevant to mixing in the stratified ocean.
If turbulence is generated in a stratified fluid without a source of sustaining energy, the energetics of its decay inevitably become affected by the stratification at leading order. The energy cost associated with raising dense fluid up leads to an anisotropic decay of the vertical velocity (Riley & Lelong Reference Riley and Lelong2000). Billant & Chomaz (Reference Billant and Chomaz2001) exploit such inevitable anisotropy in the flow velocity to identify a self-similar inviscid regime in the strongly stratified limit of  $Fr_{h}=U_{h}/NL_{h}\rightarrow 0$. This self-similar scaling suggests that vertical scales adjust so that $L_{v}\sim U_{h}/N$ and the flow becomes dominated by horizontal motion that varies vertically on this scale. Increasingly high resolution numerical simulations have been used to study the decay of an initially isotropic and homogeneous turbulent state subject to a background stratification (Maffioli & Davidson Reference Maffioli and Davidson2016; de Bruyn Kops & Riley Reference de Bruyn Kops and Riley2019). After approximately one buoyancy period these flows do indeed become anisotropic and adjust to this vertical length scale predicted by Billant & Chomaz (Reference Billant and Chomaz2001). Although the $E\sim N^{2}m^{-3}$ vertical spectrum is consistent with the self-similar regime, the numerical studies of decaying stratified turbulence have thus far been unable to replicate it clearly.
To investigate the properties of stratified turbulence in a statistically steady state, it seems sensible to apply body forcing to the governing equations with the aim of removing the transient dynamics of turbulent decay. It also seems natural to force flows at the large scale and then hope to rely on the net downscale cascade to transfer energy to small dissipative scales such that the total dissipation matches the energy input from the forcing. Stochastic forcing of large-scale vortical modes has often been implemented to study anisotropic stratified turbulence dominated by horizontal motion (e.g. Waite & Bartello Reference Waite and Bartello2004; Brethouwer et al. Reference Brethouwer, Billant, Lindborg and Chomaz2007; Maffioli, Brethouwer & Lindborg Reference Maffioli, Brethouwer and Lindborg2016). This approach has the advantage of not imposing a vertical length scale on the flow, allowing the predicted length scale  $U_{h}/N$ to emerge spontaneously. Furthermore, a recent study implementing this forcing by Maffioli (Reference Maffioli2017) replicates the predicted $N^{2}m^{-3}$ energy spectrum by considering only large horizontal scales of the flow. The forcing does not force vertical shear directly but is thought to enhance small existing vertical gradients through the so called ‘zigzag’ instability, first identified by Billant & Chomaz (Reference Billant and Chomaz2000a,Reference Billant and Chomazb). It is unclear how relevant these vortically dominated flows are for small-scale mixing in the ocean. In particular, the lack of significant vertical motion is inconsistent with the breaking of high-frequency internal gravity waves. A recent study by Kunze (Reference Kunze2018), however, suggests a new interpretation of oceanic spectra, where strongly anisotropic patches of stratified turbulence may be generated from fine-scale near-inertial waves. It is therefore of interest to compare flows forced by vortical modes with flows forced by internal gravity waves. Waite & Bartello (Reference Waite and Bartello2006) implement such forcing in hyperdiffusive simulations at moderate numerical resolution, but do not reach their aim of reproducing the $N^{2}m^{-3}$ energy spectrum. It is important to recognise that although the forcing of vortical modes or internal waves is applied at the large scale in these turbulence studies, the forced scale is in fact very small in the context of a geophysical energy spectrum.
For determining mean transport of relevant oceanic tracers we are primarily concerned with irreversible mixing, related to changes in background potential energy by Winters et al. (Reference Winters, Lombard, Riley and D’Asaro1995) and Peltier & Caulfield (Reference Peltier and Caulfield2003). Investigating such irreversible mixing in stratified turbulence requires accurate resolution of dissipation scales through direct numerical simulation (DNS). Many of the forced studies mentioned above rely on large eddy simulation or hyperdiffusion to prevent energy building up at small scales, and it is only recent studies that have used DNS to investigate these flows (e.g. Almalkie & de Bruyn Kops Reference Almalkie and de Bruyn Kops2012; Maffioli et al. Reference Maffioli, Brethouwer and Lindborg2016; Portwood et al. Reference Portwood, Kops, Taylor, Salehipour and Caulfield2016; Maffioli Reference Maffioli2017).
The small-scale nature of irreversible turbulent mixing inevitably requires the development and use of relatively simple parameterisation models to estimate mixing from both observations and large-scale circulation models. As outlined in Gregg et al. (Reference Gregg, D’Asaro, Riley and Kunze2018) an appropriate definition of a mixing efficiency  $\unicode[STIX]{x1D702}$ is required for inferring and parameterising mixing in such scenarios, but there is disagreement between numerical studies, laboratory experiments and observational estimates regarding both the precise definition of $\unicode[STIX]{x1D702}$ and also its functional dependence on other flow parameters. In shear-driven flows susceptible to Kelvin–Helmholtz instability, a mixing efficiency defined in terms of volume-averaged irreversible rates of increase of potential energy and turbulent viscous dissipation rate $\unicode[STIX]{x1D700}$ has been shown to depend non-monotonically on the gradient Richardson number $Ri_{g}=N^{2}/S^{2}$, the ratio of the local buoyancy frequency $N$ to the local vertical shear $S$, defined formally below (Mashayek, Caulfield & Peltier Reference Mashayek, Caulfield and Peltier2013). However, a recent study by Portwood, de Bruyn Kops & Caulfield (Reference Portwood, de Bruyn Kops and Caulfield2019) shows that homogeneously sheared stratified turbulence equilibrates to a constant value of $Ri_{g}$, with the mixing efficiency also appearing to be independent of the buoyancy Reynolds number $Re_{b}=\unicode[STIX]{x1D700}/\unicode[STIX]{x1D708}N^{2}$, where $\unicode[STIX]{x1D708}$ is the kinematic viscosity of the fluid. In the absence of a dominant mean shear, Maffioli et al. (Reference Maffioli, Brethouwer and Lindborg2016) and Garanaik & Venayagamoorthy (Reference Garanaik and Venayagamoorthy2019) instead construct theoretical scalings for the mixing efficiency in terms of a turbulent Froude number $Fr=\unicode[STIX]{x1D700}/(NE_{K})$, where $E_{K}$ is the turbulent kinetic energy (density). Indeed, the equilibrated flows considered by Portwood et al. (Reference Portwood, de Bruyn Kops and Caulfield2019) converged to a constant value of $Fr$, and it is still an open question why flows forced in this manner tune to constant values of $Ri_{g}$, $Fr$ and $\unicode[STIX]{x1D6E4}$. This plethora of potential dimensionless parameters highlights the challenge in parameterising mixing and the need to test how generically these parameterisations apply in different flows.
In this study we aim to determine the effects on irreversible mixing (quantified by an appropriately defined efficiency) of changing the large-scale forcing applied to a stratified fluid. We are particularly interested in how the ‘breaking’ of internal gravity waves modulates mixing in stratified turbulence compared to the mixing occurring in flows forced by vortical modes. We investigate the mechanisms by which mixing occurs through probing the energetics of our numerical simulations. We then relate the differences in these mechanisms to changes in the ‘mixing efficiency’ defined both locally and globally through appropriate averaging in space and time. The rest of this paper is organised as follows. In § 2 the energetics of the governing equations are discussed in the context of mixing and its parameterisation. Section 3 outlines our numerical model and the set-up of our simulations, providing details of the initial condition and body forcing used. Section 4 presents analysis of the simulation results, focusing on key properties of the statistically quasi-steady states that arise in each case. Finally, we conclude and discuss the implications of our results for the parameterisation of irreversible mixing in the ocean in § 5.
2 Theory and background
We consider an incompressible fluid with a velocity field  $\boldsymbol{u}(\boldsymbol{x},t)$ and a density field determined by a perturbation $\unicode[STIX]{x1D70C}(\boldsymbol{x},t)$ to a constant background linear stratification. We apply the Boussinesq approximation that density changes are negligible compared to the mean density and furthermore assume that the density field has a linear equation of state and hence satisfies an advection–diffusion equation. The flow is thus governed by the Navier–Stokes equations in the form
 $$\begin{eqnarray}\displaystyle & \unicode[STIX]{x1D735}\boldsymbol{\cdot }\boldsymbol{u}=0, & \displaystyle\end{eqnarray}$$
 $$\begin{eqnarray}\displaystyle & \displaystyle \frac{\unicode[STIX]{x2202}\boldsymbol{u}}{\unicode[STIX]{x2202}t}+(\boldsymbol{u}\boldsymbol{\cdot }\unicode[STIX]{x1D735})\boldsymbol{u}=-\unicode[STIX]{x1D735}p+\frac{1}{Re}\unicode[STIX]{x1D6FB}^{2}\boldsymbol{u}-Ri_{0}\unicode[STIX]{x1D70C}\hat{\boldsymbol{z}}+\boldsymbol{F}_{\boldsymbol{u}}, & \displaystyle\end{eqnarray}$$
 $$\begin{eqnarray}\displaystyle & \displaystyle \frac{\unicode[STIX]{x2202}\unicode[STIX]{x1D70C}}{\unicode[STIX]{x2202}t}+(\boldsymbol{u}\boldsymbol{\cdot }\unicode[STIX]{x1D735})\unicode[STIX]{x1D70C}=\frac{1}{RePr}\unicode[STIX]{x1D6FB}^{2}\unicode[STIX]{x1D70C}+w+F_{\unicode[STIX]{x1D70C}}, & \displaystyle\end{eqnarray}$$
 where we have non-dimensionalised the equations using length and velocity scales  $L_{0}$ and $U_{0}$, and $\hat{\boldsymbol{z}}$ is the unit vector in the vertical direction. The density perturbation has also been non-dimensionalised by $\unicode[STIX]{x0394}\unicode[STIX]{x1D70C}$. External forcing acting on the velocity and density fields are denoted by $\boldsymbol{F}_{\boldsymbol{u}}$ and $F_{\unicode[STIX]{x1D70C}}$, the precise forms of which are detailed in the next section. The three dimensionless parameters in the equations are the Reynolds number, Prandtl number and bulk Richardson number
 $$\begin{eqnarray}Re=\frac{L_{0}U_{0}}{\unicode[STIX]{x1D708}},\quad Pr=\frac{\unicode[STIX]{x1D708}}{\unicode[STIX]{x1D705}},\quad Ri_{0}=\frac{g\unicode[STIX]{x0394}\unicode[STIX]{x1D70C}L_{0}}{\unicode[STIX]{x1D70C}_{0}{U_{0}}^{2}}=\frac{{N_{0}}^{2}{L_{0}}^{2}}{{U_{0}}^{2}},\end{eqnarray}$$
 where  $\unicode[STIX]{x1D708}$ is the kinematic viscosity, $\unicode[STIX]{x1D705}$ is the density diffusivity and $\unicode[STIX]{x1D70C}_{0}$ is the mean density. The constant background density gradient is $-\unicode[STIX]{x0394}\unicode[STIX]{x1D70C}/L_{0}$, which can be used to define $N_{0}=\sqrt{g\unicode[STIX]{x0394}\unicode[STIX]{x1D70C}/\unicode[STIX]{x1D70C}_{0}L_{0}}$ as a background buoyancy frequency. Since $\unicode[STIX]{x0394}\unicode[STIX]{x1D70C}$ also acts as the dimensional scale for the density perturbation $\unicode[STIX]{x1D70C}(\boldsymbol{x},t)$, the Boussinesq approximation requires that $\unicode[STIX]{x0394}\unicode[STIX]{x1D70C}\ll \unicode[STIX]{x1D70C}_{0}$. For clarity, the full dimensional density field will be written as $\unicode[STIX]{x1D70C}^{\ast }=\unicode[STIX]{x1D70C}_{0}+\unicode[STIX]{x0394}\unicode[STIX]{x1D70C}[-z+\unicode[STIX]{x1D70C}(\boldsymbol{x},t)]$ in this formalism, where $z=z^{\ast }/L_{0}$ and $z^{\ast }$ are respectively the dimensionless and dimensional vertical coordinates.
Stably stratified flows are commonly anisotropic, with horizontal length scales much larger than vertical length scales. When analysing these flows, it is therefore natural to consider the decomposition of the velocity and density fields into horizontally averaged mean quantities and perturbations from them. We will use the following notation, denoting mean quantities with an overbar and perturbations with a prime, i.e.
 $$\begin{eqnarray}f(\boldsymbol{x},t)=\overline{f}(z,t)+f^{\prime }(\boldsymbol{x},t),\quad \overline{f}(z,t)=\frac{1}{L_{x}L_{y}}\int _{0}^{L_{x}}\int _{0}^{L_{y}}f(\boldsymbol{x},t)\,\text{d}x\,\text{d}y.\end{eqnarray}$$
 Taking a horizontal mean of the incompressibility condition (2.1) implies that  $\unicode[STIX]{x2202}\overline{w}/\unicode[STIX]{x2202}z=0$, and if $\overline{w}=0$ initially then it remains zero for all time. From now on, we will assume that this is the case and hence that the mean velocity $\overline{\boldsymbol{u}}(z,t)=(u,v,0)$ is purely horizontal.
In this paper we consider flow in a triply periodic domain, which allows us to construct simple equations for the energy of the system from (2.2) and (2.3). Implementing the decomposition (2.5) yields four energy quantities of interest: the kinetic and potential energies (per unit mass) associated with both the mean and perturbation fields, namely
 $$\begin{eqnarray}\overline{E_{K}}={\textstyle \frac{1}{2}}\langle |\overline{\boldsymbol{u}}|^{2}\rangle ,\quad E_{K}={\textstyle \frac{1}{2}}\langle |\boldsymbol{u}^{\prime }|^{2}\rangle ,\end{eqnarray}$$
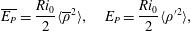 $$\begin{eqnarray}\overline{E_{P}}=\frac{Ri_{0}}{2}\langle \overline{\unicode[STIX]{x1D70C}}^{2}\rangle ,\quad E_{P}=\frac{Ri_{0}}{2}\langle \unicode[STIX]{x1D70C}^{\prime 2}\rangle ,\end{eqnarray}$$
 where  $\langle \cdot \rangle$ denotes a volume average. This positive semi-definite form of potential energy is valid since $\unicode[STIX]{x1D70C}$ is a departure from a linear background profile. Motivated by the ‘pancake vortices’ description of stratified turbulence, we refer to $E_{K}$ as the turbulent kinetic energy and to $E_{P}$ as the turbulent potential energy. Since $\overline{w}=0$ and $\langle \boldsymbol{u}\rangle =\mathbf{0}$, the mean kinetic energy $\overline{E_{K}}$ is often associated with what are conventionally referred to as ‘shear modes’, and there is a body of literature investigating its development in stratified turbulence (e.g. Smith & Waleffe Reference Smith and Waleffe2002; Augier, Billant & Chomaz Reference Augier, Billant and Chomaz2015).
Multiplying (2.2) and (2.3) by the velocity and density fields respectively leads to the following evolution equations for the energy:
 $$\begin{eqnarray}\frac{\text{d}\overline{E_{K}}}{\text{d}t}=-S_{p}-\overline{\unicode[STIX]{x1D700}},\quad \frac{\text{d}E_{K}}{\text{d}t}=S_{p}-\unicode[STIX]{x1D700}+J_{b}+P_{K},\end{eqnarray}$$
 $$\begin{eqnarray}\frac{\text{d}\overline{E_{P}}}{\text{d}t}=-N_{p}-\overline{\unicode[STIX]{x1D712}},\quad \frac{\text{d}E_{P}}{\text{d}t}=N_{p}-\unicode[STIX]{x1D712}-J_{b}+P_{P}.\end{eqnarray}$$
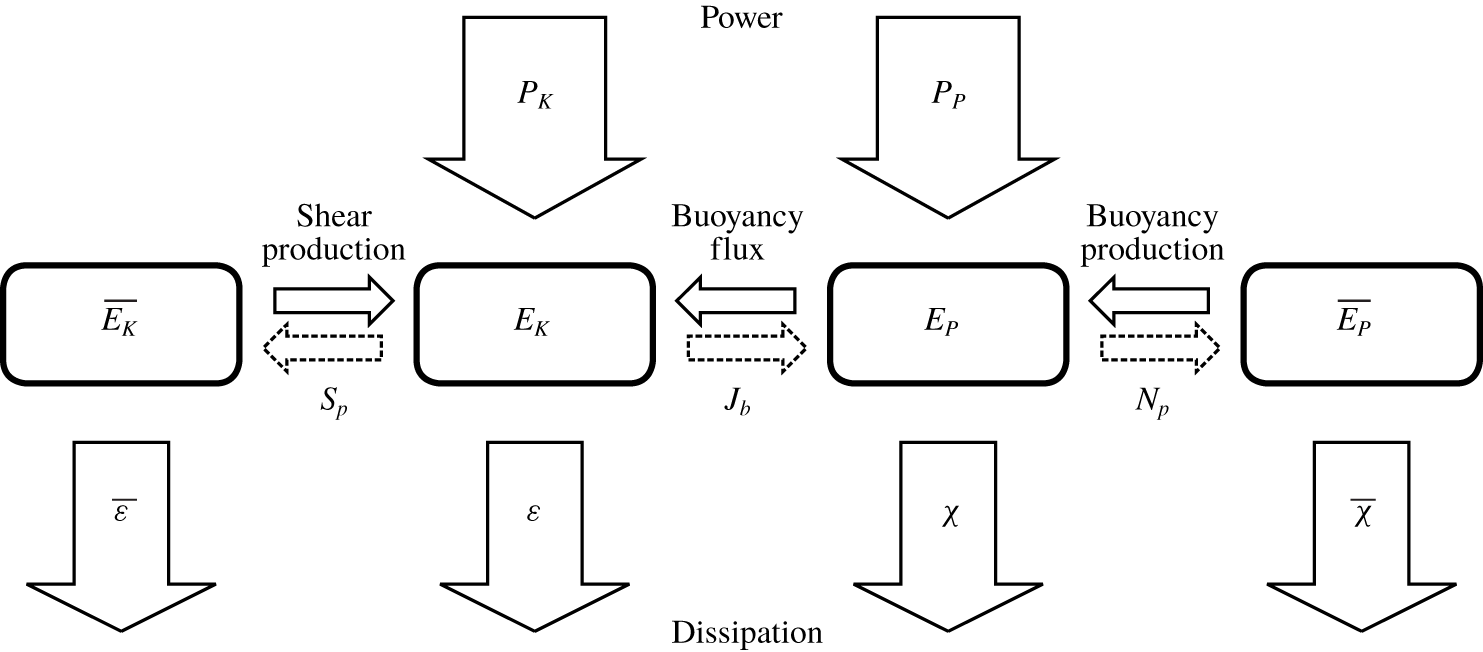
The terms on the right-hand side of these equations act as inputs, exchanges and outputs of energy for the system as sketched in figure 1 and detailed below.
Schematic detailing the energy pathways.
The rate at which energy is dissipated by the flow is quantified by the expressions
 $$\begin{eqnarray}\overline{\unicode[STIX]{x1D700}}=\frac{1}{Re}\left\langle \left|\frac{\unicode[STIX]{x2202}\overline{\boldsymbol{u}}}{\unicode[STIX]{x2202}z}\right|^{2}\right\rangle ,\quad \unicode[STIX]{x1D700}=\frac{1}{Re}\left\langle \frac{\unicode[STIX]{x2202}{u_{i}}^{\prime }}{\unicode[STIX]{x2202}x_{j}}\frac{\unicode[STIX]{x2202}{u_{i}}^{\prime }}{\unicode[STIX]{x2202}x_{j}}\right\rangle ,\end{eqnarray}$$
 $$\begin{eqnarray}\overline{\unicode[STIX]{x1D712}}=\frac{Ri_{0}}{RePr}\left\langle \left|\frac{\unicode[STIX]{x2202}\overline{\unicode[STIX]{x1D70C}}}{\unicode[STIX]{x2202}z}\right|^{2}\right\rangle ,\quad \unicode[STIX]{x1D712}=\frac{Ri_{0}}{RePr}\left\langle \frac{\unicode[STIX]{x2202}\unicode[STIX]{x1D70C}^{\prime }}{\unicode[STIX]{x2202}x_{j}}\frac{\unicode[STIX]{x2202}\unicode[STIX]{x1D70C}^{\prime }}{\unicode[STIX]{x2202}x_{j}}\right\rangle ,\end{eqnarray}$$
 where  $\unicode[STIX]{x1D700}$ is commonly known as the turbulent kinetic energy (TKE) dissipation rate. It is important to appreciate that these various rates are defined in terms of volume averages over the whole computational domain.
Energy can be exchanged between kinetic and potential energy through the buoyancy flux  $J_{b}$. Since we have assumed that the mean flow is purely horizontal, this exchange can only take place between the turbulent energies $E_{K}$ and $E_{P}$. The small-scale turbulence instead interacts with the mean flow via the turbulent shear production $S_{p}$, and by an analogous term that appears in the potential energy equations which we refer to as buoyancy production $N_{p}$. The three energy exchange terms are defined
 $$\begin{eqnarray}J_{b}=-Ri_{0}\langle w^{\prime }\unicode[STIX]{x1D70C}^{\prime }\rangle ,\quad S_{p}=-\left\langle \overline{w^{\prime }\boldsymbol{u}^{\prime }}\boldsymbol{\cdot }\frac{\unicode[STIX]{x2202}\overline{\boldsymbol{u}}}{\unicode[STIX]{x2202}z}\right\rangle ,\quad N_{p}=-Ri_{0}\left\langle \overline{w^{\prime }\unicode[STIX]{x1D70C}^{\prime }}\,\frac{\unicode[STIX]{x2202}\overline{\unicode[STIX]{x1D70C}}}{\unicode[STIX]{x2202}z}\right\rangle .\end{eqnarray}$$
The energy input provided by the forcing is prescribed to not act directly on the mean flow, so the energy input rates only appear in the perturbation energy equations and are defined as
 $$\begin{eqnarray}P_{K}=\langle \boldsymbol{u}^{\prime }\boldsymbol{\cdot }\boldsymbol{F}_{\boldsymbol{ u}}\rangle ,\quad P_{P}=Ri_{0}\langle \unicode[STIX]{x1D70C}^{\prime }F_{\unicode[STIX]{x1D70C}}\rangle .\end{eqnarray}$$
This is consistent with the forcing terms used in our numerical simulations.
In the formulation, we have chosen to retain flexibility to force both the velocity and density fields. In particular, whether or not the density field has explicit forcing has important implications for the energy budget of a quasi-steady turbulent state when  $\text{d}E_{P}/\text{d}t\approx 0$. It is worth noting that in the flows considered by this study the buoyancy production $N_{p}$ is typically much smaller than the other terms on the right-hand side of (2.9), so if there is no density forcing then the turbulent potential energy budget reads
 $$\begin{eqnarray}0\approx -\unicode[STIX]{x1D712}-J_{b},\end{eqnarray}$$
 in a steady state. Since  $\unicode[STIX]{x1D712}$ is positive semi-definite this implies that $J_{b}\leqslant 0$ and so the buoyancy flux acts to transfer energy from kinetic to potential. When $F_{\unicode[STIX]{x1D70C}}\neq 0$ this restriction is not enforced, and we will investigate the effect of introducing density forcing on the energy pathways later on. This flexibility is also physically motivated since nonlinear interactions between internal gravity waves can transfer kinetic and potential energy across spatial scales.
As noted in the introduction, we are interested in defining an appropriate measure of the ‘efficiency’ of mixing. We would wish to define an instantaneous mixing efficiency  $\unicode[STIX]{x1D702}$ as the proportion of energy lost by turbulence that leads to irreversible mixing. In our triply periodic domain it is unfortunately technically impossible to unambiguously define a background potential energy quantity as is used to quantify irreversible mixing in, for example, Peltier & Caulfield (Reference Peltier and Caulfield2003). We therefore treat $E_{P}$ as a proxy for available potential energy and use $\unicode[STIX]{x1D712}$ (as defined in (2.11)) to quantify the irreversible loss of $E_{P}$ that leads to mixing, yielding
 $$\begin{eqnarray}\unicode[STIX]{x1D702}:=\frac{\unicode[STIX]{x1D712}}{\unicode[STIX]{x1D712}+\unicode[STIX]{x1D700}},\end{eqnarray}$$
 as the expression for mixing efficiency. The denominator  $\unicode[STIX]{x1D712}+\unicode[STIX]{x1D700}$ represents the total instantaneous energy lost due to turbulence, and specifically excludes any laminar diffusion of the mean flow through $\overline{\unicode[STIX]{x1D712}}$ or $\overline{\unicode[STIX]{x1D700}}$. We focus on mixing by turbulence because geophysical flows will typically occur at much larger Reynolds numbers than we can accurately simulate, leading to negligible laminar diffusion. Even at our modest $Re$ the results are qualitatively unchanged by including the dissipation of the mean flow, with the average mixing efficiency only decreasing by between 4 % and 8 % across the simulations.
The mixing efficiency  $\unicode[STIX]{x1D702}$ is closely related to $\unicode[STIX]{x1D6E4}$, the turbulent flux coefficient commonly used in oceanography to infer measures of mixing from observations. The original definition of Osborn (Reference Osborn1980) postulates a linear relationship between the buoyancy flux and the turbulent dissipation rate in a quasi-steady state of fully developed turbulent flow, with $\unicode[STIX]{x1D6E4}$ as the constant of proportionality. However, since we are considering flows where the buoyancy flux may well have a significant reversible component associated with internal waves, we believe it is more appropriate to define $\unicode[STIX]{x1D6E4}$ in terms of the ratio between $\unicode[STIX]{x1D712}$ and $\unicode[STIX]{x1D700}$, so that
 $$\begin{eqnarray}\unicode[STIX]{x1D6E4}:=\frac{\unicode[STIX]{x1D712}}{\unicode[STIX]{x1D700}}=\frac{\unicode[STIX]{x1D702}}{1-\unicode[STIX]{x1D702}}.\end{eqnarray}$$
 Recent stratified turbulence studies by Maffioli et al. (Reference Maffioli, Brethouwer and Lindborg2016) and Garanaik & Venayagamoorthy (Reference Garanaik and Venayagamoorthy2019) have derived scalings for such a defined  $\unicode[STIX]{x1D6E4}$ in terms of the turbulent Froude number
 $$\begin{eqnarray}Fr:=\frac{\unicode[STIX]{x1D700}}{{Ri_{0}}^{1/2}E_{K}}.\end{eqnarray}$$
 In the strongly stratified regime associated with  $Fr\ll O(1)$ the scalings and associated simulations suggest that $\unicode[STIX]{x1D6E4}$ is independent of $Fr$. Although this might be thought to provide some justification for the use of a constant $\unicode[STIX]{x1D6E4}$ to infer mixing in geophysical flows, there is most definitely no consensus in the fluid dynamical community as to what value $\unicode[STIX]{x1D6E4}$ takes in this regime, the region of validity of the regime or indeed the variability of $\unicode[STIX]{x1D6E4}$ outside of this regime.
In particular, there is an alternative approach to parameterisation based around the argument that the appropriate parameter to use is the buoyancy Reynolds number
 $$\begin{eqnarray}Re_{b}:=\frac{\unicode[STIX]{x1D700}Re}{Ri_{0}}\end{eqnarray}$$
 (see for example Monismith, Koseff & White Reference Monismith, Koseff and White2018), which can be considered to quantify how ‘energetic’ the turbulence is. Monismith et al. (Reference Monismith, Koseff and White2018) present data from numerical simulations and energetic near-shore flow observations that suggest the mixing efficiency scales as  $\unicode[STIX]{x1D702}\sim Re_{b}^{-1/2}$ when the flow is ‘energetic’, which may also loosely be thought of as being weakly stratified, defined as $Re_{b}>O(100)$.
Monismith et al. (Reference Monismith, Koseff and White2018) still support the hypothesis that  $\unicode[STIX]{x1D6E4}$ is constant in strongly stratified flows with $Re_{b}<O(100)$, taking an approximate value of 0.2, although we caution associating smaller values of $Re_{b}$ with ‘strong’ stratification, as smaller values of $Re_{b}$ should really be considered to be associated with flows which are viscously dominated, or at least viscously affected. Gregg et al. (Reference Gregg, D’Asaro, Riley and Kunze2018) also argue in favour of using the estimate $\unicode[STIX]{x1D6E4}\simeq 0.2$ which dates back to the early parameterisation of Osborn (Reference Osborn1980). They, however, caution the use of $Re_{b}$ as a sole parameter for the functional dependence of $\unicode[STIX]{x1D6E4}$, and note that the turbulence produced by internal waves typically has $Re_{b}\lesssim 200$, where $\unicode[STIX]{x1D6E4}$ is thought to be constant. Indeed, it is not at all clear at the moment whether the independence of $\unicode[STIX]{x1D6E4}$ with respect to $Fr$ when $Fr\ll 1$ is in any way associated with the classic empirically useful estimate that $\unicode[STIX]{x1D6E4}\simeq 0.2$, not least because it is exceptionally computationally challenging to consider flows with $Fr\ll 1$ and larger values of $Re_{b}$.
Since we are primarily concerned with internal wave-driven mixing in the open ocean, we choose to focus on ‘strongly stratified’ flows associated with  $Fr\ll O(1)$, rather than classifying flows in terms of $Re_{b}$. Even in this regime, there are still discrepancies in the value of $\unicode[STIX]{x1D6E4}$ between observations and numerical simulations. Maffioli et al. (Reference Maffioli, Brethouwer and Lindborg2016) find a trend towards the constant value of $\unicode[STIX]{x1D6E4}=0.33$ from their simulations of forced stratified turbulence, and simulations of decaying stratified turbulence by de Bruyn Kops & Riley (Reference de Bruyn Kops and Riley2019) have shown sustained values of $\unicode[STIX]{x1D6E4}$ as large as 0.54. Understanding how these discrepancies may arise is vital if we hope to relate these numerical studies to observed mixing in the ocean.
One issue in comparing observations with these scaling arguments is that  $Fr$ is rarely recorded and requires simultaneous measurement of multiple turbulent quantities. Observationally it is easier to obtain the fundamental length scales named after Ellison and Ozmidov, defined as
 $$\begin{eqnarray}L_{E}:=\frac{{\unicode[STIX]{x1D70C}^{\ast }}_{rms}}{|\unicode[STIX]{x2202}\overline{\unicode[STIX]{x1D70C}^{\ast }}/\unicode[STIX]{x2202}z|},\quad L_{O}:=\left(\frac{\unicode[STIX]{x1D700}}{N^{3}}\right)^{1/2}.\end{eqnarray}$$
 For example, Ivey, Bluteau & Jones (Reference Ivey, Bluteau and Jones2018) use a mixing length model to infer diapycnal diffusivity from  $L_{E}$ and the mean shear measured by moorings. They find good agreement with microstructure measurements, but it is unclear whether this estimate would work well in regions where the background state is dominated by the internal wave spectrum rather than a mean shear. Ivey & Imberger (Reference Ivey and Imberger1991) use $L_{E}/L_{O}$ more generally to infer $Fr$, and therefore determine whether a flow is strongly turbulent or significantly affected by stratification. Many observational studies, however, assume that these length scales are approximately equal, as originally postulated by Dillon (Reference Dillon1982), based on limited experimental data and due to restrictions in measurement equipment. A detailed comparison of these length scales in the thermocline can be found in Moum (Reference Moum1996).
3 Numerical simulations
We use the Diablo software (Taylor Reference Taylor2008) to perform three-dimensional numerical simulations of (2.1)–(2.3). The software implements pseudo-spectral methods to calculate spatial derivatives and a third-order Runge–Kutta scheme for time stepping. The equations are solved in a cubic domain of length  $2\unicode[STIX]{x03C0}$ represented by a uniformly spaced grid of $1024^{3}$ points. A 2/3 rule is applied for dealiasing the calculation of nonlinear terms. Periodic boundary conditions are applied in every direction to the velocity and density fields $\boldsymbol{u}$ and $\unicode[STIX]{x1D70C}$. Recall that $\unicode[STIX]{x1D70C}$ represents the density perturbation so periodicity in the vertical does not contradict our use of a stable background density gradient. Table 1 summarises the input parameters used across all simulations.
Input parameters for the numerical simulations.

Motivated by the existence of a background internal wave field in the ocean, we construct the initial condition for the simulations as follows. Computational constraints mean that we cannot resolve the range of scales required to represent a full Garrett–Munk spectrum in our domain. We therefore take an approach similar to that of Furue (Reference Furue2003) to construct an initial state where the large scales of the flow field are representative of the small-scale portion of the GM spectrum as defined by Munk (Reference Munk, Warren and Wunsch1981). To obtain the desired vertical energy spectrum of  $E\sim m^{-2}$ we need to account for waves with horizontal wavelengths larger than the domain. Furue (Reference Furue2003) achieves this by integrating the GM spectrum over small horizontal wavenumbers to obtain a shear flow containing all of the ‘missed’ energy. We simply define the initial shear as a sum of shear modes $\boldsymbol{u}_{0}\sim (A/m)\text{e}^{\text{i}mz}$ that give an energy spectrum of $m^{-2}$. The shear modes are large scale in the domain and are thus limited to $m\leqslant m_{c}=7$. Each shear mode is randomly phased, and the total energy in this component is normalised such that the mean gradient Richardson number $Ri_{g}=Ri_{0}/\langle S^{2}\rangle$ is equal to $Ri_{0}$. Here $S^{2}=(\unicode[STIX]{x2202}u/\unicode[STIX]{x2202}z)^{2}+(\unicode[STIX]{x2202}v/\unicode[STIX]{x2202}z)^{2}$ is the dimensionless squared shear, and $\langle \cdot \rangle$ denotes a volume average (simply equivalent to a vertical average in this case). The shear component is complemented by a collection of randomly phased internal waves that satisfy the three-dimensional GM energy spectrum $E(\boldsymbol{k})$ defined in Furue (Reference Furue2003). These waves contribute 10 % of the initial energy and are non-zero for $|\boldsymbol{k}|\leqslant 7$.
We numerically integrate the system for approximately 20 time units without body forcing to allow the initial transient dynamics to dissipate, and for the associated dissipation rate to reach its maximum value. From this state we perform three simulations, each with a different form of body forcing applied. All three types of forcing can be expressed as
 $$\begin{eqnarray}\boldsymbol{F}_{\boldsymbol{u}}=\mathop{\sum }_{\substack{ 2.5\leqslant |\boldsymbol{k}|\leqslant 3.5 \\ \unicode[STIX]{x1D705}\neq 0}}\widetilde{\boldsymbol{F}_{\boldsymbol{u}}}(\boldsymbol{k})\text{e}^{\text{i}\boldsymbol{k}\boldsymbol{\cdot }\boldsymbol{x}},\quad F_{\unicode[STIX]{x1D70C}}=\mathop{\sum }_{\substack{ 2.5\leqslant |\boldsymbol{k}|\leqslant 3.5 \\ \unicode[STIX]{x1D705}\neq 0}}\widetilde{F_{\unicode[STIX]{x1D70C}}}(\boldsymbol{k})\text{e}^{\text{i}\boldsymbol{k}\boldsymbol{\cdot }\boldsymbol{x}},\end{eqnarray}$$
 where  $\boldsymbol{k}=(k,l,m)$ is the wave vector and $\unicode[STIX]{x1D705}=\sqrt{k^{2}+l^{2}}$ is the horizontal wavenumber.
The first type of forcing we consider is that used by Maffioli (Reference Maffioli2017). We refer to this forcing as case H since the forcing acts purely on the horizontal components of velocity and therefore  $F_{w}=F_{\unicode[STIX]{x1D70C}}=0$. Forcing H is representative of vertically uniform ‘vortical modes’ with $(\widetilde{F_{u}},\widetilde{F_{v}})\propto (l,-k)$ and the modes being non-zero only when $m=0$. Each mode is randomly phased at every time step.
The other two types of forcing are intended to be representative of flows induced by internal gravity waves, with the forcing components satisfying the internal wave polarisation relations
 $$\begin{eqnarray}(\widetilde{F_{u}},\widetilde{F_{v}})={\mathcal{A}}\frac{(k,l)m}{\unicode[STIX]{x1D705}|\boldsymbol{k}|},\quad \widetilde{F_{w}}=-{\mathcal{A}}\frac{\unicode[STIX]{x1D705}}{|\boldsymbol{k}|},\quad \widetilde{F_{\unicode[STIX]{x1D70C}}}={\mathcal{A}}\frac{i}{{Ri_{0}}^{1/2}}.\end{eqnarray}$$
 We denote one variant of this forcing as case R where the phase of the complex amplitude  ${\mathcal{A}}$ for each mode is chosen randomly at every time step. The final type of forcing represents energy input from a propagating wave field and we refer to it as case P. In this case the phase of each ${\mathcal{A}}$ is shifted at time $t$ by $-\unicode[STIX]{x1D714}t$ where the frequency $\unicode[STIX]{x1D714}$ is determined by the linear internal gravity wave dispersion relation, which in our non-dimensionalisation is given by
 $$\begin{eqnarray}\unicode[STIX]{x1D714}=\frac{Ri_{0}^{1/2}\unicode[STIX]{x1D705}}{|\boldsymbol{k}|}.\end{eqnarray}$$
 To ensure that the dissipation rates are comparable across the simulations, we enforce the total energy input rate  $P_{K}+P_{P}$ to be constant. We normalise the amplitude of the forcing at each time step to achieve the constant energy input rate shown in table 1. We also use the ‘constant power minimal forcing’ method from Maffioli (Reference Maffioli2017) to avoid large artificial energy inputs arising from discrete time stepping. Each simulation is run for a total of 150 time units.
4 Results
4.1 Flow structure
After the initial transient dynamics and a further adjustment period in each case that lasts until  $t\approx 50$, the turbulence characterised by $E_{K}$ and $E_{P}$ reaches a quasi-steady state. Table 2 details turbulent quantities calculated for these quasi-steady regimes. The values highlight a key difference between the horizontally forced simulation (case H) and the wave-forced simulations (case R and case P). The turbulent potential energy $E_{P}$ is much larger in the wave-forced cases than in case H, and this coincides with a reduction in the TKE dissipation rate $\unicode[STIX]{x1D716}$. The value of $\unicode[STIX]{x1D712}$ is remarkably consistent across the simulations, resulting in a larger value of $\unicode[STIX]{x1D6E4}$ that is associated with more efficient mixing in cases R and P. All simulations exhibit values of the turbulent Froude number $Fr$ that suggest the flow is in a stratification-dominated regime, i.e. $Fr\ll 1$.
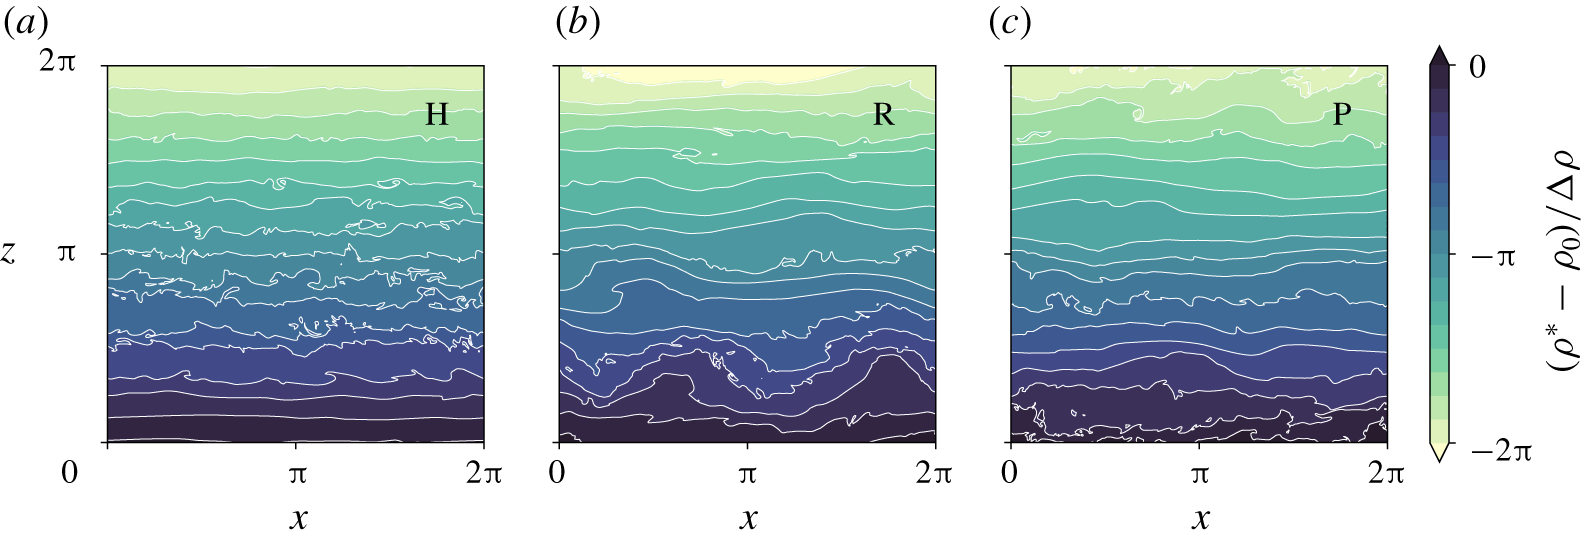
Snapshots in the  $x{-}z$ plane at the midpoint of the computational domain of the total density field $(\unicode[STIX]{x1D70C}^{\ast }-\unicode[STIX]{x1D70C}_{0})/\unicode[STIX]{x0394}\unicode[STIX]{x1D70C}$ at $t=150$ for flows forced by: (a) horizontal motions (case H); (b) internal waves with random phases (case R); (c) propagating internal waves (case P).
Volume-averaged quantities as defined in § 2 further averaged in time for  $t>50$ for each numerical simulation. Note that the volume-averaged buoyancy Reynolds number is given by $Re_{b}=\unicode[STIX]{x1D700}\times 10^{4}$ when using the chosen non-dimensionalisation.
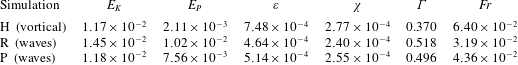
Figure 2 shows contours of the density field in the vertical plane  $y=0$ at the final time of each simulation. These provide visual evidence of the qualitative difference between the wave-forced and horizontally forced flows. In case H we observe mostly flat isopycnals except where there are small-scale overturns in the centre of the domain suggestive of localised shear-driven mixing. This contrasts with the wave-forced cases where we observe large vertical displacement of the isopycnals throughout the domain. Regions of statically unstable stratification typically occur through larger-scale overturnings than in case H, suggesting (perhaps unsurprisingly) that convective mechanisms may be more important for mixing in the wave-forced regime.
4.2 Volume-averaged quantities
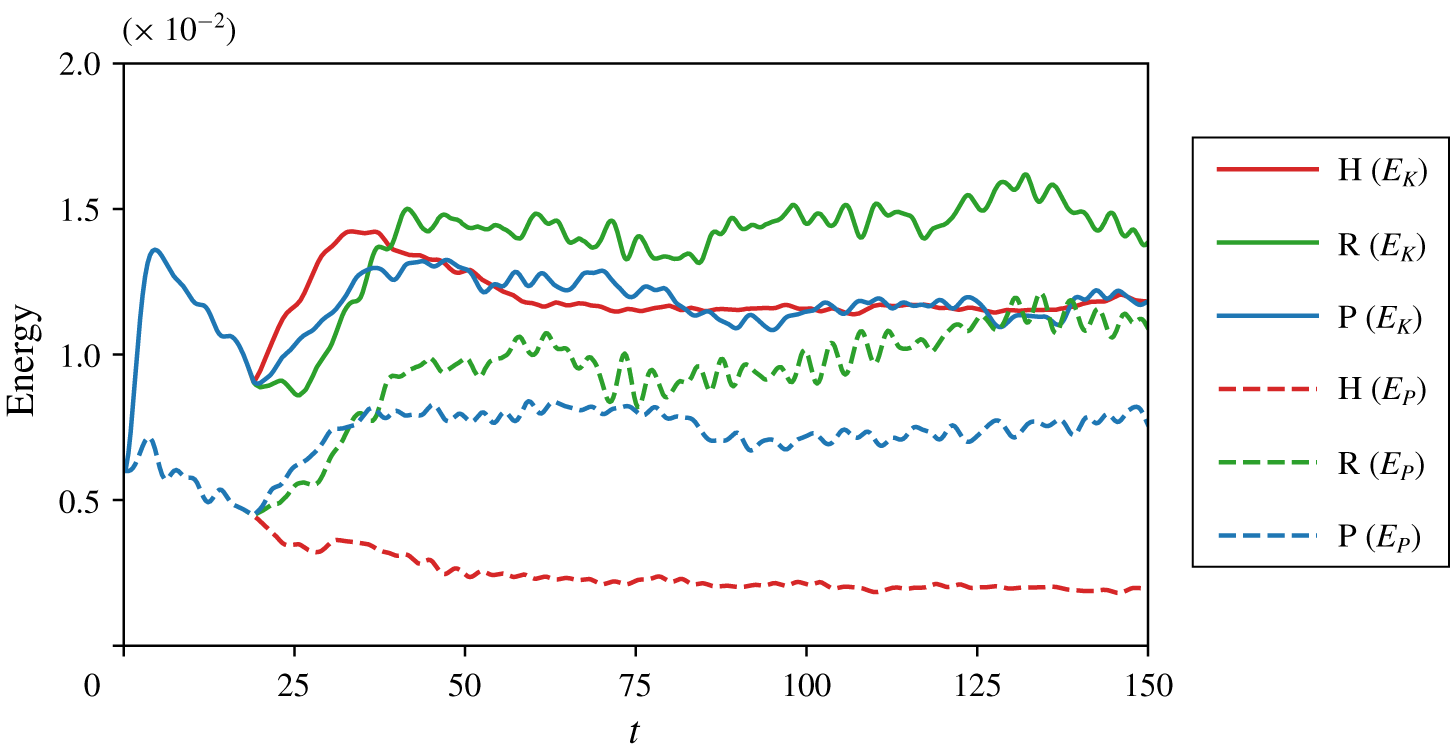
Evolution with time of the volume-averaged kinetic energy  $E_{K}$ (solid line) and potential energy $E_{P}$ (dashed line) for the simulations with: case H forcing (red lines); case R forcing (green lines); and case P forcing (blue lines).
Variation with time (after  $t=20$ when the forcing is switched on) of cumulative (time-integrated) budget terms from the kinetic energy budget (a–c) and the potential energy budget (d–f) as defined in (2.10)–(2.13) for the simulations associated with: (a,d) case H; (b,e) case R; and (c,f) case P.
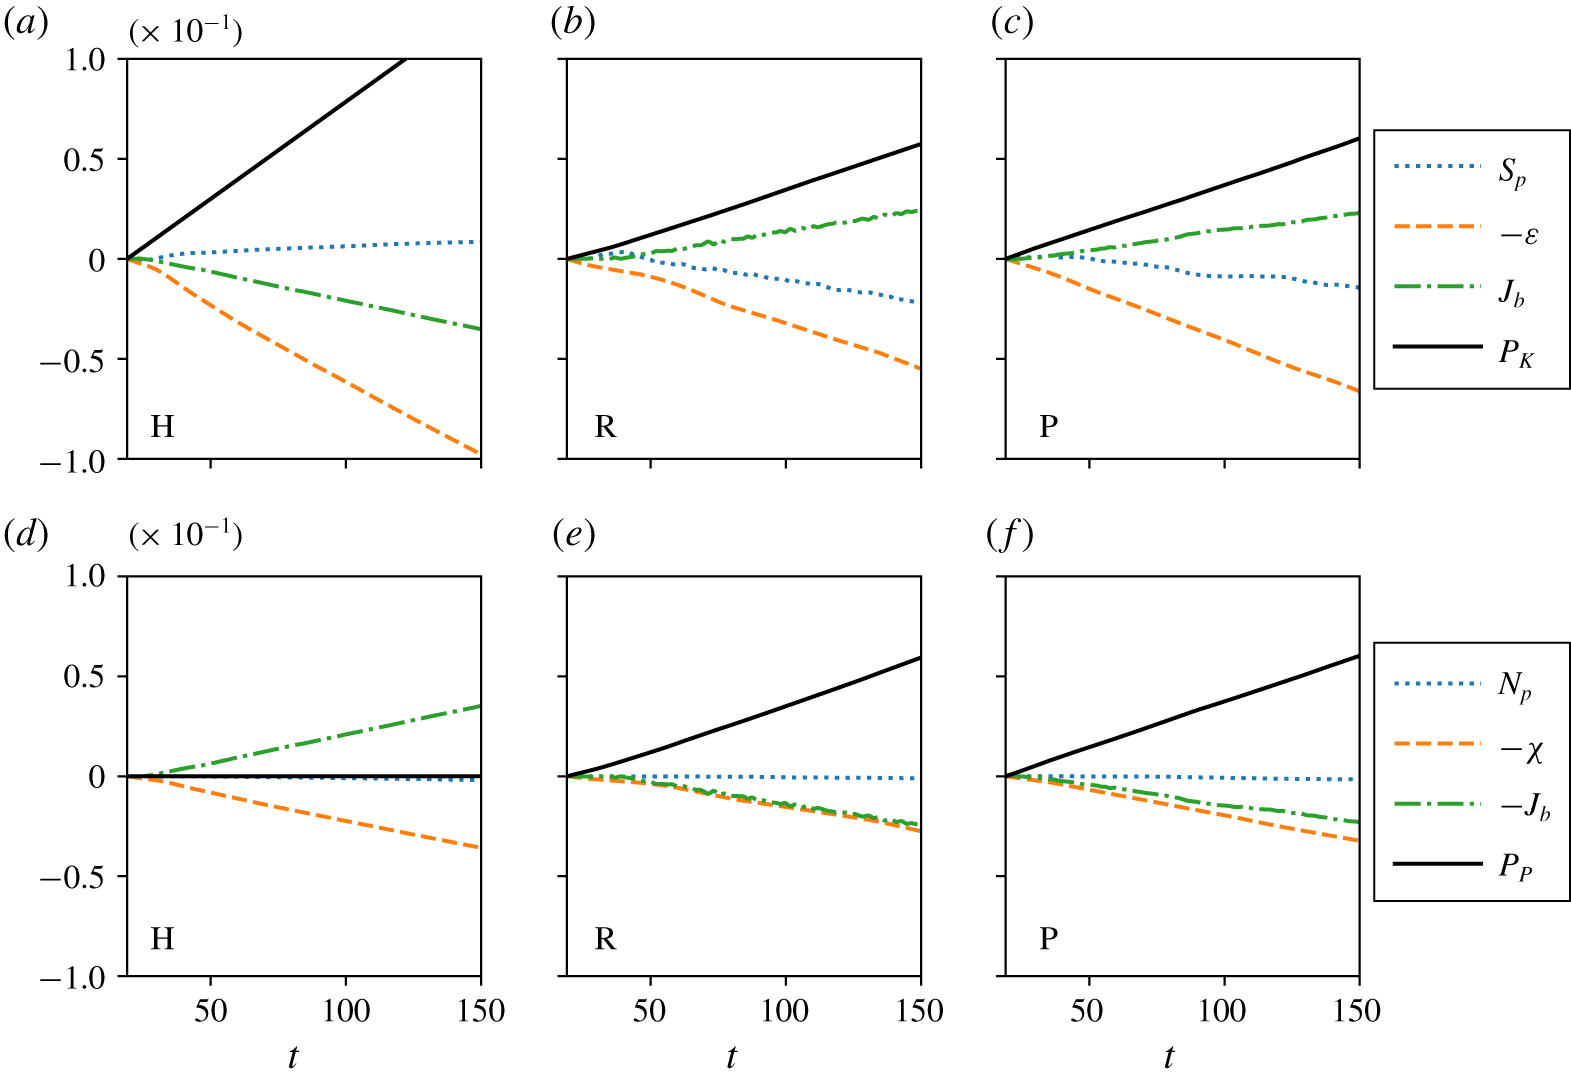
Figure 3 shows time series of the turbulent energy quantities  $E_{K}$ and $E_{P}$ from each simulation. The energy time series for cases R and P (green and blue lines) exhibit prominent oscillations that are absent in case H (red lines). These oscillations can be attributed to internal waves exchanging energy between the kinetic and potential reservoirs. Since this oscillating buoyancy flux dominates the turbulent energy budgets (2.8) and (2.9), we consider the cumulative effect of each term in the energy budget rather than their instantaneous values. Figure 4 plots these cumulative (i.e. time-integrated) contributions over the period $t>20$, when forcing is active in each simulation. This figure reveals another key difference between case H and the wave-forced cases R and P. The buoyancy flux $J_{b}$ in case H is negative and acts to transfer energy from kinetic energy to potential energy. This is in some sense inevitable as the buoyancy flux must balance the dissipation $\unicode[STIX]{x1D712}$ in the potential energy budget. In contrast, cases R and P have a positive mean buoyancy flux acting to transfer energy from the potential energy to the kinetic energy. This different energy pathway is consistent with the significant influence of the convective overturning apparent in figures 2(b) and 2(c). Locally these large overturns contain excess potential energy that is transferred to kinetic energy as the locally unstable density gradient drives a flow.
Figure 5(a) shows time series for the dissipation rates of kinetic energy (i.e.  $\unicode[STIX]{x1D700}$) and potential energy (i.e. $\unicode[STIX]{x1D712}$) for the various simulations. As noted before, the late-time value of $\unicode[STIX]{x1D712}$ is similar for all three simulations, whereas the value of $\unicode[STIX]{x1D700}$ is lower in the wave-forced cases R and P than in the horizontally forced case H. This leads to a higher mixing efficiency $\unicode[STIX]{x1D702}$ and mixing coefficient $\unicode[STIX]{x1D6E4}$ in the simulations R and P, as shown by the time series in figure 5(b).
Variation with time of: (a) the turbulent dissipation rates  $\unicode[STIX]{x1D700}$ (solid lines) and $\unicode[STIX]{x1D712}$ (dashed lines); (b) instantaneous mixing coefficient $\unicode[STIX]{x1D6E4}=\unicode[STIX]{x1D712}/\unicode[STIX]{x1D700}$ for: case H (red lines); case R (green lines); case P (blue lines).

We recall that the total energy input rate due to the forcing is set to  $P_{K}+P_{P}=10^{-3}$, and so in a steady state we expect the total turbulent dissipation $\unicode[STIX]{x1D700}+\unicode[STIX]{x1D712}$ to equal this value as well. The differing values of $\unicode[STIX]{x1D700}$ between the wave-forced cases and case H actually mean that the total dissipation is greater than the total energy input for simulation H, whereas the opposite is true for simulations R and P. This difference is related to how the waves and turbulence interact with the horizontally averaged mean flow. By inspecting the time series of the cumulative shear production $S_{p}$ in figures 4(a)–4(c), we find that energy is extracted from the mean flow in case H. Conversely in the wave-forced flows, the mean flow extracts energy from the perturbation fields. Therefore, despite the turbulence characterised by $E_{K}$ and $E_{P}$ being in a quasi-steady state, the mean flow is not. The kinetic energy of the mean flow $\overline{E_{K}}$ changes by approximately 10 % in each simulation, but remains at least 5 times greater than the energy in the perturbation field.
4.3 Spatial variation
Thus far we have relied on volume-averaged quantities to describe the flows that develop in our simulations. To investigate how localised processes may lead to the different pathways in the energy budget, we now consider how mixing properties vary throughout our domain. We can define local and horizontally averaged measures of the TKE dissipation rate as
 $$\begin{eqnarray}\unicode[STIX]{x1D700}_{L}(\boldsymbol{x},t)=\frac{1}{Re}\frac{\unicode[STIX]{x2202}{u_{i}}^{\prime }}{\unicode[STIX]{x2202}x_{j}}\frac{\unicode[STIX]{x2202}{u_{i}}^{\prime }}{\unicode[STIX]{x2202}x_{j}},\quad \unicode[STIX]{x1D700}_{H}(z,t)=\overline{\unicode[STIX]{x1D700}_{L}}=\frac{1}{L_{x}L_{y}}\int _{0}^{L_{x}}\int _{0}^{L_{y}}\unicode[STIX]{x1D700}_{L}\,\text{d}x\,\text{d}y.\end{eqnarray}$$
 The dissipation rate  $\unicode[STIX]{x1D700}$ as defined in (2.10) is simply the volume average of $\unicode[STIX]{x1D700}_{L}$. Figure 6(a) shows a vertical plane snapshot of the local dissipation rate $\unicode[STIX]{x1D700}_{L}$ for the flow with case P forcing at $t\approx 150$. Throughout the domain $\unicode[STIX]{x1D700}_{L}$ varies by three orders of magnitude, with strongest variation in the vertical direction. Highly turbulent layers with significant small-scale structure lie between more quiescent regions where $\unicode[STIX]{x1D700}_{L}$ drops below $10^{-4}$. Figure 6(b) shows the spatio-temporal evolution of the horizontally averaged dissipation rate $\unicode[STIX]{x1D700}_{H}(z,t)$ and shows that these turbulent layers persist throughout the quasi-steady forced regime. The vertical profiles of $\unicode[STIX]{x1D700}_{H}(z,t)$ also differ significantly between the simulations with different forcings as shown by figure 6(c). This highlights how important the particular type of large-scale forcing is in modifying how turbulence arises and is sustained in the flow.
(a) Snapshot in the  $x{-}z$ plane at the midpoint of the computational domain at final time $t=150$ of the local TKE dissipation rate $\unicode[STIX]{x1D700}_{L}(\boldsymbol{x},t)$. (b) Time variation of the horizontally averaged $\unicode[STIX]{x1D700}_{H}(z,t)$ for simulation P. (c) Vertical variation of $\unicode[STIX]{x1D700}_{H}(z,t)$ at final time $t=150$ for the simulations associated with: case H (dashed red line); case R (dotted green line); and case P (solid blue line).

The large range of  $\unicode[STIX]{x1D700}_{H}$ allows us to investigate correlations between quantities related to mixing across several orders of magnitude. We are particularly interested in spatio-temporal correlations between the dissipation rates of kinetic energy and density variance, and how these correlations may explain the high volume-averaged efficiency observed in the wave-forced simulations. Figure 7 shows the two-dimensional probability density function (p.d.f.) of $\unicode[STIX]{x1D700}_{H}(z,t)$ and the analogous term $\unicode[STIX]{x1D712}_{H}(z,t)$, the horizontally averaged potential energy dissipation rate, for the quasi-steady states of each simulation. Each p.d.f. is constructed from a two-dimensional (2-D) histogram of $\log _{10}\unicode[STIX]{x1D700}_{H}$ and $\log _{10}\unicode[STIX]{x1D712}_{H}$ with bins of size 1/64. Strikingly, these plots show that $\unicode[STIX]{x1D6E4}$ calculated from volume averages accurately describes the relationship between $\unicode[STIX]{x1D700}_{H}$ and $\unicode[STIX]{x1D712}_{H}$ over at least two orders of magnitude. All three simulations in fact have a Pearson correlation coefficient greater than $r=0.9$ for $\unicode[STIX]{x1D700}_{H}$ and $\unicode[STIX]{x1D712}_{H}$. Although the dissipation rates in more turbulent regions (in the sense of being associated with larger values of $\unicode[STIX]{x1D700}_{H}$) are the dominant contribution to $\unicode[STIX]{x1D6E4}$, these results show that the difference in $\unicode[STIX]{x1D6E4}$ across the simulations is not solely due to changes in these (more turbulent) regions. The p.d.f.s in figure 7 instead show that the wave-forced cases also exhibit a higher value of $\unicode[STIX]{x1D6E4}_{H}:=\unicode[STIX]{x1D712}_{H}/\unicode[STIX]{x1D700}_{H}$ in the less energetic (and hence lower local dissipation rate) regions of the flow.
Two-dimensional p.d.f. of horizontally averaged dissipation rates  $\unicode[STIX]{x1D700}_{H}$ and $\unicode[STIX]{x1D712}_{H}$ calculated at each output time for $t>50$. The two dotted lines on each panel mark values of $\unicode[STIX]{x1D6E4}=0.1$ and $\unicode[STIX]{x1D6E4}=1$, and the blue dashed lines show the volume-averaged value of $\unicode[STIX]{x1D6E4}$ for each simulation from table 2. Panel (a) shows data from the case H simulation, panel (b) shows data from the case R simulation and panel (c) shows data from the case P simulation.

Figure 8 further highlights this distinction by showing the analogous 2-D p.d.f. of the turbulent Froude number and appropriately horizontally averaged flux coefficient  $\unicode[STIX]{x1D6E4}_{H}$. Since we are considering horizontally averaged quantities, the definition of the Froude number is modified from (2.17) to account for the (in practice) small changes in the mean density profile to yield
 $$\begin{eqnarray}Fr_{H}(z,t)=\frac{2\unicode[STIX]{x1D700}_{H}}{{Ri_{0}}^{1/2}\left(1-{\displaystyle \frac{\unicode[STIX]{x2202}\overline{\unicode[STIX]{x1D70C}}}{\unicode[STIX]{x2202}z}}\right)^{1/2}\overline{\boldsymbol{u}^{\prime }\boldsymbol{\cdot }\boldsymbol{u}^{\prime }}}.\end{eqnarray}$$
 Figure 8 shows that all three flows can be considered as low  $Fr$ at all heights in the domain, with each simulation having a maximum $Fr_{H}$ of approximately 0.1. We therefore expect no dependence of $\unicode[STIX]{x1D6E4}_{H}$ on $Fr_{H}$ based on the scaling arguments of Maffioli et al. (Reference Maffioli, Brethouwer and Lindborg2016). Figures 8(b) and 8(c) show this behaviour clearly for the two wave-forced cases R and P, where the p.d.f. spreads evenly around the mean value. The limited range of $Fr_{H}$ in case H makes it difficult to draw conclusions about $\unicode[STIX]{x1D6E4}{-}Fr$ scaling from figure 8(a). The tilted, intense cluster of points near $Fr=10^{-1}$ is, however, suggestive of a negative correlation between $\unicode[STIX]{x1D6E4}$ and $Fr_{H}$ in the more turbulent parts of the domain.
Two-dimensional p.d.f. of  $Fr_{H}$ and $\unicode[STIX]{x1D6E4}_{H}$ calculated from horizontally averaged quantities for $t>50$. Panel (a) shows data from the case H simulation, panel (b) shows data from the case R simulation and panel (c) shows data from the case P simulation.

Two-dimensional p.d.f. of  $\unicode[STIX]{x1D712}_{L}$ and $\unicode[STIX]{x1D700}_{L}$ calculated locally at every grid point of a final-time $t=150$ snapshot for each simulation: (a) case H; (b) case R, (c) case P. Dotted lines highlight values of $\unicode[STIX]{x1D6E4}=0.1$ and $\unicode[STIX]{x1D6E4}=1$, and blue dashed lines show the mean value of $\unicode[STIX]{x1D6E4}$ as in figure 7.

We can extend our approach of investigating localised correlations in the domain by considering relationships between quantities calculated locally at each grid point. A single-time snapshot provides more than  $10^{9}$ data points for each variable in this approach, so we use the full 3-D flow fields at the final time $t=150$ as an example to investigate local correlations in each simulation. Figure 9 shows the 2-D p.d.f. of $\unicode[STIX]{x1D700}_{L}$ (as defined in (4.1)) and the analogous term $\unicode[STIX]{x1D712}_{L}$ calculated from the final-time snapshots associated with each simulation. The p.d.f. is constructed by the same method as for figure 7, using a histogram of the logarithms of each quantity. The positive correlation between $\unicode[STIX]{x1D700}_{L}$ and $\unicode[STIX]{x1D712}_{L}$ is still evident in these plots, although all three cases have larger departures from the volume average than in figure 7. In the horizontally forced (case H) simulation, with data plotted in figure 9(a), there is a relatively uniform spread in the p.d.f. along lines of constant $\unicode[STIX]{x1D6E4}$. When compared to figure 7(a) where the p.d.f. clusters at higher values of $\unicode[STIX]{x1D700}_{H}$ and $\unicode[STIX]{x1D712}_{H}$, this indicates that the horizontally averaged quantities are dominated by contributions from highly turbulent locations (associated with larger values of $\unicode[STIX]{x1D700}_{L}$ and $\unicode[STIX]{x1D712}_{L}$) within each horizontal plane. The wave-forced cases R and P also exhibit this behaviour, with figures 9(b) and 9(c) highlighting a peak at low dissipation rates that is absent from the horizontal averages.
Two-dimensional p.d.f. of  $\unicode[STIX]{x1D6E4}_{L}$ and $Fr_{L}$ calculated locally from the same final-time $t=150$ snapshots as figure 9 for each simulation: (a) case H; (b) case R, (c) case P. Blue dashed lines are as in figure 8, and the black dotted lines show the scaling $\unicode[STIX]{x1D6E4}\sim Fr^{-1}$.

We also investigate how local correlations between  $\unicode[STIX]{x1D6E4}$ and $Fr$ lead to the scalings observed in figure 8. Since the turbulent Froude number is not well defined in the case of statically unstable stratification, we choose to keep the mean density gradient in our local definition of a turbulent Froude number
 $$\begin{eqnarray}Fr_{L}(\boldsymbol{x},t)=\frac{2\unicode[STIX]{x1D700}_{L}}{{Ri_{0}}^{1/2}\left(1-{\displaystyle \frac{\unicode[STIX]{x2202}\overline{\unicode[STIX]{x1D70C}}}{\unicode[STIX]{x2202}z}}\right)^{1/2}\boldsymbol{u}^{\prime }\boldsymbol{\cdot }\boldsymbol{u}^{\prime }}.\end{eqnarray}$$
 This is also appropriate on physical grounds, when the Froude number is interpreted as a ratio of time scales associated with the turbulence, which can conceivably vary substantially locally, and the time scale associated with the density stratification, which should be determined by a global measure of the ‘background’ buoyancy frequency. Figure 10 plots the 2-D p.d.f. of  $Fr_{L}$ defined in this way and the local value of the mixing coefficient $\unicode[STIX]{x1D6E4}_{L}:=\unicode[STIX]{x1D712}_{L}/\unicode[STIX]{x1D700}_{L}$ for each simulation, once again at the final time $t=150$. The difference compared to figure 8 is striking, with a much larger spread in values of $\unicode[STIX]{x1D6E4}$. Specifically, in every simulation there is no indication that the scaling argument $\unicode[STIX]{x1D6E4}\sim Fr^{0}$ holds locally. All three panels of figure 10 are in fact suggestive of an inverse correlation between $\unicode[STIX]{x1D6E4}$ and $Fr$, similar to the scalings suggested by Maffioli et al. (Reference Maffioli, Brethouwer and Lindborg2016) and Garanaik & Venayagamoorthy (Reference Garanaik and Venayagamoorthy2019) for high or at least moderate $Fr$. The statistical nature of the scaling theories involving $Fr$ means that the lack of a clear correlation is not too surprising. Even if the local value of $\unicode[STIX]{x1D6E4}$ was related to some local measure of the Froude number, our use of the mean stratification in the definition of $Fr_{L}$ hinders our ability to capture local correlations in regions with variable density gradients.
4.4 Energy spectra
Even though figures 7 and 8 suggest that intermittency in each simulation does not affect the mixing efficiency, at least to leading order, the spatially inhomogeneous dissipation causes issues when considering energy spectra. In all of the simulations, the existence of relatively quiescent layers (as is particularly apparent in figure 6a) leads to an (at best) moderate volume-averaged buoyancy Reynolds number, in that when using volume-averaged dissipation rate  $\unicode[STIX]{x1D700}$, $Re_{b}<10$ for all three cases. The buoyancy Reynolds number may be interpreted as a measure of the size of the inertial range expected between the Ozmidov wavenumber $m_{O}:=(N^{3}/\unicode[STIX]{x1D700})^{1/2}$ and the Kolmogorov wavenumber $m_{K}:=(\unicode[STIX]{x1D700}/\unicode[STIX]{x1D708}^{3})^{1/4}$, since $Re_{b}\equiv (m_{K}/m_{O})^{4/3}$. This leads to a lack of information in the vertical wavenumber energy spectrum. For example, energy associated with a particular wavenumber may represent energy at dissipation scales in one part of the domain, but energy in turbulent eddies elsewhere. Figures 11(a) and 11(b) plot the compensated energy spectra of every simulation for horizontal wavenumber $\unicode[STIX]{x1D705}$ and vertical wavenumber $m$ respectively. Both energy spectra show a roll-off above wavenumber 50 consistent with the ‘small-scale spectra’ classified in Maffioli (Reference Maffioli2017). Before this roll-off, the horizontal spectrum in figure 11(a) shows a $E\sim \unicode[STIX]{x1D705}^{-5/3}$ scaling for every energy component of each simulation, consistent with, for example, Brethouwer et al. (Reference Brethouwer, Billant, Lindborg and Chomaz2007). As expected there is a local energy peak at the forcing wavenumber $\unicode[STIX]{x1D705}=3$ in every component except the vertical velocity and density components in case H. The vertical wavenumber spectra in figure 11(b) are compensated with $m^{2}$, although the agreement with this scaling is not clear. In particular the modest value of $Re_{b}$ (and corresponding small dynamic range of scales) combined with significant variability at low wavenumbers make it hard to draw definitive conclusions about the nature of the energy distribution.
One-dimensional compensated energy spectra of the final-time  $t=150$ snapshot of each simulation. Energy components associated with different components are plotted with different line types: $u$ (thick solid lines); $v$ (thin solid lines); $w$ (dotted lines); $\unicode[STIX]{x1D70C}$ (dashed lines), while the data from different simulations are plotted with different colours: case H (red); case R (green); case P (blue). Panel (a) shows the horizontal wavenumber Fourier spectra and (b) the vertical wavenumber Fourier spectra for all datasets. Panel (c) shows the vertical wavenumber ‘high dissipation’ wavelet spectra averaged over heights where $Re_{b,H}(z)>10$ as defined in (4.4) and (d) shows the analogous ‘low dissipation’ spectra for $Re_{b,H}(z)<1$.

We implement continuous wavelet transforms to overcome this challenge, in an attempt to capture the spectral properties of the actively turbulent ‘patches’ within such spatio-temporally intermittent flows. Following Torrence & Compo (Reference Torrence and Compo1998), we use the Morlet wavelet to construct an energy spectrum  $E(m,z)$ of both vertical wavenumber and vertical position. A single ‘high dissipation’ spectrum is obtained by averaging the energy spectrum over heights $z$ for which $Re_{b,H}(z)>10$, where
 $$\begin{eqnarray}Re_{b,H}=\frac{\unicode[STIX]{x1D700}_{H}Re}{Ri_{0}\left(1-{\displaystyle \frac{\unicode[STIX]{x2202}\overline{\unicode[STIX]{x1D70C}}}{\unicode[STIX]{x2202}z}}\right)},\end{eqnarray}$$
 is the buoyancy Reynolds number computed from horizontal averages in an analogous fashion to  $Fr_{H}$ in (4.2). A corresponding ‘low dissipation’ spectrum is obtained by averaging over heights where $Re_{b,H}<1$. Figures 11(c) and 11(d) plot these spectra for each energy component and each simulation. The high $Re_{b}$ spectra show a scaling similar to $m^{-5/3}$ in the wavenumber range of $O(10)$. Combined with the horizontal wavenumber spectrum in figure 11(a), this result is at least consistent with the existence of a local inertial subrange. In every simulation, the energy spectra associated with $Re_{b}<1$ are noticeably steeper than those from regions where $Re_{b}>10$. The steeper ‘low dissipation’ spectra for each simulation all exhibit an approximate $m^{-3}$ scaling in the same $O(10)$ wavenumber range. This scaling is dimensionally consistent with buoyancy-dominated motion where $N^{-1}$ is the dominant time scale.
The different scalings associated with regions of high and low  $Re_{b,H}$ suggest that the stratified turbulence in our simulations may be thought of as spatio-temporally intermittent regions or ‘patches’ of near-isotropic turbulence spaced throughout a more quiescent flow whose dynamics is buoyancy-dominated, analogously to the ‘strongly stratified’ flow considered by Portwood et al. (Reference Portwood, Kops, Taylor, Salehipour and Caulfield2016). The appearance of an $m^{-3}$ scaling in the low $Re_{b}$ spectrum is consistent with the $m^{-3}$ scaling obtained by Maffioli (Reference Maffioli2017) when considering only large horizontal scales. Furthermore, high values of $Re_{b}$ can naturally be associated with smaller-scale motion, as evident in the snapshot of figure 6(a), so the two results appear closely related.
We must, however, be careful when interpreting these spectra, particularly at low wavenumbers. The continuous wavelet transform discretises wavenumber space as
 $$\begin{eqnarray}k_{j}=2^{j/4},\quad j\in \mathbb{N}.\end{eqnarray}$$
 Since we use a pseudospectral method in our simulations, the flow field we resolve is composed entirely of modes at integer wavenumbers. This means that the wavelet spectra are in some sense over-resolved at low wavenumbers, with multiple wavenumbers between the integer values. The scalings at moderate wavenumbers discussed above are in some sense also inconsistent with theoretical predictions. Calculating the Ozmidov wavenumber associated with the (locally) high  $Re_{b,H}$ regions gives a value of $m_{O}\approx 20$, and a corresponding Kolmogorov wavenumber is $m_{K}\approx 200$. However, it is common in experiments of turbulence to observe roll-off associated with dissipation before the Kolmogorov scale (e.g. Pope Reference Pope2000), and even in the ‘high $Re_{b}$’ regions, we expect the limited range of dynamical scales to affect the spectra.
5 Discussion and conclusions
We have performed direct numerical simulations of stratified turbulence sustained by different forms of large-scale body forcing. The simulation of case H implements the horizontal vortical mode forcing prescribed by Maffioli (Reference Maffioli2017) that injects horizontal kinetic energy into randomly phased columnar vortex modes. The other two simulations force a field of resonant internal gravity waves at large scales of our computational domain as motivated by Furue (Reference Furue2003). The simulation of case R randomly phases each wave at every time step, whereas the simulation of case P shifts the phase of each wave according to the dispersion relation for linear internal gravity waves. Each simulation is initialised with a flow dominated by vertically sheared horizontal modes that is motivated by ambient internal waves with large horizontal wavelengths. The forcing is activated after some initial transient behaviour, and after a further adjustment time the turbulence characterised by the perturbations from the horizontal mean reaches a statistically quasi-steady state.
We find that the quasi-steady states in the wave-forced simulations (cases R and P) have significantly more potential energy than the state achieved by the vortical mode forcing in the simulation of case H. This increased potential energy is provided by the direct forcing of the density field in cases R and P. In the simulation of case H, the irreversible mixing, quantified by the dissipation of the perturbation potential energy, must come via a transfer of energy from the TKE to the potential energy through the buoyancy flux. The density forcing in cases R and P allows this energy transfer to reverse, with mixing made possible without a mean transfer from kinetic to potential energy. This reversal in buoyancy flux can be associated with larger overturning, as seen in figure 2, and thus more convective mixing. The wave-forced simulations also exhibit a higher mixing efficiency than the horizontally forced simulation (case H), which is consistent for flows where mixing occurs through convective mechanisms. The vortical mode forcing used in the simulation of case H forces neither the vertical velocity nor the density field, and therefore cannot produce such large-scale convective overturns.
The qualitatively different energy pathways for mixing in each case also coincide with a change in the interaction between the mean shear flow and the perturbations. Whereas the turbulence extracts energy from the mean flow in the simulation for case H, the wave-forced simulations (cases R and P) show a small transfer in energy from the perturbations to the mean flow on average. This small change partially contributes to the reduced value of the TKE dissipation rate  $\unicode[STIX]{x1D700}$ in the wave-forced cases.
The kinetic energy associated with the mean shear is not constant in each case, but varies slowly over time due to the exchange with the perturbation field. In our simulations, the mean shear modes are intended to represent waves at horizontal scales larger than our computational domain. Since the perturbation energy and dissipation rates are statistically quasi-steady, we believe that the small-scale turbulence is still representative of the geophysical flows which motivate us to conduct these idealised simulations. Background shear modes appear in many studies of forced stratified turbulence (Smith & Waleffe Reference Smith and Waleffe2002; Lindborg Reference Lindborg2006; Waite & Bartello Reference Waite and Bartello2006; Brethouwer et al. Reference Brethouwer, Billant, Lindborg and Chomaz2007) and are shown not to impact the turbulent dynamics significantly. Furthermore, a recent study by Fitzgerald & Farrell (Reference Fitzgerald and Farrell2018) shows that the emergence of vertically sheared horizontal flows also occurs in a forced 2-D Boussinesq system. This result suggests that energy increase in the shear modes is due to a wave–mean flow interaction, which may explain why we observe the energy increase in the wave-forced cases but not from the horizontal vortical mode forcing utilised in case H.
In every simulation, the turbulent dissipation organises into quasi-horizontal layers. The vertical location of these layers varies depending on the forcing type, but it is currently unclear what determines the change in vertical structure between the simulations. Initial analysis shows that regions of high dissipation do not simply correlate with local changes in the background shear and stratification, and thus further research is needed to investigate the mechanisms by which these layers form and are sustained. This predominantly vertical variation in the dissipation rate allows us to investigate correlations between the turbulent dissipation rate and the density variance destruction rate over orders of magnitude. Intriguingly, we find that the ratio between the two, a local measure of the coefficient  $\unicode[STIX]{x1D6E4}$, remains close to the volume-averaged ratio in both regions of high and low dissipation. We deduce that the local mixing efficiency is independent of turbulent intermittency below the scale of the forcing, and instead depends predominantly on the type of large-scale forcing implemented. This further supports the notion that the larger overturnings in the wave-forced cases correspond to a fundamentally different (and in some sense ‘convective’) mixing mechanism from that observed in the simulation of case H.
In the wave-forced simulations the dissipation rate  $\unicode[STIX]{x1D700}$ is not correlated with the background stratification, so we also obtain a wide range of values for the horizontally averaged turbulent Froude number $Fr_{H}$ defined in (4.2). This confirms the lack of dependence of $\unicode[STIX]{x1D6E4}$ on $Fr$ in the low- $Fr$ regime for these quasi-steady states. The vortical mode-forced simulation (case H) does not, however, produce such a wide range in $Fr_{H}$. This may be a consequence of the purely horizontal forcing allowing vertical scales to adjust locally, as in the scalings of Billant & Chomaz (Reference Billant and Chomaz2001) where the vertical Froude number $F_{v}$ adjusts to a constant of $O(1)$. Despite the reduced $Fr$ range in case H, there is still at least a hint of $Fr$-dependence for $\unicode[STIX]{x1D6E4}$ in figure 8(a) at the largest values of $Fr_{H}\approx 0.1$. Previous studies (e.g. Lindborg Reference Lindborg2006) have shown that the strongly stratified limit of low $Fr$ requires $Fr\leqslant O(10^{-2})$, suggesting that the observed dependence in case H is outside this regime. The variation in $\unicode[STIX]{x1D6E4}$ is more clearly displayed in figure 12 where, following Garanaik & Venayagamoorthy (Reference Garanaik and Venayagamoorthy2019), henceforth denoted GV19, we plot $\unicode[STIX]{x1D6E4}$ against the length scale ratio $L_{E}/L_{O}$. In particular, we plot these quantities defined in terms of horizontal averages as $\unicode[STIX]{x1D6E4}_{H}=\unicode[STIX]{x1D712}_{H}/\unicode[STIX]{x1D700}_{H}$ and
 $$\begin{eqnarray}\left(\frac{L_{E}}{L_{O}}\right)_{H}=\frac{{Ri_{0}}^{3/4}\overline{\unicode[STIX]{x1D70C}^{\prime 2}}^{1/2}}{{\unicode[STIX]{x1D700}_{H}}^{1/2}(1-\unicode[STIX]{x2202}\overline{\unicode[STIX]{x1D70C}}/\unicode[STIX]{x2202}z)^{1/4}}.\end{eqnarray}$$
 At first the results shown in figure 12(a) for case H appear inconsistent with any of the scalings proposed by GV19, with  $\unicode[STIX]{x1D6E4}\sim (L_{E}/L_{O})^{2}$ for values of $L_{E}/L_{O}$ being $O(1)$. However, this scaling can be reproduced by combining various self-consistent assumptions used in that paper, as follows.
Two-dimensional p.d.f. of  $\unicode[STIX]{x1D6E4}$ and $L_{E}/L_{O}$ calculated from horizontally averaged quantities. Blue dashed lines show the mean value of $\unicode[STIX]{x1D6E4}$ in each case and the black dotted line in (a) plots the $(L_{E}/L_{O})^{2}$ scaling found in (5.5). As before, (a) plots data from case H, (b) plots data from case R, (c) plots data from case P.

Firstly, taking  $Fr=O(1)$, we assume that the turbulent kinetic energy $E_{K}\sim w^{\prime 2}$ and that its dissipation rate is governed by the turbulent time scale $T_{L}=E_{K}/\unicode[STIX]{x1D700}$, such that $\unicode[STIX]{x1D700}\sim w^{\prime 2}/T_{L}$. We then scale the density field by taking $g\unicode[STIX]{x1D70C}_{rms}^{\prime }/\unicode[STIX]{x1D70C}_{0}$ to be a ‘reduced gravity’ acceleration with velocity scale $w^{\prime }$ and time scale $N^{-1}$. Typical vertical displacements are taken to be $z\sim w^{\prime }/N$ so that the potential energy density $E_{P}=g\unicode[STIX]{x1D70C}^{\prime }z/\unicode[STIX]{x1D70C}_{0}\sim w^{\prime 2}$, and its dissipation rate is governed by the buoyancy time scale $N^{-1}$, giving $\unicode[STIX]{x1D712}\sim E_{P}/T\sim w^{\prime 2}N$. These results provide the scalings
 $$\begin{eqnarray}\displaystyle & \displaystyle \unicode[STIX]{x1D6E4}=\frac{\unicode[STIX]{x1D712}}{\unicode[STIX]{x1D700}}\sim \frac{w^{\prime 2}N}{w^{\prime 2}/T_{L}}=NT_{L}, & \displaystyle\end{eqnarray}$$
 $$\begin{eqnarray}\displaystyle & \displaystyle \frac{L_{E}}{L_{O}}=\left(\frac{g\unicode[STIX]{x1D70C}_{rms}^{\prime }}{\unicode[STIX]{x1D70C}_{0}}\right)\unicode[STIX]{x1D700}^{-1/2}N^{-1/2}\sim (w^{\prime }N)\left(\frac{w^{\prime 2}}{T_{L}}\right)^{-1/2}N^{-1/2}=(NT_{L})^{1/2}. & \displaystyle\end{eqnarray}$$
 Recalling that  $NT_{L}=Fr^{-1}$, these scalings become
 $$\begin{eqnarray}\unicode[STIX]{x1D6E4}\sim Fr^{-1},\quad Fr\sim \left(\frac{L_{E}}{L_{O}}\right)^{-2},\end{eqnarray}$$
 and hence at  $Fr=O(1)$, we have
 $$\begin{eqnarray}\unicode[STIX]{x1D6E4}\sim \left(\frac{L_{E}}{L_{O}}\right)^{2}.\end{eqnarray}$$
 We therefore recover the behaviour shown in figure 12(a). GV19 instead find that  $\unicode[STIX]{x1D6E4}\sim Fr^{-1}$ for $Fr=O(1)$, but $Fr\sim (L_{E}/L_{O})^{-2}$ for $Fr<O(1)$. Indeed, the derivation of (5.3) relies only on assumptions that are also applicable in the low $Fr$ regime. We do not believe that combining these scalings is inconsistent, since both rely on the assumptions that the dominant time scale for density-related terms is $N^{-1}$ and the dominant time scale for kinetic energy dissipation is $T_{L}=E_{K}/\unicode[STIX]{x1D700}$, and at $Fr=O(1)$ both of these time scales may affect the dynamics. On the other hand in a flow dominated by internal gravity waves, it is likely that $N^{-1}$ is the dominant time scale for both the velocity and density fields. This is evident in figures 12(b) and 12(c), where the wave-forced cases show $\unicode[STIX]{x1D6E4}_{H}$ to be less dependent on $(L_{E}/L_{O})_{H}$, consistent with the low $Fr$ and high $L_{E}/L_{O}$ regime, and at least conceivably consistent with a flow dominated by internal waves, thus still strongly affected by stratification. The larger mean value of $L_{E}/L_{O}$ in cases R and P can be associated with larger buoyancy excursions, providing further evidence that the wave-forced cases exhibit more convective behaviour. It appears that forcing with vortical modes at the same rate of energy input produces turbulence that can (at least locally) access a higher Froude number regime than the internal wave forcing. The fact that this $Fr=O(1)$ regime does not show the same $L_{E}/L_{O}$ scaling as in GV19 may hinder the ability to infer Froude numbers from observations in this intermediate range. The frequent appearance of $O(1)$ values of $L_{E}/L_{O}$ in observations (e.g. Moum Reference Moum1996) motivates the need for further research into mixing for flows in which $Fr=O(1)$.
The appearance of a  $Fr=O(1)$ scaling in case H could suggest that the difference in volume-averaged $\unicode[STIX]{x1D6E4}$ between the simulations is purely related to a difference in the average Froude number. However, figure 8(a) also shows a region at low values of $Fr_{H}$ where $\unicode[STIX]{x1D6E4}_{H}$ appears independent of $Fr_{H}$ and importantly takes a much lower value than in the wave-forced cases R and P. The results of Maffioli et al. (Reference Maffioli, Brethouwer and Lindborg2016) also show $\unicode[STIX]{x1D6E4}\approx 0.35$ for values of $Fr$ similar to cases R and P but using a forcing scheme with a greater similarity to the forcing scheme used in case H. We are therefore confident that the difference in the large-scale forcing is the primary contributor to the changes in $\unicode[STIX]{x1D6E4}$ between the simulations, rather than a simple dependence on $Fr$. Although all the simulations here exhibit $\unicode[STIX]{x1D6E4}_{H}{-}Fr_{H}$ scalings consistent with the regimes predicted by Maffioli et al. (Reference Maffioli, Brethouwer and Lindborg2016) and GV19, we believe that it is important to understand how different flows lead to scatter around these regimes. To that end, a better understanding of how the local correlations in figures 9 and 10 are distributed would be invaluable. It is not currently clear how the $Fr_{L}$ dependence of $\unicode[STIX]{x1D6E4}_{L}$ shown in figure 10 leads to a global $\unicode[STIX]{x1D6E4}$ that is independent of $Fr$ for $Fr\ll 1$.
Despite the significant differences in the mixing properties between the vortical mode and wave-forced simulations, spectral analysis reveals remarkable similarity between the energy spectra associated with each flow. At moderate wavenumbers of  $O(10)$, each component of the energy spectra appears to follow universal scalings, with wavelet analysis revealing distinct vertical wavenumber scalings between the turbulent and quiescent regions. The emergence of an $m^{-3}$ scaling in the low- $Re_{b}$ portions of the domain is particularly of note, since it is consistent with the energy spectra being determined exclusively by the buoyancy frequency (as discussed for example in § 14.3 of Davidson Reference Davidson2013). Differences in the energy spectra between the three simulations are only noticeable at low wavenumbers associated with the large-scale flow, despite the contrasting mixing efficiencies for each simulation persisting throughout the domains. This emphasises the importance of understanding the larger-scale flow dynamics when inferring small-scale mixing from spectra. With regions of the flows producing an $m^{-3}$ scaling consistent with Billant & Chomaz (Reference Billant and Chomaz2001), but variations in $\unicode[STIX]{x1D6E4}$ associated with the various larger-scale forcing strategies, it appears that the particular form of the larger-scale forcing retains a fundamental imprint on the properties of the small-scale mixing. Therefore, it is at least plausible that mixing events in the ocean could be sensitive to the particular form of the large-scale energy injection, suggesting that generic, ‘unified’ arguments such as those presented by Kunze (Reference Kunze2018) should be treated with caution.
Our results highlight a significant challenge in the measurement and parameterisation of turbulent mixing in the ocean. The turbulent flux coefficient  $\unicode[STIX]{x1D6E4}$, commonly used to infer mixing rates from the TKE dissipation rate, varies by over 30 % depending on the nature of the larger-scale flow, although local estimates of $\unicode[STIX]{x1D6E4}$ can of course vary by much more. Mixing generated by internal gravity waves results in $\unicode[STIX]{x1D6E4}\approx 0.5$, consistent with recent studies of decaying stratified turbulence (de Bruyn Kops & Riley Reference de Bruyn Kops and Riley2019) but above results from numerical studies forcing turbulence through purely horizontal motion (Maffioli et al. Reference Maffioli, Brethouwer and Lindborg2016). This is also far higher than the value 0.2 from Osborn (Reference Osborn1980) typically used in observational studies, and also observed in simulations of statistically steady forced linearly sheared stratified turbulence with high dynamic range (Portwood et al. Reference Portwood, de Bruyn Kops and Caulfield2019). We conjecture that this difference may be associated with the mixing being more appropriately characterised as being ‘convectively driven’ rather than ‘shear instability driven’. This is consistent with previous studies (e.g. Davies Wykes, Hughes & Dalziel Reference Davies Wykes, Hughes and Dalziel2015) that show purely buoyancy-driven flows with non-monotonic stratification can achieve very high values of mixing efficiency. Mixing via shear instabilities often also occurs through a secondary convective instability arising due to the roll-up of the density field in a Kelvin–Helmholtz billow. The larger values of $L_{E}/L_{O}$ in our wave-forced simulations suggest the overturns are larger than from such shear-driven flows, consistent with the idea that the flow is ‘convectively driven’ by ‘breaking’ waves.
When interpreting our results in the context of ocean mixing, some caveats must be addressed. As mentioned in § 1, a significant fraction of mixing in the ocean occurs in surface and bottom boundary layers. The physics determining mixing efficiency in these regions is rather different from the ocean interior, with wind-driven shear and tidal flows as examples of important drivers of turbulence and mixing (Thorpe Reference Thorpe2005).
Furthermore, our simulations are performed with a molecular Prandtl number of 1 for computational efficiency, rather than a typical oceanic value of 7 for a thermally stratified region. Numerical studies of shear instabilities (Smyth, Moum & Caldwell Reference Smyth, Moum and Caldwell2001; Salehipour, Peltier & Mashayek Reference Salehipour, Peltier and Mashayek2015) have shown that higher Prandtl numbers can lead to a significant decrease in the mixing efficiency. This factor may bring our results closer to the value used in oceanographic estimates, but it is unclear how the differences in mixing efficiency between the simulations would change at higher  $Pr$.
$Pr$.
Another issue which needs to be considered is the potential ‘patchiness’ of mixing, with the turbulent mixing in the ocean exhibiting significant spatio-temporal variability. Observational studies that focus on small-scale mixing frequently isolate patches of turbulence for their measurements in intermittent oceanic flows (e.g. Moum Reference Moum1996). Both Smyth et al. (Reference Smyth, Moum and Caldwell2001) and Ijichi & Hibiya (Reference Ijichi and Hibiya2018) produce a  $\unicode[STIX]{x1D6E4}\sim (L_{T}/L_{O})^{4/3}$ scaling from such patches, where $L_{T}$ is the Thorpe scale. The construction of this scaling (see Ijichi & Hibiya (Reference Ijichi and Hibiya2018) for further details) is fundamentally associated with two assumptions consistent with high $Fr$ dynamics, in particular that the characteristic time and length scales are determined from the turbulence properties alone, largely unaffected by the ambient stratification. The first assumption is that the turbulence is largely unaffected by stratification, and using a classical mixing length argument then leads to
 $$\begin{eqnarray}L\sim \frac{E_{K}^{3/2}}{\unicode[STIX]{x1D700}};\quad \unicode[STIX]{x1D705}_{T}\equiv \frac{\unicode[STIX]{x1D6E4}\unicode[STIX]{x1D700}}{N^{2}}\sim E_{K}^{1/2}L.\end{eqnarray}$$
 Here,  $\unicode[STIX]{x1D705}_{T}$ is the turbulent ‘eddy’ diffusivity of density, defined in terms of the ‘mixing length’ $L$ and the characteristic turbulent velocity scale $E_{K}^{1/2}$. The second assumption is that this mixing length $L\sim L_{T}$, leading to $\unicode[STIX]{x1D6E4}\propto (L_{T}/L_{O})^{4/3}$ in patches where the ambient stratification has little effect on the turbulent mixing properties, although it is of course possible that this scaling can be observed in situations where the underlying assumptions are no longer completely justified.
Indeed, the results presented here pose an interesting question of how best to model mixing in a spatio-temporally intermittent flow. The combination of our wavelet analysis and the work of Maffioli (Reference Maffioli2017) suggests that the  $m^{-3}$ portion of the energy spectrum may be associated with larger scales and regions with smaller turbulent dissipation rates. The associated nonlinear buoyancy-dominated flow could be thought to act as a background from which the turbulent patches develop intermittently. Since high $Fr$ flows are associated with lower values of mixing efficiency, it is therefore important to quantify the relative contributions to mixing of these highly energetic isolated patches compared to the total background.
The main differences between our simulations, coinciding with the change in  $\unicode[STIX]{x1D6E4}$, are an increase in the energy component of the vertical velocity and the available potential energy in our simulations. Despite these changes being most significant at large scales in our domain, validation of our results in the field would be difficult. Scales we refer to as large require high resolution equipment to resolve in the ocean: for example if we take a velocity scale of $U_{0}=10^{-2}~\text{m}~\text{s}^{-1}$ and a buoyancy frequency $N_{0}=10^{-2}~\text{s}^{-1}$, then our domain length will be less than 10 m given the $Re$,
$Re$,  $Ri_{0}$ values we have chosen. An investigation of high-resolution measurements of vertical velocity and density fluctuations that coincide with the appearance of an $E\sim m^{-3}$ vertical wavenumber spectrum would be invaluable for determining the nature of flows at these scales. A better understanding of which flows are dominated by convective wave breaking and which mix through primarily horizontal motion or even shear instabilities, would then allow us to constrain mixing estimates better and improve our predictions of spatial patterns in diapycnal transport.
Acknowledgements
We thank A. Mashayek and two anonymous referees for their constructive comments that helped to greatly improve the focus of the manuscript. C.J.H. is supported by the Cambridge Earth System Science NERC DTP (NE/L002507/1). The data and Python scripts used to create the figures are available at https://doi.org/10.17863/CAM.52184, and the DNS code can be found at https://github.com/chowland/diablo_per.
Declaration of interests
The authors report no conflict of interest.


 Open access