





Non-technical Summary
Coral reefs are among the most diverse ecosystems on Earth and are facing significant changes due to the current climate crisis. These changes threaten the many important functions these reefs perform. Corals have different survival strategies, adapting to changes in their environment through various traits. By studying the relationships between these traits, we can understand how coral species have changed over time and how they might respond to future environmental changes. The fossil record provides valuable insights into how coral communities have adapted to past climate changes and highlight traits that helped them survive.
In our research, we looked at the fossil records of Caribbean corals and their traits, such as the size and shape of their skeletons, to identify which traits have helped them persist through past climatic changes. We analyzed data from 4268 coral record occurrences from 421 sites over 40 million years, using network analysis to explore how coral species and their traits have changed.
Our findings suggest that corals of the late Cenozoic possessed traits adapted to cooler climates, which may now be detrimental to survival in a warming world. Cooler climates in the recent past favored corals that are now more vulnerable to diseases and heat stress. The turnover of coral species and traits in the past occurred during environmental change, indicating that similar shifts are likely in the future. We discovered that branching corals with small corallites, moderate corallite integration, and asexual reproduction through extracalicular budding thrived in cooler intervals, allowing them to form fast-growing, shallow reefs.
As temperatures rise and certain coral species decline in the Caribbean, future coral reefs may resemble those from the Eocene epoch, dominated by slow-growing, stress-tolerant corals that thrive in less favorable environments.
Introduction
The current climate crisis is substantially transforming coral reef ecosystems globally (Pandolfi and Jackson Reference Pandolfi, Jackson and Aronson2007; Hughes et al. Reference Hughes, Kerry, Baird, Connolly, Dietzel, Eakin and Heron2018; Cook et al. Reference Cook, Yamagiwa, Beger, Masucci, Ross, Lee, Stuart‐Smith and Reimer2022), with altered and reduced ecosystem functioning due to species losses and community and trait turnover beyond natural rates (Hodapp et al. Reference Hodapp, Roca, Fiorentino, Garilao, Kaschner, Kesner-Reyes and Schneider2023). The ecological mechanisms and consequences of such changes in ecosystem functioning remain unknown, but past patterns of species, community, and trait turnover can provide insight into future shifts in community diversity and structure (Payne and Clapham Reference Payne and Clapham2012; Pandolfi and Kiessling Reference Pandolfi and Kiessling2014; O’Dea et al. Reference O’Dea, Dillon, Altieri and Lepore2017; Raja et al. Reference Raja, Lauchstedt, Pandolfi, Kim, Budd and Kiessling2021).
Ecosystem functioning is defined as the flux of energy, nutrients, and organic matter through the environment (Brandl et al. Reference Brandl, Rasher, Côté, Casey, Darling, Lefcheck and Duffy2019). Differences in species traits enable species to occupy different functional niches, influencing ecosystem functioning (Hooper et al. Reference Hooper, Chapin, Ewel, Hector, Inchausti, Lavorel and Lawton2005; Hughes et al. Reference Hughes, Kerry, Álvarez-Noriega, Álvarez-Romero, Anderson, Baird and Babcock2017; Brandl et al. Reference Brandl, Rasher, Côté, Casey, Darling, Lefcheck and Duffy2019). Coral reefs, with their high diversity, exhibit niche partitioning (Loreau and Hector Reference Loreau and Hector2001), but also significant functional redundancy due to species sharing similar niches (Yachi and Loreau Reference Yachi and Loreau1999; Fonseca and Ganade Reference Fonseca and Ganade2001). High functional redundancy can buffer against species loss, therefore maintaining ecosystem functions despite species turnover (Yachi and Loreau Reference Yachi and Loreau1999; Fonseca and Ganade Reference Fonseca and Ganade2001).
As environmental change intensifies, the magnitude and rate of community turnover will likely increase, due to the increasing likelihood of species range expansions (Vergés et al. Reference Vergés, Steinberg, Hay, Poore, Campbell, Ballesteros and Heck2014, Reference Vergés, McCosker, Mayer‐Pinto, Coleman, Wernberg, Ainsworth and Steinberg2019; Gilson et al. Reference Gilson, Smale and O’Connor2021; Clay et al. Reference Clay, Reimer, Cook, Yamagawa, Gravener, Theodora and Beger2023) and contractions (Stuart-Smith et al. Reference Stuart-Smith, Mellin, Bates and Edgar2021), along with regional and global extinctions (Harnik et al. Reference Harnik, Lotze, Anderson, Finkel, Finnegan, Lindberg, Liow, Lockwood, McClain and McGuire2012). The resulting transformed communities may harbor fewer species, but retain the main functions, essentially functioning with a “skeleton crew,” much like communities in the geological past after mass extinction events (e.g., Foster and Twitchett Reference Foster and Twitchett2014; Dunhill et al. Reference Dunhill, Foster, Sciberras and Twitchett2018).
Examining trait turnover in coral reef communities, especially in response to environmental changes, provides insights into community functional resilience. There are often trade-offs between different traits, for example, branching corals have an increased growth rate that allows them to outcompete competitors for space on the reef (Baird and Hughes Reference Baird and Hughes2000); however, this strategy requires a high energy investment, meaning less energy is available for stress responses (Pinzón et al. Reference Pinzón, Dornberger, Beach-Letendre, Weil and Mydlarz2014). These evolutionary trade-offs lead to different life-history strategies, which can be thought of as existing on a spectrum from “fast” (r-selected) and “slow” (K-selected) life histories (Pianka Reference Pianka1970; Darling et al. Reference Darling, Alvarez-Filip, Oliver, McClanahan and Côté2012; Padda et al. Reference Padda, Glass and Stahlschmidt2021). Changes in environmental conditions may favor one strategy over another. Corals with an r-selected or competitive life-history strategy are fast growing with high fecundity and high mortality (e.g., Acropora) and the K-selected or stress-tolerant corals are slow growing and long-lived but with lower fecundity (e.g., Porites) (Sleeman et al. Reference Sleeman, Boggs, Radford and Kendrick2005; Darling et al. Reference Darling, Alvarez-Filip, Oliver, McClanahan and Côté2012).
Co-occurrence networks allow for the visualization of how species are associated based on their presence or absence, and therefore the turnover in ecological interactions between species (Ulrich et al. Reference Ulrich, Simons, Losito, Fiorito, Miles and Zelson1991; Araújo et al. Reference Araújo, Rozenfeld, Rahbek and Marquet2011; Harris Reference Harris2016; Morueta‐Holme et al. Reference Morueta‐Holme, Blonder, Sandel, McGill, Peet, Ott, Violle, Enquist, Jørgensen and Svenning2016; Matich et al. Reference Matich, Kiszka, Mourier, Planes and Heithaus2017). Combining these networks with trait-based analysis allows for quantifying trait co-occurrences, linking to community resilience or vulnerability (He et al. Reference He, Li, Liu, Xu, Li, Zhang and He2020; Clay et al. Reference Clay, Dunhill, Reimer and Beger2024a). Network metrics, such as modularity, edge density, degree centrality, and node degree, in trait co-occurrence networks quantify a community’s ability to recover from a disturbance (Flores-Moreno et al. Reference Flores-Moreno, Fazayeli, Banerjee, Datta, Kattge, Butler and Atkin2019; Gao et al. Reference Gao, Wang, Wei, Wu, Zhou, Wang, Li, Chen and Fu2022), making both species and trait co-occurrence networks valuable for understanding community turnover and resilience post-environmental disturbance.
A variety of modeling techniques can predict coral community change in response to future climate change (Donner et al. Reference Donner, Heron, Skirving, van Oppen and Lough2018). These models are often based on the physiological, ecological, and evolutionary responses of corals to current or very recent climate change; however, there is still a great deal of uncertainty concerning how reefs will respond to the degree of climate change predicted (Pandolfi Reference Pandolfi2015). The understanding required to predict future responses to environmental change can come from paleoecology, as the fossil record provides evidence of how communities have responded to the scale of change predicted over the coming decades to centuries, which is as yet unprecedented in human history (O’Dea et al. Reference O’Dea, Dillon, Altieri and Lepore2017). The Cenozoic (66 Ma to present) (Cohen et al. Reference Cohen, Finnery, Gibbard and Fan2013) has seen temporal fluctuations in biodiversity and functional patterns within shallow reef ecosystems. The Cenozoic Era may provide insight into the future impacts of climate change, as conditions vary frequently throughout the interval, with some reflecting current and predicted future conditions (Norris et al. Reference Norris, Turner, Hull and Ridgwell2013).
Fluctuating environmental conditions and regional biogeographic changes in the Caribbean led to corals’ diversity and abundance variations throughout the Cenozoic (Johnson et al. Reference Johnson, Jackson and Budd2008, Reference Johnson, Sánchez-Villagra and Aguilera2009; Roff Reference Roff2021; Yasuhara et al. Reference Yasuhara, Huang, Reuter, Tian, Cybulski, O’Dea, Mamo, Cotton, Di Martino and Feng2022; Fig. 1). There were multiple periods of environmental change between the end of the Eocene and the late Pleistocene that may provide insight into coral trait changes in response to environmental change. In this paper, we will examine three of these periods of change: (1) Reductions in sea-surface temperature (SST) and sea level across the Eocene/Oligocene boundary (~33.9 Ma) caused previously algal-dominated reefs (Scheibner and Speijer Reference Scheibner and Speijer2008; Mutti et al. Reference Mutti, Piller and Betzler2011; Takayanagi et al. Reference Takayanagi, Iryu, Oda, Sato, Chiyonobu, Nishimura, Nakazawa, Ishikawa and Nagaishi2012) to become large architectural reefs (Johnson et al. Reference Johnson, Jackson and Budd2008, Reference Johnson, Sánchez-Villagra and Aguilera2009; Miller et al. Reference Miller, Browning, Schmelz, Kopp, Mountain and Wright2020; Yasuhara et al. Reference Yasuhara, Huang, Reuter, Tian, Cybulski, O’Dea, Mamo, Cotton, Di Martino and Feng2022). (2) Throughout the Miocene, the isolation of the Caribbean from other reef areas, along with tectonic and ocean current changes (Yasuhara et al. Reference Yasuhara, Huang, Reuter, Tian, Cybulski, O’Dea, Mamo, Cotton, Di Martino and Feng2022), contributed to species turnover. This isolation led to shared ecological characteristics across the Caribbean and ultimately the evolution of endemic Caribbean corals, which are the ancestors of today’s Caribbean species (Johnson and Kirby Reference Johnson and Kirby2006). (3) The formation of the Isthmus of Panama in the Pliocene triggered a regional extinction event (Roff Reference Roff2021), reducing coral diversity by up to 80% (Budd et al. Reference Budd, Klaus and Johnson2011), but paving the way for a surge in reef growth during the late Pleistocene (O’Dea et al. Reference O’Dea, Jackson, Fortunato, Smith, D’Croz, Johnson and Todd2007; Johnson et al. Reference Johnson, Jackson and Budd2008; Klaus et al. Reference Klaus, McNeill, Budd and Coates2012). The recovery of reef growth in the late Pleistocene was mainly driven by the genus Acropora (Klaus et al. Reference Klaus, McNeill, Budd and Coates2012; Renema et al. Reference Renema, Pandolfi, Kiessling, Bosellini, Klaus, Korpanty, Rosen, Santodomingo, Wallace, Webster and Johnson2016), and its associated traits such as asexual reproduction and fast growth rates (Roff Reference Roff2021). Today, the Caribbean is threatened by environmental and anthropogenic change, with declining coral abundance, diversity, functional redundancy (Jackson et al. Reference Jackson, Donovan, Cramer and Lam2014), and low resilience to disturbance (Connell Reference Connell1997; Jackson et al. Reference Jackson, Donovan, Cramer and Lam2014; Cramer et al. Reference Cramer, Jackson, Donovan, Greenstein, Korpanty, Cook and Pandolfi2020). Exploring species and community turnover on Caribbean coral reefs may help determine whether there is an evolutionary historic reason for their current low resilience in comparison to Indo-Pacific reefs (Roff Reference Roff2021).
Environmental and biogeographic change across the Cenozoic Era (~56 Ma to ~0.0117 Ma) and how these changes affected coral abundance and diversity. Central column = epochs/sub-epochs, size relates to the length of time (Cohen et al. Reference Cohen, Finnery, Gibbard and Fan2013). Boxes reflect changes in abundance and diversity of corals (Johnson et al. Reference Johnson, Jackson and Budd2008, Reference Johnson, Sánchez-Villagra and Aguilera2009; Budd et al. Reference Budd, Klaus and Johnson2011; Steinthorsdottir et al. Reference Steinthorsdottir, Coxall, de Boer, Huber, Barbolini, Bradshaw and Burls2021). Arrows indicate the direction of change in sea-surface temperatures (SSTs) (°C) and sea level (SL) (m) (Miller et al. Reference Miller, Browning, Schmelz, Kopp, Mountain and Wright2020; Rae et al. Reference Rae, Zhang, Liu, Foster, Stoll and Whiteford2021). Caribbean regional biogeographic changes are also indicated (Roff Reference Roff2021; Yasuhara et al. Reference Yasuhara, Huang, Reuter, Tian, Cybulski, O’Dea, Mamo, Cotton, Di Martino and Feng2022). The triangle indicates when the closure of the Panama Isthmus occurred (O’Dea et al. Reference O’Dea, Lessios, Coates, Eytan, Restrepo-Moreno, Cione, Collins, De Queiroz, Farris and Norris2016), and the star indicates the early/late Pleistocene regional extinction event (Budd Reference Budd2000). Coral icons from vecta.io (https://vecta.io).

We can predict how modern coral reefs might respond to environmental change at the trait level by assessing when environmental change pushed species turnover into trait turnover in the past. Here, we quantify to what degree large-scale environmental change, of similar magnitude to modern-day climate change, has transformed coral communities, changed the complexity of trait networks, and thus affected ecosystem function. We test the following hypotheses: (1) Periods of species turnover and extinctions across the Cenozoic Era coincide with changing environmental conditions. (2) In addition, species turnover is associated with trait turnover across the Cenozoic Era. (3) Particular traits or trait relationships were integral to surviving major periods of change, such as those associated with a competitive or stress-tolerant life-history strategy. Testing these hypotheses will enhance our understanding of the mechanisms underpinning coral survival and extinction.
Methods
Data Acquisition
We downloaded coral occurrence data from the Paleobiology Database (PBDB; https://www.paleobiodb.org, accessed 1 October 2022), using the following parameters: taxa = Anthozoa; time interval = Cenozoic; longitude min. = −105.249, max. = 40.5176; latitude min = 7.1881, max = 30.6001 (to capture the western equatorial Atlantic, including the Caribbean Sea, the Gulf of Mexico, and the Bahamas). The Cenozoic Era is divided into seven epochs (Paleocene, Eocene, Oligocene, Miocene, Pliocene, Pleistocene, and Holocene), three of which (Miocene, Pliocene, and Pleistocene) are further divided into sub-epochs (Cohen et al. Reference Cohen, Finnery, Gibbard and Fan2013). We filtered the data to remove occurrence data from the Paleocene, middle Miocene, middle Pleistocene, and Holocene, due to a lack of data availability for these epochs/sub-epochs. This left only the epochs and sub-epochs of interest: Eocene (56.0–33.8 Ma), Oligocene (33.9–23.03 Ma), early Miocene (23.03–15.98 Ma), late Miocene (11.63–5.33 Ma), early Pliocene (5.33–3.60 Ma), late Pliocene (3.60–2.58 Ma), early Pleistocene (2.58–0.77 Ma), and late Pleistocene (0.129–0.0117 Ma).
We downloaded species-level occurrence records as collections, which represent records collected during the same paleontological survey and are used here to represent communities. We excluded any collections with fewer than five occurrences to ensure sufficient data for community-level analysis. We carried out analysis at the species level, as although both modern and paleontological coral taxonomy is highly debated (Lathuilière Reference Lathuilière1996; Kitahara et al. Reference Kitahara, Fukami, Benzoni, Huang, Goffredo and Dubinsky2016; Ramírez-Portilla et al. Reference Ramírez-Portilla, Baird, Cowman, Quattrini, Harii, Sinniger and Flot2022), analysis at the genus level would mean a great loss in trait variation and would not capture the full range of functional diversity. We checked coral species’ names against the World Register of Marine Species (WoRMS) using the R package worrms (Chamberlain and Vanhoorne Reference Chamberlain and Vanhoorne2023) to account for recent updates in coral taxonomy (Hoeksema and Cairns Reference Hoeksema and Cairns2025). We only included reef-building coral species occurrences, due to the lack of available trait data for non–reef building corals. We identified azooxanthellate species and any other non–reef building species using a combination of WoRMS (Chamberlain and Vanhoorne Reference Chamberlain and Vanhoorne2023), PBDB (https://www.paleobiodb.org, accessed 1 October 2022), Encyclopedia of Life (EOL 2022), and data from Raja et al. (Reference Raja, Lauchstedt, Pandolfi, Kim, Budd and Kiessling2021) and removed them from the database. The final scleractinian coral occurrence database includes 421 collections from a range of sites across the western equatorial Atlantic, hereafter referred to as the Caribbean, and a range of epochs within the Cenozoic Era (Fig. 2; Supplementary Table 1).
Sites of the 421 collections within the western equatorial Atlantic, obtained from the Paleobiology Database and used in this study. Colors indicate which epoch/sub-epoch the collection belongs to.

We collated coral traits from the Neogene Marine Biota of Tropical America (NMITA) (Budd et al. Reference Budd, Foster, Dawson and Johnson2001), Raja et al. (Reference Raja, Lauchstedt, Pandolfi, Kim, Budd and Kiessling2021), and CoralTraits.org (Madin et al. Reference Madin, Anderson, Andreasen, Bridge, Cairns, Connolly, Darling, Diaz, Falster and Franklin2016) databases, along with primary literature (Duncan Reference Duncan1864, Reference Duncan1873; Vaughan Reference Vaughan1899, Reference Vaughn1919; Vaughan and Hoffmeister Reference Vaughan and Hoffmeister1926; Wells Reference Wells1934a,Reference Wellsb, Reference Wells1935, Reference Wells1945; Vaughan and Wells Reference Vaughan and Wells1943; Durham Reference Durham1946; Weisbord Reference Weisbord1971, Reference Weisbord1973, Reference Weisbord1974; Frost and Langenheim Reference Frost and Langenheim1974; Cairns and Wells Reference Cairns and Wells1987; Budd et al. Reference Budd, Stemann and Stewart1992, Reference Budd, Woodell, Huang and Klaus2019; Bosellini Reference Bosellini1995; Cairns Reference Cairns1995; Filkorn et al. Reference Filkorn, Avendaño-Gil, Coutiño-José and Vega-Vera2005; Locke et al. Reference Locke, Weil and Coates2007; Pandolfi Reference Pandolfi2007; Budd and Wallace Reference Budd and Wallace2008; de Araújo Távora Reference Araújo Távora2016; Flórez et al. Reference Flórez, Zapata-Ramírez and Klaus2019). Species traits are often variable, with intraspecies variation seen across different environments (e.g., colony growth form plasticity along depth gradients) (Smith et al. Reference Smith, Barshis and Birkeland2007; Todd Reference Todd2008; Doszpot et al. Reference Doszpot, McWilliam, Pratchett, Hoey and Figueira2019); however, we have focused on interspecies variation to capture broad community-level changes across the Caribbean over such a large time frame (~ 54 Myr) and therefore used the most common trait for each species. Life-history strategies are linked to survival during environmental disturbances (Darling et al. Reference Darling, Alvarez-Filip, Oliver, McClanahan and Côté2012; van Woesik et al. Reference Woesik, Franklin, O’Leary, McClanahan, Klaus and Budd2012), as are traits related to extinction risk, such as colony growth form, corallite integration, maximum corallite diameter, and budding type (Raja et al. Reference Raja, Lauchstedt, Pandolfi, Kim, Budd and Kiessling2021; Table 1). Colony growth form indicates the morphology of corals; we created four categories based on data availability (Table 1). It is also worth noting that coral morphology influences preservation bias, with branching corals more susceptible to fragmentation reducing their likelihood of fossilization (Webb Reference Webb1996); therefore, the presence of branching corals may be higher than the fossil record indicates. Corallite integration refers to the arrangement of corallites within the colony (Raja et al. Reference Raja, Dimitrijević, Krause and Kiessling2022). We split corallite integration into the same eight categories used by Raja et al. (Reference Raja, Lauchstedt, Pandolfi, Kim, Budd and Kiessling2021; Table 1). Maximum corallite diameter was split into four categories, as categorical data were required for trait network construction (Table 1). We included maximum corallite diameter even though it had a low importance for modern corals in Darling et al. (Reference Darling, Alvarez-Filip, Oliver, McClanahan and Côté2012), because it was important for predicting extinction risk in fossil corals (Raja et al. Reference Raja, Lauchstedt, Pandolfi, Kim, Budd and Kiessling2021), and here we want to create comparable analyses. Budding type refers to where new buds form in relation to the corallite wall of the parent polyp during asexual reproduction (Raja et al. Reference Raja, Dimitrijević, Krause and Kiessling2022). The lack of reproductive trait data for extinct species may have reduced the power of the study. Therefore, we included budding type in our analysis, even though it was the least important variable for extinction risk in Raja et al. (Reference Raja, Lauchstedt, Pandolfi, Kim, Budd and Kiessling2021). This is because it is the only morphological trait we have related to reproduction and reproductive traits and their evolutionary history likely drives the survival of coral communities (Roff Reference Roff2021). Budding type was split into four categories (Table 1). These traits capture the main factors in coral morphology that underscore coral resilience to extinction and were used to split coral species broadly into the two ends of the r-K continuum: competitive and stress tolerant (Table 1). It is worth noting that life-history strategies exist as a continuum (Stearns Reference Stearns1977), and so our categorization of traits as competitive or stress-tolerant is likely an oversimplification. Combinations of different traits place species along this continuum, with very few species fitting perfectly into any one life-history strategy, as highlighted by the “generalist” strategy identified in Darling et al. (Reference Darling, Alvarez-Filip, Oliver, McClanahan and Côté2012).
The four morphological traits of corals used explore trait turnover during the Cenozoic, with category information, life-history strategy group, and short comments on trait relationships with the two life-history strategy groups: stress-tolerant (K-selected) and competitive (r-selected)

Species and Trait Turnover across the Cenozoic Era
To test our first hypothesis, that species turnover coincided with environmental drivers, we constructed a bipartite network. We created a bipartite network spanning from the Eocene to the Pleistocene using a time bin by species matrix to show species turnover across the Cenozoic (Fig. 3A). We applied the igraph (v. 1.4.1) package function bipartite.mapping to ensure bipartite projection. We applied the layout “layout.fruchterman.reingold” to visualize all nodes within the network. The final network was edited using Inkscape (v. 1.2.2) to improve the visibility of all nodes and edges. We visualized the numbers of epoch/sub-epoch–specific and shared species via a heat map using the R package ggplot2 (v. 3.4.2) (Wickham Reference Wickham2016; Fig. 3B). Sampling bias is an issue for all paleontological studies, with heterogeneous sampling effort and differential preservation leaving our understanding of spatiotemporal species distributions incomplete (Kiessling Reference Kiessling2005). We chose to focus on fossil occurrence (i.e., presence/absence) rather than abundance due to the difficulty in distinguishing between true abundance and preservational artifacts (Kiessling Reference Kiessling2008). Some species may be missing from the bipartite network, potentially skewing our turnover results; however, as the bipartite projection is not weighted by abundance, it is not influenced by uneven preservation of the species sampled in each time interval.
Coral species turnover throughout the Cenozoic Era (Eocene–Pleistocene) within the Caribbean. A, Bipartite affiliation network. Circles represent different coral species: purple, extinct species; light blue, extant species now regionally extinct in the Caribbean; dark blue, extant species. B, Heat map showing species overlap between epochs/sub-epochs; N indicates the overall number of species within each epoch/sub-epoch.

We calculated the Jaccard dissimilarity of coral species using the Vegan package (v. 2.6.4) (Oksanen et al. Reference Oksanen, Blanchet, Friendly, Kindt, Legendre, McGlinn and Minchin2020) to quantify species turnover between each of the neighboring epochs and sub-epochs using presence/absence data.
To test our second hypothesis that trait turnover coincided with species turnover, we calculated Jaccard dissimilarity of coral traits using the same methods as for species Jaccard dissimilarity. Species and trait dissimilarity was plotted for comparison (Fig. 4, Supplementary Fig. 1).
Jaccard dissimilarity scores between neighboring epochs/sub-epochs. Solid lines and circles indicate species dissimilarity and dotted lines with triangles indicate trait dissimilarity. Blue vertical dashed lines represent major environmental or biogeographic changes, with the first indicating the ~5oC Eocene-Oligocene cooling event, the second the closure of the central American Seaway (CAS) and the third the Caribbean regional coral extinction seen following the closure of the Panama isthmus.

Trait Co-occurrences across Major Periods of Change
To test our third hypothesis, that particular traits or trait relationships were integral to surviving major periods of change, we used trait–trait co-occurrence networks (Clay et al. Reference Clay, Dunhill, Reimer and Beger2024a). We constructed trait–trait co-occurrence networks for three major periods of environmental change that coincided with periods of high species and/or trait turnover identified during the testing of our first and second hypotheses (Eocene–Oligocene, early Miocene–late Miocene, late Pliocene–early Pleistocene). To account for the prevalence of each trait within each collection, we calculated community weighted means (CWMs) for each collection within each epoch/sub-epoch by combining a presence/absence site-by-species matrix with a species-by-trait matrix, using the FD package (v. 1.0.12.1) in R (Laliberté et al. Reference Laliberté, Legendre, Shipley and Laliberté2014). To account for the differing numbers of collections between epochs/sub-epochs, we randomly subsampled each group to match the smallest available number of collections (e.g., 13 of the 23 Oligocene collections, as only 13 collections were available from the Eocene; early Miocene = 40, late Miocene = 38, late Pliocene = 36, early Pleistocene = 98). We repeated the random sampling 10 times, with networks constructed for each iteration. We calculated a trait–trait relationship matrix by applying Pearson’s correlation to the collection-by-CWM matrix. We set a significance threshold of p < 0.05, with correlations below the threshold assigned as one and those above assigned as zero (He et al. Reference He, Li, Liu, Xu, Li, Zhang and He2020; Clay et al. Reference Clay, Dunhill, Reimer and Beger2024a). This approach allowed us to analyze a network of significant trait–trait relationships in igraph (v. 1.4.1) (Csardi and Nepusz Reference Csardi and Nepusz2006). All 10 randomly sampled networks were constructed for each sub-epoch (Supplementary Figs. 2–4). The networks presented in the “Results” represent the closest to the mean values for edge density and modularity (Figs. 5–7). It is also possible that important trait–trait relationships have been overlooked due to missing species or trait information, but restricting our study to the well-sampled Caribbean region means spatial sampling bias is likely not a major issue, as it would be with a global study (Vilhena and Smith Reference Vilhena and Smith2013).
Trait turnover of Caribbean corals across the Eocene–Oligocene cooling period. Eocene (A) and Oligocene (B) trait–trait relationship networks based on the community weighted mean (CWM) trait values. Circles indicate network nodes (traits), node size relates to node degree, edges indicate significant co-occurrences, and gray shading indicates network modules. Orange nodes indicate traits associated with a competitive life-history strategy in corals, and blue nodes indicate traits related to a stress-tolerant life-history strategy in corals. For the Oligocene, the network with metrics closest to the mean is shown out of a possible 10 networks, created from randomly sampling 13 collections from each epoch 10 times. C, Principal component analysis (PCA) of CWMs for Caribbean coral trait communities for each epoch (Eocene and Oligocene). G = colony growth form, C = corallite integration, D = maximum corallite diameter, B = budding type. D, Gower distance–based principal coordinate analysis (PCoA) for Eocene and Oligocene. Gray convex hull represents overall trait space, with gray points indicating species in both the Eocene and Oligocene epochs. Purple convex hull and purple points indicate species from the Eocene. Green convex hull and green points indicate species from the Oligocene.

Trait turnover of Caribbean corals across the early Miocene–late Miocene interval of increased biogeographic isolation. Early Miocene (A) and late Miocene (B) trait–trait relationship networks based on the community weighted mean (CWM) trait values. Circles indicate network nodes (traits), node size relates to node degree, edges indicate significant co-occurrences, and gray shading indicates network modules. Orange nodes indicate traits associated with a competitive life-history strategy in corals, and blue nodes indicate traits related to a stress-tolerant life-history strategy in corals. For the early Miocene, we show the network with metrics closest to the mean out across 10 subsampled networks. C, Principal component analysis (PCA) of CWMs for Caribbean coral trait communities for each epoch (early Miocene, late Miocene). G = colony growth form, C = corallite integration, D = maximum corallite diameter, B = budding type. D, Gower distance–based principal coordinate analysis (PCoA) for the early and late Miocene. Gray convex hull represents overall trait space, with gray points indicating species in both sub-epochs. Purple convex hull and purple points indicate species from the early Miocene. Green convex hull and green points indicate species from the late Miocene.

Trait turnover of Caribbean corals across the late Pliocene–early Pleistocene regional extinction event. Late Pliocene (A) and early Pleistocene (B) trait–trait relationship networks based on the community weighted mean (CWM) trait values. Circles indicate network nodes (traits), node size relates to node degree, edges indicate significant co-occurrences, and gray shading indicates network modules. Orange nodes indicate traits associated with a competitive life-history strategy in corals, and blue nodes indicate traits related to a stress-tolerant life-history strategy in corals. For the early Pleistocene, the network with metrics closest to the mean is shown out of a possible 10 networks, created from randomly sampling 36 collections from each sub-epoch 10 times. G = colony growth form, C = corallite integration, D = maximum corallite diameter, B = budding type. C, Principal component analysis (PCA) of CWMs for Caribbean coral trait communities for each epoch (late Pliocene, early Pleistocene). D, Gower distance–based principal coordinate analysis (PCoA) for the late Pliocene and early Pleistocene. Gray convex hull represents overall trait space, with gray points indicating species in both sub-epochs. Purple convex hull and purple points indicate species from the late Pliocene. Green convex hull and green points indicate species from the early Pleistocene.

Following network construction, we calculated three network metrics using igraph (v. 1.4.1): node degree, edge density, and modularity. Node degree measures the importance of a node within a network, a trait with a high node degree is integral to the network and can be thought of as a “keystone” trait (Flores-Moreno et al. Reference Flores-Moreno, Fazayeli, Banerjee, Datta, Kattge, Butler and Atkin2019; Gao et al. Reference Gao, Wang, Wei, Wu, Zhou, Wang, Li, Chen and Fu2022; Clay et al. Reference Clay, Dunhill, Reimer and Beger2024a). A higher node degree is ecologically preferable, as networks that are made up of one or two keystone traits may be functionally vulnerable, with the loss of one or both those traits leading to the breakdown of the network and thus the loss of ecosystem functioning (Mouillot et al. Reference Mouillot, Villéger, Parravicini, Kulbicki, Arias-González, Bender and Chabanet2014; Gao et al. Reference Gao, Wang, Wei, Wu, Zhou, Wang, Li, Chen and Fu2022). Edge density measures how well connected a network is by quantifying the number of edges within a network. Highly connected networks can infer high environmental marginality (Flores-Moreno et al. Reference Flores-Moreno, Fazayeli, Banerjee, Datta, Kattge, Butler and Atkin2019), potentially indicating high trait matching and an increased abundance of generalist species. Modularity refers to the presence of distinct subgroups or neighborhoods, where groups of traits have more connections with one another than with the rest of the network (Flores-Moreno et al. Reference Flores-Moreno, Fazayeli, Banerjee, Datta, Kattge, Butler and Atkin2019). High modularity within a network likely indicates high functional diversity of the ecosystem. Modules may indicate different life strategies or functional niches, meaning high modularity within a network likely indicates high functional diversity, that is, more modes of life and, therefore, higher resilience to disturbance (Liu et al. Reference Liu, Liu, Zhang, Bascompte, He and Chu2021). We incorporated metrics into the visualization of the network, where modules are indicated by gray ellipses around nodes within the same module, and node degree is indicated by the size of the nodes (Figs. 5–7).
As trait–trait co-occurrence networks do not include all possible traits, but only those traits that are significantly correlated, we also created simple weighted edge networks to visualize all possible trait connections. We calculated the edge density for the weighted edge networks and compared it with the edge density of the trait–trait co-occurrence networks to explore how many of the possible trait connections were deemed significant in the trait–trait co-occurrence networks.
To quantify community overlap between the epochs/sub-epochs compared through trait–trait networks and to identify which traits drive the separation of communities we used principal component analysis (PCA). We calculated a Euclidean distance matrix using the numerical CWM for each collection within each epoch/sub-epoch using the function prcomp and visualized it in multidimensional space using PCA (Figs. 5C, 6C, 7C). In addition to exploring community changes, we quantified changes in trait space between the neighboring epochs/sub-epochs, using principal coordinate analysis (PCoA). Comparing trait space allows visualization of the functional richness of each epoch/sub-epoch. We used convex hulls to visualize this, placing species in multidimensional space based on their functional dissimilarity (Magneville et al. Reference Magneville, Loiseau, Albouy, Casajus, Claverie, Escalas, Leprieur, Maire, Mouillot and Villéger2022). A larger trait space indicates higher functional richness (Cornwell et al. Reference Cornwell, Schwilk and Ackerly2006; McWilliam et al. Reference McWilliam, Hoogenboom, Baird, Kuo, Madin and Hughes2018). We calculated Gower’s (Reference Gower and Diday1983) dissimilarity matrices for all time bins using funct.diss (de Bello et al. Reference Bello, Botta-Dukat, Leps and Fibich2021). To calculate and assess the quality of functional trait space, we used the mFD package (v. 1.0.4) to calculate functional richness across four axes (Magneville et al. Reference Magneville, Loiseau, Albouy, Casajus, Claverie, Escalas, Leprieur, Maire, Mouillot and Villéger2022). We constructed a global hull that included all species and their traits and then created regional hulls by subsetting species by each time bin (Laliberté et al. Reference Laliberté, Legendre, Shipley and Laliberté2014; Floyd et al. Reference Floyd, Mizuyama, Obuchi, Sommer, Miller, Kawamura, Kise, Reimer and Beger2020; Clay et al. Reference Clay, Reimer, Sommer, Cook, Mizuyama, Obuchi, Kawamura, Kise and Beger2024b). To explore which traits were driving the functional separation of species, we plotted trait vectors on the regional hulls using the vegan package (v. 2.6.4) from R (Oksanen et al. Reference Oksanen, Blanchet, Friendly, Kindt, Legendre, McGlinn and Minchin2020; Supplementary Figs. 5d, 6d, 7d).
Results
Turnover of Species and Traits across the Cenozoic
The bipartite network revealed a continuous species turnover across the Cenozoic (Fig. 3A). Species richness increased between the Eocene (N = 69) and Oligocene (N = 86), before falling during the early Miocene (N = 70), late Miocene (N = 71), and early Pliocene (N = 72), rose slightly in the late Pliocene (N = 82) before falling again in the early (N = 74) and late Pleistocene (N = 40). Fifty-one of the species recorded are currently extant today, with 4 originating in the Oligocene, 5 in the early Miocene, 17 in the late Miocene, 6 in the early Pliocene, 8 in the late Pliocene, 10 in the early Pleistocene, and 1 in the late Pleistocene (Fig. 3A). There were also five species identified as regionally extinct in the Caribbean (Gardineroseris planulata, Leptoseris gardineri, Leptoseris glabra, Meandrine brasiliensis, and Mussismilia hispida) but extant elsewhere. All five of the regionally extinct species originate in the Miocene (1, early Miocene; 4, late Miocene) (Fig. 3A). The largest turnover in species occurs between the Eocene and Oligocene, with only 28% of species from the Eocene surviving through to the Oligocene (Fig. 3B) (Oligocene–early Miocene = 53%, early Miocene–late Miocene = 46%, late Miocene–Pliocene = 77%, early Pliocene–late Pliocene = 78%, late Pliocene–early Pleistocene = 62%, early Pleistocene–late Pleistocene = 88%).
Jaccard dissimilarity indicates species turnover to be the greatest between the Eocene and the Oligocene (0.86) (Fig. 4). Dissimilarity decreases between the Oligocene and early Miocene (0.58) before increasing during the early Miocene/late Miocene turnover (0.71). There is another decrease in Jaccard dissimilarity between the late Miocene and early Pliocene (0.38) (Fig. 4, Supplementary Fig. 1). Dissimilarity then increases gradually across the rest of the Cenozoic (early Pliocene–late Pliocene = 0.43, late Pliocene–early Pleistocene = 0.51, early Pleistocene–late Pleistocene = 0.56) (Fig. 4, Supplementary Fig. 1).
Trait Co-occurrences across the Eocene–Oligocene Cooling Period
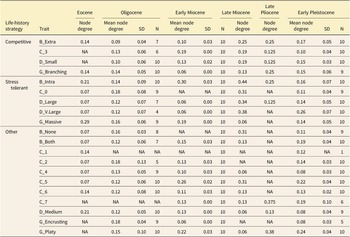
Across the Eocene–Oligocene cooling period, edge density is reduced in the trait–trait co-occurrence networks for both epochs (Eocene = 0.12, Oligocene = 0.14 [mean ± 0.04 SD]), in comparison to the weighted edge networks (Eocene = 0.74, Oligocene = 0.96 [mean ± 0.03 SD]). Several traits present in the Eocene communities are not present in the trait–trait relationship network: corallite integration 3 (plocoid), corallite integration 7 (flabello-meandroid), small corallite diameter, and encrusting colony growth form (Supplementary Fig. 3A,C). Platy colony growth form is missing from the Eocene communities completely (Supplementary Fig. 3A,C). In the Oligocene, corallite integration 1 (dendroid) and 7 (flabello-meandroid) are missing from the communities (Supplementary Fig. 3B,D). Several traits do not appear in all 10 randomly sampled weighted networks (numbers in brackets indicate how many networks they do appear in): budding type none (8), corallite integration 0 (solitary) (9), corallite integration 2 (phaceloid) (7), and colony growth form encrusting (9). All traits present in the Oligocene weighted edge network are present in the trait–trait relationship network (Supplementary Fig. 3B,D), but many of these traits are not present in all of the 10 randomly sampled networks: budding types both (7), extra (7), and none (8); corallite integration 0 (solitary) (9), 2 (phaceloid/reptoid) (5), 3 (plocoid) (6), and 4 (cerioid) (9); corallite diameters large (7) and very large (4); and colony growth forms encrusting (9) and massive (9) (Table 2).
Node degree for Caribbean coral traits following trait–trait relationship network construction. Mean node degree, standard deviation (SD), and number of times trait appears (N) for Oligocene, early Miocene, and early Pleistocene networks where we created 10 randomly sampled networks to account for uneven collection numbers across neighboring epochs. G = colony growth form, C = corallite integration, D = maximum corallite diameter, B = budding type

Trait–trait relationships become more complex following the Eocene–Oligocene cooling event, with the slight increase in edge density (Eocene = 0.12, Oligocene = 0.14 [mean ± 0.04 SD]) that indicates more connections in the Oligocene than in the Eocene network (Fig. 5A,B). In the Eocene network, the only two traits associated with a competitive life-history strategy are branching colony growth form and extracalicular budding (Fig. 5A), whereas in the Oligocene, this module increases in size and often contains three to four of the competitive traits: small diameter corallites, branching colony growth form, corallite integration 3, and extracalicular budding (Fig. 5B, Supplementary Fig. 1). The node degree of colony growth form branching remains stable between the Eocene and the Oligocene, whereas the node degree of extracalicular budding is reduced (Table 2). Traits related to a stress-tolerant life-history strategy in corals vary between the Eocene and Oligocene, with some co-occurring within the same module (i.e., colony growth form massive, intracalicular budding, and very large diameter corallites in the Eocene (Fig. 5A), and other traits being outside of the main stress-tolerant module. The co-occurrence of stress-tolerant traits across the Oligocene’s randomly sampled 10 networks varies greatly (Supplementary Fig. 1). Across the Eocene–Oligocene epochs, three stress-tolerant traits increase in node degree (corallite integration 0 (solitary), large diameter corallites and very large diameter corallites) and two decrease in node degree (intracalicular budding and colony growth form massive) (Table 2).
The change in trait communities between the Eocene and Oligocene is illustrated by the PCA results (Fig. 5C). The first two PCA axes accounted for 41.62% of variation (PC 1, 23.77%; PC 2, 17.85%) (Fig. 5C). There was a decrease in trait community hull area from the Eocene (35.15) to the Oligocene (16.63) (Fig. 5C). The first two PCoA axes account for 58.72% of variation (PCoA 1, 37.45%; PCoA 2, 21.27%) (Fig. 5D). There was a decrease in functional richness between the two epochs, with the Eocene occupying 99% and the Oligocene occupying 79% of the overall functional richness (Fig. 5C). The decrease in functional richness was driven by a decrease in corallite integration traits 1 (dendroid), 6 (meandroid), and 7 (flabello-meandroid) and intracalicular budding in the Oligocene (Fig. 5C).
Trait Co-occurrences across the early Miocene–late Miocene Period of Increased Biogeographic Isolation
Edge density was reduced in the co-occurrence networks (early Miocene = 0.14 [mean ± 0.004], late Miocene = 0.21), in comparison to the weighted edge networks (early Miocene = 0.94 [mean ± 0.005], late Miocene = 0.87). Three traits are missing from the early Miocene community (corallite integration 0 (solitary), 1 (dendroid), and budding type none), and all the traits present in the community are present in the trait–trait relationship networks (Supplementary Fig. 4a,c). All the traits present in the early Miocene communities appear in all 10 of the random samples (Table 2). The late Miocene community is missing two traits (corallite integration 1 (dendroid) and colony growth form encrusting), and corallite integration 2 (phaceloid) is present in the community but missing from the trait–trait relationship networks (Supplementary Fig. 4b,d).
Turnover in trait–trait relationships is seen between the early and late Miocene (Fig. 6A,B). In the early Miocene trait–trait relationship networks, there is no clear grouping of competitive or stress-tolerant traits (Fig. 6A). By the late Miocene, distinct modules have formed, with competitive traits clustered into an abundant group, while dominant stress-tolerant traits formed a second well-defined module but were intermixed with other traits (Fig. 6B). Three of the competitive traits (budding type extra, small corallite diameter, and colony growth form branching) increased in node degree from the early to the late Miocene, and corallite integration 3 (plocoid) stayed the same (Table 2). Three of the stress-tolerant traits (intracalicular budding, large, and very large corallite diameter) increased in node degree from the early to the late Miocene, whereas colony growth form massive was reduced in node degree and corallite integration 0 (solitary) was only present in the late Miocene (Table 2).
The PCA results illustrate the change in trait communities, with the first two PCA axes accounting for 60.26% (PC 1, 38.43%; PC 2, 21.82%) of the variation (Fig. 5C). There was an increase in community hull area from the early (0.74) to the late Miocene (1.12), which was driven by increases in the traits for large diameter corallites and intracalicular budding (Fig. 5C). The first two PCoA axes accounted for 74.02% of the variation (PCoA 1, 51.30%; PCoA 2, 22.72%) (Fig. 5D). Functional richness increased slightly from the early (97%) to the late Miocene (99%) (Fig. 5D).
Trait Co-occurrences across the late Pliocene–early Pleistocene Regional Extinction Event
Edge density is reduced in the trait–trait co-occurrence networks for both the late Pliocene and early Pleistocene sub-epochs (late Pliocene = 0.22, early Pleistocene = 0.15 [mean ± 0.01 SD]), in comparison to the weighted edge networks (late Pliocene = 0.96, early Pleistocene = 0.98 [mean ± 0.02 SD]). Corallite integration 0 (solitary) and budding type none are missing from the late Pliocene community, and eight traits (corallite integration 1 (dendroid), 2 (phaceloid/reptoid), 4 (cerioid), 5 (asteroid/thamnasteroid), 6 (meandroid); very large diameter corallites, colony growth form encrusting, and budding type both) are present in the communities but missing from the trait–trait relationship networks (Supplementary Fig. 5a,c). All possible traits are present in the early Pleistocene communities (Supplementary Fig. 5b,d). Three traits do not appear in all 10 randomly sampled weighted networks: budding type none (9), corallite integration 0 (solitary) (9), and corallite integration 1 (dendroid). All traits present in the early Pleistocene weighted edge network are present in the trait–trait relationship network (Supplementary Fig. 3B,D); however, many of these traits are not present in all of the 10 randomly sampled networks: budding type none (9), colony from 0 (solitary) (9), 1 (dendroid) (1), and 7 (flabello-meandroid); corallite diameter medium (9); and colony growth form encrusting (5) (Table 2).
Trait–trait relationships increase in complexity between the late Pliocene and early Pleistocene, indicated by the increase in traits, modules, and module connectedness seen in the early Pleistocene (Fig. 7A,B). All four traits related to a competitive life-history strategy are connected as a module in the early Pliocene and all but two of the early Pleistocene randomly sampled networks (Fig. 7A,B, Supplementary Fig. 2). The node degree of three of the competitive traits decreases from the late Pliocene to the early Pleistocene (corallite integration 3 (plocoid), extracalicular budding, and branching colony growth form). In contrast, the small diameter corallites increased in node degree (Table. 2). Only two stress-tolerant traits are present in the late Pliocene trait–trait relationship network (large diameter corallites and intracalicular budding) (Fig. 6A). In contrast, all five appear in the early Pleistocene networks (Fig. 7B, Supplementary Fig. 2). Co-occurrence of stress-tolerant traits across the early Pleistocene randomly sampled 10 networks varies, but stress-tolerant traits are present across all the modules, apart from the competitive module (Supplementary Fig. 2). Between the late Pliocene and early Pleistocene, large diameter corallites increased in node degree, while intracalicular budding decreases (Table 2), both traits are related to stress tolerance.
The change in trait communities between the late Pliocene and early Pleistocene is substantial (Fig. 7C). The first two PCA axes accounted for 41.50% of the variation (PC 1, 25.83%; PC 2, 15.67%) (Fig. 7C). There was an increase in trait community hull area from the late Pliocene (33.55) to the early Pleistocene (56.46) (Fig. 7C). The first two PCoA axes account for 70.32% of the variation in trait communities (PCoA 1, 47.81%; PCoA 2, 22.51%) (Fig. 7D). There was a decrease in functional richness between the two epochs, with the late Pliocene occupying 100% and the early Pleistocene occupying 94% of the overall functional richness (Fig. 7C). The decrease in functional richness was driven by a decrease in corallite integration traits 1 (deandroid) and extracalicular budding in the early Pleistocene (Fig. 7C).
Discussion
Our results support previous findings that periods of species turnover were evident throughout the Cenozoic (Eocene–Pleistocene), with the largest of these occurring between the Eocene and Oligocene, early and late Miocene, and late Pliocene to early Pleistocene, following environmental cooling and biogeographic changes (Budd Reference Budd2000; Scheibner and Speijer Reference Scheibner and Speijer2008; Budd et al. Reference Budd, Klaus and Johnson2011; Yasuhara et al. Reference Yasuhara, Huang, Reuter, Tian, Cybulski, O’Dea, Mamo, Cotton, Di Martino and Feng2022; Figs. 3, 4). Turnover in traits occurred at two of the three boundaries: the Eocene/Oligocene transition and the late Pliocene/early Pleistocene transition (Fig. 4, Supplementary Fig. 1). Changes in trait abundances and trait–trait relationships were observed in all three transitions, indicating ecosystem-wide transformations of coral reef composition and function (Figs. 5–7). The changing environmental conditions and increasing isolation of the Caribbean Sea selected for competitive (r-selected) life-history traits within reef-building corals, due to the variable environment, favoring morphological characteristics associated with faster growth and photosymbiosis over heterotrophy (Figs. 5–7). This view suggests a similar expansion of photosymbiosis in response to cooling climates, as observed in the Triassic (Kiessling Reference Kiessling2010), potentially making their modern descendants less resilient to current increases in SST (Purvis et al. Reference Purvis, Gittleman, Cowlishaw and Mace2000; Roff Reference Roff2021).
Species and Trait Turnover across the Eocene to Oligocene Cooling Period
All metrics indicate the highest turnover in species occurred between the Eocene and the Oligocene (Fig. 3). The high SST, sea level, and primary productivity in the Eocene favored algal reefs (Scheibner and Speijer Reference Scheibner and Speijer2008; Mutti et al. Reference Mutti, Piller and Betzler2011; Takayanagi et al. Reference Takayanagi, Iryu, Oda, Sato, Chiyonobu, Nishimura, Nakazawa, Ishikawa and Nagaishi2012), which would have outcompeted corals for space (Sandin and McNamara Reference Sandin and McNamara2012). As described by Yasuhara et al. (Reference Yasuhara, Huang, Reuter, Tian, Cybulski, O’Dea, Mamo, Cotton, Di Martino and Feng2022), the move toward cooler conditions in the Oligocene caused a decrease in the diversity of larger benthic foraminifera but allowed for coral reef species diversification (Fig. 3). It is, however, important to consider that the Eocene occurrence records contained fewer collections than the Oligocene (PBDB, https://www.paleobiodb.org, accessed 1 October 2022), potentially influencing the lower number of species we reported in the Eocene. However, most corals currently live less than 2°C below their thermal limits, with temperatures between 27°C and 37°C leading to coral bleaching and mortality (Anton et al. Reference Anton, Randle, Garcia, Rossbach, Ellis, Weinzierl and Duarte2020). Given that SSTs were ~33°C during the Eocene (Cramer et al. Reference Cramer, Miller, Barrett and Wright2011), fewer species were likely present in the Caribbean during the Eocene. High species dissimilarity (Fig. 4, Supplementary Fig. 1) indicates that the large architectural reefs of the Oligocene were not solely the result of increased growth rates of all existing Caribbean species (Johnson et al. Reference Johnson, Jackson and Budd2008, Reference Johnson, Sánchez-Villagra and Aguilera2009), but a turnover in species from those adapted to extreme heat to cooler-adapted species.
Trait turnover occurs alongside species turnover during the Eocene–Oligocene cooling period (Fig. 5). Traits related to stress tolerance appear more important in the Eocene (Fig. 5A), with stress-tolerant coral species being better equipped to withstand the heat of the Eocene and survive in deeper water (Lesser et al. Reference Lesser, Slattery and Mobley2021). One way stress-tolerant coral achieve this is by having larger diameter corallites, which are better adapted for heterotrophy, making them less reliant on their symbionts, which would be vulnerable to such high temperatures (Crabbe and Smith Reference Crabbe and Smith2006; Conti-Jerpe et al. Reference Conti-Jerpe, Thompson, Wong, Oliveira, Duprey, Moynihan and Baker2020; Dimitrijević et al. Reference Dimitrijević, Raja and Kiessling2024). As temperatures decreased during the Oligocene, corals benefited from adopting a competitive life-history strategy, facilitating the formation of large architectural reefs in shallow waters (Johnson et al. Reference Johnson, Jackson and Budd2008, Reference Johnson, Sánchez-Villagra and Aguilera2009; Yasuhara et al. Reference Yasuhara, Huang, Reuter, Tian, Cybulski, O’Dea, Mamo, Cotton, Di Martino and Feng2022). Competitive corals thrive in such shallow, high-light conditions (Baird and Hughes Reference Baird and Hughes2000; Darling et al. Reference Darling, Alvarez-Filip, Oliver, McClanahan and Côté2012). Although many competitive traits have been linked to increased extinction risk (Raja et al. Reference Raja, Lauchstedt, Pandolfi, Kim, Budd and Kiessling2021) in a warming world, the opposite is likely true in the Eocene–Oligocene cooling period.
The decrease in both trait community hull space and trait space between the Eocene and Oligocene epochs indicates that communities became more cosmopolitan in the Oligocene (Fig. 7), a parallel with contemporary homogenization of coral communities due to climate change (Stuart-Smith et al. Reference Stuart-Smith, Mellin, Bates and Edgar2021). Increases in both competitive and stress-tolerant traits are correlated with the change in community hull space between the Eocene and Oligocene, along with reductions in encrusting solitary corals (Fig. 7A), indicating a general increase in functional diversity across the Eocene/Oligocene transition.
Species and Trait Turnover across the early Miocene–late Miocene Period of Increased Biogeographic Isolation
Species turnover is also apparent between the early and late Miocene (Fig. 3), which coincides with decreases in carbon dioxide (CO2) and SST and a jump in community dissimilarity (Fig. 1) (Edinger and Risk Reference Edinger and Risk1994; Miller et al. Reference Miller, Browning, Schmelz, Kopp, Mountain and Wright2020; Roff Reference Roff2021). Tectonic changes throughout the Miocene leading to the closure of the Central American Seaway (CAS), which previously separated North and South America, shifted currents and increased upwelling in the Caribbean, restricting corals to marginal environments and reducing reef-building (Roff Reference Roff2021; Yasuhara et al. Reference Yasuhara, Huang, Reuter, Tian, Cybulski, O’Dea, Mamo, Cotton, Di Martino and Feng2022). Caribbean corals also became increasingly isolated during the Miocene, due to the closure of the Tethys Sea (now the Mediterranean) (Yasuhara et al. Reference Yasuhara, Huang, Reuter, Tian, Cybulski, O’Dea, Mamo, Cotton, Di Martino and Feng2022), with species turnover at this time leading to the evolution of many modern Caribbean coral ancestors (Johnson and Kirby Reference Johnson and Kirby2006).
Our results indicate that rather than the expected simplification of coral communities, the biogeographic changes of the Miocene became the force that drove the separation of the two life-history strategies: competitive and stress tolerant (Fig. 6A,B). Although there was minimal trait turnover across the early to late Miocene (Fig. 4), there was a change in trait abundances (Fig. 6D) during species turnover, leading to a change in trait–trait relationships. A lack of data availability for the middle Miocene means that part of the story may be missing, where trait turnover potentially may have occurred between the middle and late Miocene.
Species and Trait Turnover across the late Pliocene–early Pleistocene Regional Extinction Event
The coral communities during final four sub-epochs (early Pliocene, late Pliocene, early Pleistocene, and late Pleistocene) of the Cenozoic appear to be very similar, as seen from their proximity to each other in the bipartite network (Fig. 3A). The decrease in temperature and sea level across the early Pliocene to the late Pleistocene (Fig. 1) potentially pushed some of the remaining coral species below their thermal optima, with the increased isolation also contributing to community simplification (O’Dea et al. Reference O’Dea, Lessios, Coates, Eytan, Restrepo-Moreno, Cione, Collins, De Queiroz, Farris and Norris2016; Roff Reference Roff2021). Many extant species first appeared during the Pliocene and Pleistocene epochs (Fig. 3A), caused by the increasing isolation of the Caribbean, restricting gene flow from other seas (Jackson et al. Reference Jackson, Kirby, Berger, Bjorndal, Botsford, Bourque, Bradbury, Cooke, Erlandson and Estes2001). As expected, a reduction in species richness can also be seen across the Pliocene/Pleistocene boundary, due to the regional extinction event between the late Pliocene and early Pleistocene (O’Dea et al. Reference O’Dea, Jackson, Fortunato, Smith, D’Croz, Johnson and Todd2007). Although there is little evidence of a global coral extinction event between the late Pliocene and early Pleistocene, there were other marine extinction events, such as the Pliocene megafauna extinctions (Pimiento et al. Reference Pimiento, Griffin, Clements, Silvestro, Varela, Uhen and Jaramillo2017) and possibly wider marine invertebrate extinctions (Pimiento et al. Reference Pimiento, Bacon, Silvestro, Hendy, Jaramillo, Zizka, Meyer and Antonelli2020). Therefore, a combination of environmental factors, increasing isolation, and tectonic activity appears to have shaped the Caribbean coral community into the communities with low species richness of today.
Our findings confirm that Acropora became the dominant coral genus during the late Pliocene–early Pleistocene regional extinction event, as evidenced by competitive modules in the trait–trait networks from both periods (Fig. 7A,B). This aligns with existing research (Klaus et al. Reference Klaus, McNeill, Budd and Coates2012; Renema et al. Reference Renema, Pandolfi, Kiessling, Bosellini, Klaus, Korpanty, Rosen, Santodomingo, Wallace, Webster and Johnson2016). Stress-tolerant traits are still present within the late Pliocene and early Pleistocene networks, but they no longer form stress-tolerant modules in either epoch (Fig. 7A,B), indicating a shift toward versatile communities with mixed types of traits. The reduction in CO2, SST, and sea level throughout the Cenozoic, along with the closing of the Isthmus of Panama and isolation of the Caribbean Sea, appears to have selected for traits that are less resilient to environmental change in comparison to other reefs (e.g., Indo-Pacific reefs) (Roff Reference Roff2021). The Acropora species that are still extant in the Caribbean today (A. palmata and A. cervicornis) are large and branching but also very long-lived (Johnson et al. Reference Johnson, Budd and Stemann1995). Both Acropora species rely on asexual reproduction, which although useful, as fragmentation allows for quick repopulation of a reef following storm events, has contributed to lower genetic diversity on Caribbean reefs (Baums et al. Reference Baums, Miller and Hellberg2006, Reference Baums, Devlin-Durante, Polato, Xu, Giri, Altman, Ruiz, Parkinson and Boulay2013; Roff Reference Roff2021). This low genetic diversity may have made them more susceptible to disease and other stressors (Baums et al. Reference Baums, Miller and Hellberg2006; Brown et al. Reference Brown, Anastasiou, Schul, MacVittie, Spiers, Meyer, Manfrino and Frazer2022). The majority of Acropora species suffered losses during the 1970s and 1980s, leaving Caribbean reefs dominated by “weedy” brooding species whose low reproductive outputs make repopulating the reef difficult (McWilliam et al. Reference McWilliam, Hoogenboom, Baird, Kuo, Madin and Hughes2018). By contrast, in the Indo-Pacific, functional redundancy of Acropora species is much higher (Roff and Mumby Reference Roff and Mumby2012), and Indo-Pacific reefs appear to have better recovery rates following bleaching than their Caribbean counterparts (Roff Reference Roff2021). Similarly, we posit that species with these traits will struggle to survive or recover from the current climate crisis (Renema et al. Reference Renema, Pandolfi, Kiessling, Bosellini, Klaus, Korpanty, Rosen, Santodomingo, Wallace, Webster and Johnson2016; Enríquez et al. Reference Enríquez, Méndez, Hoegh-Guldberg and Iglesias-Prieto2017).
The dominant Acropora species in the Pleistocene, which were the ancestors of many modern Caribbean corals, had small corallite diameters and a moderately high level of corallite integration, associated with a reliance on photosynthetic hypertrophy (Crabbe and Smith Reference Crabbe and Smith2006; Stanley et al. Reference Stanley, Shepherd and Robinson2018; Dimitrijević et al. Reference Dimitrijević, Raja and Kiessling2024). These species have a low heat tolerance because, during periods of extreme heat, the concentration of endosymbiotic algae within a coral is reduced, potentially leading to the coral’s mortality if it cannot switch to heterotrophy for carbon assimilation (Hughes and Grottoli, Reference Hughes and Grottoli2013). They were also branching and, therefore, fast growing (Renema et al. Reference Renema, Pandolfi, Kiessling, Bosellini, Klaus, Korpanty, Rosen, Santodomingo, Wallace, Webster and Johnson2016; Roff Reference Roff2021), which allowed them to survive the Pleistocene by outcompeting for space on the reef, but may now be detrimental, as fast growth requires a lot of energy, making them less able to respond to stress (Pinzón et al. Reference Pinzón, Dornberger, Beach-Letendre, Weil and Mydlarz2014).
The increase in community dissimilarity and trait diversity (Fig. 7C,D) across the late Pliocene and early Pleistocene may help to explain why we observe trait turnover, but not species turnover (Fig. 4, Supplementary Fig. 1), as this indicates species abundances changed rather than the loss or gain of species occurring (Fig. 7C,D). However, the trait–trait networks for the early Pleistocene show trait modules to be more interconnected, indicating greater similarity across communities. This is supported by the known reduction in species richness following the late Pliocene–early Pleistocene extinction event (Budd et al. Reference Budd, Klaus and Johnson2011). Four often co-occurring traits drive the increase in community dissimilarity, suggesting an increase in corals that are platy growing, form colonies with asteroid or thamnasteriod integration, reproduce asexually via both budding types, and have large-diameter corallites (Fig. 7B,C). The four traits are only found together in Mycetophyllia species. Two species of Mycetophyllia were recorded in the late Pliocene occurrence records and six in the early Pleistocene, which potentially explains the increase in these traits driving the change in community dissimilarity. Another factor to consider is the lack of species abundance data available in the fossil record, as our analysis uses coral species presence/absence and Mycetophyllia species are currently rare (Moulding and Ladd Reference Moulding and Ladd2022). The lack of abundance information makes these traits (platy colony growth form, budding both, corallite integration 5 (asteroid/thamnasteroid)) appear more important in the communities than they are.
Implications for Coral Paleobiology
Our results indicate very little change in species richness across the Cenozoic, with some increase toward the end of the Cenozoic, which supports previous findings (Budd Reference Budd2000). Budd (Reference Budd2000) found increases in species diversity to coincide with species turnover across the middle–late Eocene, late Oligocene–early Miocene, and Pliocene–Pleistocene. As we did not split up the Eocene, we were not able to detect turnover between the middle and late Eocene. We also found turnover between the Oligocene and early Miocene (Fig. 4, Supplementary Fig. 1); this period of turnover is well documented (Edinger Reference Edinger1991; Edinger and Risk Reference Edinger and Risk1994; Budd Reference Budd2000; Johnson et al. Reference Johnson, Jackson and Budd2008, Reference Johnson, Sánchez-Villagra and Aguilera2009; Budd et al. Reference Budd, Klaus and Johnson2011; Wallace and Bosellini Reference Wallace and Bosellini2015). However, we detected higher species dissimilarity between the early and late Miocene. The drop in dissimilarity following the Miocene supports the theory that biogeographic isolation was a major driver of coral diversity reduction due to a loss of gene flow from the Mediterranean (Rosen Reference Rosen1984; Budd Reference Budd2000; O’Dea et al. Reference O’Dea, Dillon, Altieri and Lepore2017; Roff Reference Roff2021; Steinthorsdottir et al. Reference Steinthorsdottir, Coxall, de Boer, Huber, Barbolini, Bradshaw and Burls2021). Our results also support high turnover across the Pliocene/Pleistocene boundary, where the regional extinction event reduced coral abundance and diversity (Johnson et al. Reference Johnson, Budd and Stemann1995; Budd Reference Budd2000). Although the species turnover across the Pliocene/Pleistocene boundary was not as high as across the Eocene/Oligocene boundary, trait turnover was higher, supporting theories that regional extinction events are not random but trait-based (van Woesik et al. Reference Woesik, Franklin, O’Leary, McClanahan, Klaus and Budd2012).
Implications for Modern Caribbean Corals
We have shown that as biogeographic isolation and global cooling increased throughout the Cenozoic, selection pressure favored a competitive life-history strategy, leading to the subsequent dominance of Acropora in the Pleistocene. This selection pressure may have caused the lack of resilience in modern Caribbean corals (Roff Reference Roff2021). Acropora and other similar corals have high disease susceptibility and high sensitivity to bleaching, making their survival in a now-warming world challenging (McWilliams et al. Reference McWilliams, Côté, Gill, Sutherland and Watkinson2005; Roff Reference Roff2021). Modern Caribbean reefs lack the abundance and diversity of Acropora species due to heat stress and anthropogenic disturbance (Cramer et al. Reference Cramer, Jackson, Donovan, Greenstein, Korpanty, Cook and Pandolfi2020, Reference Cramer, Donovan, Jackson, Greenstein, Korpanty, Cook and Pandolfi2021).
With temperatures predicted to rise by up to 4°C by 2100 (IPCC 2023) and with coral communities shifting toward stress tolerance (Cramer et al. Reference Cramer, Donovan, Jackson, Greenstein, Korpanty, Cook and Pandolfi2021), reefs of the future might resemble Eocene ones: stress tolerant, homogenized, and non-architectural. As the world cooled from “greenhouse” to “icehouse” over the last ~ 40 Myr, trait selection and evolution occurred slowly over time, with only a few intense transient phases (Norris et al. Reference Norris, Turner, Hull and Ridgwell2013). With modern environmental changes occurring rapidly and the corals’ ability to adapt to rising temperatures highly uncertain (Cramer et al. Reference Cramer, Donovan, Jackson, Greenstein, Korpanty, Cook and Pandolfi2021), ongoing and future severe declines in Caribbean coral communities are almost inevitable.
Conclusion
In conclusion, our findings support existing knowledge on coral species diversity changes and provide new insight into trait turnover across the Cenozoic. We identified trait co-occurrence modules integral to coral survival throughout the Cenozoic: competitive and stress tolerant. These two alternative life-history strategies are recognized as successful approaches for coral communities to persist in the face of predicted disturbance events (Kubicek et al. Reference Kubicek, Breckling, Hoegh-Guldberg and Reuter2019). We have also shown that environmental and biogeographic changes often leads to the simplification and homogenization of coral communities, a phenomenon that continues in the Caribbean today in response to climate change and anthropogenic disturbance (Pawlik and Loh Reference Pawlik and Loh2017; Estrada-Saldívar et al. Reference Estrada-Saldívar, Jordán-Dalhgren, Rodríguez-Martínez, Perry and Alvarez-Filip2019). The protracted fall in ocean temperatures and increasing geographic isolation throughout the Cenozoic appear to have selected for traits less resilient to heat stress (e.g., branching, small diameter, extracalicular budding), setting up the Caribbean’s coral reefs for failure in the current and predicted climate crisis, where species with competitive life histories will struggle to survive or recover.
Acknowledgments
This research was funded by the Leverhulme Trust Extinction Studies Doctoral Training Programme.
Competing Interests
The authors declare no conflicts of interest.
Data Availability Statement
All data used are from the Paleobiology Database (https://www.paleobiodb.org). Data and code are available in the Supplementary Material available from the Dryad Digital Repository: https://doi.org/10.5061/dryad.hmgqnk9wn.



 Open access

