Malnutrition-induced stunted growth is common in developed as well as non-developed countries. In underprivileged societies, it is mainly the result of inadequate food supply complicated by recurrent infections, whereas in the developed world it occurs usually as a consequence of insufficient nutrient intake as well as inadequate absorption due to the presence of a chronic disease. The correction of the underlying disease is usually followed by adequate nutritional intake and spontaneous catch-up (CU) growth. CU growth is defined as ‘height velocity above the normal statistical limits for age and/or maturity during a defined period of time, following a transient period of growth inhibition’( Reference Boersma, Houwen and Blum 1 ). Occasionally, however, recovery is incomplete, leading to a permanent growth deficit and short stature. Therefore, means to increase the efficiency of this process are clearly required. On the other hand, adults who have had fast CU growth as children experience increased risk of metabolic diseases as adults( Reference Barker 2 ). Therefore, any mean developed for robust CU growth should also be tested for safety.
In most Western countries, dairy products are recommended for children during their growth period and later on for adults engaged in intense sport activities. The growth-supporting nutrients contained in milk include high-quality proteins and Ca. The two most prevalent categories of milk proteins are casein and whey. Casein is the milk fraction that contains water-insoluble proteins and consists of a family of phosphoproteins( Reference Kunz and Lonnerdal 3 ); whey is the water-soluble fraction of proteins and it consists of several globular proteins including β-lactoglobulin, α-lactalbumin, serum albumin and others. Both casein and whey contain all essential amino acids( Reference Molgaard, Larnkjaer and Arnberg 4 ). The involvement of milk and casein in growth has been suggested by studies showing the positive effect on growth in childhood and also during adolescence( Reference Hoppe, Molgaard and Michaelsen 5 ).
The ratio of casein:whey, the two most prevalent milk proteins, differs between human milk and cow milk used in infant formulae. The aim of the present study was to determine whether the different types of milk protein ingested (the whey fraction v. the casein fraction) influence differently the efficiency of the CU growth in terms of longitudinal growth, weight gain and bone quality. Specifically, we evaluated the longitudinal growth of the long bones of pre-pubertal rats fed a restricted diet followed by re-feeding with a vegetarian source of protein (standard rat chow) or with iso-energetic, iso-protein diets containing the milk proteins casein or whey. All other ingredients (maize starch, sucrose, cellulose, soyabean oil and vitamins and minerals including calcium carbonate and calcium phosphate) were identical in the casein and whey diets and similar to the standard rat chow (online Supplementary Table S1). In addition, as our previous experiments on CU growth showed a dramatic effect on bone quality, defined as bone resistance to fractures, at least in the short-term re-feeding period( Reference Pando, Masarwi and Shtaif 6 ), we decided to check the effect of the different diets after a re-feeding period on bone microarchitecture and biomechanical properties using microcomputed tomography (µCT)( Reference Bouxsein, Boyd and Christiansen 7 ) and biomechanical tests( Reference Shipov, Sharir and Zelzer 8 ).
Methods
Animals
All the experiments were performed on pre-pubertal 24-d-old male Sprague–Dawley rats of an average weight of 50 g (Harlan Laboratories Ltd). All animals were maintained under the same experimental conditions: mean ambient temperature of 25±1°C, mean relative humidity of 50±2) % and 12 h light–12 h dark cycle, with lights off at 18.00 hours. All had free access to unfiltered regular tap water, and all were fed the same commercial rat chow during the food-restriction period (Teklad Rodent Diet (2018SC), 12·9 kJ (3·1 kcal/g) (metabolisable energy); Teklad (now a part of Envigo)). Rats were maintained separately in single cages at the animal care facility of the Felsenstein Medical Research Center (FMRC) to allow monitoring of food intake. Animals were observed daily, and none of them showed signs of disease throughout the study, apart from restlessness and slight aggressiveness during the food-restriction period. All the experiments were approved by the Tel Aviv University Institutional Animal Care and Use Committee (committee protocol approval number M-12096), to which the FMRC is affiliated. Body weight and food consumption were measured daily.
Dietary manipulation
At the age of 24 d, after 3 d of acclimatisation to the solitary cages, rats were randomly divided into two groups: a control group fed ad libitum, which had unlimited access to regular (natural ingredient grain-based (vegetarian protein)) rat chow (AL group, n 5), and a restricted group fed 60 % of the normal daily intake of the same chow( Reference Even-Zohar, Jacob and Amariglio 9 ). On day 36, the restricted group was further divided into four groups: continued restriction (RES group, n 7) or unrestricted re-feeding with one of three types of similar energetic and protein content – regular rat chow (CU group, n 6), iso-energetic, iso-protein milk protein based-purified diet, in which the only protein was casein (Casein diet=TD.120604; Cas group, n 7), or whey (whey diet=TD.120605; Whey group, n 7). Animals were re-fed for 24 d (short-term experiment) following restriction (Fig. 1(a)). All the diets were provided by Teklad (online Supplementary Table S1).
Time frame of the short- and long-term (LT) experiments. Male rats (24 d old) were subjected to 36 d of 40 % food restriction followed by (a) 24 d or (b) 40 d of re-feeding with normal chow or milk-protein-based chow. AL (![]() , ad libitum) controls fed regular chow; RES, (
, ad libitum) controls fed regular chow; RES, (![]() , restriction) restricted to 60 % of daily intake of regular chow; CU, (catch-up) re-fed regular chow; Cas, (
, restriction) restricted to 60 % of daily intake of regular chow; CU, (catch-up) re-fed regular chow; Cas, (![]() , casein) re-fed casein-formulated chow; whey, (
, casein) re-fed casein-formulated chow; whey, (![]() , whey) re-fed whey-formulated chow.
, whey) re-fed whey-formulated chow.

Prompted by our finding of greater height of the epiphyseal growth plate (EGP) in animals re-fed a casein- or whey-formulated diet than in animals re-fed regular chow (see results), we repeated the study with a prolonged re-feeding period of 40 d (Fig.1(b)), essentially as described above, apart from the following: (1) the re-feeding period was extended to 40 d; (2) no restricted group was included and (3) the Whey and Cas diet groups were enlarged to ten animals each (long-term (LT) experiment; all groups marked with LT).
Serum analysis
All rats were euthanised by CO2 inhalation at the end of the experimental period and blood was collected by cardiac puncture. Serum was separated by centrifugation at 1500 rpm (239 g ) in a Rotina 46 R centrifuge (Hettich) for 10 min at 4°C and stored at −70°C. For the short-term experiment only, serum levels of total Ca, P and total alkaline phosphatase (ALP) were measured using a Beckman Coulter analyzer (AU 680; Beckman Coulter International). For both the short- and long-term experiments, serum levels of insulin-like growth factor-I (IGF-I), leptin and osteocalcin (OC, bone γ-carboxyglutamic acid-containing protein) were determined using commercial kits according to the manufacturer’s recommendations as follows: Quantikine Mouse/Rat IGF-I assay kit, detection limit 8·4 pg/ml (cat. no. MG100; R&D Systems); Rat Leptin ELISA kit, detection limit 22 pg/ml (Millipore); and rat osteocalcin (OC) ELISA assay kit, detection limit 0·5 ng/ml (cat. no. EIA-2095; DRG International Inc.).
Histological staining and measurement of growth plate height
Tibiae and humeri of each animal were carefully removed, cleaned and measured for length using a digital calliper. Tibiae were fixed in 4 % neutral buffered formalin for 48 h at room temperature, decalcified with EDTA and HCl (Calci-Clear Rapid, cat. no. HS-105; National Diagnostics) for 7 h, dehydrated with a graded ethanol series (70, 95, 100 %) and stabilised by two sequential changes of chloroform for paraffin embedding. Histological studies and EGP height measurements were performed on paraffin sections of 5-μm thickness, photographed under the Olympus BX40 microscope using a Olympus DP71 camera and analysed using Image-Pro software (version 4.5.1.22; Media Cybernetics Inc.).
Microcomputed tomography analysis
Humeri were maintained in 4 % neutral buffered formalin for 48 h at room temperature and then stored in 70 % ethanol. The entire right humerus was scanned using a µCT system (μCT50; Scanco Medical AG). When the right-side sample was not intact, the left one was used instead. Scans were acquired at 90 kVp, 200 µA and 1000 ms for energy, intensity and integration time, respectively, generating images with an isotropic nominal resolution of 17·2 µm; two-dimensional CT images were reconstructed in 2048×2048 pixel matrices using a standard convolution-backprojection procedure (Scanco uct_reconstruction version 6.1). A three-dimensional (3D) Gaussian filter was used to attenuate the background noise in the volumes (σ=0·8; support=1). The scans were segmented using a global thresholding procedure (trabecular attenuation=130; cortical attenuation=200, in permille of the total grey value range). Morphometric parameters were determined using a direct 3D approach( Reference Muller and Ruegsegger 10 ) in three different pre-selected analysis regions using customised software developed on the proprietary Image processing Language version 5.15 (Scanco Medical). In the whole bone, we measured humerus length and apparent volume density (AVD)( Reference Alexander, Bab and Fish 11 ). The AVD is calculated as the bone volume fraction (bone volume (BV)/total volume (TV), %) for the entire bone and provides a non-discriminatory AVD assessment similar to bone mineral density determination by dual-energy X-ray absorptiometry( Reference Alexander, Bab and Fish 11 ). In the cortical bone, we used a 1-mm-height diaphyseal segment starting at the 6th tenth of the total length (slightly distal to the midshaft). Cortical measurements included total area (Tt.Ar, mm2), cortical area (Ct.Ar, mm2), cortical area fraction (Ct.Ar/Tt.Ar, %) and cortical thickness (Ct.Th, mm). To analyse the trabecular bone, we used the secondary spongiosa of the proximal metaphysis of the humerus, separated manually from the cortical bone by tracing the endosteal surface on the axial 2D tomographical slices. Measurements included bone volume fraction, trabecular number (Tb.N, mm−1), trabecular thickness (Tb.Th, mm) and trabecular separation (Tb.Sp, mm).
Biomechanical analysis
Humeri specimens were re-hydrated in PBS to restore the mechanical properties of the tissue 24 h before biomechanical testing( Reference Gabet, Kohavi and Voide 12 ). The three-point bending test was performed using a loading machine (model 4502; Instron) equipped with a 100 N load cell at a cross-head speed of 1 mm/min. The bone specimens were placed in a custom-made device with a span length of 20 mm and loaded until failure, and force v. deflection data were acquired automatically. The load-deflection curve yielded three parameters for evaluation: total energy (Nmm) applied on the bone up to ultimate/fracture load, calculated by the AUC; ultimate load (N); and bending stiffness (N/mm), calculated as the slope of the load-deflection curve at its linear portion.
Statistical analysis
Data are presented as means and standard deviations. The significance of differences between experimental groups was determined by one-way ANOVA with Tukey’s post hoc test (multiple groups). Differences in weight were analysed with repeated-measures ANOVA. Differences between the casein and whey groups were studied using Student’s t test (online Supplementary Table S2). SPSS® version 21 (IBM) software was used for data collection and analysis. Differences were considered statistically significant at P<0·05.
Results
Food consumption and body weight
In the 24-d study, although all groups showed steady growth with regard to daily measurements of body weight, the RES group, maintained on a restricted diet throughout the short-term experiment, had a significantly lower average weight than the other groups. During the 24 d of re-feeding, there were no differences in food consumption among the rats re-fed casein-formulated (Cas) or whey-formulated (Whey) chow (cumulative food consumption for the whole duration was 363·82 (sd 41·17) v. 327·56 (sd 56·10) g in the Casein and whey groups, respectively; P=0·36). Their body weight significantly increased relative to the RES group (Fig. 2(A)) but was still substantially lower than that of the control group (fed ad libitum, AL) fed normal amounts of regular chow throughout the study. Following re-feeding, body weight increase was similar in the Cas and Whey groups and lower compared with the CU (Fig. 2). When comparing the Cas and Whey groups, we found that the final body weight was significantly lower in the Whey group (see online Supplementary Table S2).
Animal body weight. Rat body weight after 36 d of food restriction and (A) 24 d or (B) 40 d of re-feeding with different protein-based chow. Values are means and standard deviations. In each part, analyses were carried out separately by repeated measures (two-way ANOVA). a,b,c,d Mean values within the graphs with same letters were not significantly different (P<0·05). AL (ad libitum) controls fed regular chow; RES, (restriction) restricted to 60 % of daily intake of regular chow; CU, (catch-up) re-fed regular chow; Cas, (casein) re-fed casein-formulated chow; whey, (whey) re-fed whey-formulated chow; ![]() , AL;
, AL; ![]() , RES;
, RES; ![]() , CU;
, CU; ![]() , Cas;
, Cas; ![]() , Whey;
, Whey; ![]() , LT-AL;
, LT-AL; ![]() , LT-CU;
, LT-CU; ![]() , LT-Cas;
, LT-Cas; ![]() , LT-Whey. Insets show the weight throughout the experiment.
, LT-Whey. Insets show the weight throughout the experiment.

After 40 d of re-feeding, none of the re-fed groups reached the weight of the LT-AL group at the same time point. Mean body weight after 40 d of re-feeding was similar in animals in the LT-CU and LT-Cas groups and was significantly lower in the LT-Whey group (Fig. 2(B)) (cumulative food consumption for the whole duration of the re-feeding period was similar: LT-Cas and LT-Whey 783 (sd 57·2) v. 727·2 (sd 72·5), respectively; P=0·56).
Humerus length and growth plate height
Following 24 d of re-feeding, the average humerus length was significantly greater in the AL group and significantly lower in the RES group than in all the other groups (Fig. 3(A)). Re-feeding led to CU growth. The humerus was longer in the re-fed groups than in the RES group, and tibial EGP height (Fig. 4(A)) was significantly greater in the re-fed groups than in both the AL and the RES groups. Interestingly, on comparison of the three re-fed groups, EGP height was greater in the Cas and Whey groups than in the CU group (suggesting better growth potential; Fig. 4 and 5). Analysis of the different zones of the EGP showed that the hypertrophic zone was the most affected, with number of cells/column, the height of the hypertrophic zone and the height of the individual cells being significantly greater in the re-fed groups compared with the AL. The Cas and Whey groups showed an even greater hypertrophic cell number and zone height (Fig. 6(A)–(C)).
Effect of re-feeding on Humerus length. Humerus length following 36 d of food restriction and (A) 24 d or (B) 40 d of re-feeding. In each part, analyses were carried out separately by one-way ANOVA. Values are means and standard deviations. a,b,c Mean values within the graphs with same letters were not significantly different (P<0·05). Note the lack of significant difference in humerus length among the re-fed groups in the short-term experiments and the significantly lower bone length in the re-fed groups compared with the AL group in both the short- and long-term experiments. AL (ad libitum) controls fed regular chow; RES, (restriction) restricted to 60 % of daily intake of regular chow; CU, (catch-up) re-fed regular chow; Cas, (casein) re-fed casein-formulated chow; whey, (whey) re-fed whey-formulated chow; LT, long term.

Effect of re-feeding on epiphyseal growth plate (EGP) height. Height of the EGP following 36 d of food restriction and (A) 24 d or (B) 40 d of re-feeding. In each part, analyses were carried out separately by one-way ANOVA. Values are means and standard deviations. a,b,c,d Mean values within the graphs with same letters were not significantly different (P<0·05). Note the significantly lower EGP height in the AL and RES groups compared with the re-fed groups. AL (ad libitum) controls fed regular chow; RES, (restriction) restricted to 60 % of daily intake of regular chow; CU, (catch-up) re-fed regular chow; Cas, (casein) re-fed casein-formulated chow; whey, (whey) re-fed whey-formulated chow; LT, long term.

Representative stained sections of the epiphyseal growth plate (EGP) in all groups (short- and long-term (LT) experiments). Haematoxylin–eosin and alcian blue staining shows the margins of the cartilaginous EGP (magnification ×4; six sections measured in each group). AL (ad libitum) controls fed regular chow; RES, (restriction) restricted to 60 % of daily intake of regular chow; CU, (catch-up) re-fed regular chow; Cas, (casein) re-fed casein-formulated chow; whey, (whey) re-fed whey-formulated chow.

Effect of re-feeding on the hypertrophic zone of the epiphyseal growth plate (EGP). Number of hypertrophic cells/column (A,D); height of the hypertrophic zone (B,E) or individual hypertrophic chondrocyte cell height (C,F) following 36 d of food restriction and (A–C) 24 d or (D–E) 40 d of re-feeding. In each part, analyses were carried out separately by one-way ANOVA. Values are means and standard deviations. a,b,c Mean values within the graphs with same letters were not significantly different (P<0·05). AL (ad libitum) controls fed regular chow; CU, (catch-up) re-fed regular chow; Cas, (casein) re-fed casein-formulated chow; whey, (whey) re-fed whey-formulated chow.

At 40 d, humerus length was significantly greater in the LT-AL group than in all three re-fed groups (Fig. 3(B)), indicating incomplete CU growth. When comparing the humerus length of the LT-Cas and LT-Whey groups, we found that it was significantly longer in the LT-Cas compared with the LT-Whey group (see online Supplementary Table S2). Tibial EGP height was significantly greater in the LT-Cas and LT-Whey groups than in the LT-AL group (Fig. 4(B) and 5), a finding we attributed to age-related shrinkage of the EGP in the LT-AL group. The EGP was significantly higher in the LT-Whey than in the LT-CU group.
The hypertrophic zone and cell number at this time point were still higher in the LT-Cas and LT-Whey groups compared with LT-AL and LT-CU. However, the height of the individual hypertrophic chondrocytes was similar in all groups (Fig. 6(D)–(F)).
Bone parameters (microcomputed tomography analysis)
Full bone
AVD in the short-term study was significantly higher in the AL group than in all the other groups (Table 1a). The CU group showed a significant, although partial, recovery of full bone AVD, whereas the Cas group showed no difference, and the Whey group had an even lower AVD than the RES group.
Bone parameters microcomputed tomography (µCT) and biomechanical properties (three-point bending test) in male Sprague–Dawley rats following food restriction and 24 d of re-feeding with vegetable-protein-based or milk-protein-based chow (Mean values and standard deviations)

AL (ad libitum) controls fed regular chow; RES, (restriction) restricted to 60 % of daily intake of regular chow; CU, (catch-up) re-fed regular chow; Cas, (casein) re-fed casein-formulated chow; whey, (whey) re-fed whey-formulated chow; Tt.Ar, total area; Ct.Ar, cortical area; Ct.Ar/Tt.Ar, cortical area fraction; Ct.Th, cortical thickness; BV/TV, bone volume/total volume; Tb.Th, trabecular thickness; Tb.N, trabecular number; Tb.Sp, trabecular separation.
a,b,c,d Mean values within a column with same superscript letters were not significantly different (P<0·05).
* Toughness (AUC), stiffness (slope of the load-deflection curve) and ultimate load (the maximal load in N).
Cortical bone
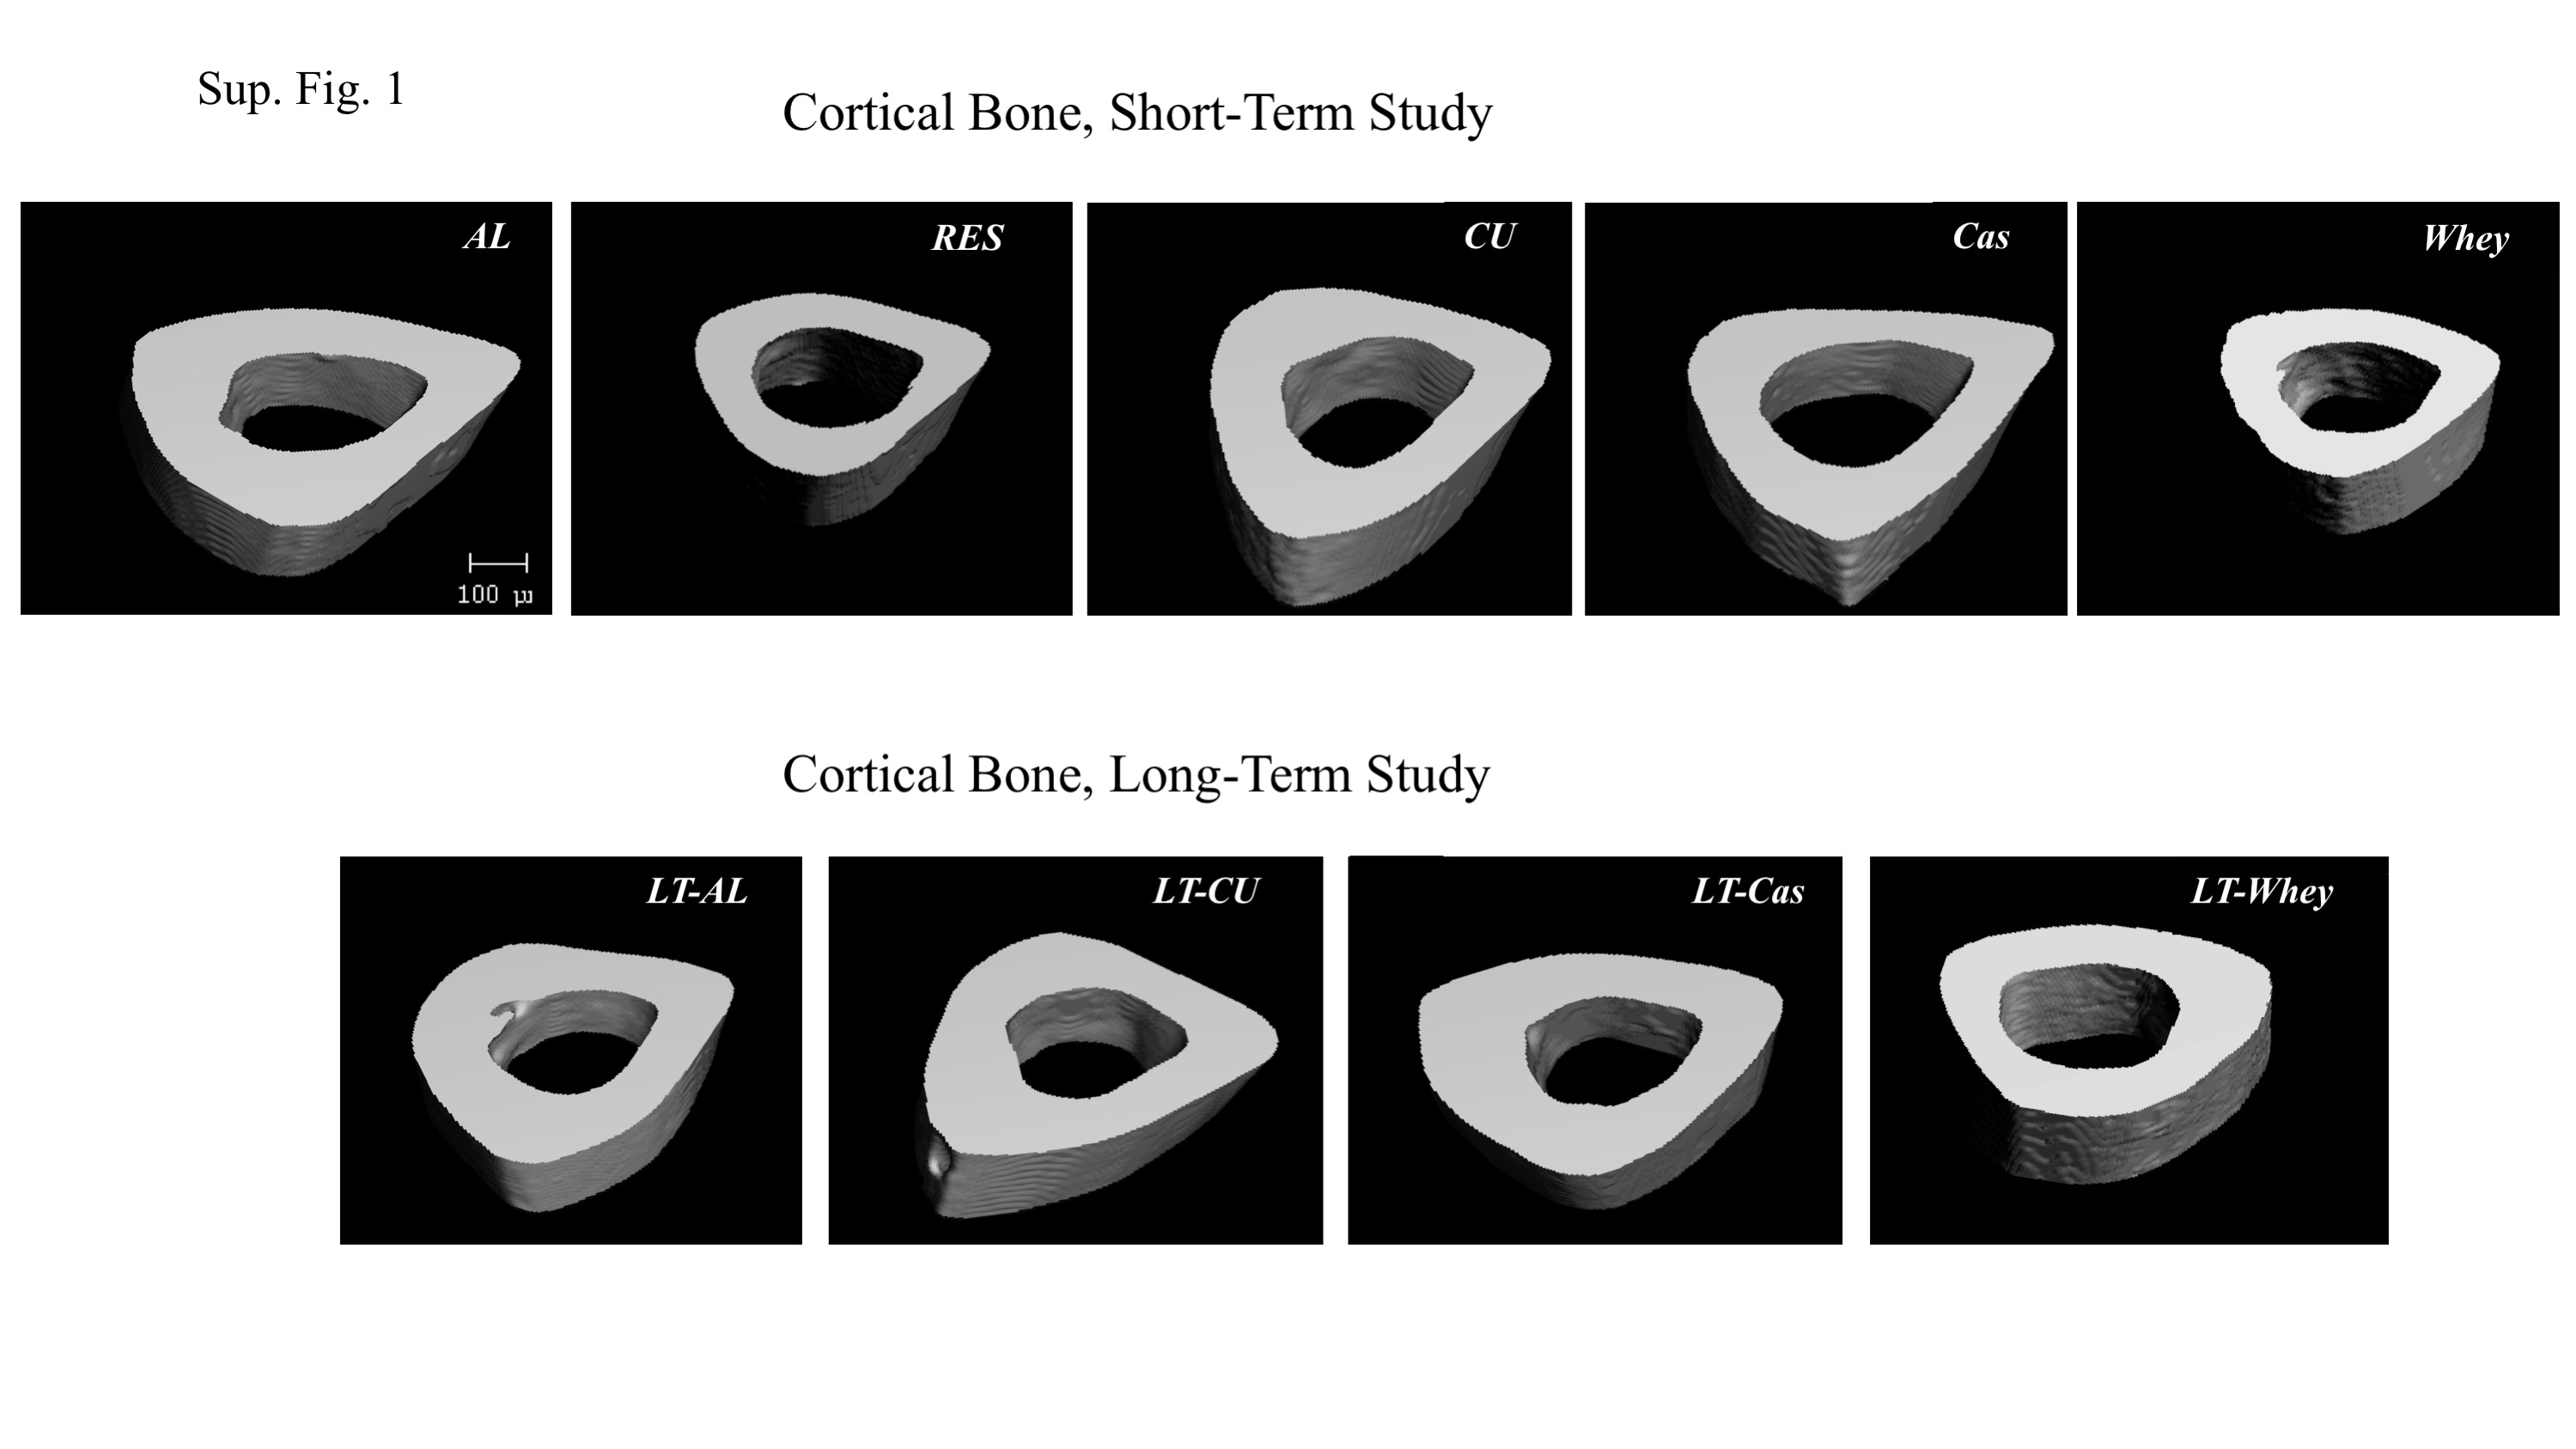
Food restriction led to a reduction in Tt.Ar, Ct.Ar, Ct.Ar/Tt.Ar and Ct.Th. Tt.Ar and Ct.Ar were corrected on re-feeding with regular (CU) or casein-formulated chow (Cas) but not whey-formulated chow (Whey). Most cortical parameters were significantly lower in the Whey than in the Cas group (online Supplementary Fig. S1).
After 40 d of re-feeding, cortical AVD was still significantly higher in the LT-AL group than in all three re-fed groups (Table 2a). There was no significant difference in AVD between the LT-CU and LT-Cas groups, but the LT-Whey group had a significantly lower AVD than all the other groups, similar to our findings in the short-term experiment.
Bone parameters microcomputed tomography (µCT) and biomechanical properties (three-point bending test) in male Sprague–Dawley rats following food restriction and long-term re-feeding (40 d) with vegetable-protein-based or milk-protein-based chow (Mean values and standard deviations)

LT-AL, (long-term ad libitum) controls fed regular chow; LT-CU, (long-term catch-up) re-fed regular chow; LT-Cas, (long-term casein) animals re-fed casein-formulated chow; LT-Whey, (long-term whey) animals re-fed whey-formulated chow; Tt.Ar, total area; Ct.Ar, cortical area; Ct.Ar/Tt.Ar, cortical area fraction; Ct.Th, cortical thickness; BV/TV, bone volume/total volume; Tb.Th, trabecular thickness; Tb.N, trabecular number; Tb.Sp, trabecular separation.
a,b,c Mean values within a column with same superscript letters were not significantly different (P<0·05).
* Toughness (AUC), stiffness (slope of the load-deflection curve) and ultimate load (the maximal load in N).
Analysis of the other cortical parameters of the LT study (Table 2a, online Supplementary Fig. S1) revealed that similar to the short-term experiment, at this time point, both Tt.Ar and Ct.Ar were significantly greater in the LT-AL group than in the LT-re-fed groups. There was no significant difference in Ct.Ar/Tt.Ar between the LT-CU and LT-Cas groups and the LT-AL group, but the value in the LT-Whey group was still significantly lower compared with the LT-AL. When comparing the LT-Cas and LT-Whey groups, we found that all other cortical parameters (apart from Ct.Ar/Tt.Ar) were significantly different between these groups (online Supplementary Table S2).
Trabecular bone
Food restriction was associated with a significant reduction in trabecular volume fraction (BV/TV) and Tb.Th (Table 1b, Fig. 7). After 24 d of re-feeding, all these parameters were corrected in the CU and Cas groups, but not in the Whey group. The Whey group had a similar BV/TV and Tb.Th to the RES group, despite unrestricted access to food for 24 d after restriction. All trabecular bone parameters were significantly worse in the Whey group compared with the Cas group.
Three-dimensional trabecular bone images. Images were obtained by microcomputed tomography of the trabecular bone. Note the dramatic effect of food restriction on trabecular bone and the effect of re-feeding with different proteins, with particular attention to the bone structure of the Whey group in the short-term experiments. AL (ad libitum) controls fed regular chow; RES, (restriction) restricted to 60 % of daily intake of regular chow; CU, (catch-up) re-fed regular chow; Cas, (casein) re-fed casein-formulated chow; whey, (whey) re-fed whey-formulated chow; LT, long term.

After 40 d of re-feeding, there was no significant difference in BV/TV, Tb.Th, Tb.N and Tb.Sp. between the LT-AL and LT-CU groups (Table 2b and Fig. 7). However, both the LT-Cas and LT-Whey groups showed a significant reduction in BV/TV and Tb.Th, concomitant with an increase in Tb.Sp, relative to the LT-AL group. The LT-CU group tended to have the highest Tb.N of all re-fed groups at 40 d, although the difference among the groups was not statistically significant. BV/TV and Tb.Th were significantly higher at 40 d in the LT-AL and LT-CU groups than in the LT-Whey group. None of the trabecular parameters were significantly different between the LT-Cas and LT-Whey groups in the long-term experiment, although all values tended to be lower in the LT-Whey group.
Biomechanical properties
In the three-point bending test of humerus strength (Table 1c), the toughness, a measure of energy required to cause fracture, and ultimate load were significantly lower in the RES group than the AL group, and the slope of the curve, a measure of bone stiffness, was somewhat (non-significantly) lower in the RES group, indicating reduced bone quality. Short-term re-feeding with either regular or casein-formulated chow tended to correct all parameters, partially or completely, with no difference between the CU and Cas groups throughout (Table 1c). However, rats re-fed a whey-formulated diet showed no difference from the RES group, and the ultimate load was significantly lower than that of the Cas group.
Interestingly, all parameters of bone strength were similar among the groups after 40 d of CU (Table 2c). However, the LT-CU group tended to have the greatest bone stiffness, and the LT-Whey group had the lowest ultimate load, in agreement with the results of the short-term experiment. In all re-fed groups, the ultimate load increased with age, reaching values similar to those of the LT-AL group.
Serum analysis
Analysis of the serum profile (Table 3) yielded no significant difference in the short term in Ca and P levels among the AL, RES and CU groups (Table 3a). Total ALP was significantly higher in the RES than in the AL group, and the three re-fed groups all showed a similar partial recovery. By the end of the long-term experiment, it was no longer possible to analyse the serum samples in the same set-up; therefore, we measured only IGF-I, leptin and OC (bone γ-carboxyglutamic acid-containing protein).
Serum analysis in male rats after 40 % food restriction and short-term or long-term re-feeding with vegetable-protein-based or milk-protein-based chow (Mean values and standard deviations)

AL, (ad libitum) controls fed regular chow; RES, (restriction) restricted to 60 % of daily intake of regular chow; CU, (catch-up) re-fed regular chow; Cas, (casein) re-fed casein-formulated chow; Whey, (whey) re-fed whey-formulated chow; ALP, alkaline phosphatase; IGF-I, insulin-like growth factor I; LT, long term.
a,b,c Mean values within a column with same superscript letters were not significantly different (P<0·05).
In the short-term experiment, serum IGF-I levels were 65 % lower in the RES than in the AL group (Table 3b). Re-feeding led to a significant increase compared with continued restriction. IGF-I levels were significantly higher in the CU group than in the Whey group. In the long-term experiments, there was no significant difference in IGF-I levels among the groups (Table 3c). Levels tended to increase over time (i.e. with age), although the results were statistically significant compared with the short-term values only in the LT-Cas and LT-Whey groups.
Serum leptin levels in the short-term experiments were significantly reduced by food restriction to below the detection limit of the kit; re-feeding led to a significant increase relative to continued restriction; however, in the Cas and Whey groups, levels remained lower compared with the AL group (Table 3b). Serum leptin levels increased over time. The level of leptin in the AL group of the long-term (LT-AL) experiment tended to be higher compared with the short-term experiment (Table 3c; P=0·06). This change was accompanied by an increase in body weight. At 40 d, the LT-AL group had the highest level of leptin and the highest body weight of all the other groups; the LT-CU and LT-Cas groups had similar leptin levels, and the levels in the LT-Whey group were lower compared with the other re-fed groups (online Supplementary Table S2). Among the re-fed groups, the Cas groups had the highest increment in leptin levels over time (LT-Cas v. Cas).
Serum OC levels in the short-term experiments were somewhat higher in the RES group than in the AL group, but the difference was not statistically significant (Table 3b). Similar findings were noted for ALP. All re-fed groups showed a further significant increase in OC compared with the AL group. Levels in the Cas group were significantly higher compared with the CU group, whereas the Whey group was similar to the CU group. OC levels decreased over time in the AL group, possibly owing to an age-associated reduction in bone formation activity (Table 3c). A similar reduction was noted in the re-fed groups. In both the short- and long-term experiments, the OC level was higher in the re-fed groups than in the AL group, and higher in the Cas group than in the other re-fed groups.
Discussion
The most interesting observation of this study is the dramatic and differential effect of casein and whey on bone growth and bone quality following food restriction. Evaluation with µCT revealed a significant difference in bone morphology between animals fed a casein- or whey-formulated diet in both the short- and long-term experiments, and biomechanical tests yielded better overall structural and biomechanical parameters in the Casein group. However, the significant difference in trabecular bone parameters and bone strength in the Casein group relative to the Whey group at 24 d of re-feeding disappeared after 40 d. The effect of whey on growth was slower, maintaining a higher (younger?) EGP for a longer time. Together, these findings suggest protein-specific effects on the pace of bone development. To the best of our knowledge, the present study is the first to explore the specific effects of the individual milk proteins during CU growth early in life.
Several distinguishing factors of casein and whey may account for their differential effect on bone quality and growth rate. (1) Amino acid profile: casein is rich in histidine, methionine, tyrosine and phenylalanine, and whey is rich in branched-chain amino acids such as leucine and iso-leucine( Reference Hall, Millward and Long 13 , Reference Pereira 14 ). In addition, casein contains high levels of prolines, required for the cross-linking of collagen fibres during creation of the extracellular bone matrix, whereas whey contains high levels of sulphur-containing amino acids. (2) Gut processing: the acidification of casein in the stomach converts it to insoluble protein-forming micelles, thereby slowing the digestion rate. In contrast, whey proteins are rapidly digested and quickly removed from the gut( Reference Boirie, Dangin and Gachon 15 ). These substantial differences may affect the pace of release of amino acids to the blood as well as the gut microbiome, which in turn can have effects on bone quality and growth. (3) Ca absorption: both in vitro and in vivo studies have shown that casein increases Ca absorption from the intestine, leading to an increase in bone mineralisation( Reference Scholz-Ahrens and Schrezenmeir 16 ). (4) Effect on IGF-I and insulin: IGF-I directly stimulates the proliferation and differentiation of EGP chondrocytes( Reference Olney, Wang and Sylvester 17 ) as well as osteoblasts( Reference Langdahl, Kassem and Moller 18 ) and increases trabecular and cortical bone formation( Reference Machwate, Zerath and Holy 19 , Reference Yakar, Rosen and Beamer 20 ). The higher IGF-I levels in the Casein than in the Whey group are commensurate with studies showing that casein is a strong IGF-I stimulator( Reference Molgaard, Larnkjaer and Arnberg 4 ). Although the slightly higher (although NS) IGF-I levels in the Casein group may have been associated with increased bone quality, we have no explanation for the equal bone length in all the re-fed groups, despite the differences in IGF-I levels. The mechanism behind the differential effect is therefore still an enigma – it can be a combination of all the above-mentioned causes or another cause altogether. It is therefore still an open question and further studies should be performed to answer it.
Bone mass is positively correlated with body weight in children and adults( Reference Felson, Zhang and Hannan 21 ). Leptin, produced by white adipocytes, is involved in feeding behaviour, regulation of energy homoeostasis, bone mass and longitudinal growth( Reference Gat-Yablonski and Phillip 22 ). In the present study, 36 d of food restriction significantly reduced serum leptin levels, indicating a reduction in fat mass concomitant with a decline in bone mass and bone formation. Our data are consistent with previous studies where low leptin levels were associated with lower cortical and trabecular bone mass( Reference Hamrick, Pennington and Newton 23 ). Although rats fed casein or whey diets gained weight, their leptin levels were still significantly low, suggesting that the increase in body weight was attributable to an increase in lean body mass and not fat. Support for this assumption comes from studies showing that the addition of whey protein to high-fat diets reduced weight gain in mice( Reference Tranberg, Hellgren and Lykkesfeldt 24 ).
OC is the main non-collagenous bone protein, and is considered a reliable marker of bone formation in children and adolescents( Reference Johansen, Giwercman and Hartwell 25 , Reference Andersson, Swolin-Eide and Magnusson 26 ). It is produced by well-differentiated osteoblasts and secreted in high levels into the bone matrix( Reference Razzaque 27 ); 60–90 % of the high-affinity γ-carboxyglutamic acid residue of OC binds to hydroxyapatite( Reference Razzaque 27 ), and 10–40 % is released into the circulation. OC in serum may either originate from mature osteoblasts during bone construction or derive from degraded bone matrix during resorption. In the present study, the slightly higher serum OC level in the RES group compared with controls may have been due to enhanced bone resorption, in agreement with our µCT findings of reduced trabecular and cortical bone parameters in the RES group( Reference Pando, Masarwi and Shtaif 6 ). Thus, food restriction appears to suppress osteoblast function and bone formation, whereas osteoclast function and bone resorption remained relatively higher, leading to bone loss( Reference Wei, Shimazu and Makinistoglu 28 ). Re-feeding increased OC levels, similar to findings of other studies in rats( Reference Ndiaye, Prudhon and Guillozo 29 ) and in a clinical study of malnourished children( Reference Prudhon, Sall and Ndiaye 30 ). We also noted a decrease in OC levels over time (i.e. with age) within the individual groups.
Our results are further supported by a recent study in which a deleterious effect on the bone microarchitecture of fast-growing rats was found only when the rats were fed protein derived from soya but not casein( Reference Rouy, Vico and Laroche 31 ). Thus, the quality of the protein may supersede the quantity available in terms of importance to bone growth and development. In addition, a study performed in food-restricted adult male rats (16 months)( Reference Mardon, Zangarelli and Walrand 32 ) showed that rats fed casein protein had higher cortical AVD, trabecular parameters, bone strength and IGF-I and OC levels than food-restricted rats fed whey. Similarly to our results, rats fed the casein diet had better bone structure and strength than rats fed the whey diet.
We have shown that long-lasting food restriction may have deleterious effects on bone elongation and microarchitecture( Reference Pando, Masarwi and Shtaif 6 ). In this study, food restriction for 36 d, during the period of linear growth in rats, led to a significant reduction in weight, bone length, bone quality and EGP height, with a significant reduction in cortical and trabecular bone parameters (µCT analysis) as well as mechanical strength. Despite the general improvement, not all parameters were completely corrected even after 40 d of re-feeding. These results may have important clinical implications.
The two main concerns regarding CU growth are (i) the incomplete CU growth leading to permanent growth deficit and (ii) the occurrence of late-onset metabolic effects. There is an increasing body of evidence suggesting that fast CU growth (especially in terms of weight gain) in infancy increases the long-term risk of obesity and insulin resistance( Reference Ong, Ahmed and Emmett 33 ). The results of our study suggest that whey may lead to slower bone growth with reduced weight gain and, as such, may serve to circumvent long-term complications of CU growth.
To summarise, our data show that food restriction leads to lower bone mass and decreased bone (trabecular and cortical) acquisition in young male rats. CU growth partially corrects cortical and trabecular bone formation. Intake of an iso-energetic diet containing equal amounts of protein and Ca is associated with a similar elongation of the bones, but bone quality significantly depends on the protein identity, with casein having a stronger effect on bone architecture than whey. Moreover, although the effect on bone length was similar for all diets, EGP height increased more under the milk-based diets than the regular chow diet. Our results show that, although the effect on bone structure is corrected with time, the effect on weight is still evident even after 40 d of re-feeding. It seems that the long-term effect is more important; therefore, whey is probably the best. However, we feel that it is too early to translate these data to clinical recommendations.
Our conclusions are limited by the low number of animals that were included in each group, leading to sometimes marginally significant differences only. Other limitations of the study include absence of data on body composition and longer-term experiments that are required to evaluate further the effect of casein and whey on long-term metabolic consequences.
Acknowledgements
This study was performed in partial fulfilment of the requirements for a PhD degree of M. M., Sackler Faculty of Medicine, Tel Aviv University, Israel. The authors are grateful to Gloria Ginzach for English editing of the manuscript, to Dr Barbara Mickelson for her help in designing the special diets (Teklad Diets division, Envigo (formerly Harlan Laboratories)) and to Dr Michal Yackobovitch-Gavan-for her help with the statistical analysis.
This study was partially supported by grants from the Israeli Dairy Board and the Strauss-Danone Fund (grant no. 9114). M. M. is an incumbent of a scholarship from the Israeli Council for Higher Education. The μCT system has been partly funded by the Israel Science Foundation (grant no. 1822/12). The Israeli Dairy Board and Strauss-Danone had no role in the design, analysis or writing of this article.
The research question: M. M., G.-G. Y., M. P. and R. S. Designing the study: M. M., G.-G. Y., M. P. and R. S. Carrying out the study: M. M. Data collection: M. M. and G.-G. Y. Data analysis: M. M. and G.-G. Y. Data interpretation: M. M., G.-G. Y., O. D., T. B., Y. G., M. P. and R. S. Drafting of the manuscript: M. M. and G.-G. Y. Revising of the manuscript content: M. M., G.-G. Y., T. B., Y. G., M. P. and R. S. Approving the final version of the manuscript: all authors.
The authors declare that there are no conflicts of interest.
Supplementary Material
For supplementary material/s referred to in this article, please visit http://dx.doi.org/doi:10.1017/S0007114516001781