


Introduction
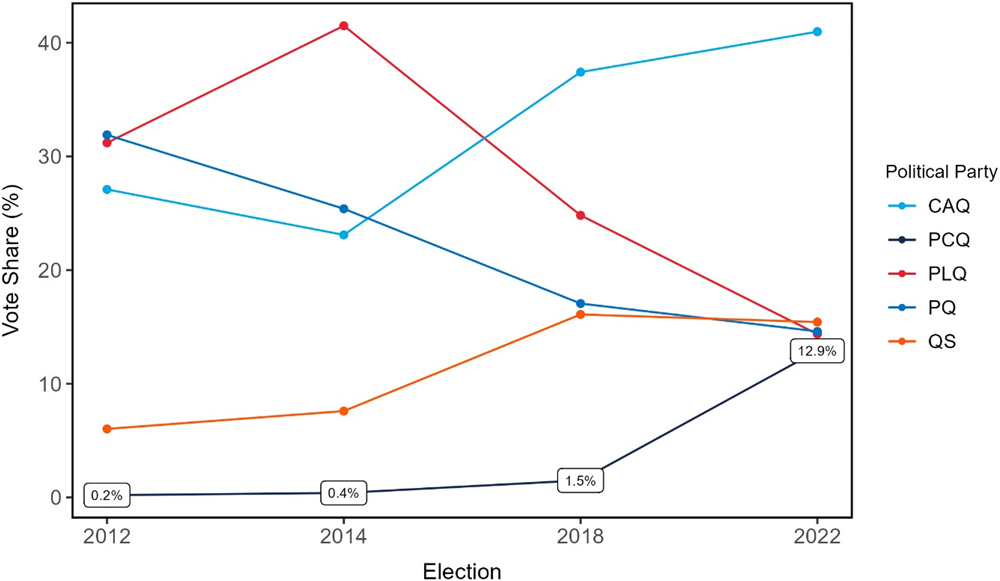
The Parti Conservateur du Québec (PCQ) was created as a right-wing political party in the Canadian province of Quebec in 2009, but did not emerge from the margins until the 2022 general election under the leadership of Éric Duhaime.Footnote 1 With 12.9 per cent of the popular vote (which represents over 530,000 voters), up from only 1.5 per cent in the previous election, the PCQ was only 2.5 percentage points behind the opposition party with the most votes, Québec Solidaire (QS). Similarly, there is a difference of barely 1.5 percentage points between Duhaime's PCQ and the Official Opposition, the Quebec Liberal Party (PLQ). The PCQ rivalled other parties in terms of vote intentions for the entire duration of the campaign, often appearing to be neck-and-neck with the Liberal Party. This spectacular surge following the selection of Duhaime as party leader, which was also reflected in pre-election polls (Déry et al., Reference Déry, Bibeau, Cadieux and Dufresne2022), proved insufficient to gain a single seat in Quebec's Assemblée nationale. Despite being greatly disadvantaged by the vote-seat distortion common in single-member plurality (SMP) electoral systems, the PCQ was able to garner major media attention and was allowed to participate in the televised leaders’ debates for the first time in its history. The PCQ also benefited from a substantial increase in monetary donations leading up to the 2022 election (see section C of the online appendix). As displayed in Figure 1, the share of popular vote captured by the PCQ in the 2022 election was a remarkable rise since the party's creation. What factors account for the PCQ's surprising surge?
Since the party mainly campaigned on issues related to the economic right (with a clear state retrenchment agenda) but also discontent with the Legault government, especially its COVID-19 health measures, it seems that these two issue dimensions should have pride of place in an explanation of support for the PCQ in the 2022 election (Lavallée, Reference Lavallée2022)—but there is surely more to the story. Using individual-level survey data from the 2022 Quebec Election Study (QES), we assess whether PCQ voters were indeed motivated by support for topics associated with the economic right and by dissatisfaction with François Legault's government and its management of the COVID-19 pandemic. While doing so, we also want to account for other likely sources of support for this new party, looking at themes pertaining to the cultural and populist right, environmentalism and sociodemographic characteristics such as age, sex, education and region of residence. These analyses will help us determine whether the party occupies an ideologically well-defined niche inside the provincial party system, which would indicate that some Quebecers have an appetite for a more right-wing political party than what was previously available to them. This is all the more plausible since the PCQ's main competitor on the right, the Coalition Avenir Québec (CAQ), has shifted to the centre of the political spectrum following its election in 2018 (Béland et al., Reference Béland, Dinan, Jacques and Marier2023).
Hence, beyond PCQ support representing a protest vote cast in reaction to the government's management of the pandemic, the party's 2022 surge, and its continued support in vote intention polls (where it receives at least 10%; see Léger, 2024), may reflect the presence of a more deeply anchored, though narrow, ideological movement among the Quebec public. The emergence of the PCQ can also be positioned in the larger context of federal-provincial discontinuity and party system fractionalization. While the degree of provincial-federal disconnect and the level of party fragmentation in most provinces have largely been dependent on the electoral success of the NDP—its greater performance fostering consolidation on the right—fractionalization in Quebec was mostly a product of the national question debate. As noted by Johnston (Reference Johnston2017: 217), “[t]he most enduring insurgent pattern has been in Quebec. Not only was the Union Nationale an early entrant, but also the Parti Québécois brings the tradition right down to the present.” With traditional left-right issues now being higher on the agenda (Wesley and Buckley, Reference Wesley and Buckley2021), the Quebec party system seems to have fractionalized even further, offering more ideologically distinct options on the left and right of the political spectrum. Of all parties opposing public health mandates in Canada, the PCQ appears to have been one of the most, if not the most, successful at mobilizing voters. Although greater in magnitude, the growth of the PCQ in 2022 echoes gains made by the right-wing populist Buffalo Party in the 2020 Saskatchewan election and the People's Party in the 2021 federal election, both of which also challenged vaccine passports, mask mandates and lockdowns. In short, the increasing fractionalization of party systems across rich democracies constitutes a broader trend (see Dalton, Reference Dalton2018; Martin, Reference Martin2018) that may end up materializing itself more clearly in Canada in the near future despite the current lack of successful party breakthroughs.
To shed light on the factors that facilitated the emergence of this party, we propose the first empirical study of the PCQ's voting base profile. The study proceeds in five steps. We first expose the genesis of the Parti Conservateur du Québec and assess its place within the new Quebec multiparty system. We then propose a series of theoretical expectations about the determinants of the vote in favour of the PCQ in the 2022 election. Details about the data and methodology being used are then introduced, followed by the presentation of our empirical findings and by a concluding discussion about the results’ broader implications for our understanding of voting trends in Quebec and the contemporary Quebec party system.
The PCQ in Quebec's Evolving Partisan Space
In this section, we briefly summarize how party competition in Quebec has been reshaped in recent years, partly due to the lower salience of the sovereignty debate. Several scholars have emphasized that since 2007 and the meteoric rise (and subsequent fall) of the Action Démocratique du Québec (ADQ), multipartyism is the new norm within the Quebec party system (see, for example, Bélanger and Mahéo, Reference Bélanger and Mahéo2020; Dubois et al., Reference Dubois, Villeneuve-Siconnelly, Montigny and Giasson2022; Montigny and Margineanu-Plante, Reference Montigny and Margineanu-Plante2022). The recent proliferation of parties and the emergence of new political issues in Quebec has been facilitated, in part, by the lesser salience of the sovereignty issue, which had structured party competition in the past and fostered a PLQ–PQ bipartism (Bélanger and Godbout, Reference Bélanger and Godbout2022; Montigny, Reference Montigny2023). This evolution, which “could be characterized as a ‘normalization’ of the Quebec political scene” (Dufour, Reference Dufour2009: 76), has opened up the partisan space along economic and cultural lines to new political parties, like the ADQ and the PCQ on the right, but also Québec Solidaire on the left with their firm positioning in favour of state intervention, environmentalism and multiculturalism.
The root causes that led to the creation of the PCQ in 2009 go all the way back to the emergence of the Action Démocratique du Québec (ADQ), and then the Coalition Avenir Québec (CAQ).Footnote 2 For much of the period between 1970 and 2003, constitutional matters, federal-provincial relations and Quebec's sovereignty were the structuring elements of the PLQ–PQ competition. Questions related to changing moral values were relatively uncontroversial as both major parties generally appeared supportive of dismantling the old religious and traditionalist social order. However, once the rapid economic growth of the 1960s and 1970s began to falter, questions related to the welfare state and the Quiet Revolution's interventionist model became much more contentious. With economic hardship in the early 1980s and the spread of neoliberal ideas, the foundations of the Quebec model became an object of intense criticism. Conservative and right-wing voters, who were dissatisfied with an oversized provincial state favouring bureaucrats and labour unions, could find solace in the Liberal mantra of deregulation and privatization of the 1980s. However, for large segments of the conservative electorate, the Liberal Party did not appear keen enough to scale back Quebec's civil service and curb government spending. As noted by Tanguay (Reference Tanguay, David and Farney2013: 322), “by the early 1990s there was certainly sufficient room in partisan space in Quebec for a consistently neoliberal party that could articulate a coherent critique of the étatiste and collectivist features of the ‘Quebec model’.” Consequently, and helped by the decreasing salience of the sovereignty debate, traditional left-right questions regained importance during the 1990s (Boily, Reference Boily2018) and were spearheaded by the ADQ.
The ADQ was founded in 1994 by a group of Liberal dissidents with a push for political autonomy, but also the consolidation of public finances, at the centre of its electoral platform (Mailhot and Montigny, Reference Mailhot and Montigny2024). Led by Mario Dumont, who had been president of the Liberal Party's Youth Commission in 1991–1992, the ADQ performed reasonably well for a newly-formed party by getting 6.5 per cent of the vote in 1994, 11.8 per cent in 1998 and 18.2 per cent in 2003, although its deputation in the Assemblée nationale remained marginal. In 2007 however, the ADQ made a breakthrough by becoming the Official Opposition with 30.8 percent of the vote and 41 MNAs. The Parti Québécois fell in third place for the first time since 1973. This sudden surge of the ADQ was partly the result of its strong position on an issue of the day, namely the reasonable accommodation of ethno-cultural and religious minority groups in Quebec (Bélanger and Nadeau, Reference Bélanger and Nadeau2009). As such, the right-of-centre fiscal positions of the ADQ were paired with a clear commitment to identity politics (Barker, Reference Barker2010; Béland and Lecours, Reference Béland and Lecours2008; Graefe, Reference Graefe, Evans and Smith2015). The ADQ's success was short-lived, however. When the incumbent Liberals launched a snap election the following year, the ADQ's support dropped considerably, prompting Dumont to step down as party leader. The party struggled to get back on its feet, and ceased to exist in 2012 when its members agreed to merge with the Coalition Avenir Québec created only a few months earlier by former PQ cabinet minister François Legault (Pelletier, Reference Pelletier and Pelletier2012; Mailhot and Montigny, Reference Mailhot and Montigny2024).
The CAQ can be described both as the successor of the ADQ and as an outgrowth of the centre-right faction of the Parti Québécois.Footnote 3 On economic matters, the party's platform is fiscally conservative as it favours balancing the budget, reducing taxes, and eliminating a number of civil-service jobs, but it is not as hostile to the Quebec model as some of the proposals of the defunct ADQ were. Therefore, the free-market and pro-business stance of François Legault's party is not as firm as that of other political parties belonging to the Canadian right (Boily, Reference Boily2018). The CAQ has also adopted clear positions on cultural issues and matters of inclusion and integration by proposing, among other things, to reduce immigration thresholds and to require newcomers to pass a “values test” in order to obtain a Quebec selection certificate (Xhardez, Reference Xhardez and Paquet2022). In only a few years, the CAQ gained considerable popular support. In the 2018 general election, the CAQ ended the PLQ–PQ near-duopoly by forming a majority government and the party further reinforced its presence in the Assemblée nationale by gaining additional seats in the following 2022 contest.
Although much was said about the fate of the ADQ and the rapid rise of the CAQ, it is crucial to note that the PCQ was created in 2009 partly in reaction to the ADQ's electoral demise the previous year, and in the hope of capitalizing on the successful resurrection of the federal Conservative Party under Stephen Harper. The ADQ's merger with the CAQ in 2012 provided additional justification for the PCQ's existence on the Quebec provincial political scene, as the PCQ started to present itself as the true home of right-wing voters in Quebec (Bussières, Reference Bussières2012a). Nearly 30 per cent of ADQ members refused to endorse the merger with the CAQ, among them the vice president of the party's political commission, libertarian businessman Adrien D. Pouliot (Mailhot and Montigny, Reference Mailhot and Montigny2024: 174, 197). Tellingly, the following year, Pouliot would go on to become leader of the PCQ after noting that the CAQ did not dare opening the door to private health care and lowering the tax burden of Quebecers, among other things (Mailhot and Montigny, Reference Mailhot and Montigny2024: 200). After three difficult elections where it did not receive more than 1.5 per cent of support, the PCQ performed remarkably well in the 2022 election with its new leader Éric Duhaime, a former radio show host, but also a former political advisor for the right-wing Canadian Alliance and the ADQ. It may be worth recalling that in 2010, Duhaime co-founded the Réseau Liberté-Québec (RLQ, “Quebec Freedom Network”) with the aim of promoting conservative and libertarian ideas in the province. Many of this network's members were former ADQ supporters disappointed by the party's defeat in 2008. After the absorption of the ADQ by the CAQ in 2012, the RLQ defined its members as “political orphans” (Bussières, Reference Bussières2012b).
While panel (a) of Figure 2 shows that the PCQ proved to be competitive during most of the 2022 campaign, panel (b) illustrates how a great part of its support came from former CAQ supporters, most likely right-wing voters dissatisfied by Legault's first term in office and his response to the COVID-19 health crisis.Footnote 4 The PCQ manifesto for the 2022 provincial campaign, “Liberté 22,” promoted tax cuts, fuel tax reliefs, health care privatization, a freeze on Quebec City's tramway project, and the exploitation of the province's fossil fuel resources (Parti Conservateur du Québec, 2022). Duhaime's party accused the government of François Legault of practising “powder blue” conservatism by trading right-wing promises for left-wing policies (Gagnon, Reference Gagnon2022). With a clear libertarian outlook, Duhaime also capitalized on the dissatisfaction with the public health measures put in place by the Legault government to curb the spread of the COVID-19 virus, which is often considered one of the main reasons for the PCQ's success. In fact, the party's constitution vows to “defend individual rights and freedoms against the infringements of the State” (Parti Conservateur du Québec, 2021a).
Voting Intention and Flow of Votes from 2018 to 2022
Note: Panel (a): Semi-transparent markers represent individual polls. Trend lines are local regressions (loess). Diamond-framed markers show the actual vote share won by each party on election day.

Accounting for the PCQ's 2022 Surge
In this section, we propose theoretical expectations about the likely individual-level determinants of PCQ support in the 2022 Quebec election.Footnote 5 These expectations notably touch on populism and political cynicism, the economic right, moral traditionalism, gay and lesbian rights, anti-immigration attitudes, climate change, and grievances related to the government's management of the pandemic. We address these factors in turn and anchor them in their relevant literature.
At the outset, it is important to note that the PCQ has often been described as a populist party (for example, Drouin and Giasson, Reference Drouin and Giasson2024; Laberge, Reference Laberge2021; Montigny, Reference Montigny2021). Duhaime himself has stated that he was in politics “to do populism,” although his own definition of the concept is rather vague (CPAC, 2023). Hence, we may first wonder whether the socioeconomic profile of PCQ supporters corresponds to that of right-wing populist voters in other Western democracies. These voters have often been found to be more maleFootnote 6, younger and less educated than those of other political parties (Norris and Inglehart, Reference Norris and Inglehart2019). Right-wing support in recent years in Quebec has sometimes been described as coming from “les jeunes hommes en colère à Québec” (that is, angry young males from Quebec City) (Langlois, Reference Langlois and Venne2005). If such were the case with the PCQ in the 2022 election, it would provide partial support to the idea that the PCQ taps into deep-seated socioeconomic divides often associated with the emergence of populist right-leaning parties.
When it comes to characterizing the ideological profile of PCQ voters in the 2022 election, some theoretical expectations may be derived again from the comparative literature on support for right-wing populist parties. Research suggests that the rise of such parties is the result of growing economic insecurity/inequality (Jay et al., Reference Jay, Batruch, Jetten, McGarty and Muldoon2019; Milner, Reference Milner2021) or the product of a “cultural backlash” against postmaterialist values (Ausserladscheider, Reference Ausserladscheider2019; Norris and Inglehart, Reference Norris and Inglehart2019). The ideas and policy proposals of these parties are often accompanied by a rhetoric designed to tap into the discontent of lay citizens who feel they have been wronged by the “elite” or by phenomena beyond their grasp (Betz, Reference Betz, Mény and Surel2002; Bartels, Reference Bartels2023). The populist tone of the PCQ's discourse was notably apparent in its opposition to some of the measures imposed by François Legault's government to curb the spread of the COVID-19 virus, which Duhaime described as “health extremism” (Pelletier, Reference Pelletier2021). Although Duhaime himself does not subscribe to conspiracy theories on vaccines and COVID-19, a recent study revealed that 49 per cent of PCQ supporters were either strong (15%) or moderate (34%) believers of various conspiracies related, among other things, to government corruption, information control and the COVID-19 pandemic—compared to 21 per cent of the Quebec population (Carignan et al., Reference Carignan, Morin, Daxhelet, Bédard, Champagne-Poirier, Choquette, Aliaga, Khennache and Kamela2022). As such, we may expect the PCQ to have successfully attracted the votes of individuals distrustful of those in power. Such behaviour would be consistent with findings showing that right-wing populist citizens in Quebec have a greater tendency to turn out in elections than left-leaning populists and are not politically disengaged despite their high level of disaffection (Gagnon and Bilodeau, Reference Gagnon and Bilodeau2024).
On the perennial question of Quebec's independence, Duhaime positions the PCQ as a nationalist party, but one that wishes the province to remain part of the Canadian federation. He has clearly stated that the PCQ was not in the “business of doing a referendum” (Côté, Reference Côté2022). The Conservatives appear much more concerned with questions of fiscal policy, public sector restructuring and welfare state retrenchment. The party proposes a tax relief agenda anchored into a global suspicion towards statism, the PCQ being of the opinion that “[t]hose institutions of civil society, such as the family, charitable organizations (religious or secular), community organizations or cooperatives are generally in a better position than the State to help the more vulnerable in society” (Parti Conservateur du Québec, 2021a). On matters of economic policies, the PCQ thus presents the profile of a right-wing party. As for the cultural left-right cleavage, we may expect the PCQ to attract support from the moral traditionalists that populate the right-leaning end of this ideological spectrum. As mentioned by Knuckey (Reference Knuckey2005: 651) “moral traditionalism may be viewed as constituting a backlash against postmaterialist values, such as secularism, moral relativism, and alternative lifestyle choices, that emerged in the late 1960s and 1970s.” As such, we can expect the defence of traditional gender roles and family values to be the stock and trade of right-wing parties (Christley, Reference Christley2022; Giuliani, Reference Giuliani2023).
That said, on the specific issue of gender and sexuality, the case of the PCQ presents an interesting twist. This is because of an unconventional feature of the PCQ leadership: Éric Duhaime is openly homosexual, but his positions on issues affecting traditional sexual minorities have been somewhat controversial. In a book he published in 2017, Duhaime claimed that the battle for the recognition of gay and lesbian rights in Quebec had been won, and that sexual orientation had become rather unimportant for most people (Duhaime, Reference Duhaime2017). He also denounced the “gay lobby,” which he felt did more to fuel the victimization of gays and lesbians than anything else, and insisted that he did not wish to become a spokesperson for the gay community. In short, Duhaime believes that members of the gay community in Quebec do not need to fight anymore for the recognition of their rights. Accordingly, we can expect that support for the PCQ is greater among individuals who believe that less should be done for gays and lesbians in Quebec. It is worth noting that Éric Duhaime is not alone as a right-wing leader with an LGBTQ+ identity; other notable examples that come to mind are Pim Fortuyn in the Netherlands and Alice Weidel in Germany.
Support for right-wing populist parties sometimes tends to result from favourable opinions of immigration-restriction measures or policies promoting the interests of native inhabitants against those of newcomers, or what some authors have referred to as nativism (Tillman, Reference Tillman2021; Yilmaz, Reference Yılmaz2012). On immigration, Duhaime has claimed that he saw immigrants as assets rather than liabilities, and that newcomers should be treated as “neighbours” and “potential friends” (Charbonneau, Reference Charbonneau2022). At the same time, the PCQ's discourse has mostly been one of limiting immigration.Footnote 7 Duhaime has also stated that building a wall on the US-Quebec border was a possible solution to stop the flow of irregular migrants and asylum seekers passing through Roxham Road, an unofficial border crossing located just south of Montreal. Additionally, the party adopted a proposal to “[s]elect permanent immigrants based on their civilizational compatibility (Western values and ability to integrate into Quebec culture)” during its 2021 convention (Parti Conservateur du Québec, 2021b: 81—our translation). Questions related to the integration of immigrants into Quebec's francophone majority have been important for a long time, but they have gained in salience in recent election cycles (Barker, Reference Barker2010; Gagnon and Larios, Reference Gagnon and Larios2021; Xhardez and Paquet, Reference Xhardez and Paquet2021; Zubrzycki, Reference Zubrzycki2016) with parties taking positions on the issues of reasonable accommodations for ethnocultural and religious minority groups and state secularism. The Legault government adopted Bill 21 (Act respecting the laicity of the State) in 2019, prohibiting public servants in positions of authority, as well as public school teachers, from wearing religious signs within the scope of their employment (Béland, Lecours and Schmeiser, Reference Béland, Lecours and Schmeiser2021). Despite his global criticism of the CAQ's government, Duhaime came out in favour of Bill 21 (Crête, Reference Crête2022). There is a fundamental tension, then, between the clear libertarian stance of Duhaime's PCQ and state interventions in matters of national identity and integration (Dufour and Tanguay, Reference Dufour and Tanguay2022; Laberge, Reference Laberge2021), although there is research that indicates that some right-wing elites can successfully articulate a socially liberal stance with an anti-immigration rhetoric (Triadafilopoulos, Reference Triadafilopoulos2011). Thus, on the issue of immigration, the relationship with PCQ support could go either way.
Another aspect worth investigating involves the PCQ's position on climate change and environmental issues. Many right-wing parties tend to adopt a skeptical outlook towards anthropogenic climate change (Forchtner, Reference Forchtner2019). Based on an analysis of articles from far-right sources in Germany, Forchtner, Kroneder and Wetzel (Reference Forchtner, Kroneder and Wetzel2018: 600) concluded that “many tropes in far-right climate-change communication are familiar from research on conservative climate-change skepticism. These include criticism of mainstream scientists and the media as distorting climate-change communication; accusations against the mainstream as being alarmist and close to a religious cult; attacks against climate policies as being money-making scams; and the rejection of such policies as causing economic harm.” Environmental issues appear to have gained prominence in Quebec election campaigns (Bélanger et al., Reference Bélanger, Daoust, Mahéo and Nadeau2022). The PCQ's stance on climate change seems to clearly favour economic development over environmental protection. The party's program mentions that “[f]ear of an uncertain cataclysm cannot justify calling into question our entire way of life and civilization itself” (Parti Conservateur du Québec, 2022: 50) and strongly promotes the exploitation of the province's natural oil and gas resources. Furthermore, the PCQ does not really have any concrete action plan to reduce greenhouse gas emissions, the party instead expressing its faith in the promises of new technologies to preserve the environment. We thus expect PCQ support to come from individuals who share the party's skepticism about the need for policies to protect the environment.
Finally, the 2022 Quebec election was held at the tail end of a long pandemic and, as such, this issue occupied an important place during the campaign. It seems plausible to consider COVID-19 health restrictions as having created sudden grievances vis-à-vis the incumbent CAQ government, a factor that can generally help trigger the surge of non-mainstream political parties (for example, Pinard, Reference Pinard1971; Bélanger, Reference Bélanger2004). The PCQ's focus on public dissatisfaction with COVID-19 health measures appears to have allowed Duhaime's Conservatives to channel resentment on this topic, just as the People's Party of Canada was able to do the year before in the 2021 federal election (Medeiros and Gravelle, Reference Medeiros and Gravelle2023). That the PCQ was probably able to make electoral gains by denouncing health measures such as the mask mandate or the need for an immunity passport is not surprising as previous research has shown conspiracy beliefs about the pandemic and compliance with health guidelines to be closely related to populism and conservative media consumption (Gadarian, Goodman and Pepinsky, Reference Gadarian, Goodman and Pepinsky2021; Magnus, Reference Magnus2022; Stecula and Pickup, Reference Stecula and Pickup2021).
Data and Methods
Our analyses rely on data from the 2022 Quebec Election Study (QES). The QES was administered by Léger on behalf of researchers from Université Laval, McGill University and the Consortium on Electoral Democracy (C-Dem) (Mahéo et al., Reference Mahéo, Bélanger, Stephenson and Harell2023). The survey, which includes both a pre- and a post-election wave, was administered online between September 19 and October 14, 2022. A total of 1,522 answers were collected across both survey waves.Footnote 8 QES respondents are older, more francophone, more educated and wealthier than the general population. In terms of vote choice, the CAQ is underrepresented within our sample (33.7% of respondentsFootnote 9 vs 41% in the electorate), while QS and the PQ are somewhat overrepresented. The PCQ received 12.9 per cent of the popular vote in the general election, and 13.7 per cent of QES respondents reported voting for the PCQ. We use survey weights to correct for biases in demographic representativeness (age, gender, education and language).
As we use a five-way dependent variable (a vote for either the PCQ, the CAQ, the PLQ, the PQ or QS), our vote choice model is estimated via multinomial logistic (MNL) regression analysis. Due to space limitations, the regression outputs of these MNL models are reported in section D of the online appendix. Our discussion of the regression results relies on figures that illustrate the marginal effects of the independent variables. Marginal effects measure the change in the probability of voting for a party when a variable moves from its minimum to its maximum value, all other things being equal. They are calculated based on the MNL estimates found in the online appendix.
The vote choice model relies on a multistage approach that includes two blocks of explanatory variables, which are successively added to the estimation starting with a block of sociodemographic factors, which are the most removed (timewise but also conceptually) from the election, and moving on to a block of attitudinal factors. This multistage approach borrows from, in a simplified way, the “funnel-of-causality” logic to estimating vote choice (for a similar though more complex block-recursive modeling approach in the Quebec context, see Bélanger and Nadeau, Reference Bélanger and Nadeau2009; Bélanger et al., Reference Bélanger, Daoust, Mahéo and Nadeau2022; for an application to voting behaviour in federal-level elections, see Blais et al., Reference Blais, Gidengil, Nadeau and Nevitte2002; Gidengil et al., Reference Gidengil, Nevitte, Blais, Everitt and Fournier2012).
The first block of explanatory factors includes conventional sociodemographic variables (namely age, education, language, income and sex) as well as controls for region fixed-effects (that is, Capitale-Nationale, Chaudière-Appalaches, Couronne Nord, Couronne Sud, Laval, Montréal and rest of Quebec).
The second block aims to capture the influence of core values as well as issue attitudes on the vote. To begin, this block includes variables measuring support for Quebec sovereignty, the economic right, moral traditionalism and political disaffection—core variables that have all been known to influence vote choice in Quebec in the past (Bélanger et al., Reference Bélanger, Daoust, Mahéo and Nadeau2022). Although less structuring than in the past, attitudes towards Quebec sovereignty remain an important determinant of vote choice in Quebec (see, for example, Daoust and Gareau-Paquette, Reference Daoust and Gareau-Paquette2024). Indeed, some parties (QS and the PQ) continue to promote Quebec's independence explicitly. To measure attitudes about market liberalism, we rely on a set of questions close to those proposed by Gidengil et al. (Reference Gidengil, Nevitte, Blais, Everitt and Fournier2012) that capture voters’ ideology regarding economic liberalism and state intervention, rather than relying on a left-right ideological self-placement scale. Following exploratory factor analysis (see section E of the online appendix), we add to this index a question asking how much should be done for women and name this index “egalitarianism” (see also Heide-Jørgensen, Reference Heide-Jørgensen2021). The variable tapping moral traditionalism is an index composed of three items measuring attitudes towards newer lifestyles as well as family and gender roles (see also Pless, Tromp and Houtman, Reference Pless, Tromp and Houtman2023). As for political disaffection, it is an index measuring respondents’ sense of external political efficacy, their level of distrust towards politicians and elected officials, and their support for the idea that the people, and not politicians, should make important policy decisions (see also Torcal and Montero, Reference Torcal, Montero, Torcal and Montero2006).
In addition to these core values, the second block includes attitudes related to short-term issues, whose salience or relevance can fluctuate with each election cycle. These attitudes include sociotropic and egotropic evaluations of the economy, immigration and minority rights, environmentalism, and the issue of gay and lesbian rights. Sociotropic economic evaluations assess the extent to which the incumbent government is held accountable for Quebec's economic situation (Bélanger and Nadeau, Reference Bélanger and Nadeau2009). Respondents’ retrospective egotropic economic evaluations are also included to account for the potential financial loss incurred by individuals because of quarantine measures and temporary business closures (Bartik et al., Reference Bartik, Bertrand, Cullen, Glaeser, Luca and Stanton2020). We measure attitudes about immigration and minority rights with an index combining respondents’ answers to questions that asked if immigrants were good for the economy, if they represented a threat to Quebec's culture, if immigration contributed to higher crime rates and if the will of the majority should prevail over the rights of minorities (see also Lahav and Courtemanche, Reference Lahav and Courtemanche2012). We gauge the association between environmentalism and the vote using an index made up of multiple items related to government spending on the environment, the provincial carbon tax, favourability to stricter environmental rules (despite higher costs) and whether priority should be given to protecting the environment or creating jobs (see also Franzen and Mader, Reference Franzen, Mader, Rayside and Farney2021). Finally, given PCQ leader Éric Duhaime's unconventional approach to sexual minority issues, we decided to assess the influence of this factor using respondents’ answers to the following question: “How much do you think should be done for lesbians and gay men in Quebec?”
Lastly, this second block includes attitudes related to COVID-19 measures. We gauge respondents’ (dis)satisfaction with the management of the pandemic through an index made up of two questions, namely (1) “How satisfied are you with the following governments’ handling of the COVID-19 pandemic? Quebec government?” and (2) “How well has Quebec performed in managing the COVID-19 pandemic compared to other provinces?” Note that all index measuresFootnote 10 in this study were split into quartiles (to create categories with sufficient observations) and rescaled from 0 to 1. They were also created following the results of exploratory factor analyses, which are presented in detail in section E of the online appendix. Details about variable coding and survey question wordings can be found in section A of the online appendix, while descriptive statistics for all variables are provided in section B of the online appendix.
Findings
Figure 3 presents the marginal effects associated with the vote choice model's first block of explanatory variables, which only includes sociodemographic predictors of the vote. The results associated with this block of vote determinants indicate that PCQ supporters in 2022 were more likely to be men, young and less educated than supporters of other parties. Note, however, that the QS clientele is as young as the Conservative one, and that the CAQ voter base appears to be similarly low educated as the Conservative one. The findings also indicate that the PCQ supporters were more likely to reside in the Capitale-Nationale and Chaudière-Appalaches regions, which have historically shown greater support for right-wing political formations, like the ADQ (Drouilly, Reference Drouilly and Pelletier2012), and greater interest in entrepreneurship and free-market ideology (Palard, Reference Palard2009). Notice that, contrary to most of the other parties, the PCQ's clientele cuts across Quebec's linguistic divide, indicating that the party's support came as much from non-francophone voters as from francophone ones, all else being equal. Finally, no statistically significant income gap emerges from this model's results.
Marginal Effects of Block 1 Variables
Note: Calculated from MNL regression results (Block 1 estimation).
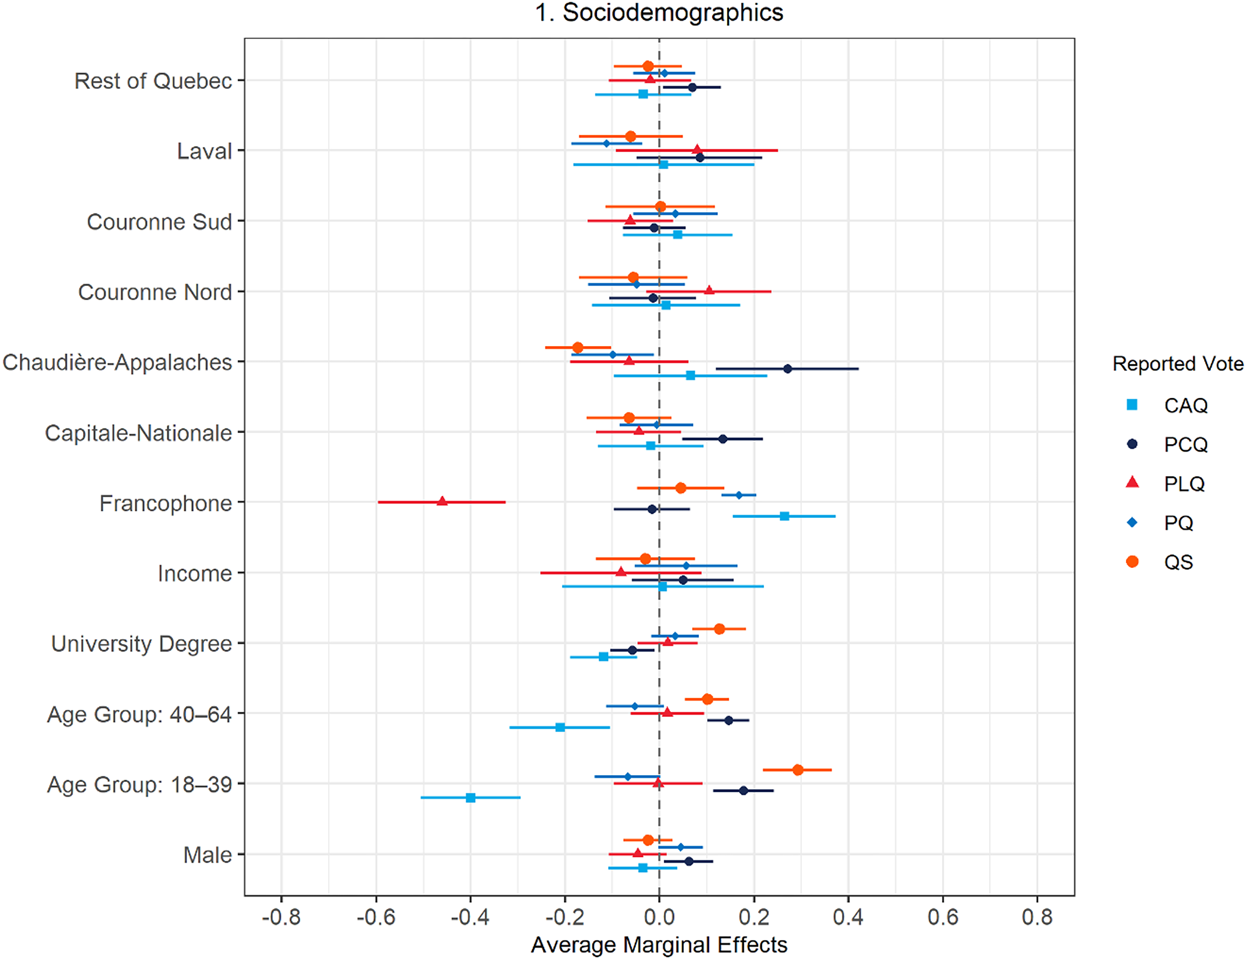
Figure 4 adds the block of attitudes and values to our estimation of vote choice in the 2022 Quebec election. Several of these political attitudes are significantly linked to support for the PCQ. As one might expect on the basis of the comparative literature on populist party support, Conservative voters in Quebec prove to be more disaffected towards politics and to react more positively to populist rhetoric. Regarding egalitarianism, including the proposition of greater state intervention to guarantee its application, PCQ voters are significantly less likely to adopt a favourable stance, like most supporters of right-leaning parties in other Western democracies. In addition, they score markedly lower on our egalitarianism scale (average score of 0.21) than the average Quebecer (0.40). However, when it comes to moral traditionalism, PCQ supporters do not score significantly higher on this scale. This result suggests that the party does not fit with an understanding of right-wing support as being less open to diversity and to newer lifestyles. The findings in Figure 4 also indicate that Quebec independence support is not significantly associated with a vote for the Parti Conservateur. In fact, the PCQ is the only party for which independence has no statistically significant effect on its support. As Duhaime's party did not campaign on the independence issue and did not take a strong position on this question, this is not entirely surprising.
Marginal Effects of Block 2 Variables (Controlling for Block 1)
Note: Calculated from MNL regression results (Block 2 estimation).
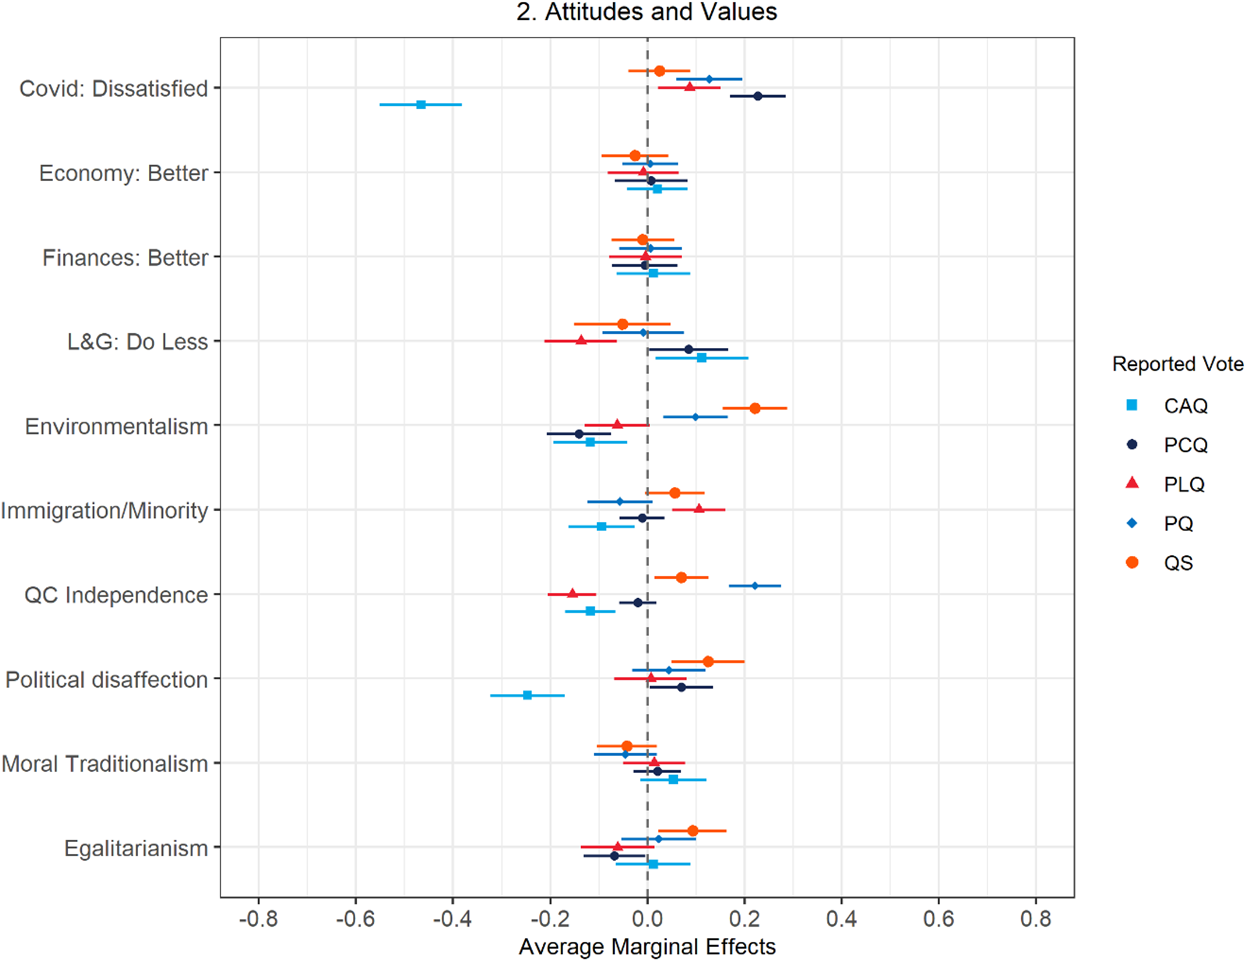
Looking at the vote choice model's other attitudinal variables included in Figure 4, we see that on the issue of environmentalism, voters who prioritize green policies over economic or financial considerations had a higher likelihood of supporting QS or the PQ than the Conservatives. This is largely consistent with these parties’ positioning on this issue, notably the PCQ's overall skepticism vis-à-vis the goal of protecting the environment. Conservative supporters (like CAQ ones) are also more likely to think that society should do less for lesbians and gay men. This finding is congruent with Duhaime's strong libertarian stance and general downplaying of issues affecting traditional sexual minorities. As for nativism, in contrast with other findings about right-wing populist voting, this variable does not seem to matter to PCQ support as attitudes towards immigration and minority rights do not factor into the choice to vote for this party in the 2022 Quebec election (contrary to the CAQ, for example).
Figure 4 further indicates that PCQ voters did not hold the Legault government to account for the general state of Quebec's economy in a way that would be significantly different than is the case for supporters of the opposition parties. That said, we can note that Conservative supporters were the most critical of the CAQ government's economic record, with 88 per cent of them stating that Quebec's economy had gotten worse during the past year, as opposed to 50 per cent for the rest of the sample. In a similar way, while PCQ voters were slightly more likely to report a degradation of their personal financial situation over the past year (with 45% of them stating it had gotten worse compared to 30% in the rest of the sample), the marginal effects reported in Figure 4 indicate that this evaluation is not significantly related to a vote in favour of the party.
Finally, Figure 4 also presents the results associated with the last determinant of vote choice included in this block of variables, which concerns the government's management of the COVID-19 health crisis. Clearly, Conservative voters were strongly dissatisfied with the Legault government's management of the pandemic. While the average score on our COVID-19 dissatisfaction index is 0.38, this score jumps to 0.89 among the PCQ clientele. Unsurprisingly, dissatisfaction with the management of the pandemic is found to be an important driver of support for the PCQ in the regression model, although not significantly differently than it is for the PQ. We can also underline that this negative judgment towards the government on the part of PCQ voters seems to have been mostly limited to its overall management of the crisis, since we have seen in the same figure that a degradation of respondents’ personal financial situation over the past year had no significant impact on support for the PCQ.
Another way to assess the impact of dissatisfaction towards the management of the pandemic on the decision to vote for the PCQ, compared to the other parties, is to create the profile of an average voter, and to progressively change their attitude regarding the pandemic to see how this affects their probability of supporting the Parti Conservateur. Results from this simulation exercise are presented in Figure 5. Based on the sociodemographic characteristics of the Quebec population, the average Quebec voter would be a 43-year-old francophone man without a university degree, whose household income is between 60,001 and 90,000 dollars a year before taxes and who resides outside one of the six main regions defined previously (that is, rest of Quebec). Categorical variables were fixed to their modal values (that is, “same as now” for traditional sexual minorities, “gotten worse” for provincial economy and “stayed the same” for personal finances), while continuous predictors were set to their mean values with the exception of COVID-19 dissatisfaction, which was set at its minimum value to better assess the impact of this factor. The average voter would also vote No in a referendum on independence. As can be seen in Figure 5 (left panel), with these characteristics, our average voter would have a less than 1 per cent chance of voting for the PCQ. Now, let's say that our average voter displays a level of dissatisfaction towards the government's management of the pandemic that is one standard deviation above the average value for this variable (middle panel of Figure 5). His probability of voting for the Parti Conservateur would increase to about 7 per cent. Finally, let's say that our voter is now very much dissatisfied with the way the COVID-19 pandemic was managed (right panel of Figure 5). Our voter would then have a 66 per cent probability of voting for the PCQ, with this party being the clear beneficiary of intense pandemic-related dissatisfaction.
Predicted Probabilities of Voting for Each of the Main Parties, Average Voter
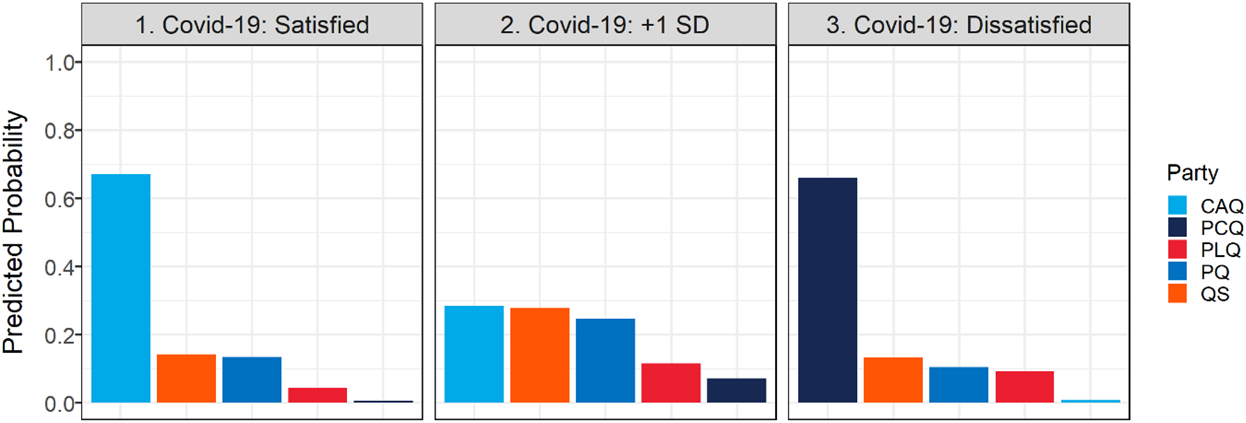
These simulation results allow us to better appreciate the extent to which dissatisfaction with the CAQ government's management of the COVID-19 pandemic fueled support for the Parti Conservateur. Clearly, short-term grievances related to the government's management of the pandemic help explain the surge of the PCQ in the 2022 Quebec election. That said, our model's results indicate that the PCQ also presents, to a limited extent, the profile of a right-wing populist party, not only in terms of the economic orientations of its clientele (including lesser support for government actions against climate change) but also regarding its cynical view of the political elite and its agreement with a populist view of politics.
Discussion and Conclusion
The sudden surge of the Parti Conservateur du Québec is one of the only surprising outcomes of the October 2022 Quebec provincial election. Since the PCQ partly campaigned on short-term dissatisfaction with COVID-19 health measures, it is worth asking whether this party has more deeply anchored ideological roots among the Quebec electorate. For many individuals, the COVID-19 pandemic was a source of hardships and frustrations. Visiting and travel restrictions, social distancing, business closures, mask mandates and mandatory vaccine certificates to access stores, restaurants and crowded venues were seen by some as unacceptable infringements of their fundamental rights and freedoms. With its clear libertarian stance, the PCQ was able to tap into the frustrations of a sizable segment of the Quebec electorate. That said, our empirical analysis of public opinion data collected during and after the 2022 election campaign has allowed us to show that, beyond pandemic-related issues, the PCQ was also able to mobilize a variety of ideological orientations, notably involving egalitarianism and political disaffection, that are often associated with support for right-wing populist parties in other parts of the Western world. As such, the PCQ does seem to occupy an ideological niche of its own within Quebec's evolving party system. This idea is also reinforced by the relatively stable support enjoyed by Duhaime's party in vote intention polls since the election. The success of the PCQ also points to changes in the patterns of party system fractionalization in Quebec. While in the twentieth century insurgent parties in this province were often the product of disagreements regarding the place of Quebec in Canada (Johnston, Reference Johnston2017), the newest additions to the province's party system, of which the PCQ is the latest, tend to focus primarily on issues of social justice or individual freedom outside the framework of constitutional debates.
The question, of course, is how large is the PCQ's niche. Our analyses suggest that Conservative supporters hold rather extreme views on many of these ideological dimensions. In addition, several of these policy stances, especially on the economy, clearly harken back to past ADQ positions, which suggests some dissatisfaction among the right-wing constituency of the province with the policy outcomes of the ADQ-CAQ merger and the first CAQ mandate (see also Béland et al., Reference Béland, Dinan, Jacques and Marier2023). Duhaime's efforts to forge closer ties with Pierre Poilievre's federal Conservatives in the year that followed the 2022 Quebec election (Bellavance, Reference Bellavance2023) seem to have been aimed, accordingly, at reinforcing his party's image as a genuine right-wing vehicle among his partisans and reassuring them about the PCQ's ideological commitments. This rapprochement certainly recalls Mario Dumont's similar attempts made during the mid-2000s (Lawlor and Bélanger, Reference Lawlor, Bélanger, Farney and Rayside2013), something that adds credence to the central proposition of this article that the PCQ represents, above all, a revival of the old ADQ, whose surge in 2022 was helped, beyond the pandemic, by the CAQ's gradual shift to the political and economic centre.
Competing interests
The authors declare none.
Supplementary Material
The supplementary material for this article can be found at https://doi.org/10.1017/S0008423924000829.


 Open access