


1. Introduction
The transport of solutes through porous media is a fundamental topic with extensive applications across various fields, including geological carbon sequestration (Huppert & Neufeld Reference Huppert and Neufeld2014), fuel cells (Peng et al. Reference Peng, Kulkarni, Huang, Omasta, Ng, Zheng, Wang, LaManna, Hussey and Varcoe2020), packed-bed reactors (Jurtz, Kraume & Wehinger Reference Jurtz, Kraume and Wehinger2019) and microcirculation in the human body (Goirand, Le Borgne & Sylvie Reference Goirand, Le Borgne and Sylvie2021). Hydrodynamic dispersion theory quantifies solute transport by averaging variations in fluid velocity and solute concentration (Sahimi Reference Sahimi2011; Bear Reference Bear2013). Porous media flow exhibits multiscale heterogeneity, characterised by variations in flow velocities both within individual pores (intrapore) and between different pores (interpore). Intrapore flow variability can arise from two primary factors: the no-slip condition, which results in higher velocities at the pore centre and lower velocities near the walls, and the roughness of pore surfaces, which generates complex streamlines and affects solute transport within the pores significantly (Sahimi & Imdakm Reference Sahimi and Imdakm1991; Bizmark et al. Reference Bizmark, Schneider, Priestley and Datta2020). This study focuses exclusively on the impact of the no-slip condition. Interpore flow variability arises from structural disorder across pores (figure 1b), creating preferential flow channels and stagnant regions (Kandhai et al. Reference Kandhai, Hlushkou, Hoekstra, Sloot, Van As and Tallarek2002; Liu et al. Reference Liu, Gong, Xiao and Wang2024a). Both intrapore and interpore variabilities intensify the overall variations of porous media flow, thereby enhancing hydrodynamic dispersion.
Streamlines through (a) SP-1, a regular pack of spheres, and (b) SP-2, a random pack of spheres. Colours render the Eulerian velocity  $u$ normalised by the mean value $\langle u \rangle$. (c) Probability density function (PDF) $\psi _u$ of Eulerian velocities.

The longitudinal dispersion coefficient, a critical parameter in dispersion theory, encapsulates the upscaling effect of the heterogeneous flow field and quantifies the porous medium's capacity to disperse solutes (Dentz, Hidalgo & Lester Reference Dentz, Hidalgo and Lester2023). Experimental data from disordered porous media reveal distinct scaling behaviours between the hydrodynamic dispersion coefficient  $D_L$ and the Péclet number $Pe$, categorised into different regimes (Sahimi Reference Sahimi2011; Bear Reference Bear2013). In the range $10^0 < Pe < 10^3$, termed the power-law regime, there exists a power-law scaling described by $D_L / D_m \sim Pe^{\kappa } (\kappa \approx 1.2)$ (Sahimi Reference Sahimi2011), where $D_m$ denotes the molecular diffusion coefficient. For $10^3 < Pe < 10^6$, known as the convective regime, a linear scaling is observed as $D_L / D_m \sim Pe$ (Sahimi Reference Sahimi2011).
The current understanding of the scaling behaviours between  $D_L$ and $Pe$ remains limited. On the one hand, numerical simulations have yielded conflicting conclusions concerning the primary mechanism driving the power-law regime. Some studies (Sahimi et al. Reference Sahimi, Hughes, Scriven and Davis1986; Sahimi & Imdakm Reference Sahimi and Imdakm1988; Bijeljic, Muggeridge & Blunt Reference Bijeljic, Muggeridge and Blunt2004; Jha, Bryant & Lake Reference Jha, Bryant and Lake2011; Mehmani & Balhoff Reference Mehmani and Balhoff2015) have emphasised the critical role of intrapore flow variability, while others (De Arcangelis et al. Reference De Arcangelis, Koplik, Redner and Wilkinson1986; Acharya et al. Reference Acharya, van Dijke, Sorbie, Van der Zee and Leijnse2007; Van Milligen & Bons Reference Van Milligen and Bons2014) observe that superlinear scaling can occur without accounting for intrapore flow variability, provided that the pore structure exhibits a certain degree of disorder. On the other hand, both experimental observations (Pfannkuch Reference Pfannkuch1963; Delgado Reference Delgado2005; Lehoux et al. Reference Lehoux, Rodts, Faure, Michel, Courtier-Murias and Coussot2016) and numerical simulations (De Arcangelis et al. Reference De Arcangelis, Koplik, Redner and Wilkinson1986; Maier et al. Reference Maier, Kroll, Bernard, Howington, Peters and Davis2000; Bijeljic et al. Reference Bijeljic, Muggeridge and Blunt2004; Bijeljic & Blunt Reference Bijeljic and Blunt2006; Mostaghimi, Bijeljic & Blunt Reference Mostaghimi, Bijeljic and Blunt2010; Mehmani & Balhoff Reference Mehmani and Balhoff2015) show a transition from superlinear power-law to linear scaling as the Péclet number increases. However, current theoretical models (Saffman Reference Saffman1959; Koch & Brady Reference Koch and Brady1985; Bear & Bachmat Reference Bear and Bachmat1986; Puyguiraud, Gouze & Dentz Reference Puyguiraud, Gouze and Dentz2021) describe the dispersion coefficient $D_L$ as a combination of linear and superlinear terms in relation to the Péclet number $Pe$. These models indicate that once a superlinear growth of $D_L$ with respect to $Pe$ emerges, it will continue as $Pe$ increases, without reverting to a linear relationship.
The discrepancies among studies are attributed to inconsistencies in the relative strengths of interpore and intrapore flow variabilities. These inconsistencies alter flow statistics (figure 1c) and, ultimately, the relationship between  $D_L$ and $Pe$ (Bruderer & Bernabé Reference Bruderer and Bernabé2001). For instance, network simulations have utilised networks with diverse structural disorder, characterised by the distribution of pore sizes (De Arcangelis et al. Reference De Arcangelis, Koplik, Redner and Wilkinson1986; Bijeljic et al. Reference Bijeljic, Muggeridge and Blunt2004; Acharya et al. Reference Acharya, van Dijke, Sorbie, Van der Zee and Leijnse2007) and coordination numbers (Sahimi et al. Reference Sahimi, Hughes, Scriven and Davis1986; Jha et al. Reference Jha, Bryant and Lake2011; Mehmani & Balhoff Reference Mehmani and Balhoff2015), as well as various domain sizes (Bijeljic et al. Reference Bijeljic, Muggeridge and Blunt2004; Jha et al. Reference Jha, Bryant and Lake2011; Mehmani & Balhoff Reference Mehmani and Balhoff2015), leading to varying degrees of interpore flow variability. Theoretical models have limitations in resolving interpore (Saffman Reference Saffman1959; Koch & Brady Reference Koch and Brady1985) or intrapore (Bear & Bachmat Reference Bear and Bachmat1986; Puyguiraud et al. Reference Puyguiraud, Gouze and Dentz2021) flow variability. Thus, the interplay between these flow variabilities and their effect on hydrodynamic dispersion remain poorly understood.
In this work, we address these fundamental issues through a stochastic model that connects structural disorder, flow variability and hydrodynamic dispersion. Our findings indicate that in porous media with diverse distributions of structural disorder, the significance of interpore flow variability on dispersion varies, thereby altering the scaling relationship between the dispersion coefficient and the Péclet number. The robustness and precision of our theoretical model are supported by experimental data and numerical simulations across a wide spectrum of porous media.
2. Theoretical model
We investigate hydrodynamic dispersion in disordered, statistically homogeneous porous media without dead-ends. The pore structure is idealised as a network of pores (junctions) interconnected by throats (bonds), a model widely utilised in studies of flow and transport in porous media (Fatt Reference Fatt1956; Liu et al. Reference Liu, Gong, Zhao, Jin and Wang2022, Reference Liu, Gong, Xiao and Wang2024b). Pores are assumed to have zero volume within which solutes are mixed completely. Throats are conduits with circular cross-sections, where fluid flow follows the Poiseuille law. The global Péclet number is defined as  $Pe = \bar {U} \ell /D_m$. Here $\bar {U}$ denotes the average velocity, which is calculated as the Darcy velocity divided by porosity, and $\ell$ is the characteristic length, typically taken as the grain size.
Solute transport is modelled in the continuous time random walk (CTRW) framework (Berkowitz et al. Reference Berkowitz, Cortis, Dentz and Scher2006) through spatiotemporal transitions, where the solute mass is discretised into tracer points that follow Lagrangian trajectories. During each transition, solute tracer moves from one pore to another via a connecting throat with longitudinal displacement  $\Delta x$ and duration $\Delta t$. The displacement is given by $\Delta x = l \cos \beta$, where $l$ and $\beta$ denote the length of the throat and its alignment angle to the longitudinal direction, respectively. We assume that $\Delta x$ and $\Delta t$ are independent random variables, characterised by the probability density functions (PDFs) $\omega (x)$ and $\psi (t)$, respectively. This assumption is supported by the weak correlation in tracer velocities across pores (Bijeljic, Mostaghimi & Blunt Reference Bijeljic, Mostaghimi and Blunt2011; de Anna et al. Reference de Anna, Le Borgne, Dentz, Tartakovsky, Bolster and Davy2013; Dentz et al. Reference Dentz, Kang, Comolli, Le Borgne and Lester2016; Alim et al. Reference Alim, Parsa, Weitz and Brenner2017). Within the CTRW framework, the longitudinal dispersion coefficient $D_L$ is derived as
 $$\begin{gather} D_L = \frac{\langle x \rangle^2}{2 \langle t \rangle} \frac{\langle t^2 \rangle - \langle t \rangle^2}{\langle t \rangle^2}, \end{gather}$$
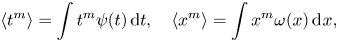 $$\begin{gather}\langle t^{{m}} \rangle = \int t^{{m}} \psi(t) \,{\rm d} t,\quad \langle x^{{m}} \rangle = \int x^{{m}} \omega(x) \,{{\rm d}\kern0.7pt x}, \end{gather}$$
where  ${{m}}=1,2$. A detailed derivation of this expression is provided in the supplementary material available at https://doi.org/10.1017/jfm.2024.1131, see also Dentz et al. (Reference Dentz, Cortis, Scher and Berkowitz2004).
Equation (2.1) emphasises the critical role of  $\psi (t)$ in the scaling relationships between $D_L$ and $Pe$. The PDF $\psi (t)$ characterises the statistical properties of tracer transition times throughout the network and is shaped by both intrapore and interpore flow variabilities, as well as molecular diffusion. Molecular diffusion plays two primary roles: solute tracer moves across streamlines via diffusion, sampling flow velocities within the conduit; and as the slowest transport mechanism, it sets the maximum transition time as the axial diffusion time $\tau _{{D}} = l^2/D_m$.
Only a few studies (de Anna et al. Reference de Anna, Quaife, Biros and Juanes2017; Dentz, Icardi & Hidalgo Reference Dentz, Icardi and Hidalgo2018; Puyguiraud et al. Reference Puyguiraud, Gouze and Dentz2021) have attempted to derive  $\psi (t)$ from structural and flow properties, and these are predominantly limited to the scenario where tracer transitions are governed by advection. However, strong interpore flow variability can result in diverse modes of tracer transitions. For example, transitions may be primarily advection-dominated in preferential flow conduits while it is diffusion-dominated in others. Consequently, these studies (de Anna et al. Reference de Anna, Quaife, Biros and Juanes2017; Dentz et al. Reference Dentz, Icardi and Hidalgo2018; Puyguiraud et al. Reference Puyguiraud, Gouze and Dentz2021) do not fully capture the characteristics of the PDF $\psi (t)$. Moreover, the relative contributions of intrapore vs interpore flow variabilities to $\psi (t)$ remain unexplored.
We first examine the impact of interpore flow variability on tracer transitions. This variability is characterised by variations in flow properties across conduits, including the flow rate  $q$, the maximum velocity $v$ and the advection time $\tau = l/v$. Interpore flow variability arises from the random distribution of geometrical properties of conduits, such as radius $R$, length $l$, orientation angle $\beta$ and cross-sectional shape. According to the Poiseuille law, the hydraulic conductance $K$ of a conduit, defined as the volumetric flow rate per unit pressure drop, conforms to $K \sim R^4 l^{-1}$. For homogeneous networks, it is reasonable to assume a uniform pressure gradient $G = |\boldsymbol {\nabla } P|$ along the longitudinal direction. The pressure drop across the throat is given by $\Delta P = G l \cos \beta$, leading to the following relationships: $q \sim R^4 G \cos \beta$, $v \sim R^2 G \cos \beta$ and $\tau \sim R^{-2} l (G\cos \beta )^{-1}$. It is apparent that the radius $R$ exerts the most significant influence on interpore flow variability. Thus, we assume the conduit radii within the network are randomly distributed, while other properties, such as length, orientation and cross-sectional shape, remain constant across all conduits.
The PDF  $\psi _R(R)$ of conduit radii within porous media is commonly modelled using power-law (de Anna et al. Reference de Anna, Quaife, Biros and Juanes2017), Weibull (Assouline, Tessier & Bruand Reference Assouline, Tessier and Bruand1998; Dentz et al. Reference Dentz, Icardi and Hidalgo2018) and Gamma (Johnston Reference Johnston1998) distributions. Asymptotic dispersion is shaped by smaller-sized pores, which determine the tail of $\psi (t)$ (Puyguiraud et al. Reference Puyguiraud, Gouze and Dentz2021). Since Weibull and Gamma distributions behave as power laws for small values, $\psi _R(R)$ is modelled here as a power-law distribution,
 \begin{equation} \psi_R(R) \sim R^\alpha,\quad R \in [R_{min}, R_{max}], \end{equation}
where  $R_{min}$ and $R_{max}$ represent the minimum and maximum radii, respectively. Thus, the PDF of advection times $\tau$ behaves as $\psi _\tau (\tau ) \sim \tau ^{-(\alpha +3)/2}$. Our model focuses on hydrodynamic dispersion, where advection dominates on a global scale. As a result, the fraction of tracer mass entering a connecting tube at a pore node is proportional to the flow rate in that tube, an assumption adopted widely in previous studies (Sahimi et al. Reference Sahimi, Hughes, Scriven and Davis1986; Bijeljic et al. Reference Bijeljic, Muggeridge and Blunt2004; Puyguiraud et al. Reference Puyguiraud, Gouze and Dentz2021). In other words, tracer redistribution at pore nodes is proportional to the flux. Therefore, the PDF $\hat {\psi }_\tau (\tau )$ for tracer selecting a downstream conduit with an advection time of $\tau$ is given by the flux-weighted PDF of $\tau$,
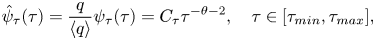 \begin{equation} \hat{\psi}_\tau(\tau) = \frac{q}{\langle q \rangle} \psi_\tau(\tau) = C_{\tau} \tau^{-\theta-2},\quad \tau \in [\tau_{min}, \tau_{max}], \end{equation}
where  $\theta = (\alpha +3)/2$ and $C_{\tau }$ is a normalisation constant. Here $\tau _{min}$ and $\tau _{max}$ denote the minimum and maximum advection times, respectively.
Next, we examine the influence of intrapore flow variability by analysing the advective–diffusive transport of solutes within a circular tube of radius  $R$ and length $l$. To this end, we consider solute transport in Poiseuille flow with a maximum velocity of $v$, an instantaneous injection at the inlet with a flux-weighted radial distribution of solute. An absorbing boundary condition is applied at the outlet, while reflecting boundary conditions are imposed for the inlet and the wall. Although the backward movement of tracer is possible (Aquino & Dentz Reference Aquino and Dentz2018), its effect on hydrodynamic dispersion is minimal and, thus, ignored here. The PDF $\psi _t (t)$ for transition times through the tube is determined by the temporal evolution of solute flux at the outlet. We define the local Péclet number as $Pe_{{t}}=vR / D_m$ and the aspect ratio as $\eta = l / R$ with $\eta > 1$. The axial and radial diffusion times are denoted as $\tau _{{D}} = l^2 / D_m$ and $\tau _{{D,R}} = R^2 / D_m$, respectively. The transport through the tube can be categorised into three distinct modes, and approximate solutions for $\psi _t (t)$ can be derived for each mode (see the supplementary material).
Mode I occurs when  $\tau < \tau _{{D,R}}$, where radial and axial diffusion are negligible. Particles move along streamlines with their transition times through the tube determined by advection. Thus, the distribution of transition times $t$ is expressed as (see the supplementary material)
 \begin{equation} \psi_t(t) = 2\tau^2 t^{{-}3}. \end{equation}
However, molecular diffusion dominates within a layer near the wall due to no-slip condition. The thickness of this layer is estimated to be  $\sqrt {2D_m \tau }$, the radial position of the layer is $r_{{B}} = R - \sqrt {2D_m \tau }$ and its corresponding velocity is $v_{{B}}= v ( 1 - {r_{{B}}^2}/{R^2} )$. It is assumed that tracers within this layer initially arrive at the boundary via diffusion and are subsequently transported by advection along the streamline to the outlet. Consequently, the transition time of the tracers within the layer is
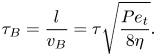 \begin{equation} \tau_{{B}} = \frac{l}{v_{{B}}} = \tau \sqrt{\frac{Pe_{{t}}}{8\eta}}. \end{equation}
Therefore,  $\tau$ and $\tau _{{B}}$ set the lower and upper limits to the transition time, respectively. A simple derivation shows that the truncation time, $\tau _{{B}} \sim R^{-2} \sqrt {R^{3}/R^{-1}} \sim R^{0}$, is independent of $R$ and constant for all conduits in mode I.
Mode II occurs when  $\tau _{{D,R}} \leq \tau < \tau _{{D}}$. The solutes are fully mixed across the transverse direction, and the transition time distribution is strongly peaked near $2\tau$. Therefore, $\psi _t (t)$ is approximated by $\delta (t - 2\tau )$, where $\delta$ denotes the Dirac delta function.
Mode III occurs when  $\tau \geq \tau _{{D}}$, that is, advection is slower than molecular diffusion, and $\psi _t (t)$ is approximately $\delta (t - \tau _{{D}})$.
Therefore, the shape of  $\psi _t (t)$ is conditional on $\tau$ and thus we write
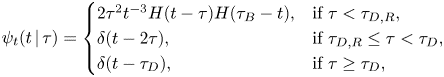 \begin{equation} \psi_t (t\,|\,\tau) = \begin{cases} 2\tau^2 t^{{-}3} H(t - \tau)H(\tau_{{B}} - t), & \text{if } \tau < \tau_{{D,R}}, \\ \delta(t - 2\tau), & \text{if } \tau_{{D,R}} \leq \tau < \tau_{{D}}, \\ \delta(t - \tau_{{D}}), & \text{if } \tau \geq \tau_{{D}}, \end{cases} \end{equation}
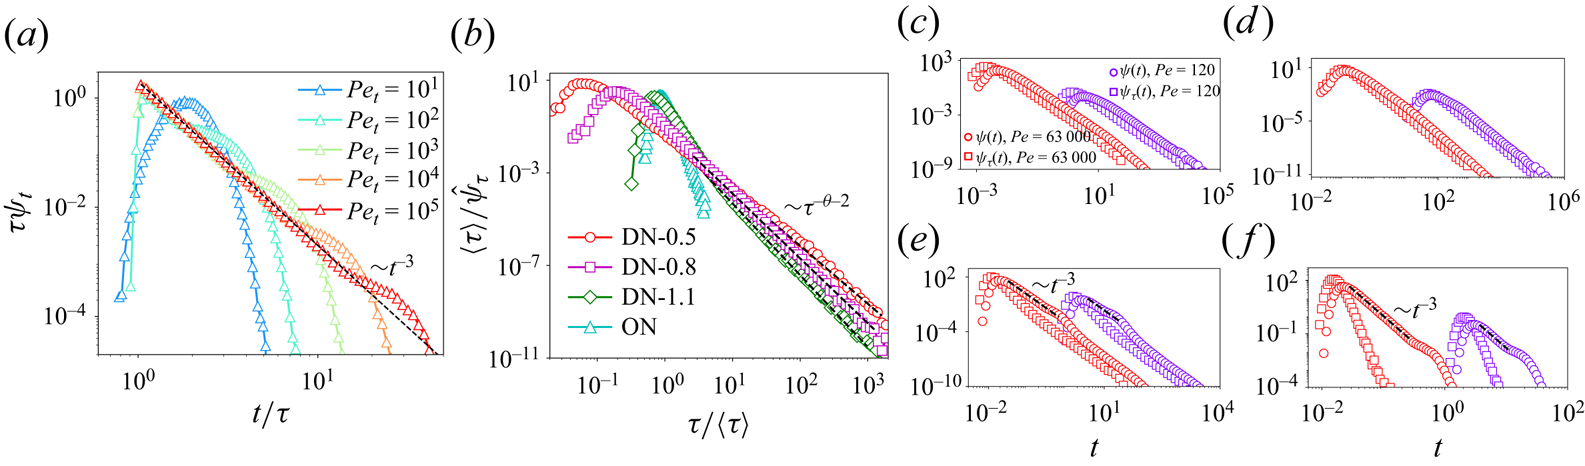
where  $H$ denotes the Heaviside function. These solutions are supported by random walk simulations (figure 2a).
(a) PDF  $\psi _t$ of transition times through a tube with $\eta =10$ for various local Péclet numbers $Pe_{{t}}$. The dashed line depicts the analytical solution for mode I, as described by (2.7). (b) Flux-weighted PDF $\hat {\psi }_{\tau }$ of advection times $\tau$ for the networks used in the simulation, including three disordered networks (DN-0.5, DN-0.8 and DN-1.1), which have large ratios of $\tau _{max}/\tau _{min}$ and corresponding $\theta$ values of 0.5, 0.8 and 1.1, respectively, and one ordered network (ON), characterised by a small ratio of $\tau _{max}/\tau _{min}$. (c)–(f) The global PDF $\psi (t)$ of transition times (circles) compared with $\hat {\psi }_{\tau } (t)$ (squares) for (c) DN-0.5, (d) DN-0.8, (e) DN-1.1 and (f) ON. Here $\psi (t)$ exhibits a tail with the same power exponent of $-\theta -2$ as $\hat {\psi }_{\tau } (t)$ for both (c) DN-0.5 and (d) DN-0.8, consistent with theoretical predictions for cases with a large $\tau _{max} / \tau _{min}$ ratio and $0<\theta <1$. In contrast, $\psi (t)$ shows a heavier tail with a power exponent of $-3$, compared with $\hat {\psi }_{\tau }(t)$, for both (e) DN-1.1 and (f) ON, aligning with theoretical predictions for cases with either a small $\tau _{max} / \tau _{min}$ ratio or $\theta > 1$.
The global PDF,  $\psi (t)$, of tracer transition times is constructed as a weighted sum of the local PDFs, $\psi _t (t\,|\,\tau )$, for individual tubes, expressed as
 \begin{equation} \psi(t) = \frac{1}{N_0} \sum_{{i}=1}^{N_0} \frac{q_{{i}}}{\langle q \rangle} \psi_{t} (t\,|\,\tau_{{i}}) = \int_{\tau_{min}}^{\tau_{max}} \psi_t (t\,|\,\tau) \frac{q}{\langle q \rangle} \psi_\tau (\tau)\,{\rm d}\tau, \end{equation}
where  $N_0$ represents the total number of tubes, and the subscript $i$ indexes each tube. With (2.4), this expression is further simplified to the marginalisation of the joint PDF $\psi _t (t\,|\,\tau ) \hat {\psi }_\tau (\tau )$ with respect to $\tau$,
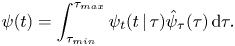 \begin{equation} \psi(t) = \int_{\tau_{min}}^{\tau_{max}} \psi_t (t\,|\,\tau) \hat{\psi}_\tau (\tau) \,{\rm d}\tau. \end{equation}
 The characteristics of  $\psi (t)$ are shaped by the interplay between $\psi _t (t\,|\,\tau )$, which reflects intrapore flow variability, and $\hat {\psi }_{\tau }(\tau )$, which captures interpore flow variability. Here $\hat {\psi }_\tau (\tau )$ may vary significantly in terms of the exponent $\theta$ and the range of advection times $\tau _{max} / \tau _{min}$, modulated by $\alpha$ and $R_{max} / R_{min}$, respectively. Here, $\theta$ is constrained to be positive to ensure an asymptotic regime of constant dispersion.
3. Results and discussion
The expression for  $\psi (t)$ is analysed separately for different values of $\tau _{max} / \tau _{min}$ and $\theta$, detailed derivations are provided in the supplementary material. From (2.2a,b), we derive the leading-order behaviours of $\langle t \rangle$ and
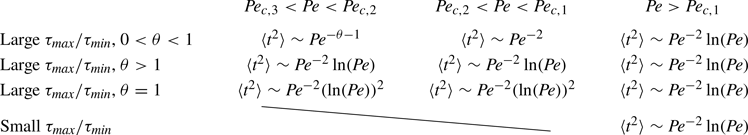
  $\langle t^2 \rangle$, which are summarised in table 1. Subsequently, the scaling relationships between $D_L$ and $Pe$ are determined from (2.1), as outlined in table 2.
Leading-order behaviours of  $\langle t^2 \rangle$ with $Pe$ for networks with various ${\tau _{max}}/{\tau _{min}}$ and $\theta$, while $\langle t \rangle$ consistently follows $\langle t \rangle \sim Pe^{-1}$. A smaller $\theta$ value leads to a heavier tail in the distribution $\hat {\psi }_\tau (\tau )$. The ratio ${\tau _{max}}/{\tau _{min}}$ represents the range of advection times, with large ratios of ${\tau _{max}}/{\tau _{min}}$ estimated to be of the order of $10^2$.
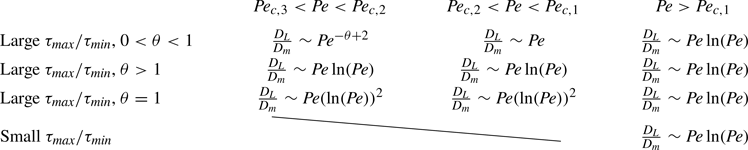
Leading-order behaviours of  $D_L/D_m$ with $Pe$ for networks with various ${\tau _{max}}/{\tau _{min}}$ and $\theta$. A smaller $\theta$ value leads to a heavier tail in the distribution $\hat {\psi }_\tau (\tau )$. The ratio ${\tau _{max}}/{\tau _{min}}$ represents the range of advection times, with large ratios of ${\tau _{max}}/{\tau _{min}}$ estimated to be of the order of $10^2$.
For a large ratio of  $\tau _{max} / \tau _{min}$, the transition modes throughout the network can be classified into three patterns based on $Pe$. We define $Pe_{{c,1}}$ and $Pe_{{c,2}}$ as the minimum Péclet numbers at which the conduit with $\tau _{max}$ reaches modes I and II, respectively, and $Pe_{{c,3}}$ as the minimum Péclet number for the conduit with $\tau _{min}$ as it reaches mode I. The expressions for $Pe_{{c,1}}$, $Pe_{{c,2}}$ and $Pe_{{c,3}}$ can be found in the supplementary material. When $Pe > Pe_{{c,1}}$, all conduits are in mode I. When $Pe_{{c,2}} < Pe < Pe_{{c,1}}$, conduits with smaller $\tau$ are in mode I, while those with larger $\tau$ are in mode II, separated by $\tau _{{0}}$. Here, $\tau _{{0}}$ denotes the maximum $\tau$ of tubes in mode I. When $Pe_{{c,3}} < Pe < Pe_{\text {c,2}}$, the conduits with the smallest to largest $\tau$ are in modes I, II and III, separated by $\tau _{{0}}$ and $\tau _{{D}}$, respectively. When $0 < \theta < 1$, $\hat {\psi }_\tau (\tau )$ dominates $\psi (t)$ for $t \leq \tau _{max}$, resulting in $\psi (t) \sim t^{-\theta -2}$, while $\psi _t (t\,|\,\tau )$ dominates for $\tau _{max} < t \leq \tau _{B}$, leading to $\psi (t) \sim t^{-3}$ (see the supplementary material), as illustrated in figure 2(c,d). When $\theta > 1$, $\psi _t (t\,|\,\tau )$ dominates $\psi (t)$ for $t \leq \tau _{B}$, resulting in $\psi (t) \sim t^{-3}$, while $\hat {\psi }_\tau (\tau )$ dominates for $t > \tau _{B}$, leading to $\psi (t) \sim t^{-\theta -2}$ (see the supplementary material), as depicted in figure 2(e). As $Pe$ increases from $Pe_{{c,3}} < Pe < Pe_{{c,2}}$ to $Pe_{{c,2}}< Pe < Pe_{{c,1}}$ and, finally, to $Pe > Pe_{{c,1}}$, the scaling relationship transitions from $D_L / D_m \sim Pe^{2-\theta }$ to $D_L / D_m \sim Pe$ and, finally, to $D_L / D_m \sim Pe \ln (Pe)$ for $0 < \theta < 1$, whereas a consistent logarithmic scaling of $D_L / D_m \sim Pe \ln (Pe)$ is obtained for $\theta > 1$. For $\theta = 1$, the scaling relationship evolves from $D_L / D_m \sim Pe \ln ^2(Pe)$ to $D_L / D_m \sim Pe \ln (Pe)$ as $Pe$ increases.
For a small ratio of  $\tau _{max}/\tau _{min}$, where $\hat {\psi }_{\tau }(\tau ) \approx \delta (\tau - \tau _{min})$, tracer transitions predominantly occur in mode I. Thus, $\psi _t (t\,|\,\tau )$ dominates, leading to $\psi (t) = 2 \tau _{min}^2 t^{-3}$ for $\tau _{min} \leq t < \tau _{{B}}$, as illustrated in figure 2(f). This behaviour leads to a logarithmic scaling of $D_L / D_m \sim Pe \ln (Pe)$.
The theoretical predictions are validated by experimental data on the dispersion coefficients of bead packs (Pfannkuch Reference Pfannkuch1963) and by network simulations. Four networks are utilised in the simulation, including three disordered networks (DN-0.5, DN-0.8 and DN-1.1), which have large ratios of  $\tau _{max}/\tau _{min}$ and corresponding $\theta$ values of 0.5, 0.8 and 1.1, respectively, and one ordered network (ON), characterised by a small ratio of $\tau _{max}/\tau _{min}$, as depicted in figure 2(b). DN-0.8 is extracted from a monodisperse sphere pack whereas the other networks are artificially generated with a body-centred cubic lattice structure and varying pore size distributions. Since a monodisperse sphere pack closely replicates bead packs in dispersion experiments, DN-0.8 is employed to reproduce the experimental data. The reliability of the network model has been thoroughly confirmed by experimental data and direct numerical simulations (Liu et al. Reference Liu, Gong, Zhao, Jin and Wang2022, Reference Liu, Gong, Xiao and Wang2024b; please also see the supplementary material).
Network simulations based on DN-0.5 and DN-0.8 show a transition from  $D_L / D_m \sim Pe^{2-\theta }$ to $D_L / D_m \sim Pe$ (figure 3). This observation supports theoretical predictions for cases with a large $\tau _{max} / \tau _{min}$ ratio and $0<\theta <1$. The power exponents $\kappa$ of the superlinear scaling are 1.5 and 1.2 for DN-0.5 and DN-0.8 (figure 3a), respectively, matching the theoretical prediction $\kappa =2-\theta$. Furthermore, $\kappa = 1.2$ of DN-0.8 aligns with experimental results (Sahimi Reference Sahimi2011; Bear Reference Bear2013). However, in the cases of DN-0.5 and DN-0.8, the scaling relationship $D_L / D_m \sim Pe \ln (Pe)$ is not observed, as achieving this scaling would require $Pe > 10^9$ (see the supplementary material), a threshold that arises from pronounced interpore flow variability and cannot be achieved under laminar flow conditions. Nonetheless, this does not preclude the possibility of observing this scaling in other media at more realistic, lower $Pe$.
$Pe$.
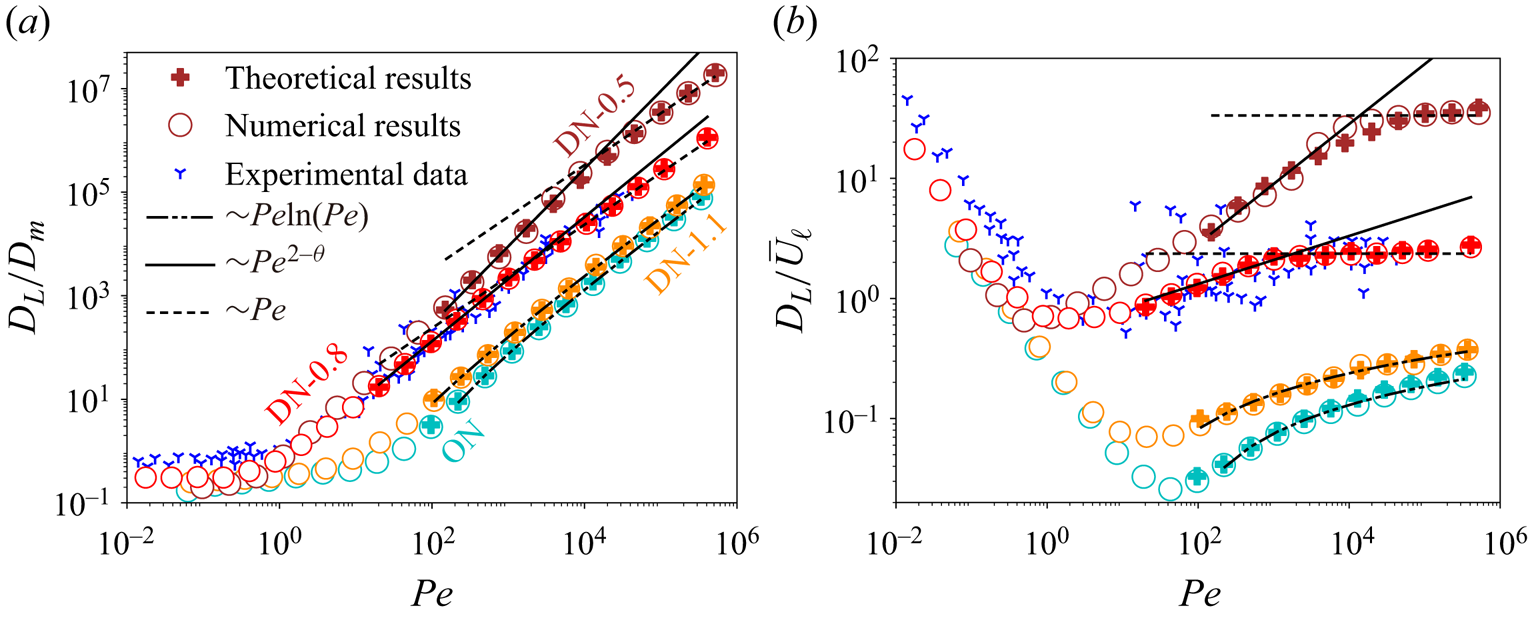
(a) Scaling relationships of  $D_L / D_m$ vs $Pe$ for various networks, including three disordered networks, DN-0.5 (brown), DN-0.8 (red) and DN-1.1 (orange), which have large ratios of $\tau _{max}/\tau _{min}$ and corresponding $\theta$ values of 0.5, 0.8 and 1.1, respectively, and one ordered network, ON (cyan), characterised by a small ratio of $\tau _{max}/\tau _{min}$. Theoretical results are derived from (2.1), where $\langle x \rangle = l \cos \beta$, and the moments $\langle t \rangle$ and $\langle t^{{2}} \rangle$ are calculated by (2.2a,b) using the PDF $\psi (t)$ given by (2.9). These theoretical predictions apply to hydrodynamic dispersion, where advection globally dominates transport. Numerical results are obtained through network simulations. The experimental data on the dispersion coefficients of bead packs (Pfannkuch Reference Pfannkuch1963) are utilised to validate theoretical predictions and network simulations for DN-0.8. The global Péclet number is defined as $Pe = \bar {U} \ell /D_m$. (b) The relationship between $D_L / \bar {U} \ell$ (i.e. $D_L / D_m Pe$) vs $Pe$, using the same data and legends as in (a). Both DN-0.5 and DN-0.8 show a transition from $D_L / D_m \sim Pe^{2-\theta }$ to $D_L / D_m \sim Pe$, matching with the theoretical predictions for cases with a large $\tau _{max} / \tau _{min}$ ratio and $0<\theta <1$. In contrast, both DN-1.1 and ON consistently follow the scaling $D_L / D_m \sim Pe \ln (Pe)$, in agreement with theoretical predictions for cases with either a small $\tau _{max} / \tau _{min}$ ratio or $\theta > 1$.
The theoretical model indicates that the power-law regime is driven by significant interpore flow variability, which dominates the PDF of transition times and results in  $\psi (t) \sim t^{-\theta - 2}$. In narrow tubes, characterised by low flow velocities and large advective transition times, transport is diffusion-dominated for $Pe_{\text {c,3}} < Pe < Pe_{\text {c,2}}$, resulting in a truncated range of transition times spanning from $\tau _{min}$ to $\tau _{{D}}$. Consequently, we obtain $\langle t \rangle \sim Pe^{-1}$ and $\langle t^2 \rangle \sim Pe^{-\theta -1}$, and ultimately $D_L / D_m \sim Pe^{2-\theta }$ (see the supplementary material). This finding contrasts with prior studies (Koch & Brady Reference Koch and Brady1985; Sahimi et al. Reference Sahimi, Hughes, Scriven and Davis1986; Sahimi & Imdakm Reference Sahimi and Imdakm1988; Jha et al. Reference Jha, Bryant and Lake2011; Mehmani & Balhoff Reference Mehmani and Balhoff2015) that emphasise the importance of intrapore flow variability, typically linked to a logarithmic scaling relationship of $D_L / D_m \sim Pe \ln (Pe)$, which is closely approximated by $Pe^{1.2}$. However, this logarithmic term fails to explain the power-law regime of DN-0.5, which is characterised by a power exponent of 1.5. The limitation arises because $\ln (Pe)$ can only approximate $Pe^{a}$ when $a$ falls between 0.1 and 0.2, making it inadequate for more general cases where $a$ varies. Thus, the logarithmic term does not offer a valid physical explanation for the power-law regime. For $Pe_{{c,2}} < Pe < Pe_{{c,1}}$, transport within the narrowest conduit changes to mode II, leading to transition times spanning from $\tau _{min}$ to $\tau _{max}$, no longer truncated by $\tau _{{D}}$. Thus, we get $\langle t \rangle \sim Pe^{-1}$ and $\langle t^2 \rangle \sim Pe^{-2}$, and ultimately $D_L / D_m \sim Pe$ (see the supplementary material). The theory successfully predicts the transition from the power-law regime to the convective regime, a phenomenon not explained by previous theoretical models (Saffman Reference Saffman1959; Koch & Brady Reference Koch and Brady1985; Bear & Bachmat Reference Bear and Bachmat1986; Puyguiraud et al. Reference Puyguiraud, Gouze and Dentz2021). A similar trend was obtained by Bijeljic & Blunt (Reference Bijeljic and Blunt2006) based on empirical PDFs of transition times, while our model offers the first theoretical confirmation. In contrast, network simulations indicate that hydrodynamic dispersion consistently follows a logarithmic scaling of $D_L / D_m \sim Pe \ln (Pe)$ for both DN-1.1 and ON, as shown in figure 3. This result aligns perfectly with the theoretical predictions for networks characterised by either a small $\tau _{max}/\tau _{min}$ ratio or $\theta > 1$.
4. Conclusions
The theoretical model elucidates the scaling relationships between the hydrodynamic dispersion coefficient and the Péclet number across various porous media. We demonstrate that variations in structural disorder influence the relative significance of interpore vs intrapore flow variabilities, leading to distinct scaling behaviours. Specifically, in porous media characterised by a high ratio of  $\tau _{max}/\tau _{min}$ and $0 < \theta < 1$, the scaling behaviour transitions from $D_L / D_m \sim Pe^{2-\theta }$ to $D_L / D_m \sim Pe$, and eventually to $D_L / D_m \sim Pe \ln (Pe)$, as Péclet number increases. In contrast, when the ratio $\tau _{max}/\tau _{min}$ is low or $\theta$ exceeds 1, a consistent logarithmic scaling of $D_L / D_m \sim Pe \ln (Pe)$ is observed. The power-law and linear scaling occur when interpore variability predominates over intrapore variability, while logarithmic scaling arises under the opposite condition. This framework provides valuable insights for modulating dispersion in porous media. Future research will aim to extend the framework to explore preasymptotic dispersion, a topic of broad interest (Di Federico & Neuman Reference Di Federico and Neuman1998; Dentz et al. Reference Dentz, Cortis, Scher and Berkowitz2004; Puyguiraud et al. Reference Puyguiraud, Gouze and Dentz2021). Although the model primarily applies to hydrodynamic dispersion ( $Pe > 1$), it can also be adapted to more complex flow conditions, such as multiphase flow and non-Newtonian flow.
Supplementary material
Supplementary material is available at https://doi.org/10.1017/jfm.2024.1131.
Funding
This work is financially supported by the NSF of China (grant numbers 12432013 and 12272207), National Key R&D Program of China (grant number 2019YFA0708704) and the Tsinghua University Initiative Scientific Research Program. M.D. acknowledges funding by the European Union through ERC grant KARST (project number 101071836). T.A. acknowledges financial support through the HydroPoreII project (PID2022-137652NB-C42), funded by MICIU/AEI/10.13039/501100011033 and ERDF/EU, and by the European Union (ERC Uplift 101115760).
Declaration of interests
The authors report no conflict of interest.
Author contributions
M.W. conceived and promoted this work. M.D. performed the theoretical derivations. Y.L. performed the simulations and theoretical derivations. Y.L. wrote the paper and M.W. revised the text. M.D., T.A. and H.X. performed the simulations and revised the text.


 Open access