

Introduction
Ocean surface waves have been observed to penetrate tens and, at times, hundreds of kilometres into the sea-ice-covered ocean (Reference KohoutKohout and others, 2014). The waves cause the ice to bend and flex. The ice can only endure a certain degree of flexure before it fractures into floes with diameters on the order of local wavelengths (Reference Langhorne, Squire and FoxLanghorne and others, 1998). In this way, waves regulate maximum floe sizes. Simultaneously, the presence of ice cover attenuates the waves. Waves therefore retain the intensity to fracture the ice for a finite distance only. Moreover, ice cover filters the wave spectrum preferentially towards low frequencies, so that wavelengths and, consequently, maximum floe sizes generally increase with distance travelled (Reference SquireSquire and Moore, 1980), until winds, currents and further waves reconfigure the simple arrangement.
Wave attenuation is typically modelled as an accumulation of partial wave reflections and transmissions by floes (see Reference BennettsBennetts and Squire, 2012, and references therein). Comparatively few fracture models exist. Those that do exist are based on wave-induced flexural motion of the ice, resulting in strains that exceed a threshold (e.g. Reference Langhorne, Squire, Fox and forLanghorne and others, 2001).
Until recently, wave attenuation and ice fracture models have been independent of one another. Attenuation models consider the floe size distribution to be known. Fracture models consider the distribution of wave energy to be known. However, wave attenuation and ice fracture are coupled via the floe size distribution. The rate of wave attenuation depends on the floe size distribution, which is regulated by wave-induced fracture. Fracture depends on the local wave energy, which is controlled by wave attenuation imposed by the ice cover (Reference KohoutKohout and Meylan, 2008).
Reference Dumont, Kohout and BertinoDumont and others (2011) and Reference Williams, Bennetts, Squire, Dumont and BertinoWilliams and others (2013a,Reference Williams, Bennetts, Squire, Dumont and Bertinob) developed a wave-ice interaction model (WIM), in which wave attenuation and ice fracture are coupled processes. The WIM predicts the distribution of wave energy and the resulting floe size distribution simultaneously, given an incident wave forcing from the open ocean and properties of the ice cover.
Reference Dumont, Kohout and BertinoDumont and others (2011) and Reference Williams, Bennetts, Squire, Dumont and BertinoWilliams and others (2013a,Reference Williams, Bennetts, Squire, Dumont and Bertinob) designed the WIM to link wave and sea-ice model components of large-scale operational ice-ocean forecasting models. The WIM is nested in regions of operational interest in the large-scale models using refined spatial and temporal grids. The WIM then provides prognostic information regarding the floe size distribution and wave activity in the ice-covered ocean, potentially leading to more accurate forecasts for the safety of offshore engineering activities.
More generally, the WIM provides an opportunity to integrate prognostic wave and floe size information into oceanic general circulation models (OGCMs) used for climate studies, and here considered to contain wave and sea-ice model components. The information will improve the accuracy of existing models of floe-size-dependent processes in the vicinity of the ice edge, such as form drag (Reference Tsamados, Feltham, Schroeder and FloccoTsamados and others, 2014), and promote development of new models of wave- and floe-size-dependent processes, such as accelerated melt of floes due to wave overwash (Reference MassomMassom and Stammerjohn, 2010).
Subgridding incurs a large computational cost. It is therefore not an appropriate method to implement the WIM on circumpolar or global scales. An alternative numerical implementation is proposed here, for a modified version of the WIM. The new method does not involve subgrid spatial or temporal discretizations. Instead, the floe size distribution and the rate of attenuation are balanced in the cell.
Application of the new scheme to an idealized version of the modified WIM is presented. Results are validated by comparison to results produced by the method of Reference Williams, Bennetts, Squire, Dumont and BertinoWilliams and others (2013b).
Model Description
Consider a transect of the ocean surface containing ice cover. Points on the transect are defined by the coordinate x 6 (0, L). The transect represents a single cell in an OGCM. The time frame under consideration, t ∊ (0, T), is equivalent to a single time step in the OGCM. For climate models L ∼ 50 km and T ∼ 1 hour. The sea-ice model component of the OGCM is assumed to provide an average ice thickness, h, and concentration of the ice cover, c. (Contemporary sea-ice models distribute ice thickness over multiple categories.) The average ice thickness h = 0.5 m and concentration c = 0.75 are prescribed for the idealized model results presented later.
Let the wave energy density spectrum at point x and time t be denoted S(w;x,t), where ω is angular frequency. The domain x ∊ (0, L) is considered to be free of waves initially. An incident wave spectrum is prescribed at the left-hand end of the domain, x = 0. Incident wave forcing is steady over the time interval considered.
The incident spectrum is transported through the transect according to the energy-balance equation
The quantity cg is the group velocity of the waves. Reference Williams, Bennetts, Squire, Dumont and BertinoWilliams and others (2013b) provide numerical evidence that ice fracture predicted by the WIM is insensitive to wave dispersion. Although the finding is not conclusive, for simplicity dispersion is neglected for the present application, i.e. a constant value of cg is used in the transport equation. Further, it is assumed that the wave spectrum travels the length of the transect in the time frame, i.e. cg = L/T, thus alleviating the need to specify a value for cg.The quantity α(w;x,t) is the attenuation coefficient, i.e. the exponential attenuation rate of wave energy per meter. The expression α = ca/{d) is used here, where d denotes floe diameter, ⟨·⟩ denotes the mean of the included quantity and a(ω, h) is the attenuation rate per floe, calculated using the model of Reference BennettsBennetts and Squire (2012). The attenuation coefficient therefore depends on ice thickness and concen tration. It also depends on the floe size distribution, which is calculated by the WIM. The floe size distribution is defined by its probability density function p(d;x,t). The floe size distribution, and hence the attenuation coefficient, vary suddenly in time if wave-induced ice fracture occurs. The occurrence of fracture, in turn, depends on the wave energy spectrum. Calculation of the wave energy spectrum, S, and the floe size distribution, p, are therefore coupled via the attenuation coefficient.
In order to isolate wave-ice interactions, the above version of the transport equation (1) neglects nonlinear transfer of wave energy between frequencies, wave energy input due to winds, long-range attenuation of swell, and attenuation due to wave breaking and whitecapping. To the authors' knowledge, the importance of these processes in the ice-covered ocean is not yet known. The fracture model derived by Reference Williams, Bennetts, Squire, Dumont and BertinoWilliams and others (2013a) is used. The model is based on strains imposed on the ice cover by wave motion, in which the ice is modelled as a thin-elastic beam. The fracture condition is
where E = 2 /m0[e] is the strain imposed on the ice by the waves. The quantity m 0 is the zeroth moment of strain. The nth moment of strain is defined as
where k is the ice-coupled wavenumber (Reference Williams, Bennetts, Squire, Dumont and BertinoWilliams and others, 2013a). The quantity ∊ c = σc/Y* is the fracture limit of the ice, where ac is the flexural strength of the ice, Y* is the effective Young's modulus of the ice and Pc is a chosen critical probability.
The expression![]() MPa is used for the flexural strength, in which vb denotes brine volume fraction. Reference Timco and BrienTimco and O'Brien (1994) used 939 flexural strength measurements to derive the expression. (The root brine volume fraction ranged from 0.15 to 0.5, approximately, for those measurements obtained in situ using cantilever beams.)
MPa is used for the flexural strength, in which vb denotes brine volume fraction. Reference Timco and BrienTimco and O'Brien (1994) used 939 flexural strength measurements to derive the expression. (The root brine volume fraction ranged from 0.15 to 0.5, approximately, for those measurements obtained in situ using cantilever beams.)
The expression Y* = {10(1 3.51 vb) 1 }GPa, as derived by Reference Williams, Bennetts, Squire, Dumont and BertinoWilliams and others (2013a), is used for the effective Young's modulus. (Williams and others noted that in situ measurements on large samples of sea ice often produce smaller values of the effective Young's modulus.)
The critical probability limit for a narrow-band spectrum, Pc = exp (-1), is used. Reference Williams, Bennetts, Squire, Dumont and BertinoWilliams and others (2013b) conducted a numerical study of the sensitivity of ice fracture to the value of the critical probability.
Fracture occurs if inequality (2) is satisfied. If fracture occurs, the maximum floe diameter is set to be equal to half of the dominant wavelength, i.e. dmx = λ/2. The dominant wavelength is calculated from the dispersion relation for the ice-covered ocean (e.g. Bennetts and Squire, 2011), using the dominant wave period
is the nth spectral moment of the surface elevation 77 (WMO, 1998). The maximum floe diameter parameterizes the floe size distribution. The floe size distribution is otherwise specified. A truncated power-law floe size distribution is used. The corresponding probability density function is
where dmn = 20 m is a chosen minimum floe diameter and 7 = 2 + log2(0.9) is the chosen exponent (Reference Dumont, Kohout and BertinoDumont and others, 2011; Reference Toyota, Haas and TamuraToyota and others, 2011; Reference Williams, Bennetts, Squire, Dumont and BertinoWilliams and others, 2013a).
Reference Williams, Bennetts, Squire, Dumont and BertinoWilliams and others (2013b) used numerical results to show that W IM ice-fracture predictions are insensitive to the proportion of wave energy lost to ice fracture, if >30% of wave energy is lost to fracture. Experimental data do not exist to support or refute the assumption. It is therefore assumed that all wave energy is lost, i.e. steady-state conditions apply.
Numerical Implementation
Method of Reference Williams, Bennetts, Squire, Dumont and BertinoWilliams and others (2013b)
Reference Williams, Bennetts, Squire, Dumont and BertinoWilliams and others (2013b) applied spatial, temporal and spectral discretizations to the WIM. For each time step the following sequence of executions is applied:
1. Advection: The discretized wave spectrum is mapped to an intermediate spectrum by solving the energy-balance equation (1) without attenuation, i.e. a = 0.
2. Attenuation: The intermediate wave spectrum is attenuated according to the properties of the ice it has just travelled through.
3. Fracture: In each cell, fracture condition (2) is applied. If the wave spectrum in a given cell is sufficient to cause fracture, the maximum floe diameter in the cell is set to half of the dominant wavelength. However, if the dominant wavelength is greater than the existing maximum diameter, no change is made.
Reference Williams, Bennetts, Squire, Dumont and BertinoWilliams and others (2013b) set the initial maximum diameters to a large value ∼500 m, in cells where the maximum floe diameter is not otherwise initialized.
New method without spatial or temporal discretizations
An ice cover acts as a low-pass filter to waves, i.e. the attenuation rate decreases as frequency decreases/period increases. Consequently, the wave spectrum increasingly skews towards low frequencies the farther it propagates into the ice-covered ocean, and the associated wavelength becomes larger. The maximum floe diameter thus increases with distance away from the ice edge in the wave-induced fracture region.
The low-pass filter observation is the basis of an alternative numerical implementation of the WIM proposed below, which does not require spatial or temporal discretizations. The observation is translated to the assumption that the maximum floe diameter is due to ice fracture at the far end of the transect, x = L, or the farthest distance into the transect for which the wave spectrum is capable of causing fracture.
The problem reduces to (1) determining if the wave spectrum at x = L is sufficient to cause ice fracture, and, if not, (2) determining the farthest point into the transect at which the wave spectrum is capable of causing ice fracture. However, the wave spectrum and the maximum floe diameter must be calculated simultaneously, because they are coupled via the attenuation coefficient.
Suppose a trial value is specified for the maximum floe diameter, and hence the attenuation coefficient is known. The wave spectrum atx = L is then obtained directly from the energy-balance equation (1). The associated strain, EL(dmx), and wavelength, λ L (dmx), atx = L are calculated as described at the end of Section 2. Three scenarios are possible:
1. the maximum floe diameter is less than half the wavelength;
2. the maximum floe diameter is greater than half the wavelength; and
3. the maximum floe diameter is equal to half the wavelength.
Scenario 3 is sought here. In scenario 3 the wavelength and the maximum floe diameter balance one another, i.e. the maximum diameter defines a floe size distribution that attenuates the wave spectrum such that the wavelength at x = L is consistent with the maximum diameter. The initial floe diameter is considered to be large. Note that the new method does not require a specific value to be prescribed for the initial maximum diameter.
The maximum diameter that balances the wavelength at x = L is obtained by finding the value of d mx that satisfies the equation
However, for this value of dmx, fracture only occurs if the strain imposed by the wave spectrum on the ice cover at x = L satisfies the inequality
Equation (6) can be solved numerically using a package root-finding algorithm (e.g. MATLAB ™'s fzero function). A check of fracture condition (7) is then performed for the calculated value of dmx.
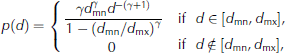
Figure 1 shows results for a problem in which fracture occurs at x = L = 100 km. A Bretschneider incident wave spectrum is used. It is defined by a peak period and a significant wave height, which is convenient for model testing. For this problem, the incident peak period is 9.5 s and the significant wave height is 1 m. However, any incident wave spectrum can be used, including ones derived from observations or wave models such as WAM or Wavewatch.
Results for incident wave spectrum with 1 m significant wave height and 9.5 s peak period, and transect length L = 100 km. (a) Black curve represents half-wavelength/maximum-floe-diameter balance function at x = L. Grey curve represents abscissa axis. (b) Solid curve represents strain imposed on the ice by wave spectrum at x = L, as a function of maximum floe diameter. Broken curve represents the strain threshold Ec . (c) Incident wave spectrum and attenuated wave spectrum at x = L.
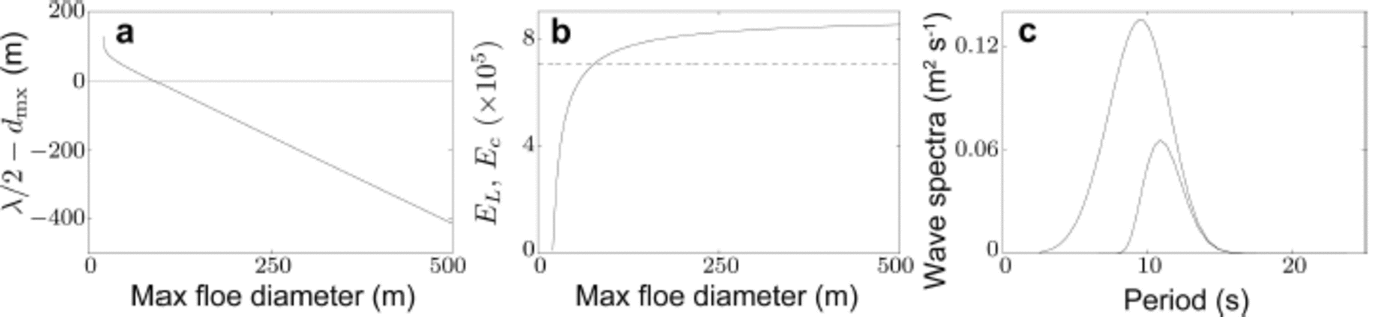
Figure 1a shows the difference between the half-wavelength at x = L and the maximum floe diameter, for a given maximum floe diameter. The half-wavelength and maximum floe diameter balance one another at ∼89.5 m. Figure 1b shows the corresponding strain imposed by the wave spectrum on the ice cover, as a function of maximum floe diameter, and the strain threshold, Ec. It confirms that the wave spectrum is sufficiently intense to fracture the ice cover when dmx ≈ 89.5 m.
The maximum floe diameter is therefore set as dmx ≈ 89.5 m. Figure shows the incident wave spectrum and the attenuated wave spectrum at x = L Skew of the attenuated spectrum towards long periods is clear.
If the fracture condition is not satisfied at x = L, the problem is extended to search for the greatest distance into the transect at which the wave spectrum is capable of causing fracture. The extension is necessary, as wave-induced fracture may be possible for a large proportion of the transect, despite not being possible for the entire transect.
Let x = l be the greatest distance at which fracture can occur. The strain imposed on the ice cover by the wave spectrum at this point, El (d mx), is such that
Additionally, the wavelength at x = l, λ l , must balance the maximum diameter, i.e.
Equations (8a) and (8b) are to be solved simultaneously for l and d mx. In practice, the equations are solved numerically as a set of one-dimensional equations:1. by solving Eqn (8b) to give the maximum diameter that balances the wave spectrum, as a function of distance l,
i.e. d mx = dmx(l); and
2. substituting the expression for d mx = dmx(l) into Eqn (8a) and solving for the distance l.
The extended method is necessary for a problem identical to that used above (Fig. 1) but with a 0.8 m significant wave height for the incident spectrum. Figure 2 shows results produced by the extended method. As in Figure 1, the left-hand and middle panels show the balance equation and strains at x = L. The half-wavelength and maximum floe diameter again balance one another at ∼89.5 m. However, the wave spectrum at x=L= 100 km is not sufficiently intense to fracture the ice for d mx ≈ 89.5 m (or for any dmx less than 500 m; Fig. 2b). Figure 2c shows the strain balance equation as a function of distance l. The largest distance at which the wave spectrum remains sufficiently intense to fracture the ice is ∼71.3km, i.e. wave-induced fracture occurs over a substantial proportion of the transect.
(a, b) Same as Figure 1 but for 0.8 m incident significant wave height. (c) Corresponding strain balance equation as a function of distance, l. In (b) and (c) grey curves represent abscissa axes.
The two numerical implementations use different interpretations of the floe size distribution. The new method uses a single maximum floe diameter for the transect, which, recall, represents a single cell in an OGCM. The floe size distribution, p, for the entire transect is parameterized by the maximum floe diameter. In contrast, the method of Reference Williams, Bennetts, Squire, Dumont and BertinoWilliams and others (2013b) considers the floe size distribution to be a property of the subcells of the transect, i.e. a maximum floe diameter is assigned to each subcell. The floe size distribution for the entire transect is generally not of the form p.
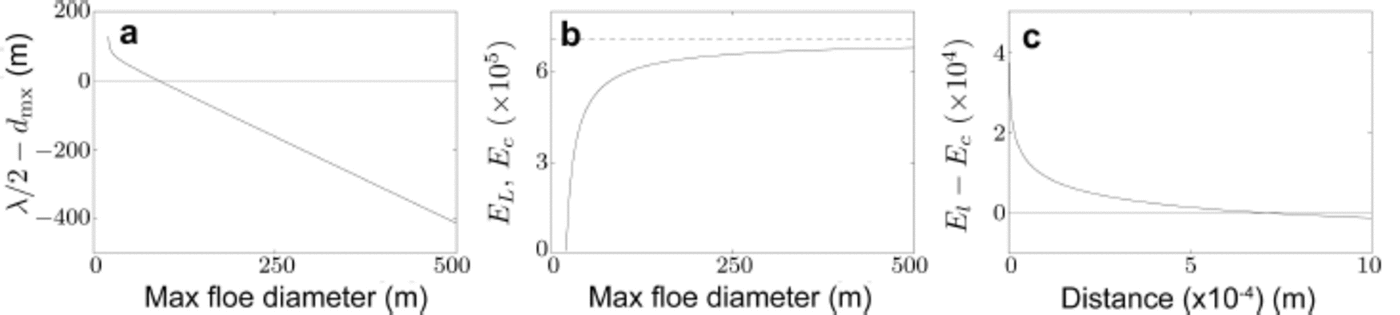
Figure 3 compares results produced by the two methods, for an example problem. Figure 3a shows fracture width, defined as the distance of the transect over which wave-induced fracture occurs, as a function of the peak period of the incident wave spectrum. Figure 3b shows maximum floe diameter in the fractured region, as a function of peak period. The length of the transect is set to be very large so that the fractured region is not truncated. The significant wave height of the incident spectrum is 1 m.
Fracture width (a) and maximum floe diameter (b), as functions of incident wave spectrum peak period. Incident wave spectrum significant wave height is 1 m. Circles and curves denote results produced by method of Reference Williams, Bennetts, Squire, Dumont and BertinoWilliams and others (2013b) and new method, respectively.
Fracture width and maximum floe diameter both increase as peak period increases. The increase in fracture width becomes less rapid as peak period increases. The relationship between maximum floe diameter and peak period is approximately linear for the interval considered.
Given the different interpretations of the floe size distribution in the two methods, the agreement in the results is reassuring. (Slight differences for the predicted fracture widths can be attributed, in part, to discontinuities resulting from discretization of the transect in the method of Reference Williams, Bennetts, Squire, Dumont and BertinoWilliams and others (2013b) - a 5 km cell length was used for the example.) The results therefore indicate the WIM is insensitive to precise knowledge of the floe size distribution.
Summary and Discussion
A new numerical implementation has been applied to a modified version of the WIM proposed by Reference Williams, Bennetts, Squire, Dumont and BertinoWilliams and others (2013b). The new method was based on the assumption that the maximum floe diameter occurs at the far end of the cell. At the far boundary the dominant wavelength is at its maximum, as the wave attenuation due to ice cover skews the wave spectrum towards long period waves.
The maximum floe diameter was used to define the floe size distribution in the cell. A wavelength/maximum-floe-size equation was posed on the far boundary and solved to obtain the wave attenuation rate and floe size distribution, simultaneously. If the wave spectrum was not sufficiently intense to fracture the ice at the far boundary, the problem was extended to search for the farthest distance into the cell at which fracture occurs.
The new method was presented for an idealized transect geometry. Example results for the width of the fractured ice region, and maximum floe diameter due to wave-induced fracture, as functions of peak wave period were given. The results were compared to results produced by the method of Reference Williams, Bennetts, Squire, Dumont and BertinoWilliams and others (2013b). The two methods gave almost identical results. Close agreement was not guaranteed, as the methods adopt different interpretations of the floe size distribution.
Integration of the WIM into OGCMs will require, in the first instance, an extension to two-dimensional (2-D) geometries. The key assumption of the new method, which is that the maximum floe diameter occurs at the far end of a cell, can be reinterpreted directly in the 2-D setting. However, the validity of the key assumption must be tested for directional wave spectra and multiple thickness categories.
Acknowledgements
The Australian Research Council (DE130101571) and Australian Antarctic Science Program (Project 4123) fund L.G.B. The Office of Naval Research (N00014-131-0279) funds V.A.S.


