


1. Introduction
The Svalbard archipelago, located in the Barents Sea, is among the world’s most climate-sensitive regions (Serreze and Barry, Reference Serreze and Barry2011; Isaksen and others, Reference Isaksen, Nordli, Førland, Łupikasza, Eastwood and Niedźwiedź2016; Nordli and others, Reference Nordli2020; Geyman and others, Reference Geyman, van Pelt, Maloof, Aas and Kohler2022). Its glaciers are particularly vulnerable to rising temperatures due to their relatively low elevation and Svalbard’s position on the outer margins of the North Atlantic warm current (Nuth and others, Reference Nuth, Moholdt, Kohler, Hagen and Kääb2010). Since the Little Ice Age (LIA) at around 1900 CE, when many of Svalbard’s glaciers reached their maximum Neoglacial positions, glacier cover across the archipelago has decreased by around 13% (Nuth and others, Reference Nuth2013; Martín-Moreno and others, Reference Martín-Moreno, Allende Alvarez and Hagen2017; Mannerfelt and others, Reference Mannerfelt, Hodson, Håkansson and Lovell2024).
Recent warming has caused Svalbard’s mean annual air temperature to rise approximately 1.7°C per decade since 1991—seven times the global average (Nordli and others, Reference Nordli2020). Svalbard’s location on the edge of the warm Atlantic Waters further adds to the archipelago’s vulnerability, bringing heat to the Arctic Ocean through the Fram Strait (Schauer and others, Reference Schauer, Fahrbach, Osterhus and Rohardt2004; Promińska and others, Reference Promińska, Cisek and Walczowski2017). These warm ocean waters carried by the West Spitsbergen Current are consequently warming the fjords, affecting sea ice coverage (Muckenhuber and others, Reference Muckenhuber, Nilsen, Korosov and Sandven2016), and have been attributed to accelerated rates of frontal ablation of Svalbard’s marine-terminating glaciers (Li and others, Reference Li2025). This rapid warming and sensitivity to the warm Atlantic waters are significantly impacting glacier mass balance and accelerating glacial thinning and retreat across the region (Schuler and others, Reference Schuler2020; Geyman and others, Reference Geyman, van Pelt, Maloof, Aas and Kohler2022). Under current climatic projections, van Pelt and others (Reference van Pelt, Schuler, Pohjola and Pettersson2021) project that the climatic mass balance (CMB), the total net change in glacier mass, for all Svalbard glaciers will become negative by 2060. A negative CMB causes equilibrium line altitudes to rise above the highest elevations of a glacier, resulting in enhanced mass loss and glacier recession.
For many land-terminating glaciers, thinning leads to fragmentation into smaller isolated units (e.g. Jiskoot and Mueller, Reference Jiskoot and Mueller2012), as has already been documented across Svalbard (Małecki, Reference Małecki2016; Mannerfelt and others, Reference Mannerfelt, Hodson, Håkansson and Lovell2024; McCerery and others, Reference McCerery2025), the European Alps (Paul and others, Reference Paul, Kääb, Maisch, Kellenberger and Haeberli2004; Cossart and Fort, Reference Cossart and Fort2008), the Juneau Icefield, Alaska (Davies and others, Reference Davies2022, Reference Davies2024), the Clemenceau Icefield, Canada (Jiskoot and others, Reference Jiskoot, Curran, Tessler and Shenton2009; Rippin and others, Reference Rippin, Sharp, Van Wychen and Zubot2020), Greenland (Carrivick and others, Reference Carrivick2019, Reference Carrivick2023; Grimes and others, Reference Grimes, Carrivick and Smith2024), the Southern Alps of New Zealand (Carrivick and others, Reference Carrivick2020), across the Andes (Carrivick and others, Reference Carrivick2024) and in the Himalaya (Lee and others, Reference Lee, Carrivick, Quincey, Cook, James and Brown2021; Rowan and others, Reference Rowan2021). Several of these studies have demonstrated that ice masses that become detached from parent accumulation areas decay at an accelerated rate compared with neighbouring glaciers that remain connected (Jiskoot and others, Reference Jiskoot, Curran, Tessler and Shenton2009; Paul and others, Reference Paul2004; Jiskoot and Mueller, Reference Jiskoot and Mueller2012). This highlights the importance of this stage in the glacier lifecycle in the context of glacier preservation in a warming climate and, in particular, the documentation of “vanishing” glaciers as well as the Global Glacier Casualty List (Boyer and Howe, Reference Boyer and Howe2024).
Svalbard’s rapidly retreating glaciers and their particular sensitivity to climate change make them an ideal natural laboratory for understanding the state and fate of glaciers under accelerated warming. Small glaciers like those presented here are common in Svalbard and may be most vulnerable to climate change. The two glaciers studied here, Ferdinandbreen and Elsabreen, were 1.32 and 0.16 km2 in size in 2009, respectively. According to the Randolph Glacier Inventory 7.0 Consortium 2023 (RGI 7.0 consortium, 2023) (see GLIMS: Global Land Ice Measurements from Space), there were 755 glaciers of a similar size or smaller than Ferdinandbreen and 118 glaciers of a similar size or smaller than Elsabreen in the year 2000. Here, we document the recession and thinning of these two vanishing glaciers, Elsabreen and Ferdinandbreen since the LIA. We use aerial photographs and satellite imagery to map historical glacier extents and multitemporal digital elevation models (DEMs) to reconstruct glacier volume changes over time. These are just two examples of rapidly retreating and thinning small glaciers on Svalbard.
2. Study sites
Elsabreen (78°40′ N, 16°22′ E) and Ferdinandbreen (78°42′ N, 16°18′ E) are neighbouring land-terminating glaciers located in Petuniabukta at the northern end of Billefjorden, Spitsbergen (Fig. 1). Both glaciers were historically polythermal valley glaciers, but now only small ice remnants or fragments remain (Rachlewicz and others, Reference Rachlewicz, Szczuciński and Ewertowski2007; Kavan and Haagmans, Reference Kavan and Haagmans2021). More recent ice depth investigations using ground penetrating radar (GPR) and analyses of ice surface characteristics indicate both Elsabreen and Ferdinandbreen are now too thin to sustain polythermal conditions and have transitioned into a cold-based thermal regime (Małecki, Reference Małecki2013; Mallinson, Reference Mallinson, Swift and Sole2019; Procházková and others, Reference Procházková, Engel and Tomíček2019; Kavan and Haagmans, Reference Kavan and Haagmans2021). Kavan and Haagmans (Reference Kavan and Haagmans2021) suggest there are three key factors driving recently observed thinning patterns: (i) continued increasing air temperatures, (ii) low precipitation and (iii) topographic risk factors affecting shading and solar radiation exposure.
(a) Elsabreen and Ferdinandbreen areal extents from LIA to 2024. (b) Location of Elsabreen, Ferdinandbreen and neighbouring Bertilbreen in Petuniabukta. The LIA and 2024 extents of Elsabreen and Ferdinandbreen are shown. (c) Study area location (Orange box) within Spitsbergen, Svalbard. Background satellite imagery sourced from ESRI basemap imagery (2021). (d) 1938 oblique aerial photograph of Elsabreen and Ferdinandbreen sourced from the Norwegian Polar Institute TopoSvalbard archive (photograph ID: S38_2784).
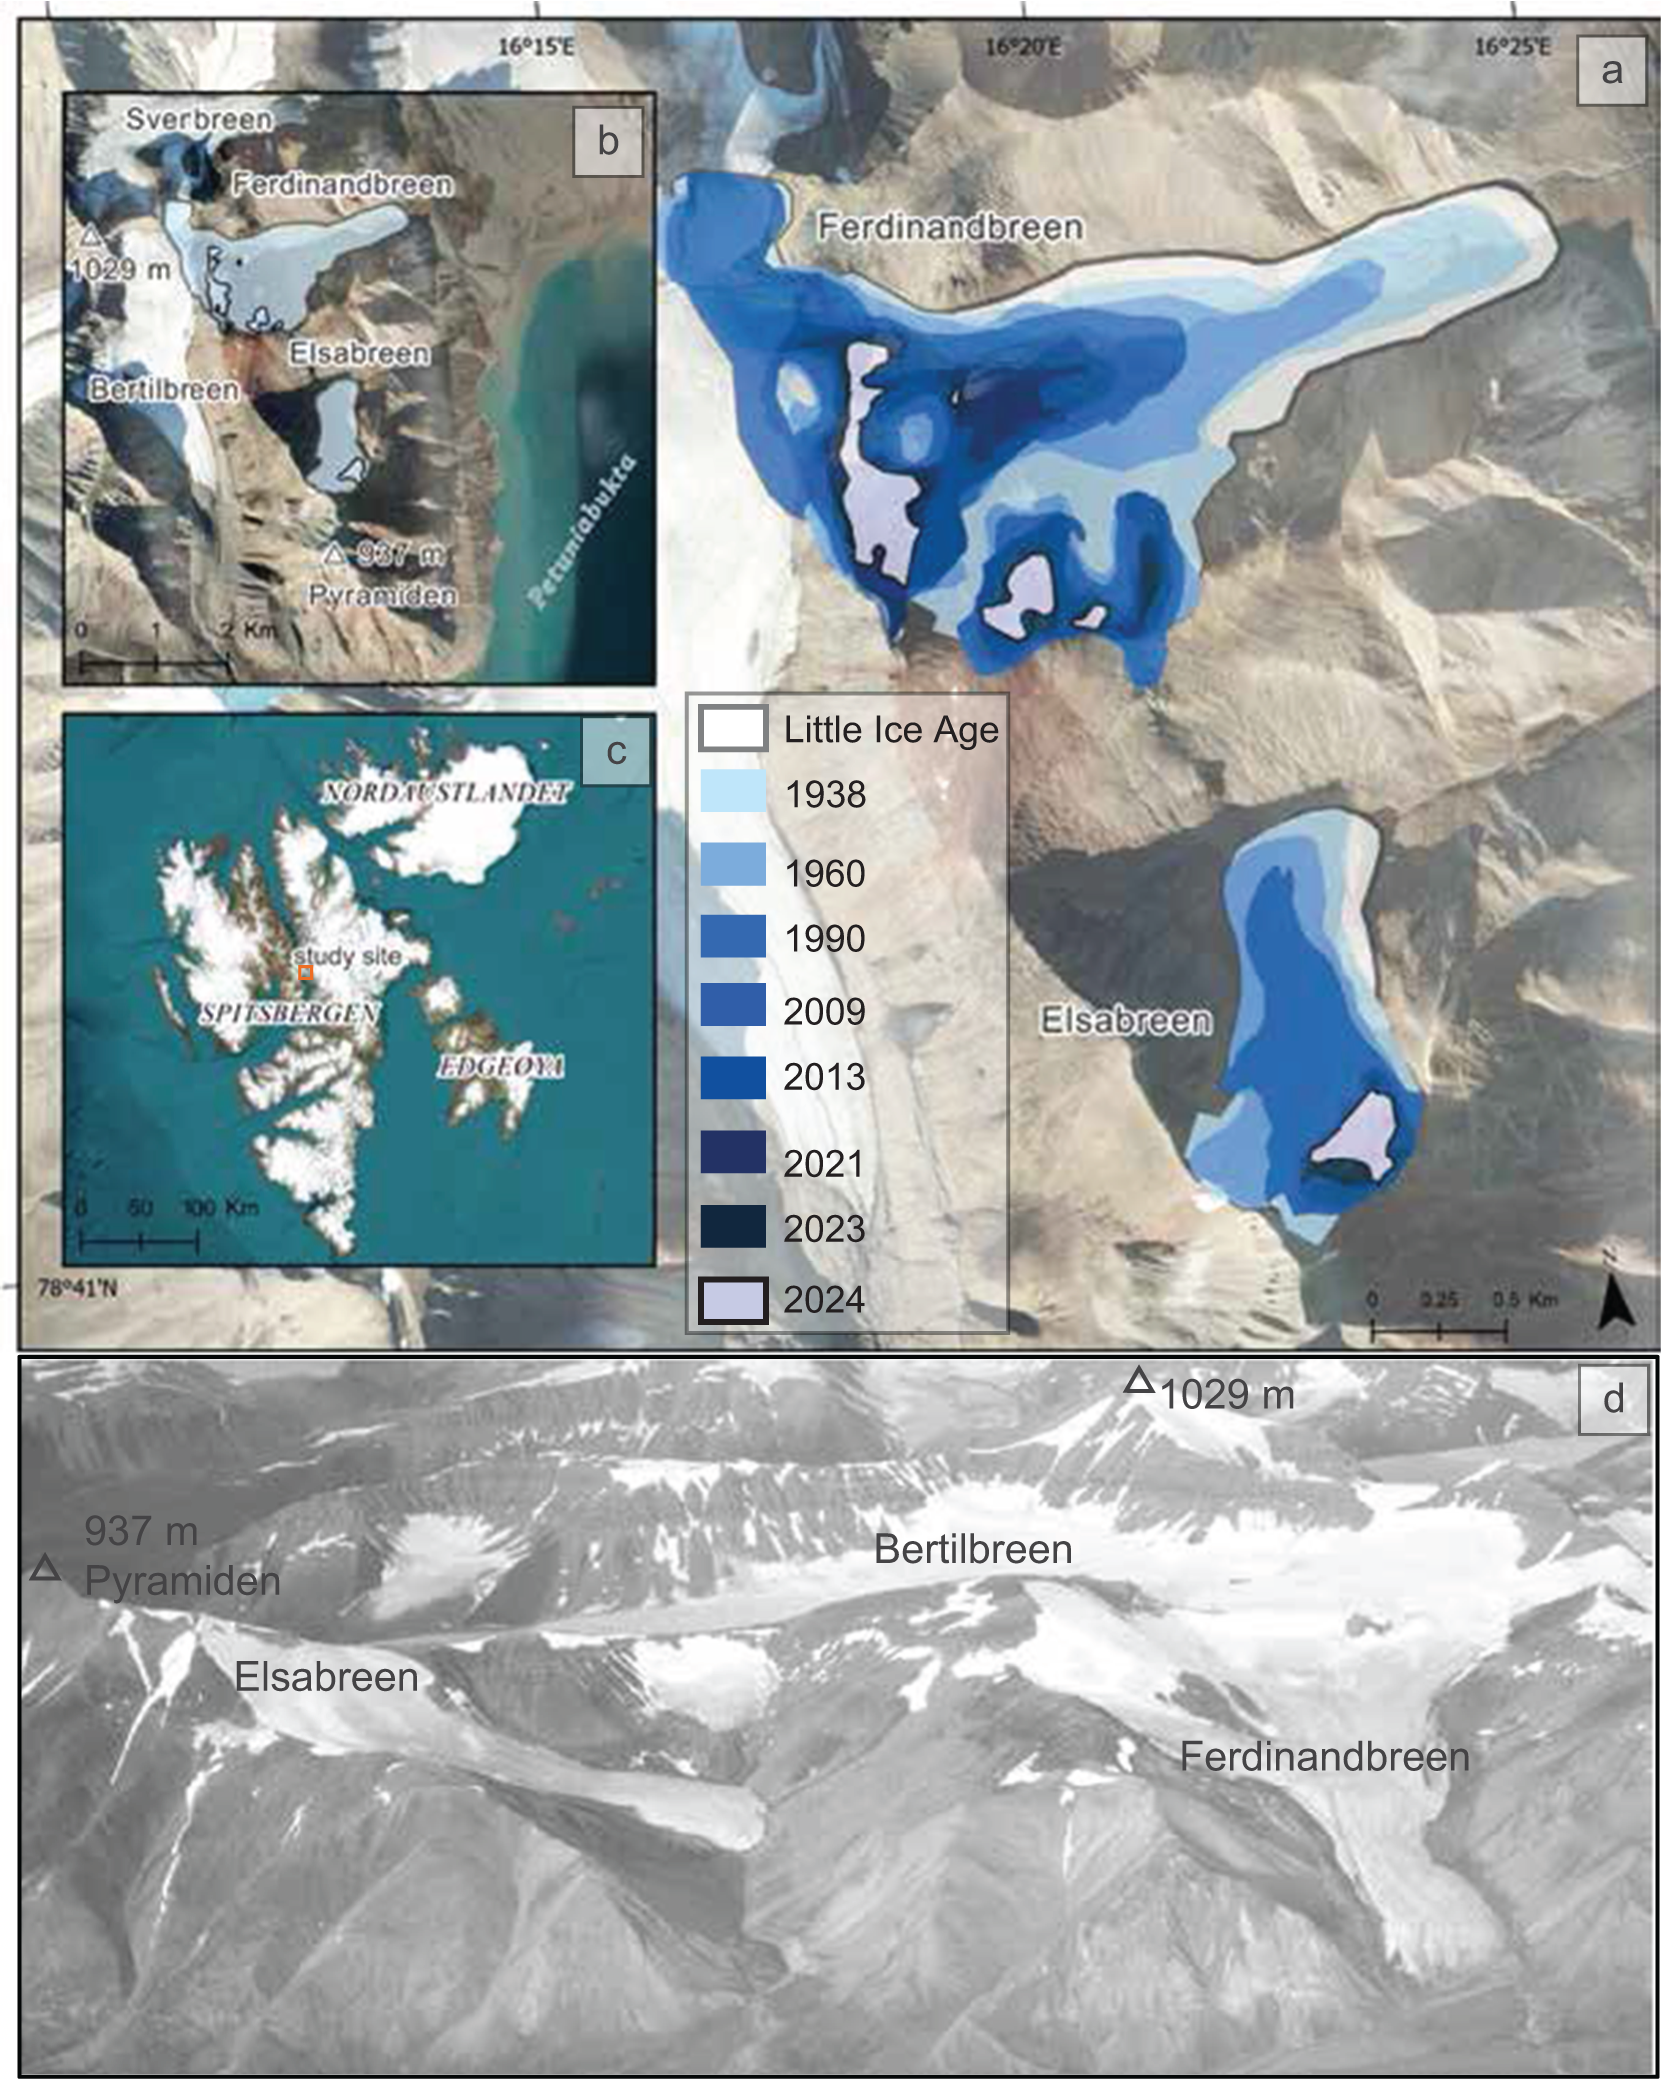
Ferdinandbreen is the northernmost of the two glaciers and is located on an east facing slope. The surrounding landscape is composed of ice-cored moraine, thin debris stripes and till cover (Evans and others, Reference Evans, Strzelecki, Milledge and Orton2012; McCerery and others, Reference McCerery2024, Reference McCerery2025). Ferdinandbreen’s historical polythermal conditions are evidenced by relict meltwater channels and abandoned glaciofluvial outwash plains that extend down valley to the LIA moraine sequence (McCerery and others, Reference McCerery2024, Reference McCerery2025). Since the LIA, Ferdinandbreen has lost over 90% of its clean ice area and ice volume (Table 1) (Rachlewicz and others, Reference Rachlewicz, Szczuciński and Ewertowski2007; Procházková and others, Reference Procházková, Engel and Tomíček2019; Kavan, Reference Kavan2020). Its LIA position is delimited by a prominent latero-frontal moraine system, and the ice front was likely ∼50 m thick at this time (Kavan, Reference Kavan2020). Ferdinandbreen had a maximum ice thickness of 42.1 m in 2014 based on GPR surveys and is currently believed to be cold-based (Procházková and others, Reference Procházková, Engel and Tomíček2019) but likely had areas of temperate ice when it was thicker and more extensive during the LIA.
Summary of ice loss for Ferdinandbreen and Elsabreen from previous works.
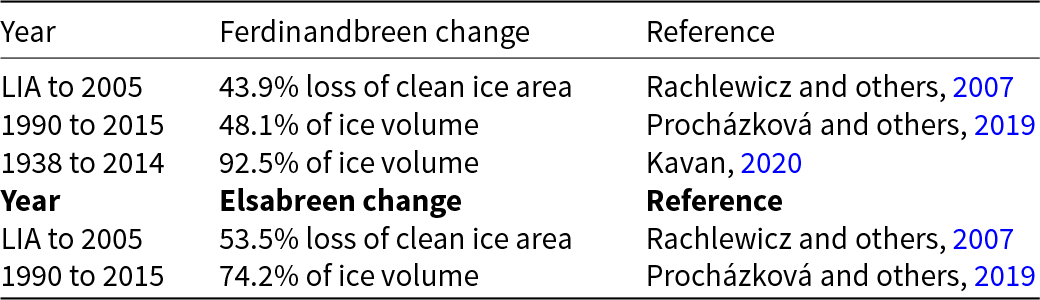
Elsabreen is located in the adjacent valley, approximately 2 km south of Ferdinandbreen, within the cirque on the northern side of Pyramiden (937 m elevation) on a north-facing slope. Elsabreen also hosts evidence of previous polythermal conditions, with relict meltwater channels extending down valley but with no indications of a current subglacial hydrological system, i.e., active meltwater channels or presence of subglacial bedforms. Elsabreen is also estimated to have lost substantial amounts of its clean ice area and ice volume since the LIA (Table 1) (Rachlewicz and others, Reference Rachlewicz, Szczuciński and Ewertowski2007; Procházková and others, Reference Procházková, Engel and Tomíček2019). The glacier had a maximum ice thickness of ∼50 m in 2015 based on GPR surveys and is likely to be entirely cold-based today (Procházková and others, Reference Procházková, Engel and Tomíček2019).
3. Data and methods
Glacier areal extents since the LIA were mapped digitally in ArcGIS Pro (version 3.3.0) from previously published glacier outlines, aerial photographs and satellite images. The LIA extent was based on the prominent LIA latero-frontal moraine limits, as identified on the Norwegian Polar Institute (NPI) 2009 aerial photographs. The 1938 glacier extents are from Geyman and others (Reference Geyman, van Pelt, Maloof, Aas and Kohler2022), based on NPI oblique aerial photographs. Glacier outlines in 1960–1990 were taken from Małecki (Reference Małecki2013), who mapped them from an NPI topographic map and aerial photographs, respectively. The 2009 extents were mapped from NPI aerial photographs accessed from TopoSvalbard (https://toposvalbard.npolar.no/). Satellite imagery was used to map glacier outlines in 2013 (Landsat 7 ETM + image, captured 13 July 2013), 2021 (ArcGIS Pro Basemap imagery), 2023 and 2024 (Sentinel-2 imagery captured 2 August 2023 and 9 August 2024, respectively). Glacier areal extent uncertainty was calculated following the approach of Małecki (Reference Małecki2016) and Geyman and others (Reference Geyman, van Pelt, Maloof, Aas and Kohler2022): buffers corresponding to the reported spatial resolution (pixel size) of the source data were applied to each mapped outline. The following buffers were used: LIA = ±50 m, 1938 = ±5 m, 1960 = ±25 m, 1990 = ±10 m, 2009 = ±2 m, 2013 = ±30 m, 2021 = ±5 m, and 2023 and 2024 = ±10 m. The difference between the areas of the originally mapped glacier outline and the buffered glacier outline was then calculated, and this value was reported as the uncertainty. To estimate glacier volume change, we examined DEMs generated from optical stereo images acquired during regional aerial photography surveys and by contemporary satellites. The earliest DEM in our time series is that generated by Geyman and others (Reference Geyman, van Pelt, Maloof, Aas and Kohler2022), who reconstructed surface elevations across Svalbard from oblique image surveys conducted in 1936 and 1938, the latter of which covers the area around Ferdinandbreen and Elsabreen. We also use DEMs generated from vertical aerial photographs acquired in 1990 and 2009 by the NPI, and we incorporate two ArcticDEM strips (Porter and others, Reference Porter2022) generated from images acquired on 6 May 2013 and 19 May 2023 by the Worldview 2/3 satellites.
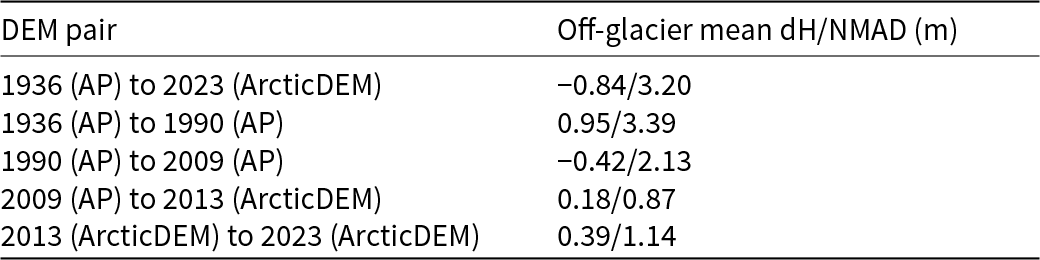
To generate robust estimates of glacier surface elevation and therefore glacier volume change, sequential DEMs must have consistent geolocation and be devoid of spatial biases, which can impact derived elevation change rates if left untreated. To coregister the DEMs from different timesteps, we first resample all to a common resolution (20 m, matching the lowest resolution 1990 DEM) using a bilinear interpolation approach. We follow established DEM coregistration methods (Nuth and Kääb, Reference Nuth and Kääb2011) implemented in xDEM (xDEM contributors, 2025, https://zenodo.org/records/11492983) to remove horizontal shifts in x, y and z directions. Mean values of stable ground (off-glacier) elevation change differences are shown in Table 2, which should be negligible when DEM coregistration has been successful.
Mean and normalised median absolute deviation (NMAD) of stable ground (off-glacier) covered by each of the different elevation change datasets derived from sequential DEMs. AP refers to DEMs generated from aerial photography.
To derive volume change over different time periods between DEM dates, we multiply the mean value of elevation change (dH) by the area of each glacier at the initial date of each timestep. To estimate the portion of each glacier’s total volume lost through time, we treat the 2023 DEM as representative of ice-free conditions, given the small remaining volume of each glacier at this point in time (Fig. 1). We therefore treat the ice volume lost from 1938 to 2023 as 100% of each glacier’s total volume over our study period, with ice lost over intermediate timesteps subtracted from this total volume to derive the relative contribution of each sub-period to total volume change.
We follow the methods of Hugonnet and others (Reference Hugonnet2022) to estimate the uncertainty associated with elevation change data we derived across different time periods. This method, also implemented in xDEM, examines and models how the vertical precision of DEMs varies spatially considering different terrain metrics (slope, curvature) and how DEM errors correlate over different domains. Estimated elevation change rate uncertainties range between ± 0.04 and 0.32 m a−1 and are generally much lower than the magnitude of elevation changes measured over Ferdinandbreen and Elsabreen. Volume change uncertainty is calculated as the elevation change uncertainty multiplied by glacier area at the beginning of each timestep. To estimate the uncertainty associated with our calculated total glacier volumes at each timestep, we propagate our elevation change uncertainty with an estimate of glacier area uncertainty (5% of glacier area at each timestep), assuming the two are independent.
4. Results
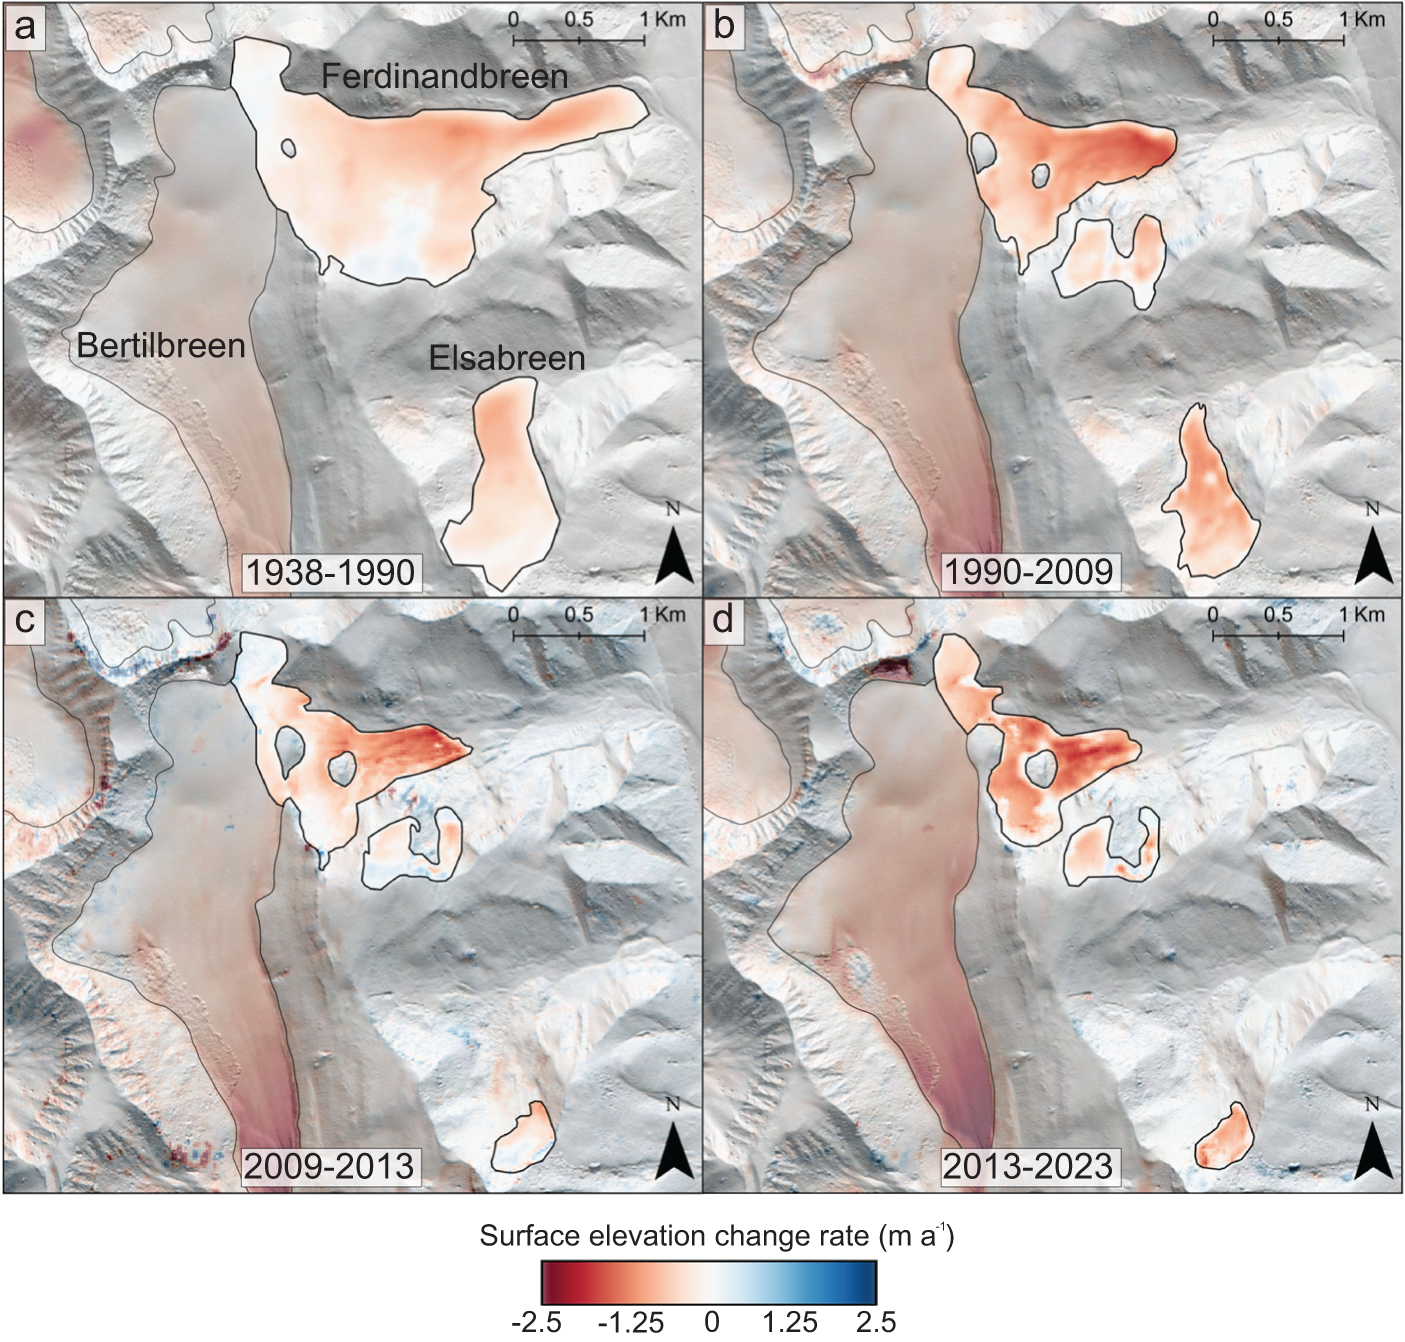
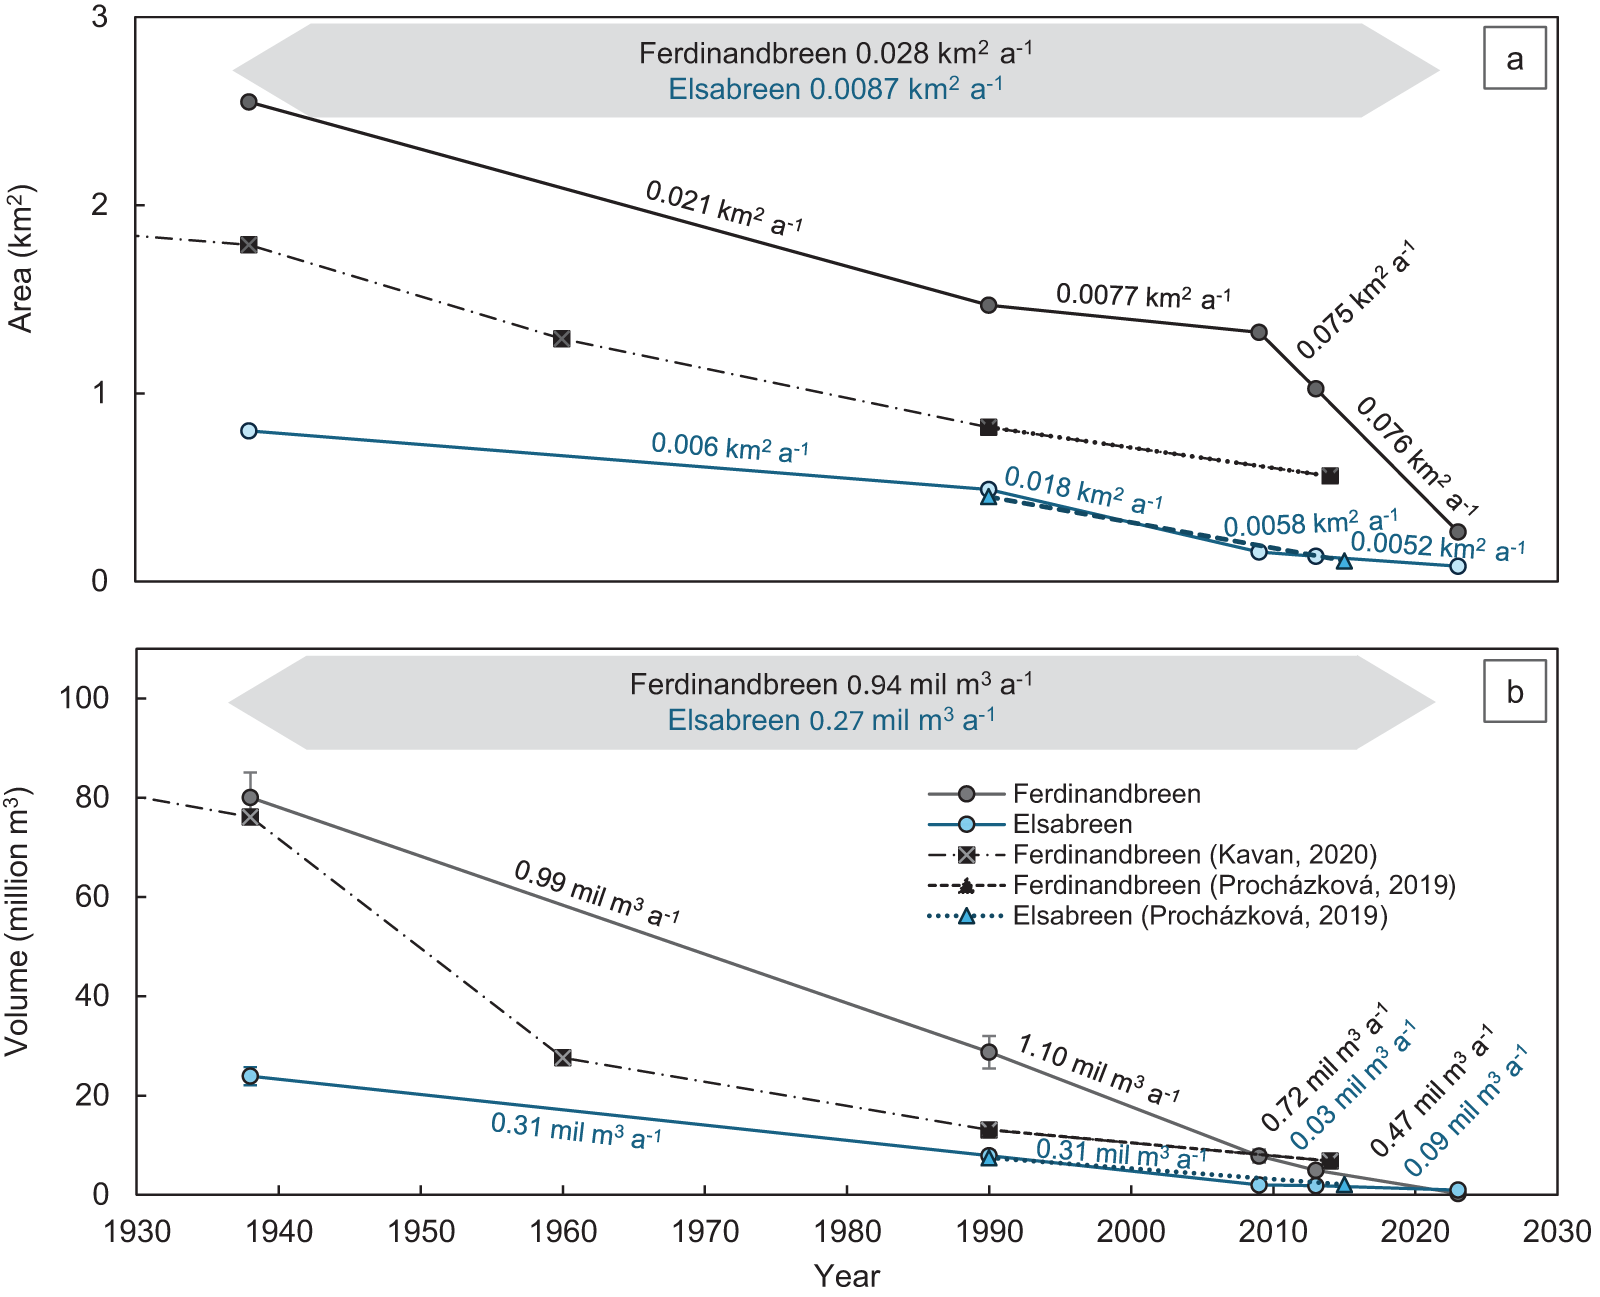
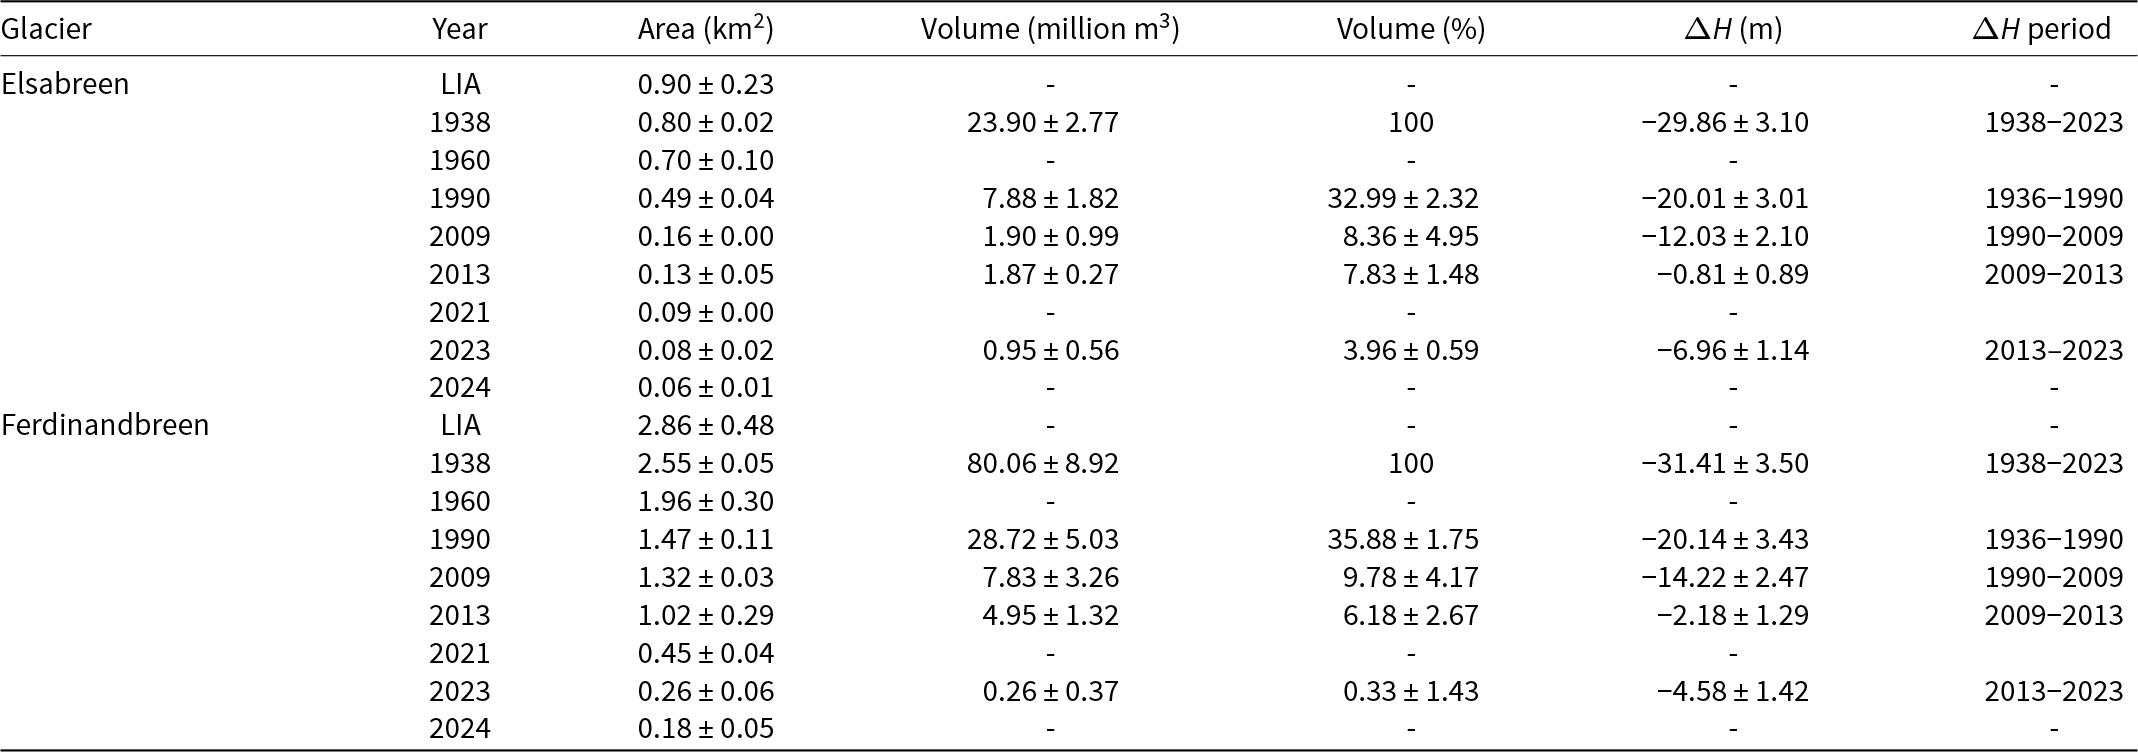
Since the LIA, Elsabreen and Ferdinandbreen have undergone extensive and continuous recession and thinning (Figs. 1 and 2). Based on moraine positions, Elsabreen and Ferdinandbreen had areal extents of 0.9 and 2.9 km2 at the LIA, respectively. By 1990, both glaciers had lost almost half of their LIA surface area and approximately two-thirds of their ice volume compared to their 1938 thicknesses (Table 3). In total, Elsabreen has lost 93.3% of its area (LIA to 2024) and 96.0% of its ice volume (1938–2023). Ferdinandbreen has lost 93.7% of its area (LIA to 2024) and 99.7% of its volume (1938–2023). Between 1938 and 2023, Elsabreen underwent a mean surface elevation lowering of 29.9 ± 3.1 m, and Ferdinandbreen experienced a mean surface elevation lowering of 31.4 ± 3.5 m (Table 3). The highest rate of volume change for both glaciers occurred from 1990 to 2009 (Ferdinandbreen: 1 million m3 a−1; Elsabreen: 0.3 million m3 a−1), closely followed by similar volume change rates between 1938 and 1990. Since 2009, Ferdinandbreen’s rate of volume change has halved, and Elsabreen’s has reduced by two-thirds. Ferdinandbreen’s surface lowering rate was highest in 1990–2009 (−0.8 ± 0.1 m a−1) and has remained higher between 2009 and 2013 (−0.6 ± 0.3 m a−1) and 2013 and 2023 (−0.5 ± 0.1 m a−1) than the period from 1938 to 1990 (−0.4 ± 0.06 m a−1) (Fig. 3a). Elsabreen has experienced the highest rates of surface lowering between 2013 and 2023 (−0.7 ± 0.1 m a−1), broadly comparable to that experienced between 1990 and 2009 (−0.6 ± 0.1 m a−1) and approximately double the surface lowering rates between 1938 and 1990 (−0.3 ± 0.06 m a−1) and 2009 and 2013 (−0.2 ± 0.2 m a−1) (Fig. 3a).
Elevation change rates (m a−1) over Ferdinandbreen and Elsabreen between (a) 1938 and 1990, (b) 1990 and 2009, (c) 2009 and 2013 and (d) 2013 and 2023 with glacier outlines from 1990, 2009, 2013 and 2023, respectively.

(a) Area change rates (km2 a−1) and (b) volume change rates (million m3 a−1) of Elsabreen and Ferdinandbreen between 1938 and 2023 with comparison to Procházková and others (Reference Procházková, Engel and Tomíček2019) and Kavan (Reference Kavan2020).

Elsabreen and Ferdinandbreen area and volume changes from LIA to 2024.

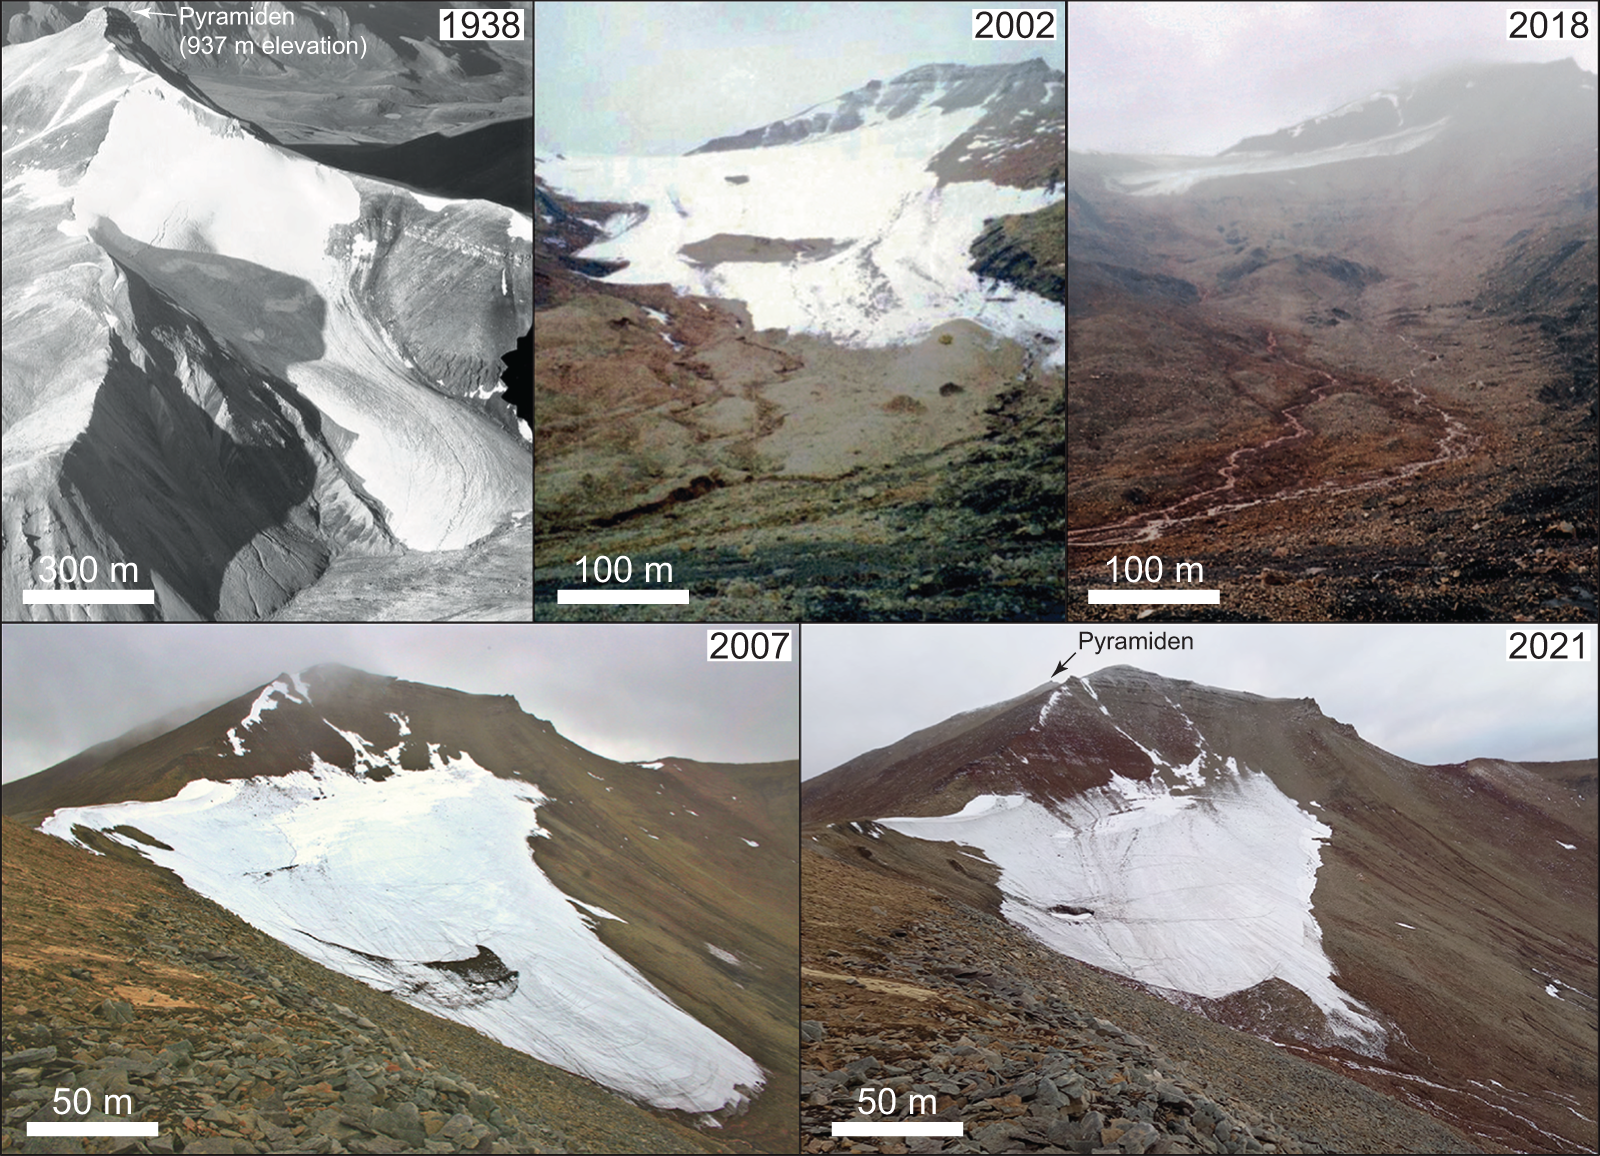
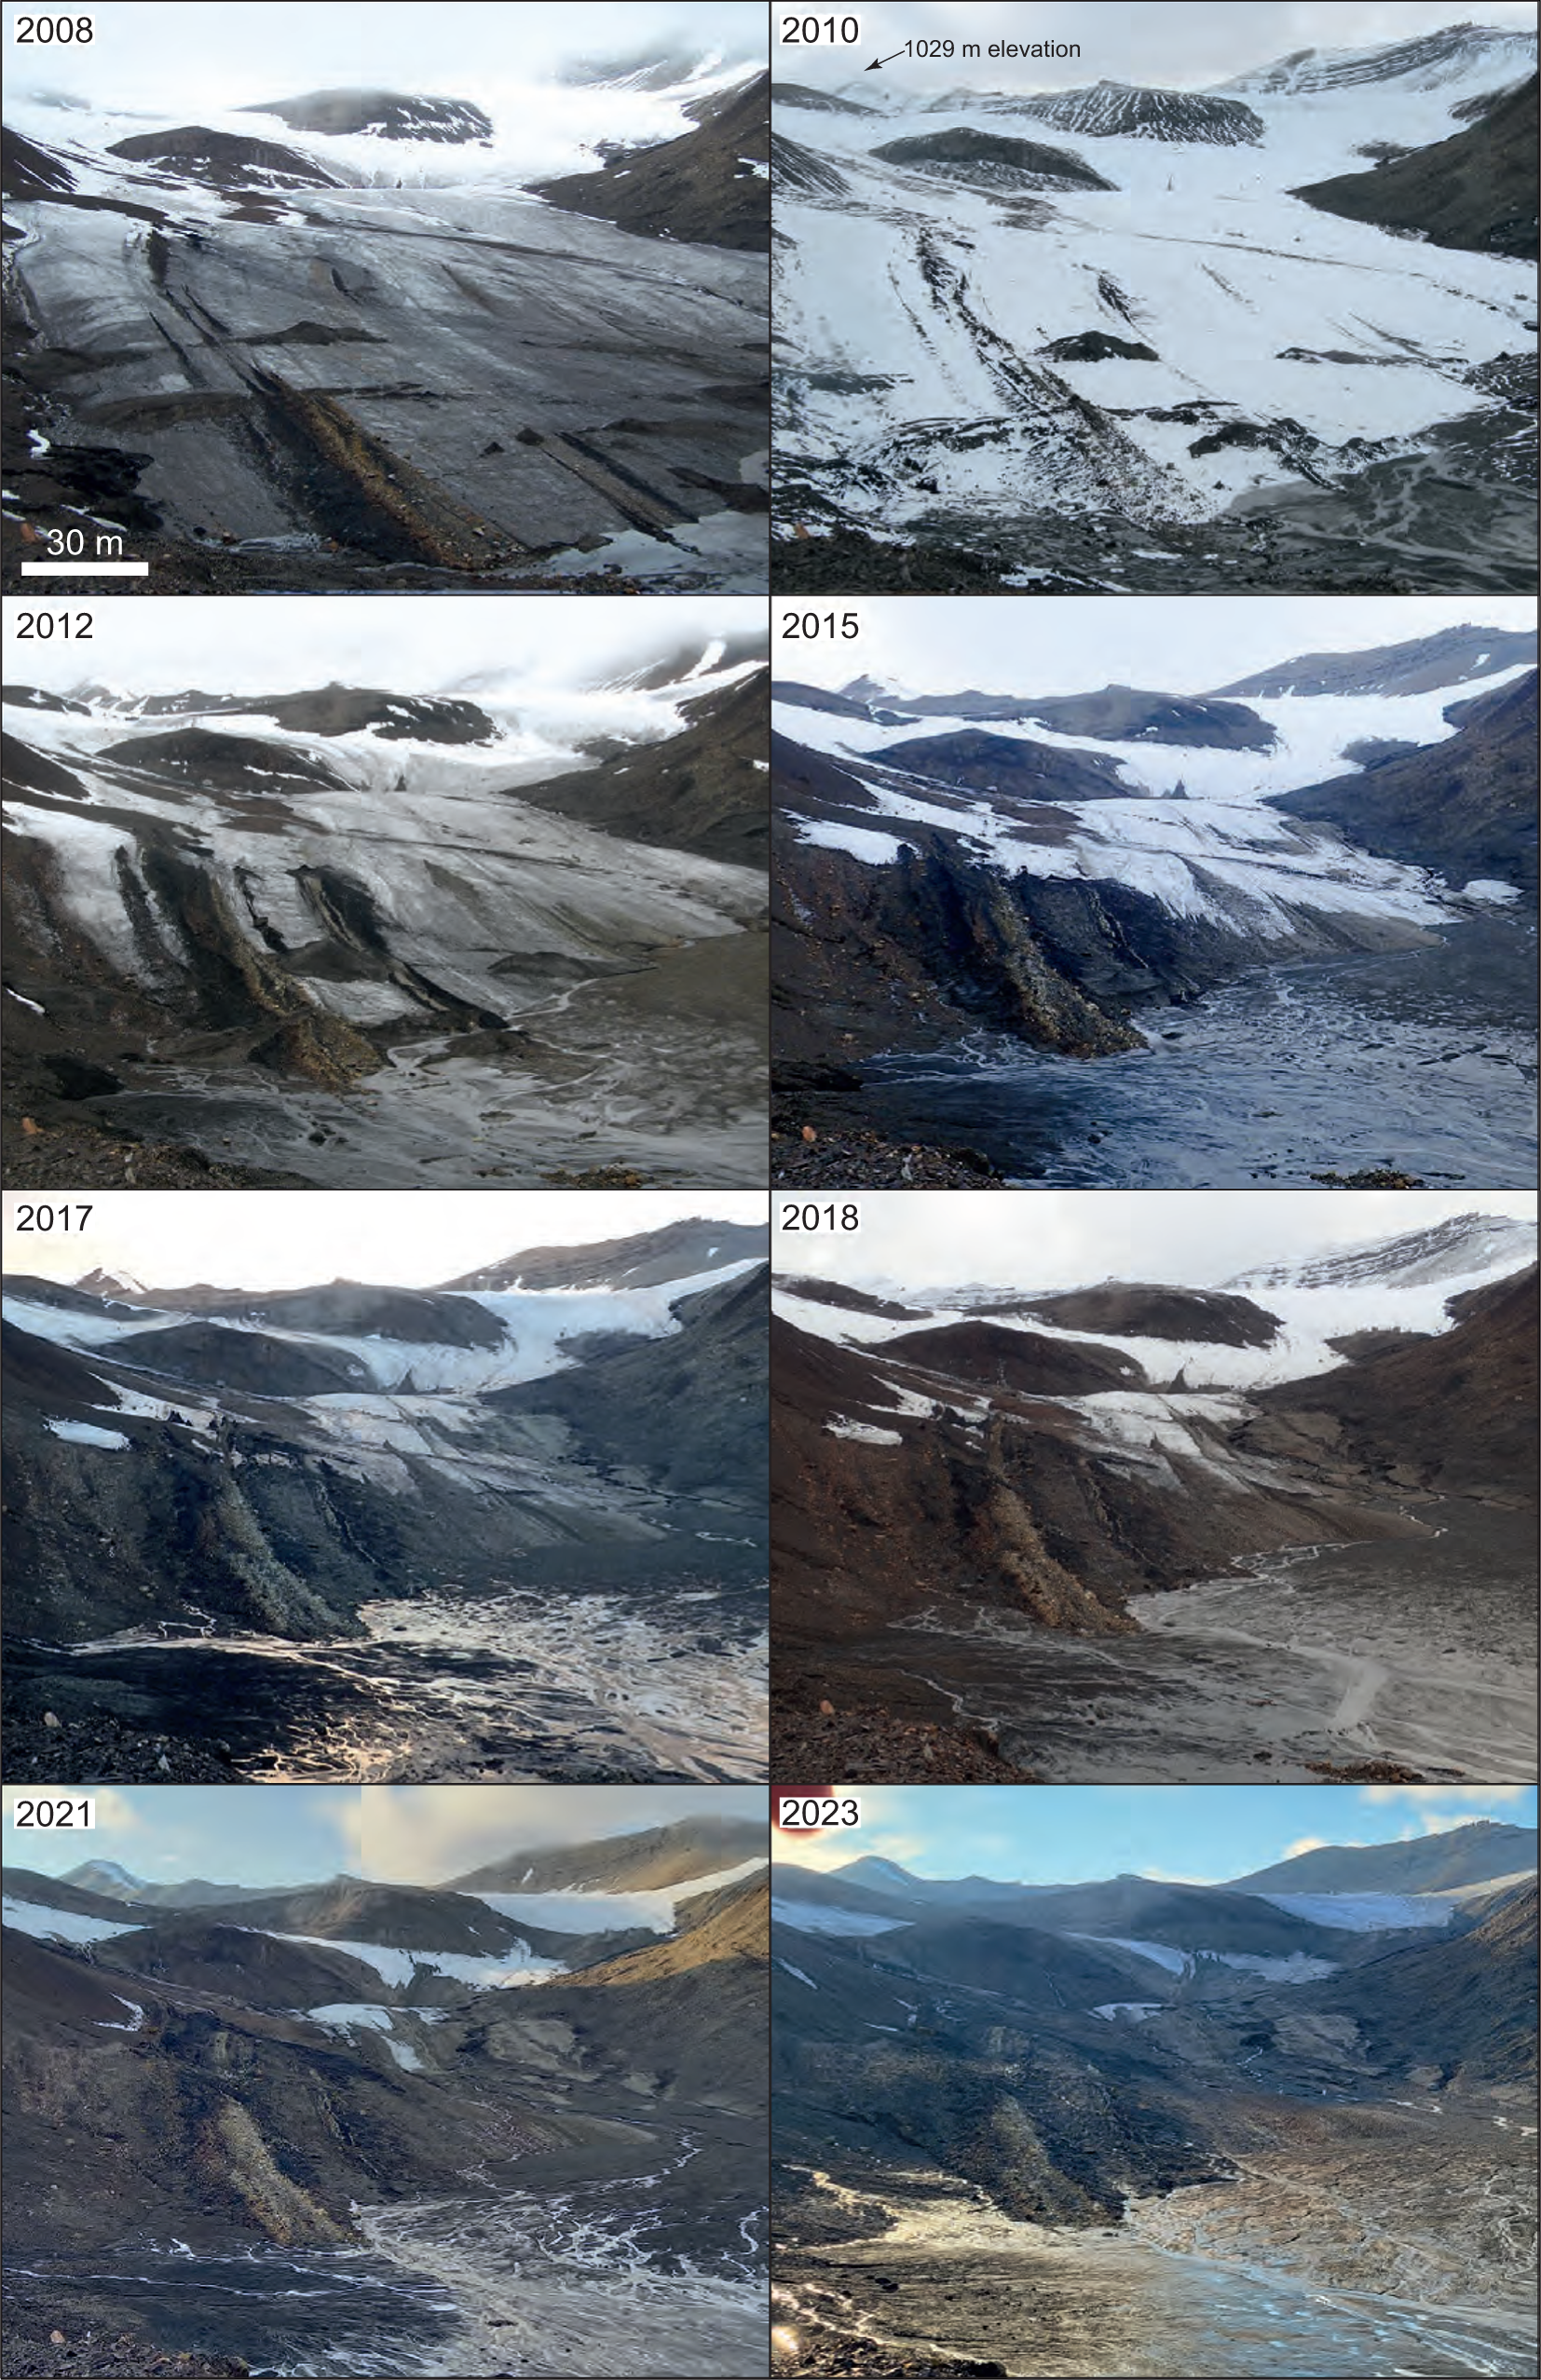
Throughout post-LIA recession and thinning, Elsabreen has largely remained as a single consistent ice mass, albeit by 2024 heavily restricted to a small ice remnant in the higher elevations on the eastern side of the cirque (Figs. 1 and 4). The glacier had a mean ice thickness of 21.2 ± 0.8 m in 2015 (Procházková and others, Reference Procházková, Engel and Tomíček2019) and has since lost over half of its ice volume (2013–2023), suggesting the remaining ice is likely very thin. Ferdinandbreen also initially receded as a single ice mass, but by 1990, two bedrock bumps had begun to emerge from the thinning ice (Fig. 1). The continued emergence of the bedrock bumps from 2008 is shown in Fig. 5, demonstrating the rapid fragmentation of the main glacier tongue. The higher of the bedrock bumps separates Ferdinandbreen from neighbouring Bertilbreen. These two glaciers were contiguous throughout much of the period of study. However, by 2017/18, Ferdinandbreen had become almost entirely disconnected from Bertilbreen, consistent with the negligible ice thickness in this area and the overall mean ice thickness of 13.3 ± 0.8 m recorded by Procházková and others (Reference Procházková, Engel and Tomíček2019) in 2014. The ice divide between Bertilbreen and Ferdinandbreen (Procházková and others, Reference Procházková, Engel and Tomíček2019) likely shifted eastwards and to lower elevations as the upper part of Ferdinandbreen thinned, until the point of complete disconnection from Bertilbreen sometime before 2021 (Fig. 5). By 2024, only a series of small, isolated and very thin, clean ice patches remained in Ferdinandbreen’s ablation area (Figs. 1 and 5).
Elsabreen frontal recession and thinning from 1938 to 2021. The upper row shows a front-on view of the glacier in 1938 (image source from the Norwegian Polar Institute TopoSvalbard archive, photograph ID: S38_2705), 2002 (photograph taken by Witold Szczuciński) and 2018 (photograph taken by Jakub Małecki). The bottom row shows a side-on view of the glacier in 2007 and 2021 (both photographs taken by Jakub Małecki).

Ferdinandbreen frontal recession and thinning from 2008 to 2023 (all photographs taken by Jakub Małecki).

5. Discussion
Elsabreen and Ferdinandbreen have lost almost all (96–99.7%) of their LIA ice volume in a little over a century and, as of 2024, are very small, thin and likely entirely cold-based ice masses with little discernible ice flow (Rachlewicz and others, Reference Rachlewicz, Szczuciński and Ewertowski2007; McCerery and others, Reference McCerery2025). Our ice volume change calculations are in general agreement with those presented by Procházková and others (Reference Procházková, Engel and Tomíček2019) and Kavan (Reference Kavan2020), who used GPR surveys and photogrammetry, respectively, to reconstruct geometric changes of the glaciers for parts of our study duration. Ferdinandbreen was calculated to have lost 92.6% of ice volume from 1908 to 2014 by Kavan (Reference Kavan2020), compared to 99.7% from 1938 to 2023 in this study (Table 2). We demonstrate that Ferdinandbreen lost ice volume at the fastest rate between 1990 and 2009 (1.1 million m3 a−1) (Fig. 3b), whereas Kavan (Reference Kavan2020) identified the highest rate of volume change between 1938 and 1960 (2.2 million m3 a−1). A step change in summer air temperatures and a decrease in winter snow accumulation from 1990 have been suggested to be responsible for enhanced thinning and recession after this time (James and others, Reference James2012; Małecki, Reference Małecki2013, Reference Małecki2016), consistent with our observations from Elsabreen and Ferdinandbreen.
Procházková and others (Reference Procházková, Engel and Tomíček2019) reconstructed volume changes of Elsabreen (1990–2015) and Ferdinandbreen (1990–2014) and concluded the glaciers lost 74.2% (Elsabreen) and 48.1% (Ferdinandbreen) of their ice volume over this period. The calculated loss for Elsabreen compares well to our ice volume loss calculations of 76.3% over a comparable time period between 1990 and 2013. We suggest the variations in volume changes for Ferdinandbreen from 1990 to 2013/2014, for which we calculate over twice as much volume loss (and 82.8%) compared to Procházková and others (Reference Procházková, Engel and Tomíček2019), partly reflecting differences in the mapped extents of the glacier in 1990 between the studies. In particular, we include the upper basin between Bertilbreen and Svenbreen in Ferdinandbreen’s glacier outline up to 2013, after which this area becomes disconnected from Ferdinandbreen. We also include Ferdinandbreen’s southern accumulation basin in our calculations throughout, which became detached from the main tongue by 1960 but still constitutes remnants of glacier ice within the Ferdinandbreen catchment (Fig. 1).
This central region of Spitsbergen is not only sensitive to the air and fjord temperature increases but also experiences relatively low amounts of yearly precipitation (previously described as a continental climate), which affects glacier mass balance and limits the amount of snow accumulation during the accumulation season (Przybylak and others, Reference Przybylak2014; Gjelten and others, Reference Gjeltenf2016; Kavan and Haagmans, Reference Kavan and Haagmans2021). Kavan and Haagmans’s (Reference Kavan and Haagmans2021) assessment of snow ablation on Elsabreen, Ferdinandbreen and neighbouring glaciers showed that only a small fraction of this already limited amount of snow that is deposited over winter persists into the summer ablation season. This results in large portions of the glacier surface experiencing snow-free cover, driving the glaciers into negative mass balance.
The demise of Elsabreen and Ferdinandbreen can be compared to other similar small land-terminating glaciers in Svalbard. In Nordenskiöld Land, central Spitsbergen, Mannerfelt and others (Reference Mannerfelt, Hodson, Håkansson and Lovell2024) showed five glaciers, which in 1936 were slightly larger (2.7–4.7 km2) than Ferdinandbreen in 1938 (2.5 km2), lost on average 77.4 ± 7.7% of their ice volume between 1936 and 2019. One of which (Scott Turnerbreen) lost a comparable 91 ± 5% over this period. Also in Nordenskiöld Land, Aldegondabreen (9.5 km2 in 1936) lost 73.1% of its ice volume between 1936 and 2016 (Holmlund, Reference Holmlund2021). This magnitude of thinning is also especially striking when compared with the Geyman and others (Reference Geyman, van Pelt, Maloof, Aas and Kohler2022) Svalbard-wide assessment of −14.8% glacier volume change from 1936/1938 to 2010. This dataset includes all glaciers (n = 1594), most of which are substantially larger than Elsabreen and Ferdinandbreen, thus highlighting the vulnerability to complete mass loss of these much smaller Svalbard glaciers.
Our data demonstrate that Ferdinandbreen has experienced more substantial ice volume loss in percentage terms since 2013 than Elsabreen (Table 2). This difference can be explained by the topographic context of both glaciers. Ferdinandbreen is underlain by at least two large bedrock bumps that have been emerging as the ice thinned since at least 1990. The upper bump is a ridge that now separates Ferdinandbreen from Bertilbreen (Fig. 4). As Ferdinandbreen has thinned, the main tongue has fragmented and a large bedrock outcrop now separates the two main units of the original glacier tongue. Once fragmentation was underway, the glacier receded at a faster rate due to positive feedback mechanisms. First, newly exposed bedrock surfaces drive enhanced radiative forcing to the surrounding thin ice (e.g. Wendler, Reference Wendler1975; Olyphant, Reference Olyphant1986; Gratton and others, Reference Gratton, Howarth and Marceau1993; Hannah and others, Reference Hannah, Gurnell and Mcgregor2000; Jiskoot and Mueller, Reference Jiskoot and Mueller2012). Secondly, the fragmentation into smaller, thinner ice units and the complete disconnection from higher elevation accumulation areas lead to a reduction in ice flow (cf. Paul and others, Reference Paul, Kääb, Maisch, Kellenberger and Haeberli2004; Kargel and others, Reference Kargel2005; Jiskoot and Mueller, Reference Jiskoot and Mueller2012; Rippin and others, Reference Rippin, Sharp, Van Wychen and Zubot2020). These melt-accelerating feedbacks of fragmented ice represent a point of accelerating and irreversible glacier loss at Ferdinandbreen (e.g. Davies and others, Reference Davies2024). By contrast, Elsabreen, whilst also in terminal decline, has maintained a single coherent ice mass and has been able to partially stabilise at a higher elevation within the more shaded eastern part of its cirque (Fig. 1). An additional factor is that by 2013, Elsabreen had already likely become too small to sustain the same pace of thinning rates (e.g. Małecki, Reference Małecki2013).
Our assessment of the future prognosis for Elsabreen and Ferdinandbreen is that their complete demise is likely imminent. By 2023, Ferdinandbreen had lost 99.7% of its 1938 ice volume, completely disconnected from the Bertilbreen source area and fragmented into four small separate ice units (Figs. 1, 2 and 4; Table 2). The recent pace of Ferdinandbreen’s disintegration is particularly dramatic. Kavan (Reference Kavan2020), based on observed changes up to 2014, suggested the glacier was likely to disappear within 30 years (i.e. ∼2050). Our data show that by 2023, Ferdinandbreen had already lost 94.8% of its 2013 ice volume and Elsabreen had lost 50.0% of its 2013 ice volume, suggesting both may disappear long before 2050. Thus, the examples of vanishing Elsabreen and Ferdinandbreen provide important long-term evidence of rapid thinning and recession of Svalbard glaciers under climate warming and represent the likely trajectory of many other small land-terminating glaciers on the archipelago.
Such rapid glacier retreat and thinning have important implications for the deglaciating landscape left behind. These areas were likely ice free during the Holocene thermal optimum, where the Arctic experienced amplified climate shifts by increased oceanic and atmospheric temperatures, along with a large portion of north and west Spitsbergen (Fjeldskaar and others, Reference Fjeldskaar, Bondevik and Amantov2018; Farnsworth and others, Reference Farnsworth2024). These areas then reglaciated in the Late Holocene (∼4.2–4.0 ka BP) with most glaciers reaching their maximum extent at the LIA (Fjeldskaar and others, Reference Fjeldskaar, Bondevik and Amantov2018). Similar deglaciated transitions can now be seen in Svalbard associated with contemporary warming and climate change. Ferdinandbreen’s rapid post-LIA recession has been shown to drive the delivery of sediments to the coastal area, developing spit systems in Billefjorden (Strzelecki and others, Reference Strzelecki2018). As the Ferdinand valley and Elsa cirque become fully deglaciated, their geomorphology will transition to a landscape dominated by paraglacial processes and landforms such as talus, debris cones and fans with uncertain long-term stability (Ballantyne, Reference Ballantyne2008). Such geomorphological shifts are already being observed on Svalbard, with newly exposed coastal systems characterised by deltas, cliffs and tidal flats, such as at Brepollen, Hornsund (Strzelecki and others, Reference Strzelecki, Szczuciński, Dominiczak, Zagórski, Dudek and Knight2020). Glacier retreat on the archipelago has already exposed nearly 1000 km of new coastline since the 1930s (Kavan and Strzelecki, Reference Kavan and Strzelecki2023) and over 200 km since 2000 (Kavan and others, Reference Kavan, Szczypińska, Kochtitzky, Farquharson, Bendixen and Strzelecki2025). This landscape shift will also impact the wider ecosystems. A reduction in glacier meltwater and associated sediment and nutrient inputs into the fjord will see a reduction in fjord productivity, impacting specialised mammals and birds such as ringed and bearded seals and kittiwakes (Hartley and Fisher, Reference Hartley and Fisher1936; Lydersen and others, Reference Lydersen2014; Meire and others, Reference Meire2017; Kavan and Strzelecki, Reference Kavan and Strzelecki2023).
It is clear that both glaciers have surpassed a threshold by which they can be sustained by current accumulation and with continued temperature rises due to climate change, their complete loss in the coming years appears inevitable. Elsabreen and Ferdinandbreen are strong candidates for the Global Glacier Casualty List, and the projected continued climate warming will cause the disappearance of land-terminating glaciers in Svalbard. In the future, it is also likely that both glaciers could also be added to the list of extinct glaciers in the GLIMS Glacier Inventory.
6. Conclusions
Elsabreen and Ferdinandbreen in Petuniabukta, Svalbard, have undergone rapid retreat and thinning since the LIA (∼1900 CE), which has accelerated post-1990. Both glaciers lost over 93% of their area and over 96% of their ice volume over this period and should be considered within the category of vanishing glaciers. The highest rates of volume change occurred between 1990 and 2009, coincident with Ferdinandbreen beginning to fragment around a number of bedrock bumps. Glacier fragmentation processes were evidenced from 2008, leading to the glacier completely disconnecting from its higher elevation accumulation areas by 2021. In 2024, both Elsabreen and Ferdinandbreen were very small, thin and isolated ice remnants with likely only very limited ice flow, if any at all, and their longevity can be measured in years rather than decades. Based on our analysis, deglaciation of Elsabreen and Ferdinandbreen in the near future is inevitable, and the continued climate warming in Svalbard will likely mean many other thin and cold-based land-terminating glaciers will be joining them.
Data availability statement
Datasets of glacier outlines in .xshp format and DEMs of difference for Elsabreen and Ferdinandbreen created in this study are available on Zenodo at https://doi.org/10.5281/zenodo.17879675 and https://doi.org/10.5281/zenodo.17899856, respectively.
Acknowledgements
We would like to thank the staff and students at the Adam Mickiewicz University Polar Station in Petuniabukta for supporting fieldwork and the University of Portsmouth and Northumbria University for fieldwork funding. We would also like to thank the two reviewers, Jan Kavan and an anonymous reviewer, scientific editor Hrafnhildur Hannesdottir and associate chief editor Liss Marie Andreassen for their comments that helped improve the manuscript.


 Open access