


Introduction
A vast network of linear ridge/earthwork features, distributed across an area of more than 800km2, forms the standing remains of an agricultural system that once covered most of the Shaṭṭ al-ᶜArab floodplain in the Basra Governorate of southern Iraq. These features attest to an episode of agricultural expansion, far beyond the bounds of modern farming (Figure 1), which is thought to have occurred between the AD 630s, when the city of Basra was founded at its original location near modern Zubair, and the late ninth century AD, when political turmoil curtailed the city’s growth (Brown Reference Brown2022). Specifically, the ridge/earthwork features have frequently been regarded as products of forced labour carried out by slaves—who are referred to in the historic textual sources as ‘the Zanj’ (Herzfeld Reference Herzfeld1948: 262; Nelson Reference Nelson1962; Franz Reference Franz2004: 50; Kennedy Reference Kennedy2011: 187–89; Verkinderen Reference Verkinderen2015).
Location and distribution of the ridge/earthwork system, showing the extent covered by the project study area in southern Iraq. Created in ArcGIS Pro 3.1.3 using the Copernicus GLO-30 Digital Elevation Model (https://doi.org/10.5270/ESA-c5d3d65) and data from Natural Earth, the Database of Global Administrative Areas (GADM), the United Nations Office for the Coordination of Humanitarian Affairs (OCHA) and OpenStreetMap under Open Database Licence https://opendatacommons.org/licenses/odbl/1-0/ (figure by authors).

‘Zanj’ is a medieval Arabic term for the East African Swahili coast and the dominant scholarly opinion is that the Zanj slaves were associated with those shores (e.g. Horton Reference Horton1996: 415–16; Popovic Reference Popovic1999: 14–25). Medieval authors, however, used the term ‘Zanj’ inconsistently in general reference to enslaved people of diverse origins, as well as peasants of local descent. Accordingly, the group referred to as the Zanj likely included both local people and enslaved Africans transported to Iraq (Campbell Reference Campbell and Campbell2016: 280–83). Departing from the traditional view, Campbell (Reference Campbell and Campbell2016)—citing genetic studies, the connections between North African slaving networks and sub-Saharan Africa, and the comparative lack of evidence for a substantive slave trade between East Africa and Iraq during the period—argues that most African slaves among the Zanj originated from West and western Central Africa rather than the Swahili coast.
Whatever their precise composition, the group that has become known as the Zanj revolted in AD 869, sparking more than a decade of unrest until the Abbasid state regained control of the region in AD 883 (Popovic Reference Popovic1999). This was not the first uprising of Zanj slaves in southern Iraq: two minor insurrections occurred in AD 689–690 and AD 694–695 (Popovic Reference Popovic1999: 22–23). Though few details are recorded, both insurrections were apparently suppressed rapidly, without major repercussions. In contrast, the extended duration of the ninth-century revolt, and the detailed textual account of its unfolding (al-Ṭabarī, Taʾrīkh al-rusul wa-l-mulūk; Waines Reference Waines1992), suggest this was an event of greater import.
On the eve of the AD 869 revolt, large numbers of the Zanj were spread out in work camps throughout the agricultural zone east of historic Basra, on both sides of the Shaṭṭ al-ᶜArab (al-Ṭabarī, Taʾrīkh al-rusul wa-l-mulūk; Waines Reference Waines1992: 36; Popovic Reference Popovic1999: 23–24). While work locations cannot be reconstructed in detail from the textual descriptions, the system of ridge/earthwork features upon which this article focuses lies within this zone—which also hosted key events of the revolt. During the uprising, for example, the Zanj are thought to have established their headquarters—which they called al-Muḫtāra—within the area they had once worked as agricultural slaves (Popovic Reference Popovic1999: 11–12, 190; Verkinderen Reference Verkinderen2015: 74). Reportedly, the harsh conditions under which the Zanj worked formed a major catalyst for the uprising (al-Ṭabarī, Taʾrīkh al-rusul wa-l-mulūk; Waines Reference Waines1992: 36–38) while, as mentioned above, the earthworks found within this zone have widely been interpreted as the products of Zanj labour. If true, the exploitative situation through which these features were created likely played a key role in igniting the revolt. Until now, however, absolute dating of the ridge features themselves has been unavailable to verify this narrative. This article presents new data that enhances our understanding of these features—providing, for the first time, material evidence for the chronology of their creation and use.
The ridge/earthwork system
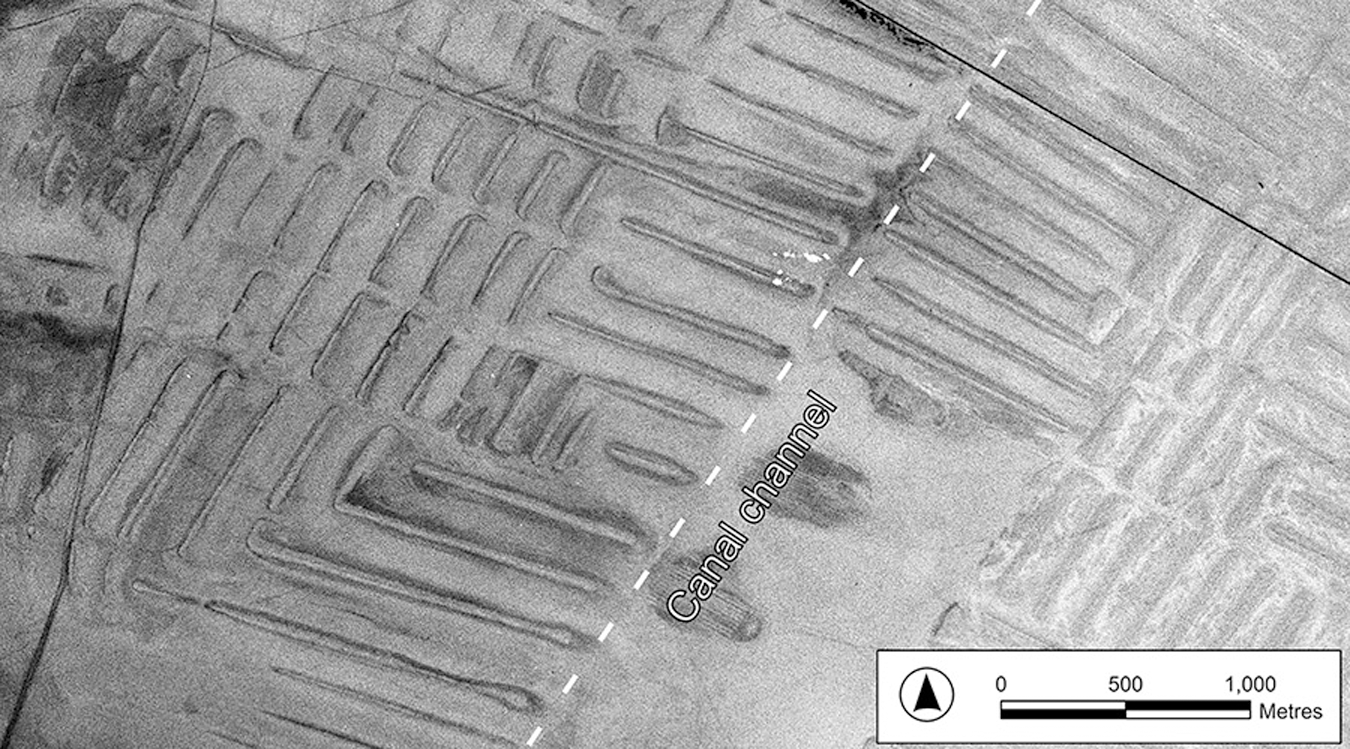
The ridges of the Shaṭṭ al-ᶜArab floodplain are massive features (Figure 2). They form linear embankments, typically varying in length from approximately 400–1200m with a width of roughly 20–50m, in some cases reaching a height of 2m above the ground surface. Most are laid out in parallel groups of similar dimensions, separated by 100–250m of flat land forming ‘blocks’, arranged around and demarcated by approximately orthogonal, relict canals (Figure 3). The ridges abut larger relict canal beds at 90° with secondary channels, parallel with the ridges, in the flat areas in between (Figure 4). Ultimately, these canals connect with the Shaṭṭ al-ᶜArab from which they must originally have brought water inland—indeed, some still carry water up to 5km from the riverbank but, beyond this, water no longer flows inland and the canals are abandoned (Figure 5).
Drone photograph looking west showing several linear ridge features within the study area. Sample site 2 is visible in the lower right-hand corner (photograph by authors).

CORONA satellite photograph of a typical area of ridge/earthwork features within the study area. Photograph number DS1035-1040DF019 captured 23 September 1966 (reproduced courtesy of the US Geological Survey).

Drone photograph looking north-west showing ridge features with parallel relict canal channels in the interspersing flat areas (photograph by authors).

CORONA satellite photograph showing active canals and agriculture among the ridges in the 1960s. Photograph number DS1045-1040DA041 captured 27 January 1968 (reproduced courtesy of the US Geological Survey).

Analysis of both recent satellite imagery, from the past 10 years, and legacy imagery from the 1960s, reveals the remains of more than 7000 ridges across the Shaṭṭ al-ᶜArab floodplain. The most northerly are located 15km south of Al Qurnah, while the town of Abadan, Iran, defines their southerly limit (Figure 1). If each of these ridge features were laid out end to end, they would stretch for about 3000km. Not only, therefore, does each ridge represent a substantial movement of soil, the entire system equates to an investment of human labour on a grand-scale—requiring either a huge workforce or the sustained activity of smaller groups over a protracted period.
Several scenarios potentially explain how this system of ridges and canals was created, and how they functioned as an agricultural system (Brown Reference Brown2022: 391–94). The most likely hypotheses are that the earthworks are products of either the clearance and preparation of land, to bring new areas into cultivation, or the long-term maintenance of agriculturally productive areas, requiring the frequent cleaning of canals and clearance of sediments deposited through irrigation. Of the few previous studies focusing on these features, the most influential is the work of Nelson (Reference Nelson1962) who demonstrated that the sediments of the ridge/earthwork features were approximately twice as saline as sediments from the interspersing flat areas. He interpreted this as evidence that the ridge features were created through the clearance of soils made infertile by the accumulation of salt from repeated irrigation over an extended timeframe. Since Nelson did not list how many samples he took, nor exactly which areas were sampled, the applicability of his results across the entire system, as well as the extent to which they represent the pre-modern situation, is unclear.
More definite is the relationship between the ridge features and the Shaṭṭ al-ᶜArab. In the past, the canals connecting with the river seem to have permitted the cultivation of a large expanse of the Shaṭṭ al-ᶜArab floodplain through tidal irrigation. Twice daily, the tides of the Gulf push the freshwater in the Shaṭṭ al-ᶜArab estuary upstream. This produces a rise in river level that can be harnessed to irrigate crops (Buringh Reference Buringh1960: 121, 189). The dynamics of this system, and its water quality, represent a complex interaction between the variable discharge of the Tigris, Euphrates and Karun rivers into the Shaṭṭ al-ᶜArab in addition to inputs from saline marshes, upstream irrigation, pollution and the natural tidal variation of the Gulf (Abdullah et al. Reference Abdullah, Karim, Masih, Popescu and Van der Zaag2016).
Around the world, several comparable systems harness tidal forces to irrigate crops. For example, in traditional West African rice cultivation practices, the development of which is dated through linguistic evidence to approximately AD 1000, freshwater pushed upstream by tidal forces was captured and contained within low-lying fields for desalination and irrigation (Fields-Black Reference Fields-Black2008: 119–21). Comparably, in the navazo of coastal south-western Spain, a system practised from at least the early sixteenth century AD to the present-day, agricultural plots within interdunal spaces capitalise on fluctuations, through tidal influence, in the freshwater-saltwater interface within the coastal aquifer to irrigate plant roots (Sánchez et al. Reference Sánchez, Roskin, Taxel and Brown2024: 8). Though adapted to suit environmental conditions within different cultural contexts, these systems share a requirement for substantial investments in labour—both to create the physical infrastructure through which freshwater influenced by tidal forces was distributed, or accessed, for agricultural purposes and to maintain these systems once established. Understanding when, and in what circumstances, such solutions have developed in different historical contexts and the variations between their construction and operation is, therefore, of wider significance beyond southern Iraq.
Further details about the system of tidal irrigation in the Basra area come from the descriptions of medieval authors. The tenth-century geographer al-Muqaddasī (Aḥsan al-taqāsīm fī maʿrifat al-aqālīm; Collins Reference Collins1994: 113), for example, describes how mills situated at the mouths of canals in the Basra region were driven by the ebbing tide as the water flowed back downstream. Some two centuries later, the geographer al-Idrīsī (Nuzhat al-mushtāq fī khtirāq al-āfāq; Jaubert Reference Jaubert1836: 369), discusses how the many canals surrounding Basra were influenced by the tides, with areas of cultivation irrigated on the rising tide and with water returning to the canals when the tide retreated. Writing in the fourteenth century, Abū al-Fidā’ (Taqwīm al-buldān; Reinaud Reference Reinhard1848: 72) further explains that ships could take advantage of these tidal influences to travel with the rising tide up the Shaṭṭ al-ᶜArab and down canals to reach Basra. Though it is unclear exactly when the majority of the ridge/earthwork system fell out of use, it was apparently largely abandoned by the early seventeenth century when the Portuguese traveller Pedro Teixeira (Relaciones de Pedro Teixeira; Sinclair Reference Sinclair1902: 34) crossed the area, as his description parallels the modern situation: “about half a league through the palm-groves, [we] then entered on desert plains, subject to flood, and covered with salt. This is produced by the heat of the sun … from the sea-water of [the Gulf]; which, though more than ten leagues distant, drowns these lands in certain conjunctions. Whereby much of them, once fertile, has been desolated.”
The Shaṭṭ al-ᶜArab’s potential for tidal irrigation was apparently the condition upon which the development of the agricultural system was based. This observation is reinforced by the fact that the northerly limit of the river’s tidal effects and the distribution of ridge features occur in tandem close to Al Qurnah (Buringh Reference Buringh1960: 189). The uniformity of the ridges, and their consistent morphology, provides further evidence that the system was tailored to a specific type of agriculture. The crops grown across the system, however, are not known in detail. Nelson (Reference Nelson1962: 70) suggests that a crop of winter barley was the most likely product cultivated in the spaces between the ridge features. Medieval sources, as well as contemporary evidence from the zone adjacent to the Shaṭṭ al-ᶜArab still farmed today, emphasise the importance of the region’s date production. Ceramic storage jars from southern Iraq, exported in vast numbers during the ninth and tenth centuries as far afield as China, are thought to have contained dates and date-based products (Chuimei Reference Chuimei1995: 33). Dates are also repeatedly alluded to in al-Ṭabarī’s account of the Zanj rebellion (Waines Reference Waines1992: 67, 54, 109). He describes palm groves surrounding the ‘salt flats’ that provided areas from which the rebels could spring to ambush the Abbasid forces sent against them, noting that the densely packed trees also impeded the progress of troops and horses. In the mid-fourteenth century, the traveller Ibn Baṭṭūṭa (Tuḥfat al-nuẓẓār fī gharāʾib al-amṣār wa-ʿajāʾib al-asfār; Gibb Reference Gibb1962: 276) remarked that “no place on earth exceeds [Basra] in quantity of palm-groves”, a sentiment that was still echoed in the seventeenth century by Teixeira (Sinclair Reference Sinclair1902: 29). Though dates are a relatively salt-tolerant crop, modern studies suggest the salt concentrations measured by Nelson (Reference Nelson1962: 71) in the flat areas between the ridges, 15dS/m (decisiemens/m; a measure of electrical conductance, here resulting from salinity), would have caused a reduction in yields of more than 50 per cent (Al-Dakheel et al. Reference Al-Dakheel, Iftikhar Hussain, Abdulrahman and Abdullah2022). In traditional oasis cultivation practised today, crops including fruits, vegetables, rice and barley are grown in among date palms—the shade the palms provide offers good growing conditions for certain crops while, at greater spacings, dates can also be intercropped with varieties requiring more sunlight (Abul-Soad et al. Reference Abul-Soad, Mahdi, Markhand, Al-Khayri, Jain and Johnson2015: 156). Such a model may have been practised within the ridge/earthwork system of the Shaṭṭ al-ᶜArab.
Although medieval textual sources provide a wealth of information that may be linked to the ridge/earthwork system of the Shaṭṭ al-ᶜArab floodplain, there are no definite descriptions. Al-Ṭabarī, for example, refers to ‘hills’ in the floodplain zone; in one section, he describes a ‘hilltop’ overlooking a group of palm trees (Waines Reference Waines1992: 54). Since natural hill or mound features are virtually absent in the surrounding area (see Figure 1), such descriptions could relate to artificial prominences, such as the ridge features themselves. More definitively, an anonymous eleventh-century chronicle (Kitab al-‘Uyun; Saïdi Reference Saïdi1972: 16) states that ‘hills’ in the area were created by the Zanj to make the area cultivable, though further details are not provided. These somewhat sparse descriptions, combined with a lack of supporting material evidence, have left considerable uncertainty over the period during which these features were created and used, as well as how they may have functioned as an agricultural system. While such features are difficult to date through traditional means (Turner et al. Reference Turner2021), this study aims to clarify when the ridges accumulated and the period of use for the wider agricultural system through absolute dating methods.
Methods
Detailed mapping using both recent imagery from the past 10 years and photographs from the US CORONA satellite programme, from the 1960s, permitted a clearer understanding of the extent of the ridge/earthwork system. Based on this mapping, sampling sites were selected across the system for the retrieval of samples for both radiocarbon and optically stimulated luminescence (OSL) dating. OSL is particularly suitable for dating irrigation and cultivation features since it can be used to date the last exposure of mineral grains in the sediment to light (Duller Reference Duller2008), rather than relying on the recovery of organic objects, which can be scarce in these types of deposits (Turner et al. Reference Turner2021).
Many of the ridges have suffered recent erosion, through the construction of infrastructure associated with nearby oilfields and military operations during the First Gulf War. With the aim of retrieving samples undisturbed since the abandonment of the system, sample sites were selected based on the state of preservation observable in recent satellite imagery. An additional priority was to take samples from ridges situated in different parts of the system to gauge whether earthworks in separate areas belong to the same period or if specific sections were later additions to an existing system. Furthermore, OSL samples from different depths were taken at several sampling sites to provide an insight into the timeframe over which individual ridges accumulated. Fieldwork was carried out in January 2022 during which small sampling trenches were excavated at five sites (Figure 6). Four of these sampling sites targeted the crests of different ridge features (e.g. Figure 7) while the fifth was located within the bed of one of the relict canals running throughout the ridge/earthwork system.
Locations of sampling sites within the system of ridges. Created in ArcGIS Pro 3.1.3 using the Copernicus GLO-30 Digital Elevation Model (https://doi.org/10.5270/ESA-c5d3d65) and data from Natural Earth, GADM, OCHA and OpenStreetMap under Open Database Licence https://opendatacommons.org/licenses/odbl/1-0/ (figure by authors).

Drone photograph looking down on the excavation into the ridge crest at sampling site 2 (figure by authors).

No clear stratigraphy was observed in the sampling trenches on the ridge crests. Typically, beneath a layer of topsoil (50–200mm thick) containing gypcrete crystals, each ridge was composed of unstratified silty clay. In the sample trench targeting the relict canal bed (site 3), five distinct layers of clay/silty clay were encountered down to 0.95m below the surface. From two of the sampling trenches targeting ridge crests (sites 2 and 4) fragments of shell were recovered and retained for radiocarbon dating. Samples for OSL dating were taken from all sampling sites, providing 12 samples in total. In addition to a single OSL sample from sites 4 and 5, three samples from different depths were taken at sites 1 and 2 and four samples were collected from site 3 (Figure 8). For more information on the locations, stratigraphy and samples from the five sampling sites see the online supplementary material (OSM).
Samples being taken for OSL dating. Left to right: site 1, site 3, site 5 and site 4 (figure by authors).

Results
Radiocarbon
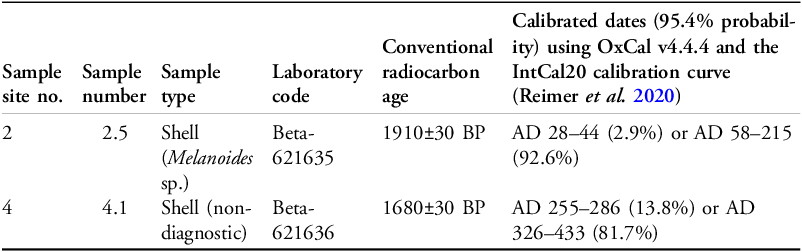
Two shell samples—one from site 2 and one from site 4 were subject to accelerator mass spectrometry radiocarbon dating at the Beta Analytic Radiocarbon Dating Laboratory. The results of this analysis are presented in Table 1 and discussed in more detail in the OSM. Using OxCal v.4.4.4 and the IntCal20 calibration curve (Reimer et al. Reference Reimer2020; Bronk Ramsey Reference Bronk Ramsey2021), at 95.4% probability, the shell from site 2 gives a calendar age of either AD 28–44 (2.9%) or AD 58–215 (92.6%), while the shell from site 4 gives a calendar age of either AD 255–286 (13.8%) or AD 326–433 (81.7%).
Samples submitted for radiocarbon dating and results.

Optically stimulated luminescence
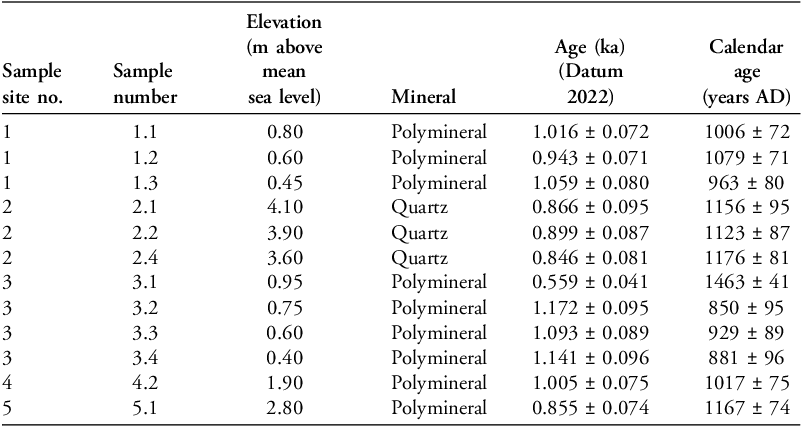
The OSL samples retrieved from the five sites were submitted to the Durham University Luminescence Laboratory. The final results of this analysis are presented in Table 2. Full details of the methods and more detailed results are included in the OSM.
Samples submitted for OSL dating and results.

Discussion
The OSL results provide primary evidence for the accumulation of sediments within the ridge/earthwork features. All four of the ridge crests sampled date to the period between the late ninth to mid-thirteenth century AD. Within individual ridge features, dates were all relatively consistent and samples from different depths did not indicate a clear chronology as uncertainty ranges overlap and mask any age differences. At site 2, for example, the deepest sample (no. 2.4) produced a more recent age (1176±81 calendar years AD) than the two overlying samples (1156±95 and 1123±87 calendar years AD). However, the uncertainty values of ±81–95 years mean that the metre of sediment in this ridge could have accumulated in either a short episode, perhaps over a few years, or a longer interval of up to almost a century between the late eleventh and early thirteenth centuries. Site 1 produced similar, though slightly earlier, results indicating that the sampled sediments accumulated between the late ninth and late eleventh centuries. The oldest ridge sample (no. 1.3) gave a date ranging from the period immediately after the Zanj rebellion to the mid-eleventh century (963±80 calendar years AD). All samples from the four ridge crests, therefore, post-date the period of the Zanj rebellion.
At both sites 2 and 4, a substantial disparity in age is apparent between the shell samples dated through radiocarbon methods and OSL samples taken from similar depths, with shell samples producing ages several centuries older than the OSL samples. Conceivably, cultivation and canal digging practices could have led to the excavation of old shells and their incorporation into the ridge with later sediments. Since both shell samples returned similar dates, however, the age disparity probably relates to a systematic factor such as the influence of freshwater reservoir effects. These ages, therefore, cannot be regarded as reliable age estimations and should be treated only as a terminus post quem (Egberts et al. Reference Egberts, Jotheri, Di Michele, Baxter and Rey2023; see OSM for further discussion).
Due to the limited scale of our sampling trenches, and the broadly uniform stratigraphy encountered within, all the ridge samples likely come from within the ridge cores themselves, rather than from natural soils pre-dating their accumulation. The earliest OSL dates presented here, therefore, represent a terminus ante quem for the first accumulation of sediments within each of the ridge/earthwork features. Since the earliest date from the ridge features (no. 1.3) demonstrates that the ridge existed in the century after the Zanj rebellion, samples collected from deeper within the ridge cores would likely establish a more definite link between these features and the textual descriptions relating to the Zanj. This scenario views the ridge features as gradual accumulations that were added to over a long period—most likely through the intermittent removal of sediments deposited by irrigation waters, which, if left unchecked, would have eventually blocked canals and rendered the system inoperable. The necessity for ongoing work of this nature is supported by both twentieth-century reports (Lees & Falcon Reference Lees and Falcon1952: 34, note 1; Buringh Reference Buringh1960: 189) and discussions with local farmers who, in several areas, still farm between the ridges today.
The samples collected from site 3—the relict canal bed—are slightly earlier in date than those from the ridge crests. The three samples from the deepest layer (nos. 3.2, 3.3, 3.4) returned dates falling between the late eighth and the mid-eleventh centuries. Sample 3.1, collected from a layer separated from preceding strata by a 0.1m-thick layer of dark-green clay, dates to several centuries later (1464±41 calendar years AD). The dark-green clay layer could, therefore, represent a period of low sedimentation in the canal bed—perhaps resulting from active irrigation and canal cleaning—that approximately corresponds with the period of sediment accumulation in the neighbouring ridge, indicated by the dates from site 2. Meanwhile, patches of clay detected at site 2, and also seen at site 4, may relate to regular cleaning of the adjacent canal and the subsequent deposition of material upon the ridge.
While questions remain, the results presented here demonstrate that the ridge/earthwork features in the hinterland of Basra are medieval in date and that their accumulation continued between the ninth and thirteenth centuries (Figure 9). These results deviate from the accepted historical narrative of the area’s landscape history, in which the Zanj rebellion provides a pivot point from a period of agricultural expansion to a period of greatly reduced economic activity (e.g. Verkinderen Reference Verkinderen, Delattre, Legendre and Sijpesteijn2018: 523). Although travellers visiting Basra in the centuries following the Zanj rebellion, such as Nāṣir Khusraw (Safarnāma; Thackston Reference Thackston1986: 90) in AD 1051 and Ibn Baṭṭūṭa (Tuḥfat al-nuẓẓār fī gharāʾib al-amṣār wa-ʿajāʾib al-asfār; Gibb Reference Gibb1962: 275) in the 1320s, reported that Basra was smaller and less populous than in earlier times, they also remarked on its contemporary wealth and importance. In accordance with the majority of OSL dates from the sampled ridges, Nāṣir Khusraw describes how, though large parts of the city were apparently abandoned, “the walls were strong and well kept, the populace numerous, and the ruler with plenty of income” (Thackston Reference Thackston1986: 90). Furthermore, it is during this period that textual sources document the presence of canals, mills and the practice of tidal irrigation in the city’s hinterland. It would be surprising, therefore, if viable land-use practices, and large areas of agricultural land surrounding the city, had been completely abandoned during this period.
OSL dating results compared against major and local historical events (figure by authors).

Although this research cannot identify the specific groups involved in erecting and maintaining these earthworks, sufficient labour evidently remained available in the aftermath of the Zanj rebellion to continue cultivation across this zone with the associated accumulation of the ridge features. While it has frequently been asserted that the Zanj rebellion caused a reduction in the use of slaves by the Abbasids, especially in large groups (e.g. Phillips Reference Phillips1985: 76), others have argued that no major change occurred in the revolt’s aftermath (Beg Reference Beg and Morony2003: 118). Indeed, Nāṣir Khusraw saw large numbers of African slaves working in the “fields and gardens” of al-Ahsa in eastern Arabia in AD 1050 (Thackston Reference Thackston1986: 87). Since the Zanj rebellion does not appear to have precipitated the abandonment of the agricultural system in the Shaṭṭ al-ᶜArab floodplain, alternative explanations must be sought. Disruption caused by the Mongol invasions in the mid-thirteenth century provide one such possibility, while an associated decline in the importance of Baghdad and the Gulf, and a shift in focus to Cairo and the Red Sea (Abu-Lughod Reference Abu-Lughod1987: 14–15), may have reduced the market for agricultural produce from southern Iraq.
Climatic change could also have resulted in a reduction in the volume of water available for irrigation within the Shaṭṭ al-ᶜArab. Though pre-modern records for the climate of southern Iraq are sparse, multi-proxy records from the wider region, which closely reflect discharge in the Tigris, indicate a long-term aridification trend from around AD 950 to the present day (Flohr et al. Reference Flohr2017). A drop in the level of the Shaṭṭ al-ᶜArab, which ultimately supplied the canals running throughout the ridge/earthwork features, would have meant a reduced tidal rise that may ultimately have reduced the amount of land that could be irrigated or negatively influenced crop yields.
The spread of plague in the fourteenth century offers another potentially decisive factor. The mass mortality of both the workforce that maintained and cultivated the system and the population reliant on its produce would have introduced substantial difficulties for labour-intensive cultivation systems (Christensen Reference Christensen1993: 103–104). Currently, estimates indicate a mortality figure of approximately 42 per cent for the Middle East region as a whole (Borsch & Sabraa Reference Borsch and Sabraa2017: 84), and rural settlement in Baghdad’s hinterland appears to have declined sharply during this period (Adams Reference Adams1965: 109–11, 114–16).
Whether any of these factors, or a combination thereof, lay behind the decline in the ridge/earthwork system of southern Iraq cannot be definitively demonstrated without further evidence. A substantial change certainly occurred in the local area between the mid-fourteenth and early sixteenth centuries AD as the historic city of Basra was gradually depopulated in favour of the present city location closer to the banks of the Shaṭṭ al-ᶜArab, in among the much-reduced zone of cultivation still farmed today (Figure 1). Whether this shift in the local settlement pattern was a further reflection of the factors that led to the decline of the ridge/earthwork agricultural system is a question for further research.
Conclusion
The research presented here provides, for the first time, absolute dating for the use of the large-scale system of ridges and canals in the Shaṭṭ al-ᶜArab floodplain. In some ways, the results refute the traditional historical narrative in which the heyday of Basra, in the Umayyad (AD 661–750) and early Abbasid (AD 750–c. 900) eras, was followed by a pronounced and prolonged period of decline. The OSL dates from the ridge/earthwork system demonstrate that a large area remained under cultivation between the ninth and thirteenth centuries, suggesting that the economic impact of the Zanj rebellion was neither as decisive nor as long-lasting as has frequently been argued in the past.
Yet these results represent only four of the more than 7000 ridge/earthwork features that dominate the floodplain. Some uncertainty therefore remains over the extent to which these dates represent the chronology of the wider system. The ridges sampled in this study are all located on the west bank of the Shaṭṭ al-ᶜArab, relatively close to the site of the medieval city of Basra—where an active market and concentrated population seems to have persisted at least into the fourteenth century. The extent to which areas of cultivation further removed from this urban centre—such as those on the east bank and those further upriver—remained in use into the twelfth and thirteenth centuries, and a more detailed understanding of how agricultural production across this system varied over time, await future research.
Acknowledgements
The authors thank all those involved in the fieldwork and especially the Iraqi Ministry of Higher Education and Scientific Research for their support in facilitating access to the ridges of Basra Governorate. We also thank the two anonymous reviewers for their comments and suggestions.
Funding statement
Fieldwork and laboratory analysis for the research presented in this article was funded by the Gerda Henkel Stiftung research project: ‘Dating the remains of an agricultural system in southern Iraq’. Peter J. Brown’s work on the project was funded through the project: ‘Source of life: water management in the premodern Middle East (c.7th–15th)’ with project number VI.C.181.016 of the NWO (Nederlandse Organisatie voor Wetenschappelijk Onderzoek) VICI research programme.
Data availability statement
Any data discussed in this study, not included in the OSM, are available from the corresponding author, upon reasonable request. For the purpose of open access, the author has applied a Creative Commons Attribution (CC BY) licence to any author accepted manuscript version arising from this submission.
Online supplementary material (OSM)
To view supplementary material for this article, please visit https://doi.org/10.15184/aqy.2025.72 and select the supplementary materials tab.


 Open access