


INTRODUCTION
Conservative parties thrive electorally in rural areas in the US and other advanced capitalist economies (Cramer Reference Cramer2016; Rodden Reference Rodden2019). Particularly given the political overrepresentation of rural areas, the countryside is a critical source of electoral support for right-wing political parties. Yet this was not always the case historically (see, e.g., Lipset Reference Lipset1950; Luebbert Reference Luebbert1987). In the case of the US, rural voters were relatively centrist in their politics and often supported left-wing politicians, like those belonging to the Populist Party, in the late nineteenth and early twentieth century.
What, then, explains the long-term transformation of rural areas into conservative electoral strongholds? In an important debate stoked by Frank’s (Reference Frank2007) book—which asked “What’s the Matter with Kansas?” —scholars have puzzled over the growing dominance of the conservative Republican Party in poor and rural states, a phenomenon that appears to contradict canonical class-based theories of voting. Yet, closer inspection of micro-level survey data demonstrates that within these states, it is affluent individuals who are most conservative in their voting patterns (see, e.g., Bartels Reference Bartels2006; Gelman Reference Gelman2009).
Building on these debates, this paper explores the role of technological and economic change in political change in rural areas. Long-term technological change transformed American agriculture in the twentieth century with innovations ranging from the improvement of crop and animal varieties, to the refinement of fertilizers and pesticides, to various forms of mechanization, to the development of new methods for harnessing water for irrigation, especially groundwater (Anderson Reference Anderson2009; Olmstead and Rhode Reference Olmstead and Rhode2001; Reference Olmstead and Rhode2008; Worster Reference Worster1992). Due to technological change, agricultural output quadrupled over the twentieth century in the US despite an 80% decline in labor usage (Pardey and Alston Reference Pardey and Alston2021).
Long-term technological change made agriculture more productive but also more capital-intensive, generating economies of scale that resulted in the winnowing of unproductive and precarious family farms, and their replacement by highly productive, business-like farms as well as the spatial agglomeration of agricultural industries—known jointly as agribusiness—which benefit from conservative economic policies, including limited government regulation and pro-business tax and spending policies. The growing economic and political power of agribusiness interests in rural areas has, this paper argues, played an important role in the long-term conservative transformation of rural political preferences and the growing electoral success of the Republican Party in rural areas.
To test the argument, this paper exploits a historical natural experiment in the American Great Plains: the post-war introduction of new irrigation technologies, which enabled farmers to irrigate otherwise arid land—but only in areas with access to groundwater. Without irrigation, the arid climate of the Great Plains is suitable mainly for extensive agriculture (attempts at intensive farming without controlled irrigation were partially responsible for the Dust Bowl which followed the droughts of the 1930s). Though the Ogallala Aquifer, one of the largest in the world, spans a large part of the Great Plains, until the 1940s available technology made it uneconomical to pump and distribute this groundwater on a large scale.
Following World War II, two innovations unleashed a process of technological change that transformed the Great Plains. The first was the adaptation of petroleum engines to groundwater extraction at scale through deep well pumps. The second was the invention of center-pivot irrigation, a system for irrigating large circular fields from a central well with a rotating arm affixed with sprinklers. Together, these innovations—“perhaps the most significant mechanical innovation in agriculture since the replacement of draft animals by the tractor” (Splinter Reference Splinter1976, 90)—enabled the spread of irrigation and the emergence of highly productive, capital-intensive farms operated by increasingly wealthy farmers as well as the spatial agglomeration of downstream industries like animal feedlots and meatpacking plants. As a result, the Great Plains turned into one of the most productive and industrialized agricultural regions in the world.
However, these technologies only benefited areas with groundwater, the main source of which is the Ogallala Aquifer. To validate this source of variation in exposure to technological change, we use tools from computer vision to develop remote-sensing measures of center-pivot irrigation diffusion, using a convolutional neural network (CNN) trained to detect the technology’s signature circular cropping patterns in Landsat satellite imagery. This exercise motivates the difference-in-differences identification strategy, which exploits time variation arising from the post-war introduction of the new technologies together with cross-sectional variation in aquifer coverage in a spatially matched sample of counties along the boundary of the Ogallala Aquifer to investigate whether counties more impacted by the post-war technological shock also became more conservative in their voting patterns over time.
Empirically, we use geographic information system (GIS) analysis to measure the share of county land overlying the Ogallala Aquifer. We link this information to county-level panel data on the Republican Party’s share of the two-party vote in presidential, senatorial, and gubernatorial elections between 1920 and 2000. Difference-in-differences analyses—which in preferred specifications prune the sample of counties to 200-km and 100-km buffer zones along the boundary of the Ogallala Aquifer in each state and also control for state-time-period fixed effects—indicate that technological change played a large role in the region’s long-term conservative electoral transformation. Decade-by-decade analyses suggest that a positive association between aquifer coverage and conservative voting emerged precisely when the new irrigation technologies were introduced and was not driven by potentially confounding pre-trends.
Additional tests indicate that the conservative electoral shift was driven by the rise of capital-intensive agriculture and the growing power of agribusiness interests. After World War II, counties with greater aquifer coverage experienced a relative increase in the capital intensity of agriculture as measured by machinery and the density and market value of farms, respectively. These counties retained a greater share of the workforce in farming and generated more wealth from agglomerating agricultural industries, reinforcing the “structural power” of agribusiness. By contrast, tests provide weaker support for alternative mechanisms, such as intrinsic differences between rural and urban voters, religiosity, or racial homogeneity. Counties with greater aquifer coverage experienced a relative increase in urbanization, due to the consolidation of small towns in areas of intensive agriculture. Counties with greater aquifer coverage experienced little relative increase in religiosity as proxied by church membership and a modest relative decline in the white share of the population over time.
Analysis of Cooperative Congressional Election Survey (CCES) data suggests that contemporary policy preferences differ systematically between individuals residing in zip codes just inside the Ogallala Aquifer boundary compared to those residing just outside, reflecting the political legacy of the post-war technological shock. Individuals living inside the boundaries of the Ogallala Aquifer, where capital-intensive agriculture and agribusiness-dependent local political economies thrive, are today systematically more opposed to environmental and labor regulation and to redistributive taxation and the welfare state. Attitudes also differ with regard to some moral/cultural issues. We discuss potential explanations for these spillovers, including the influence of conservative political elites emphasizing moral issues to highlight shared rural sectoral identity over class-based conflict.
The findings contribute to three main areas of research. First, they contribute to research on the origins of the urban–rural political divide, one of the defining features of politics in advanced capitalist economies (Cramer Reference Cramer2016; Rodden Reference Rodden2019). Important work shows that urban-centered technological dynamics like industrialization and the rise of the knowledge economy were pivotal in the historical emergence of left-wing politics in cities (Rodden Reference Rodden2019). We show that technological change in agriculture played an equally important role in the emergence of right-wing politics in the countryside, as precarious homesteads operated by yeoman farmers (the base of left-wing agrarian movements like the Populist Party) gave way to a sector dominated by capital-intensive farms and agricultural industries opposed to regulation and taxation. This paper leverages a large post-war technological shock to provide causally identified evidence that long-term technological and economic change made new politics in rural America.
The findings also provide a new answer to long-standing debates in American politics about “what’s the matter with Kansas”—that is, why the party of the rich, the Republican Party, thrives in comparatively poor and rural states (Bartels Reference Bartels2006; Frank Reference Frank2007; Gelman Reference Gelman2009; Walsh Reference Walsh2012). Frank’s explanation emphasizes the role of the “culture wars” in distracting poor and rural voters from class-based conflict. While not incompatible with these explanations, this paper provides an alternative economic interest-based account for the rise of rural conservatism conceptualized in terms of the businesses and industries geographically concentrated in rural areas. In the paper, we discuss not only how conservative political preferences arose among an emergent class of affluent land and business owners in areas impacted by technological change but also how these preferences were transmitted from agribusiness to the mass public, including the “structural” power wielded by agribusiness in areas where it is a dominant industry (Lindblom Reference Lindblom1977), as well as the organized influence of agribusiness on rural political life. Our findings are consistent with such transmission but do not pin the mechanisms down empirically; this is an important avenue for future work, and in the conclusion, we outline several potentially fruitful directions for further investigation of these channels.
Finally, the results contribute to the literature on the political effects of technological and economic change (Acemoglu and Robinson Reference Acemoglu and Robinson2006; Boix Reference Boix2019; Dasgupta Reference Dasgupta2018). Recent work explores the role of automation, globalization, and deindustrialization in the rise of right-wing voting in advanced capitalist economies beginning in the 1990s (Autor et al. Reference Autor, Dorn, Hanson and Majlesi2020; Baccini and Weymouth Reference Baccini and Weymouth2021). What this literature has missed, however, is a longer-term process of conservative political transformation in rural areas that took place over the course of the twentieth century. Long-term technological change led to the emergence of agribusiness-dependent rural political economies which have shifted in a conservative direction politically. Indeed, research finds that rural economic dependence on other “low road” industries such as oil, gas, and mining—which, like agribusiness, rely upon intensive use of natural resources and low-wage labor and have been driven by the emergence of new technologies like fracking—is also linked to conservative voting (Cooper, Kim, and Urpelainen Reference Cooper, Kim and Urpelainen2018; DiSalvo and Li Reference DiSalvo and Li2022; Hacker et al. Reference Hacker, Hertel-Fernandez, Pierson and Thelen2021; Sances and You Reference Sances and You2022).
The remainder of the paper is structured as follows. It first describes the historical setting. It then discusses the theoretical mechanisms linking technological change to the rise of rural conservatism. It then presents the empirical strategy and main results before testing competing mechanisms and concluding.
TECHNOLOGICAL AND POLITICAL CHANGE IN THE GREAT PLAINS
Agriculture in the Great Plains—a broad expanse of grassland spanning the American states of Texas, New Mexico, Oklahoma, Colorado, Kansas, Wyoming, Nebraska, South Dakota, Montana, and North Dakota—dates to the Homestead Act of 1862, which encouraged migration and agricultural development west of the Mississippi River with the promise of property rights to 160 acres of land to settlers who could offer proof of having settled and cultivated the land for five years. By the 1890s, the Great Plains were extensively populated by settlers, turning what had been a frontier region into a center of agriculture.
The conversion of arid prairie land into family farms—motivated by the widely held (but incorrect) belief that “rain follows the plow”—had devastating long-run ecological consequences. The elimination of prairie grasses that held the soil in place contributed to soil erosion, culminating in the Dust Bowl of the 1930s, a combination of prolonged drought, dust storms, and soil erosion that devastated agricultural production (Hornbeck Reference Hornbeck2012).
In the midst of collapsing demand and falling prices of the Great Depression, the Dust Bowl contributed to mass outmigration, in spite of New Deal programs that sought to mitigate falling prices and provide a safety net to farmers by paying them to cull livestock and reduce crop acreage. Agriculture in the region began to recover in the late 1930s and early 1940s. The newly created Soil Conservation Service (SCS) disseminated dryland agricultural practices, including the conversion of cropland to pastureland and the dissemination of drought-resistant crops. Many of the small family farms abandoned by debt-ridden small farmers were reclaimed by banks, resulting in the consolidation of agricultural land into larger farms.
Yet, agriculture remained unproductive and susceptible to droughts until the introduction of two post-World War II interrelated improvements in irrigation technology. The first was the adaptation of petroleum-powered engines to the task of extracting groundwater, resulting in much cheaper costs of lifting large volumes of groundwater. The preexisting technology for extracting groundwater was the windmill pump, which was constrained in the depth and quantity of water it could draw, generally limiting its use to water supply for the household and livestock. While more powerful pumps existed, their operating costs were prohibitively expensive for usage in agricultural irrigation (Opie Reference Opie2000, 126). Petroleum-powered irrigation pumps, based initially on the adaptation of automobile engines to deep well pumps, became widely available after World War II, making it much cheaper and economical to extract groundwater on a scale sufficient to irrigate crops, resulting in the spread of pump-based deep well groundwater irrigation from the 1940s and 1950s onward.
The second, closely related innovation, necessitated by the first, was the invention of center-pivot irrigation, a system for irrigation based on the sprinkler-based distribution of water from a central well through rotating arms up to a half-mile in radius. Invented by Frank Zybach in the 1940s and patented in 1952, center-pivot irrigation spread rapidly from the 1950s onward, resulting in the signature circular cropping patterns that dominate large parts of the Great Plains. The combination of cheaper extraction of groundwater as well as an efficient method for distributing water over a large area from a central source represented one of the most important technological innovations in agricultural history, enabling farmers to irrigate from the Ogallala Aquifer, one of the largest in the world. This enabled farmers to cultivate lucrative but water-intensive feed crops like corn and also contributed to the spatial agglomeration of downstream agricultural industries like animal feedlots and meatpacking plants—transforming the Great Plains into one of the most productive and industrialized agricultural regions of the world despite the arid climate (Opie Reference Opie2000).
The technological revolution coincided with a political revolution: the growing dominance of the Republican Party in elections in a region that had historically been centrist in its politics and where left-wing politics sometimes thrived. During the period of national Republican Party dominance in the nineteenth century, farmers in the Great Plains also tended to support the Republican Party, especially because of its support for the westward expansion of the railroad network (Aldrich Reference Aldrich1995). In the late nineteenth and early twentieth century, left-wing politics found considerable success, initially in the form of the Populist Party—which promised to nationalize the railways, eliminate the gold standard, and enact other redistributive policies intended to help poor and indebted farmers. Congressional representatives, majorities in state legislatures, and/or governors belonging to the Populist Party were elected from five (Colorado, Kansas, South Dakota, Nebraska, and Montana) Great Plains states (see, e.g., Ostler Reference Ostler1993). Subsequently, both major parties registered electoral victories in Great Plains states over time, including the Democratic Party under Franklin Delano Roosevelt, whose New Deal policies were popular among poor farmers.
Following World War II, however, Great Plains states became increasingly pro-Republican in their voting patterns, a trend that has proceeded unabated up to the present. Today, the region is an outlier in the degree of its staunch support for the Republican Party. Eight out of ten Great Plains states are “red” states (Grumbach, Hacker, and Pierson Reference Grumbach, Hacker and Pierson2021), a transformation that has led to debates about the historical origins of this conservative electoral shift. One conjecture emphasizes the “culture wars” which have purportedly distracted poor and rural voters from issues of redistribution and won them over to the side of the Republican Party (Frank Reference Frank2007). Others have pointed out, however, that in survey data household income remains a robust predictor of Republican Party voting (Bartels Reference Bartels2006), though red states like Kansas are also characterized by an “intercept shift” or greater individual propensity to vote for the Republican Party at all income levels (Gelman Reference Gelman2009). Together, these stylized facts challenge the “culture war” hypothesis but also raise the question of where the aggregate long-term shift in conservative voting originates.
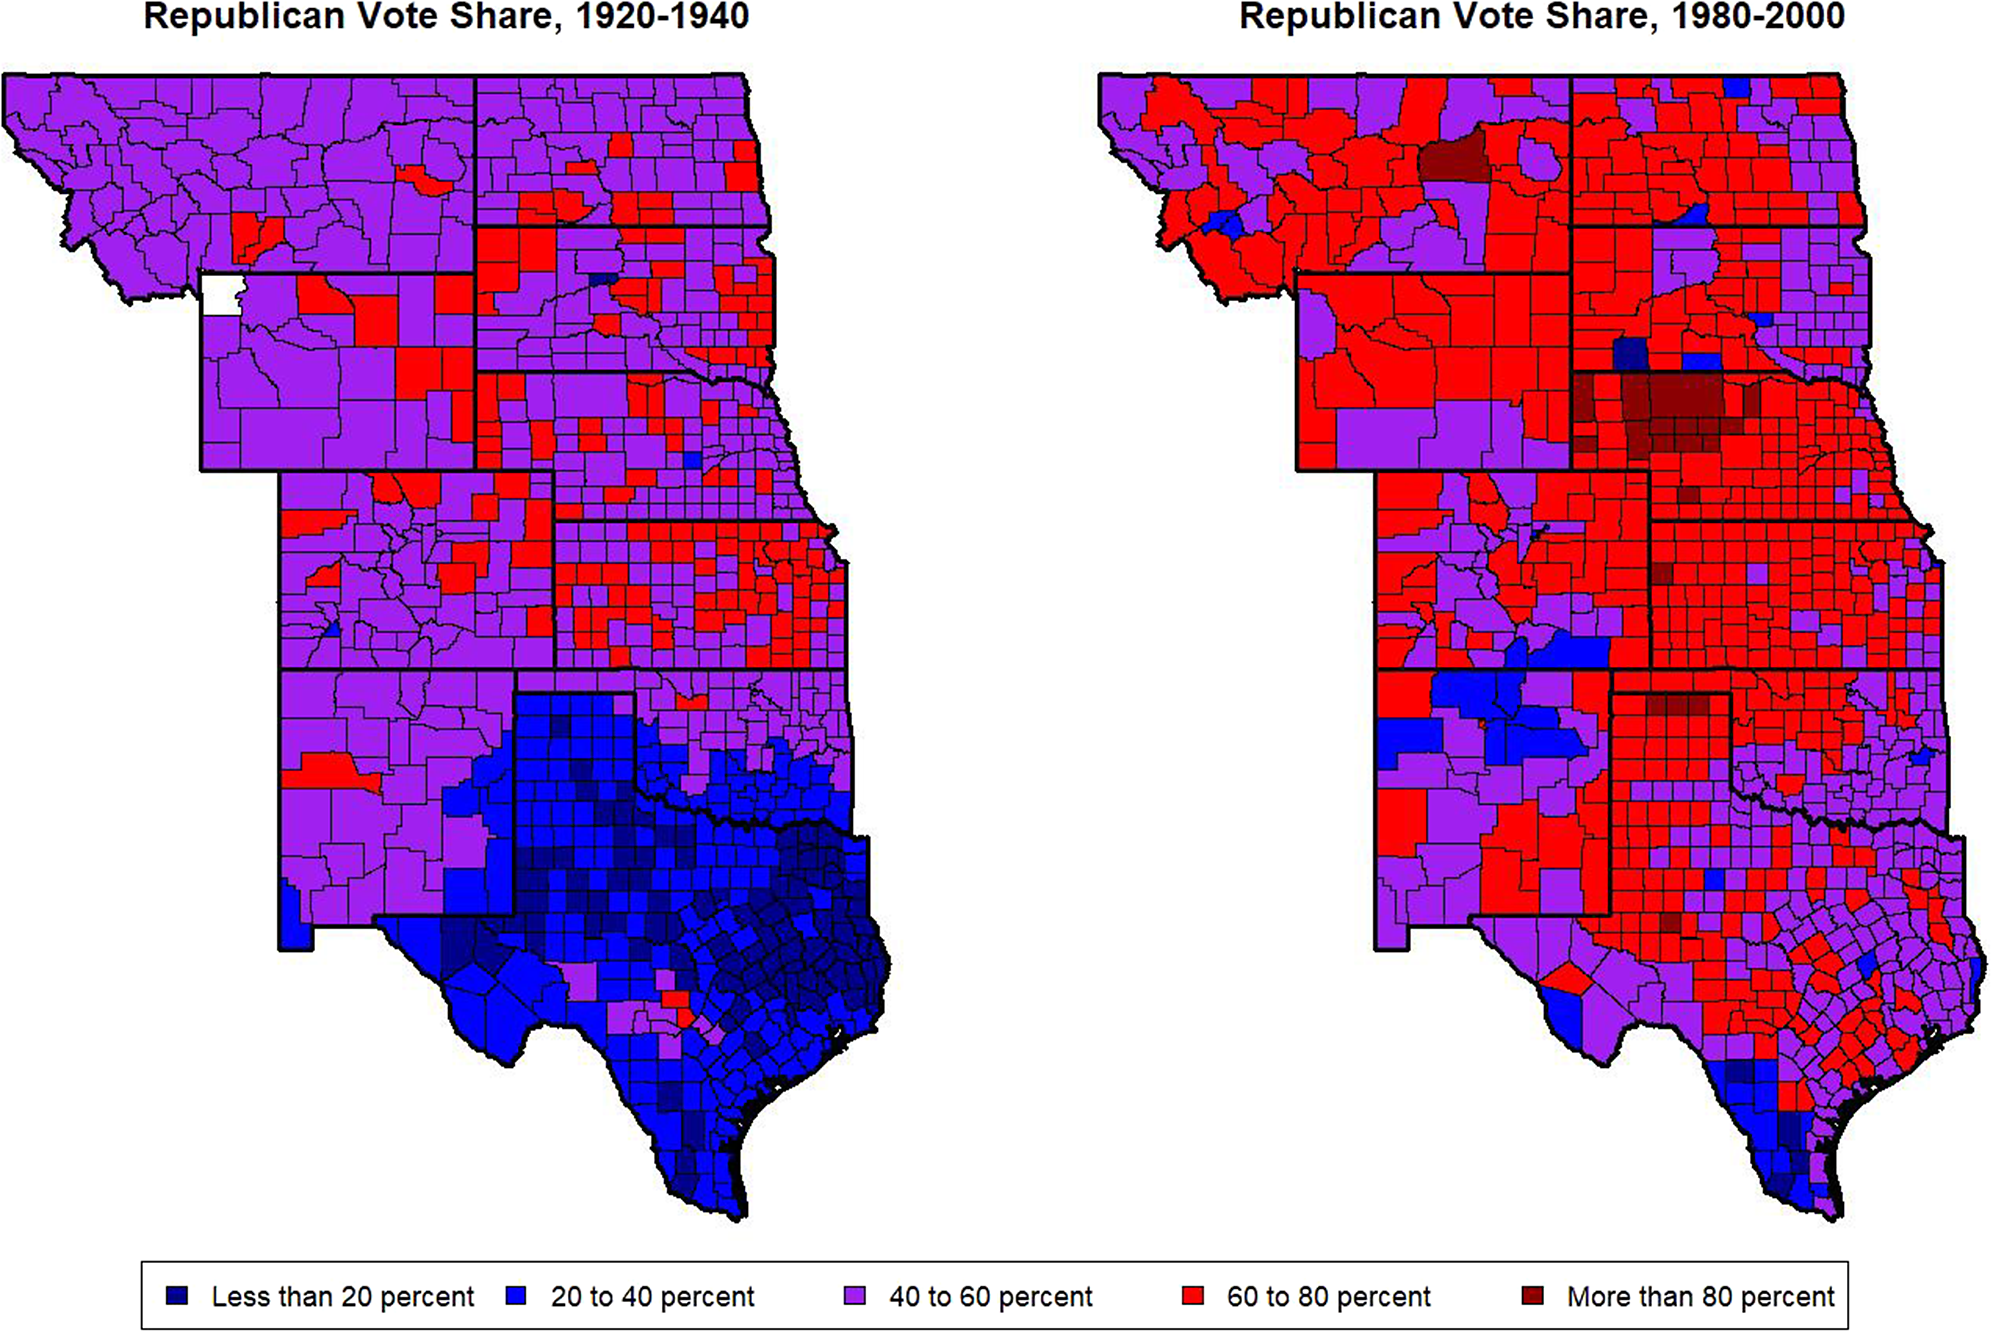
Figure 1 provides systematic data on this long-term political transformation, providing a map of Great Plains counties shaded according to the Republican Party’s percentage of the two-party vote in presidential elections between 1920 and 1940 in panel A and between 1980 and 2000 in panel B. As the map illustrates, over this period, the Great Plains evolved from a mostly “purple” (centrist) region into a consistently “red” (pro-Republican) region in elections.
County-Level Republican Vote Share in Presidential Elections
Notes: Panel A and B depict counties shaded by average Republican percentage of the two-party vote in presidential elections between 1920 and 1940 and between 1980 and 2000, respectively.
HOW NEW TECHNOLOGIES MADE NEW POLITICS
We develop a new explanation for the conservative transformation of rural political preferences that emphasizes not the culture wars but the role of long-term technological change in contributing to the emergence of capital-intensive agriculture and local political economies dependent on agribusiness, the growing economic and political power of which has played an important role in the increasing conservative electoral tilt of the region.
We highlight three potential mechanisms linking long-term technological change to a conservative shift in rural voting patterns: i) selection for scale—the consolidation of small/unproductive farms into larger operations over time due to economies of scale, contributing to the emergence of an affluent class of land and business owners with increasingly conservative political preferences; ii) agglomeration effects—the agglomeration of downstream industries and jobs centered around capital-intensive agriculture, which gives agribusiness “structural power” in communities dependent upon it for wealth generation; and iii) agribusiness influence—the organized influence of affluent agribusiness interests on rural political life through campaign contributions as well as other influence activities. Throughout, we illustrate these mechanisms with micro-level qualitative evidence from Haskell County—a county located within the boundaries of the Ogallala Aquifer in southwestern Kansas—which sociologists have repeatedly visited to carry out rural community studies over a 50-year period spanning the pre- and post-technological shock periods.Footnote 1(Figure 2)
Theoretical Diagram
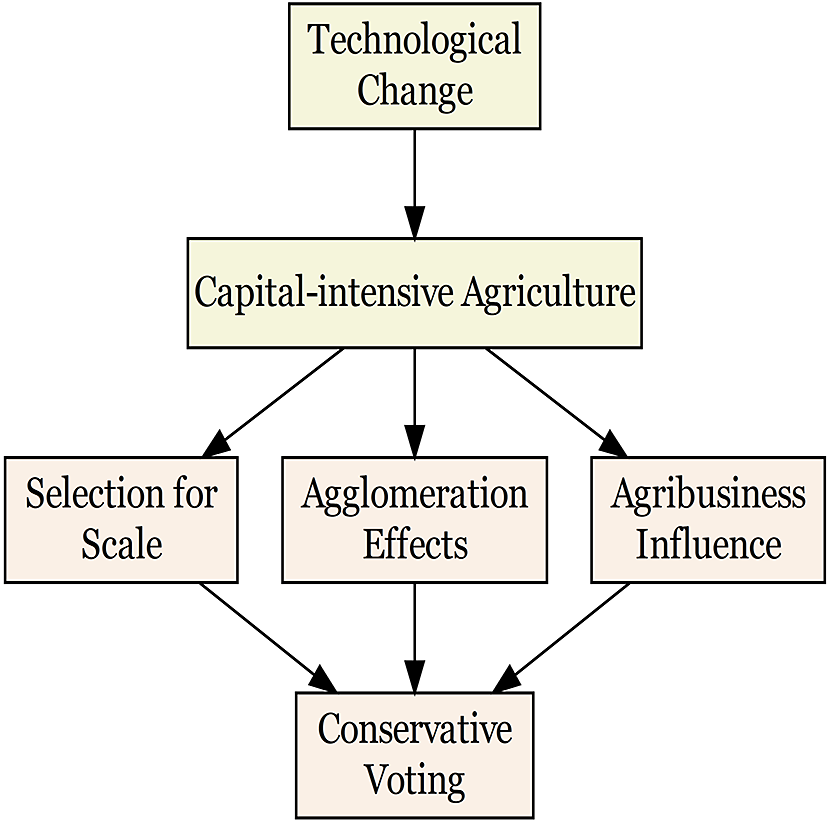
Selection for Scale
Until the post-war technological shock, farmers on the Great Plains were typically poor and precarious and struggled to make a living on homesteads located on marginal and arid lands suitable mainly for dryland farming. Poor and indebted homesteaders represented a major source of support for the Populist Party (Ostler Reference Ostler1993). They were also important beneficiaries of the system of agricultural safety nets implemented in exchange for production controls enacted by the Agricultural Adjustment Act (AAA) of 1933, which granted the federal government the authority to “secure voluntary reduction of the acreage of basic crops … and to direct payments for participation in acreage control programs” as well as to license, regulate, and tax agricultural activities. In the process of policymaking politics, this legislation mobilized farmers into politics, giving rise to the “farm lobby,” the influence of which historically spanned both major American political parties (Finegold and Skocpol Reference Finegold and Skocpol1995; Hansen Reference Hansen1991; Sheingate Reference Sheingate2003), with both the Democratic and Republican Parties competing for the votes of farmers with bipartisan federal farm bills laden with subsidies.
However, as new irrigation technologies made agriculture more productive in areas with access to groundwater, they also pushed up capital costs. This led to the winnowing of small producers, who lacked the economies of scale needed to survive in an environment with increasing fixed costs of land, machinery, and inputs. In their place emerged increasingly capital-intensive, mechanized, and productive farms, operated by upwardly mobile farmers in a new form of business-like agriculture which came by the 1950s to be known as “agribusiness.” By the 1970s, according to agricultural censuses, the average market value of farms (inclusive of land, buildings, and machinery) across counties in the Great Plains reached over $1.5 million, up from around $200,000 in the 1930s (in 2016 dollars).
With increasing scale and wealth came a conservative shift in political attitudes among farmers—including opposition to government taxation and regulation—consistent with canonical theories of class-based voting. As farms became lucrative assets, protection of tax breaks, exclusion from estate taxes, write-offs, and deductions evolved into a major area of lobbying on the part of industry associations like the Farm Bureau. Large-scale farms also sought over time to reshape the farm subsidy system, seeking to delink subsidies from production controls—the lynchpin of the New Deal-era farm policies—in favor of a “market-oriented” regime linking subsidies to the quantity of a farm’s output, concentrating subsidies in the largest farms (Dimitri, Effland, and Conklin Reference Dimitri, Effland and Conklin2005; Sheingate Reference Sheingate2003).
The conservative shift in attitudes among farmers is documented by sociologists visiting Haskell County before and after the post-war irrigation technology shock. In the initial study of the county in 1940, Bell (Reference Bell1942) found a community that had been devastated by the Dust Bowl and Depression of the 1930s, and which suffered from a boom-and-bust pattern of wheat harvests due to volatile precipitation. This generated, he observed, a “gambler’s psychology” among local residents. Consistent with theories linking precarity to preferences for social insurance, a consequence was widespread belief in the legitimate role of government intervention to regulate and support the rural economy: “Everyone interviewed, whether in favor of or opposed to the Government farm program was unanimous in the opinion that, as one man said: ‘If it had not been for the Government program, none of us would be here now. We simply could not have made it’” (66).
When another sociologist revisited the county 25 years later, political attitudes had been transformed by the introduction of groundwater irrigation: “Farming had become agribusiness … The average size farm of 1200 acres represented a considerable capital outlay, and rising operating costs were all but eliminating the marginal farmer in 1965.” (Mays Reference Mays1968, 36). As farms were selected for scale—resulting in the outmigration of small farmers and consolidation of operations in the hands of farmers who remained—came a shift from a “gambler’s psychology” to a business-like belief in success linked to individual effort and increasing opposition to government intervention: “The [Haskell County farm operator] believes that he has won through to his present-day successes by virtue of his own efforts … if the government will remove its many controls, he can grow abundantly all that the country needs and receive good prices for his produce” (112).
Agglomeration Effects
Over time, industries downstream from capital-intensive agriculture also agglomerated on the Great Plains. Agglomeration effects describe “clusters” of economic activities that colocate due to complementarities (Delgado, Porter, and Stern Reference Delgado, Porter and Stern2016). In the case of the Great Plains, the spread of irrigation facilitated the cultivation of water-intensive feed grains, which led to the spatial agglomeration of cattle feedlots; the concentration of livestock, in turn, subsequently drew meatpacking plants to the region. More broadly, technological change attracted a “cluster” of interrelated industries with high levels of concentration due to extensive vertical integration and interlocking relationships. These transformations are described by Opie (Reference Opie2000, 268): “As irrigation brought prosperity to the High Plains, smaller farmers were pushed out of the way … the shift from the family farm toward large-scale centralized agribusiness operations can be compared to the demise of ‘ma-and-pa’ neighborhood grocery stores after World War Two as supermarkets became commonplace.”
Due to their intensive exploitation of natural resources and low-wage labor, agribusiness came into extensive conflict with government regulators. For instance, from the 1960s onward, as groundwater levels fell, landowners in the Great Plains lobbied to restrain government attempts to meter and regulate groundwater through groundwater management districts (Bessire Reference Bessire2021; Opie Reference Opie2000). Toxic waste-producing agribusiness sites like animal feedlots—a single feedlot can produce as much waste as a small town—came into conflict with government regulations under the Clean Air Act (enacted in 1963) and Clean Water Act (enacted in 1972). Meatpacking plants, which from the 1960s onward relocated from cities to small rural towns in part to cut labor costs, are well-known to oppose labor-friendly regulations, such as minimum wage laws, employer insurance obligations, workplace safety laws, and union-friendly policies (Stull, Broadway, and Griffith Reference Stull, Broadway and Griffith1995).
The historical emergence of a rural anti-regulatory orientation included not just land and business owners but was plausibly transmitted from agribusiness to the wider rural communities that came to depend upon it for wealth generation. Though technological change, the spread of capital-intensive agriculture, and the agglomeration of agricultural industries gave rise to rural stratification, it also entrenched the dependency of rural communities on the agribusiness economy.Footnote 2 This gave agribusiness “structural power” in communities that depended upon it for jobs, tax revenue, and wealth creation (Lindblom Reference Lindblom1977).Footnote 3 Middle-class rural residents and public officials came to indirectly equate their personal interests and the well-being of their communities with the profitability of agribusiness, especially in a broader context where good-paying jobs were increasingly relocating to cities.
The “structural” power of agribusiness is documented in the evolution of politics in Haskell County. In Bell’s (Reference Bell1942) initial study, Haskell County was purely a farming community: “Agriculture dominates [the entire populace’s] existence and influences their attitudes in much the way that mining does a village in which the whole population derives its living from the mine” (55). When Mays (Reference Mays1968) revisited Haskell County, he found that irrigation had led to economic diversification, but that these industries were seen as just as important to their communities’ fortunes as farming: “Leaders and businessmen of the several towns are very much aware of the fact that the coming of industry to the area helped to save their towns from experiencing a slow death as trade and business centers” (65–6). When sociologists revisited the county 30 years later in 1993, they noted the emergence of factory-style industries like feedlots and meatpacking plants. They also documented a pervasive skepticism of government that is characteristic of contemporary rural consciousness (Cramer Reference Cramer2016): “When asked about the problems facing their community, the two most frequently mentioned issues were increasing taxation and the loss of local control to the state and federal governments” (Williams and Bloomquist Reference Williams and Bloomquist1996, 27).
Agribusiness Influence
A final channel linking technological change to a conservative shift in voting is the organized influence of agribusiness interests on local politics. Agribusiness interests are highly organized through industry associations like the Farm Bureau and commodity-specific producer associations. Not only do these associations influence rural public opinion by circulating mailers, organizing events, and endorsing candidates, they are also major suppliers of campaign finance, disproportionately provided to conservative candidates who align with their anti-regulatory orientation (for instance, giving a total of $61 million in the 2000 presidential cycle—compared to $21 million from energy/natural resources or $41 million from organized labor—75% of which went to the Republican Party).Footnote 4 In the Supplementary material, we provide descriptive evidence that campaign contributions originating in counties located within the boundaries of the Ogallala Aquifer, where agribusiness thrives, have a systematically conservative bias compared to campaign contributions originating outside of the aquifer.
Beyond the effects of money in politics, affluent land and business owners also represent an influential rural “power elite” that supplies a large share of the leadership in rural institutions ranging from churches to school boards to county governments, playing a powerful agenda-setting role. The influence of elite land and business owners may account for why rural voters, even those who are not themselves affluent, have moved rightward on “culture war” issues related to race, sexuality, and religion—by emphasizing issues that “bind” rich and poor white rural residents relative to an imaginary urban outgroup, conservative political entrepreneurs diminish the salience of potential class-based conflicts.
By contrast, a labor movement failed to take root in areas of capital-intensive agriculture despite rising inequality. This is in part because much of this labor was comprised of seasonal and Latino workers, with minimal residential stability or political rights (Bessire Reference Bessire2021). Moreover, as farms and agricultural industries increased in scale and became increasingly reliant on hired labor, they also took active efforts to prevent labor organizing, for instance through advocacy for right-to-work laws (enacted in seven out of 10 Great Plains states between the 1950 and 1990s). As a result, low-wage farm and factory workers in the Great Plains have been completely un-unionized (Stull, Broadway, and Griffith Reference Stull, Broadway and Griffith1995).
Some of these dynamics are evidenced in the evolution of politics in Haskell County. In the initial study, Bell (Reference Bell1942) found a county with a relatively flat social structure and without a clear-cut political elite. Twenty-five years later, Mays (Reference Mays1968) found a far more stratified social structure in which affluent farmers dominated politically: “When asked who the leaders were, the ordinary citizens would recite eight or nine names who had been long-time residents of the county. All of them, without exception, came from the big farmers of the region and most of them had held office at one time or another” (119). White residents viewed the migratory labor on which they relied, by contrast, with hostility: “‘We certainly don’t like them’, said a resident of Sublette [the county seat]. ‘Mexicans as migrant workers come in for a few weeks each summer … those who allow them to work … must assume responsibility for any damage they may cause’” (64). By contrast, the (white) wider community had internalized the up-by-the-bootstraps narrative of landowners, dispensing with the “gambler’s psychology” that attributed life outcomes primarily to chance that Bell (Reference Bell1942) had observed 25 years earlier: “The population now accepts as their ideal-type the farmer-capitalist, or agri-businessman, who has won out against great odds” (Mays Reference Mays1968, 112).
Empirical Implications
As the conservative party on the economic dimension of political party competition in the US (Poole and Rosenthal Reference Poole and Rosenthal2000), the Republican Party’s pro-business orientation made it the electoral beneficiary of the spread of capital-intensive agriculture and the conservative transformation of rural political preferences. By contrast, the Democratic Party’s association with pro-labor and environmental regulation as well as redistributive taxation made it a comparative threat to agribusiness interests. These differences in party platforms have existed for at least a century but have hardened over time, especially since the Republican Party’s embrace of a hardline anti-regulation stance during the 1980s, as well as the spatial polarization of the Republican and Democratic Parties into rural- and urban-centered political coalitions, respectively (Hacker and Pierson Reference Hacker and Pierson2010; Rodden Reference Rodden2019).
Long-term technological change, the growing power of agribusiness, and an increasingly conservative political orientation are trends that have characterized not just the Great Plains but the overall trajectory of the rural sector, ranging from California’s Central Valley to the American Midwest (see, e.g., Anderson Reference Anderson2009; Cramer Reference Cramer2016; Olmsted Reference Olmsted2010; Rodden Reference Rodden2019). Yet, isolating the causal effect of technological change is difficult, due to the complex and endogenous nature of these macro-level processes. For this reason, we focus on a natural experiment that compares areas more or less exposed to a specific post-war irrigation technology shock, enabling us to isolate the causal effect of how new technologies affected politics in the localities more exposed to that shock. In this context, the central observable implication of the argument is that areas more exposed to the post-war irrigation technology shock became more conservative (pro-Republican) in their voting patterns over time.
In terms of mechanisms, this was because, we argue, exposure to the post-war shock increased the capital intensity of agriculture and led to growth in the power of agribusiness interests in those areas. If this is correct, we should observe in counties more exposed to the post-war technology shock a relative increase in the capital intensity of agriculture, which we operationalize in terms of the capital costs of machinery and density and market value of farms. We should also observe an increase in the “structural power” of agribusiness, operationalized in terms of the farm share of employment as well as measures of crop and livestock output intended to proxy for the agglomeration of agricultural industries like feedlots and meatpacking plants. Finally, if agribusiness exerted political influence on the mass public through its structural power as well as its organized influence on elections and political life in rural areas, we should also expect to observe greater opposition to government taxation and regulation—as well as potential differences in other rural unifying “culture war” issues—not only among rural elites but also as reflected in mass policy preferences.Footnote 5
EMPIRICAL STRATEGY
To test for the impact of the technological change on the rise of conservative voting in the Great Plains, this paper exploits the differential impact of the post-war irrigation technology shock across counties with different degrees of overlap with the Ogallala Aquifer, an approximately 174,000-square-mile body of groundwater that underlies parts of Colorado, Kansas, Nebraska, New Mexico, Oklahoma, South Dakota, Texas, and Wyoming.Footnote 6 The differential impact of the post-war technology shock is evidenced in a number of ways, for instance in large differences in the capitalized market value of farmland with and without access to the Ogallala Aquifer (Hornbeck and Keskin Reference Hornbeck and Keskin2014).
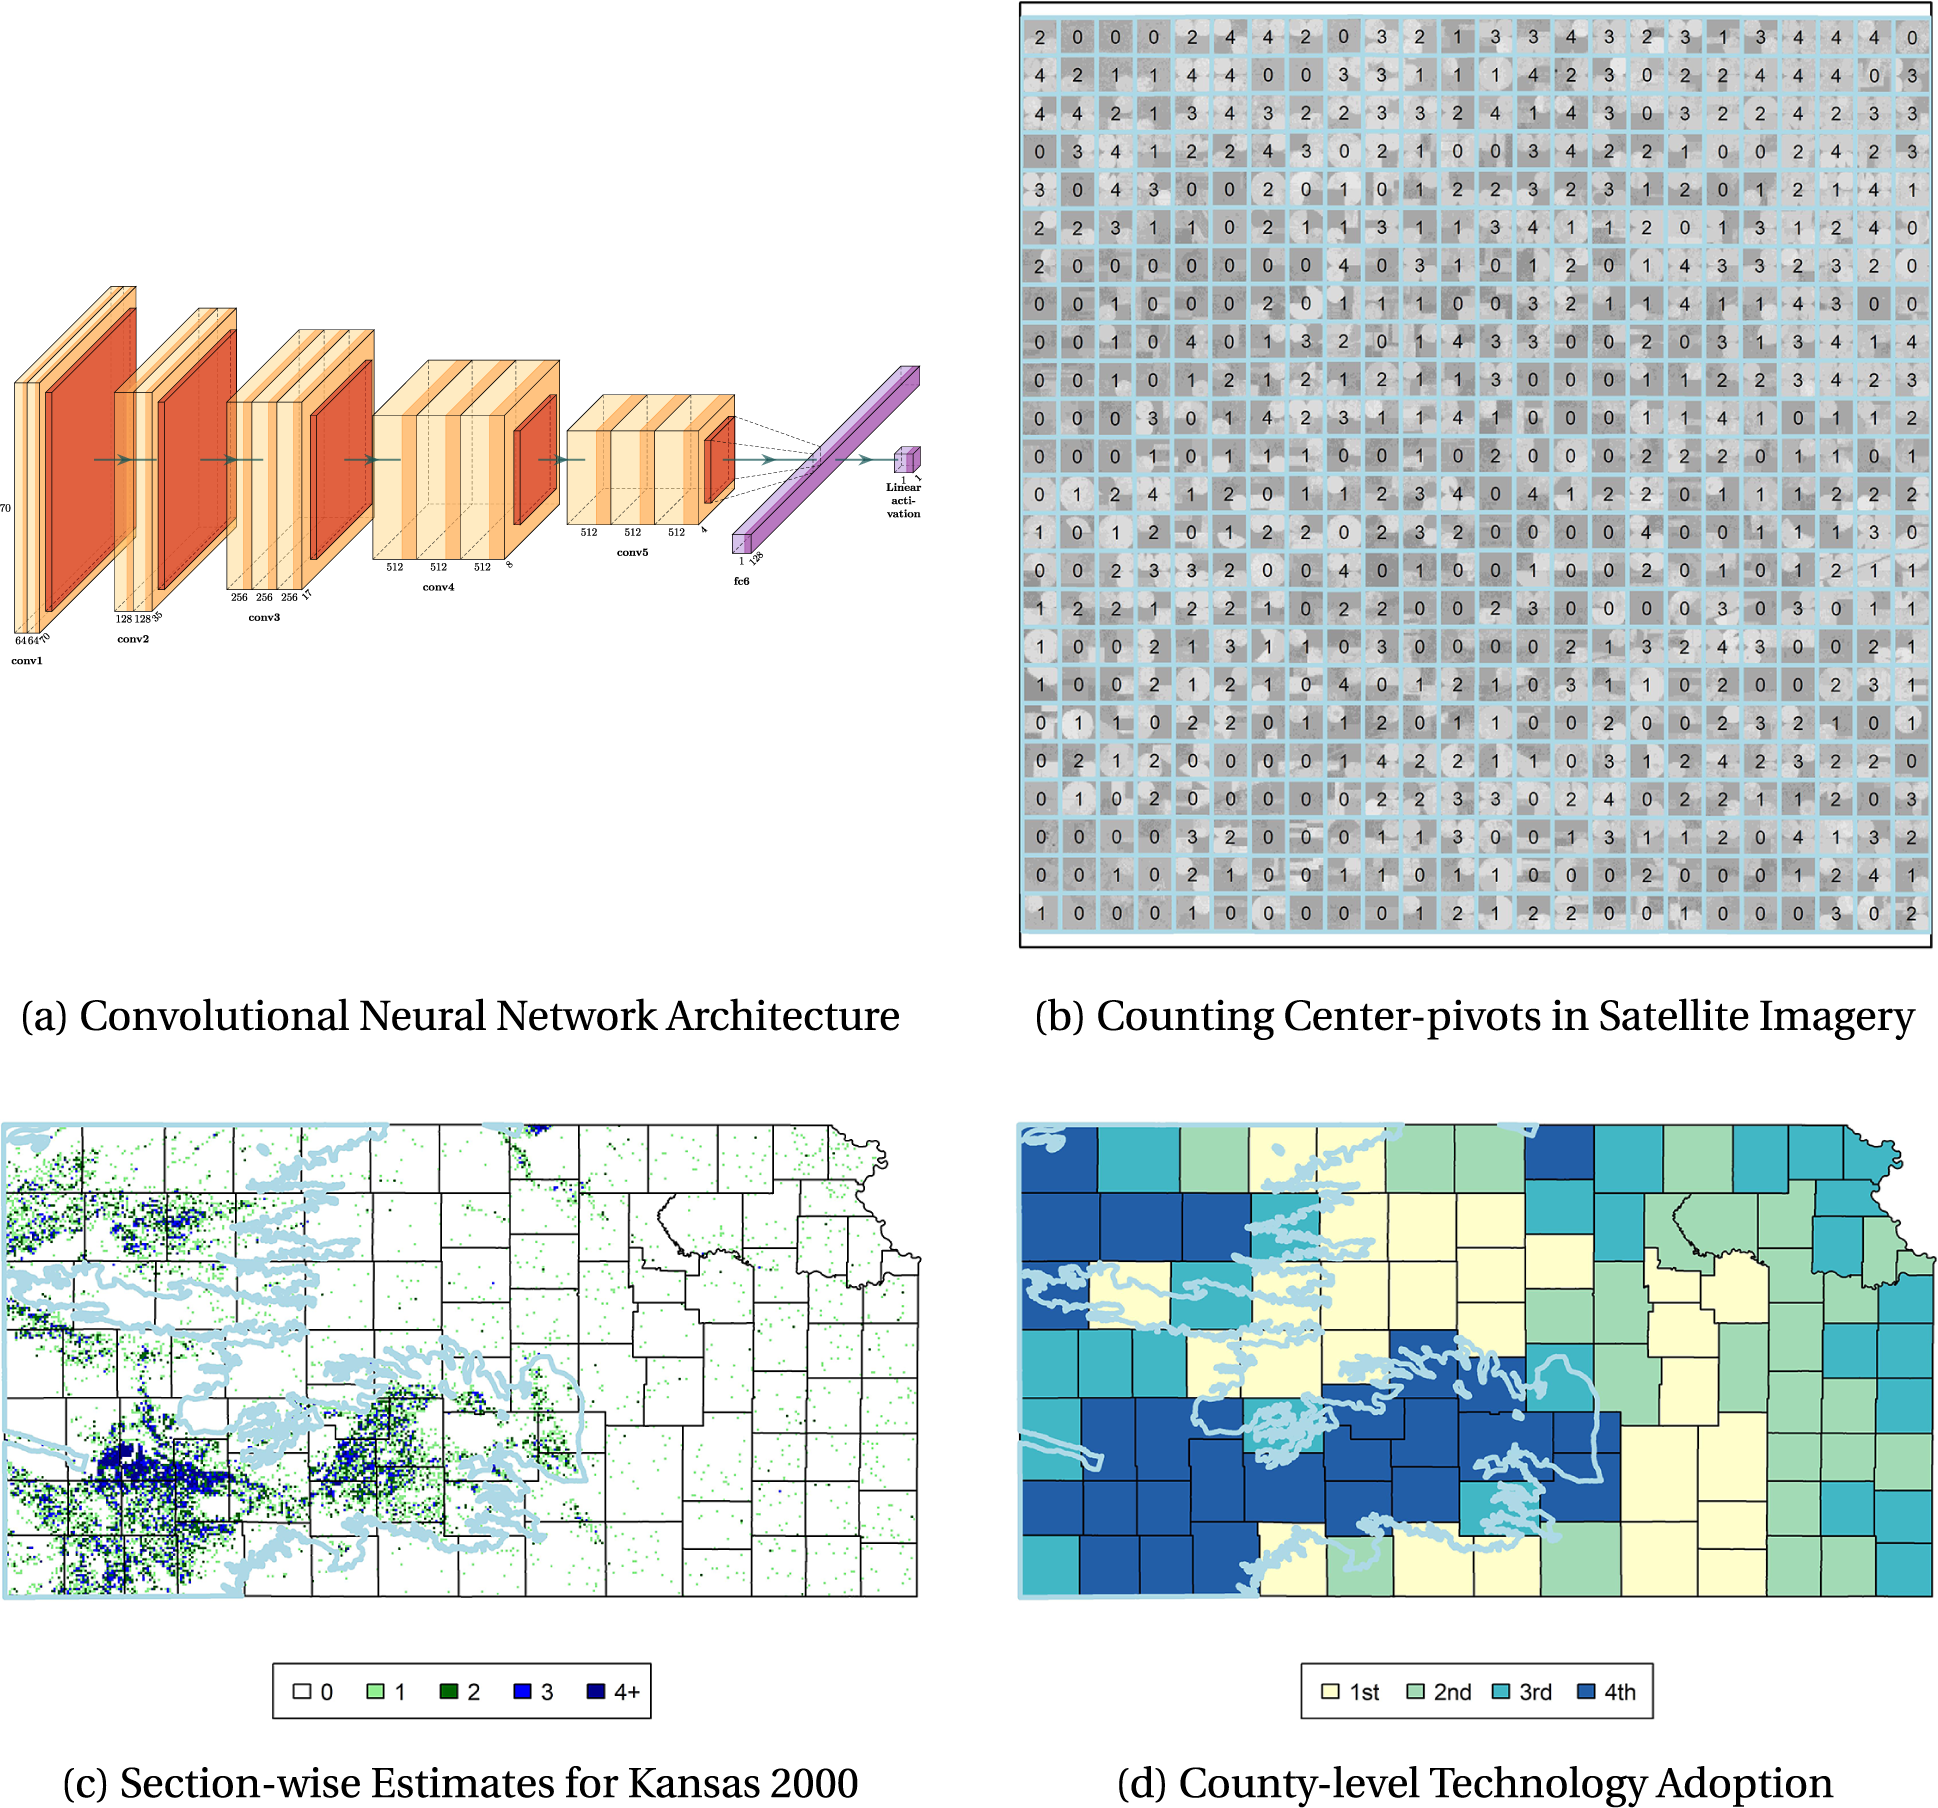
To validate this source of variation in exposure to technological change that underpins our empirical strategy, we develop estimates of the diffusion of center-pivot irrigation, using tools from the field of computer vision to develop remote-sensing measures of the technology’s signature circular cropping patterns in Landsat imagery. A detailed discussion is provided in the Supplementary material. In brief, we train a CNN to count the number of center-pivot irrigation circles observable in Landsat satellite imagery across counties in the Great Plains. CNNs are supervised learning algorithms that take images as input and as output make predictions about image characteristics, in our case an estimate of the number of visible center-pivots in a given image.
We train a CNN to take as input the $ 70\times 70 $
pixel Landsat 5 satellite image of a Public Land Survey System (PLSS) section—the 1 square mile unit of the grid that governs property rights in the western US—and as output estimate the number of center-pivot irrigation systems visible in the image. To train the model, we use a geo-coded database of center-pivot irrigation systems that was compiled through hand counting of crop circles in Landsat satellite imagery by a team of researchers for the state of Nebraska (Carlson Reference Carlson1989). We use these data to label the number of center-pivots in clipped Landsat 5 satellite images—from which we compute the normalized difference vegetation index (NDVI)—for all PLSS sections in Nebraska in each year between 1985 and 1987 (N
$ 70\times 70 $
pixel Landsat 5 satellite image of a Public Land Survey System (PLSS) section—the 1 square mile unit of the grid that governs property rights in the western US—and as output estimate the number of center-pivot irrigation systems visible in the image. To train the model, we use a geo-coded database of center-pivot irrigation systems that was compiled through hand counting of crop circles in Landsat satellite imagery by a team of researchers for the state of Nebraska (Carlson Reference Carlson1989). We use these data to label the number of center-pivots in clipped Landsat 5 satellite images—from which we compute the normalized difference vegetation index (NDVI)—for all PLSS sections in Nebraska in each year between 1985 and 1987 (N $ \approx \mathrm{220,000}\Big). $
With a 15-layer CNN trained on these data, we count center-pivot irrigation systems visible in satellite imagery in a massive number of PLSS sections across all of the Great Plains states for every year between 1985 and 2000 (N
$ \approx \mathrm{220,000}\Big). $
With a 15-layer CNN trained on these data, we count center-pivot irrigation systems visible in satellite imagery in a massive number of PLSS sections across all of the Great Plains states for every year between 1985 and 2000 (N $ \approx $
10 million), aggregating and normalizing by land area to get county-level estimates of technology adoption (center-pivots per 1,000 sq kilometers) with near-human accuracy (
$ \approx $
10 million), aggregating and normalizing by land area to get county-level estimates of technology adoption (center-pivots per 1,000 sq kilometers) with near-human accuracy ( $ {R}^2 $
of 0.94 in regressions of ground truth against our computer vision estimates in a test set). As Figure 3 illustrates in the case of Kansas, our procedure shows that center-pivot irrigation diffusion was heavily concentrated within the Ogallala Aquifer boundary (a pattern we subject to formal statistical tests for the entire Great Plains later in the paper).
$ {R}^2 $
of 0.94 in regressions of ground truth against our computer vision estimates in a test set). As Figure 3 illustrates in the case of Kansas, our procedure shows that center-pivot irrigation diffusion was heavily concentrated within the Ogallala Aquifer boundary (a pattern we subject to formal statistical tests for the entire Great Plains later in the paper).
Computer Vision Estimates of Technology Diffusion
Notes: See Supplementary material Section 2 for details of the procedure. Panel A depicts 15-layer CNN architecture that takes a 70 × 70 pixel image as input and makes a regression estimate of the number of center-pivots. Panel B depicts estimates of center-pivot irrigation by PLSS section (base layer is NDVI computed from Landsat 5 imagery) in Haskell County, Kansas, 2000 (total center-pivots counted is $ \approx $
813). Panel C depicts rounded estimates of center-pivot irrigation across all PLSS sections in Kansas in year 2000 (total center-pivots counted is
$ \approx $
813). Panel C depicts rounded estimates of center-pivot irrigation across all PLSS sections in Kansas in year 2000 (total center-pivots counted is $ \approx $
21662). Panel D depicts county-level quartile of center-pivots per 1000 sq km averaged between 1985 and 2000.
$ \approx $
21662). Panel D depicts county-level quartile of center-pivots per 1000 sq km averaged between 1985 and 2000.
These patterns of technology diffusion motivate the identification strategy, which exploits the timing of the post-war irrigation technology shock together with cross-sectional variation in groundwater availability in a spatially matched sample of counties along the boundary of the Ogallala Aquifer in a difference-in-differences framework. In the main specifications, the paper estimates ordinary least squares (OLS) regressions of the form,
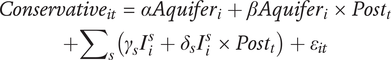 $$ {\displaystyle \begin{array}{c}{Conservative}_{it}=\alpha Aquife{r}_i+\beta Aquife{r}_i\times Pos{t}_t\\ {}+{\sum}_s\left({\gamma}_s{I}_i^s+{\delta}_s{I}_i^s\times Pos{t}_t\right)+{\varepsilon}_{it}\end{array}} $$
where the outcome variable $ {Conservative}_{it} $
is the Republican Party’s share of the two-party vote in presidential, senatorial, or gubernatorial elections in county
$ {Conservative}_{it} $
is the Republican Party’s share of the two-party vote in presidential, senatorial, or gubernatorial elections in county $ i $
and time period
$ i $
and time period $ t $
(a pre-shock period averaging between 1920 and 1940 and a post-shock period averaging between 1980 and 2000).Footnote 7 These data come from Amlani and Algara (Reference Amlani and Algara2021). In the equation, the variable
$ t $
(a pre-shock period averaging between 1920 and 1940 and a post-shock period averaging between 1980 and 2000).Footnote 7 These data come from Amlani and Algara (Reference Amlani and Algara2021). In the equation, the variable $ Aquife{r}_i $
represents the share of county land overlying the Ogallala Aquifer, which is computed using GIS analysis of shapefiles of county boundaries and a digital map of the aquifer’s boundary from the US Geological Survey (Qi Reference Qi2010). The variable
$ Aquife{r}_i $
represents the share of county land overlying the Ogallala Aquifer, which is computed using GIS analysis of shapefiles of county boundaries and a digital map of the aquifer’s boundary from the US Geological Survey (Qi Reference Qi2010). The variable $ Pos{t}_t $
is a time dummy variable that takes a value of one for the post-shock period and zero otherwise. All specifications control for state-period fixed effects
$ Pos{t}_t $
is a time dummy variable that takes a value of one for the post-shock period and zero otherwise. All specifications control for state-period fixed effects $ {\sum}_s\left({\gamma}_s{I}_i^s+{\delta}_s{I}_i^s\times Pos{t}_t\right) $
. This means that the coefficient
$ {\sum}_s\left({\gamma}_s{I}_i^s+{\delta}_s{I}_i^s\times Pos{t}_t\right) $
. This means that the coefficient $ \beta $
represents a pooled estimate of the change in conservative voting from the pre- to the post-shock period, comparing across counties with more versus less aquifer coverage within the same state. This is identical to estimating a difference-in-differences regression separately for each state and then constructing a weighted average of the estimated effects.Footnote 8
$ \beta $
represents a pooled estimate of the change in conservative voting from the pre- to the post-shock period, comparing across counties with more versus less aquifer coverage within the same state. This is identical to estimating a difference-in-differences regression separately for each state and then constructing a weighted average of the estimated effects.Footnote 8
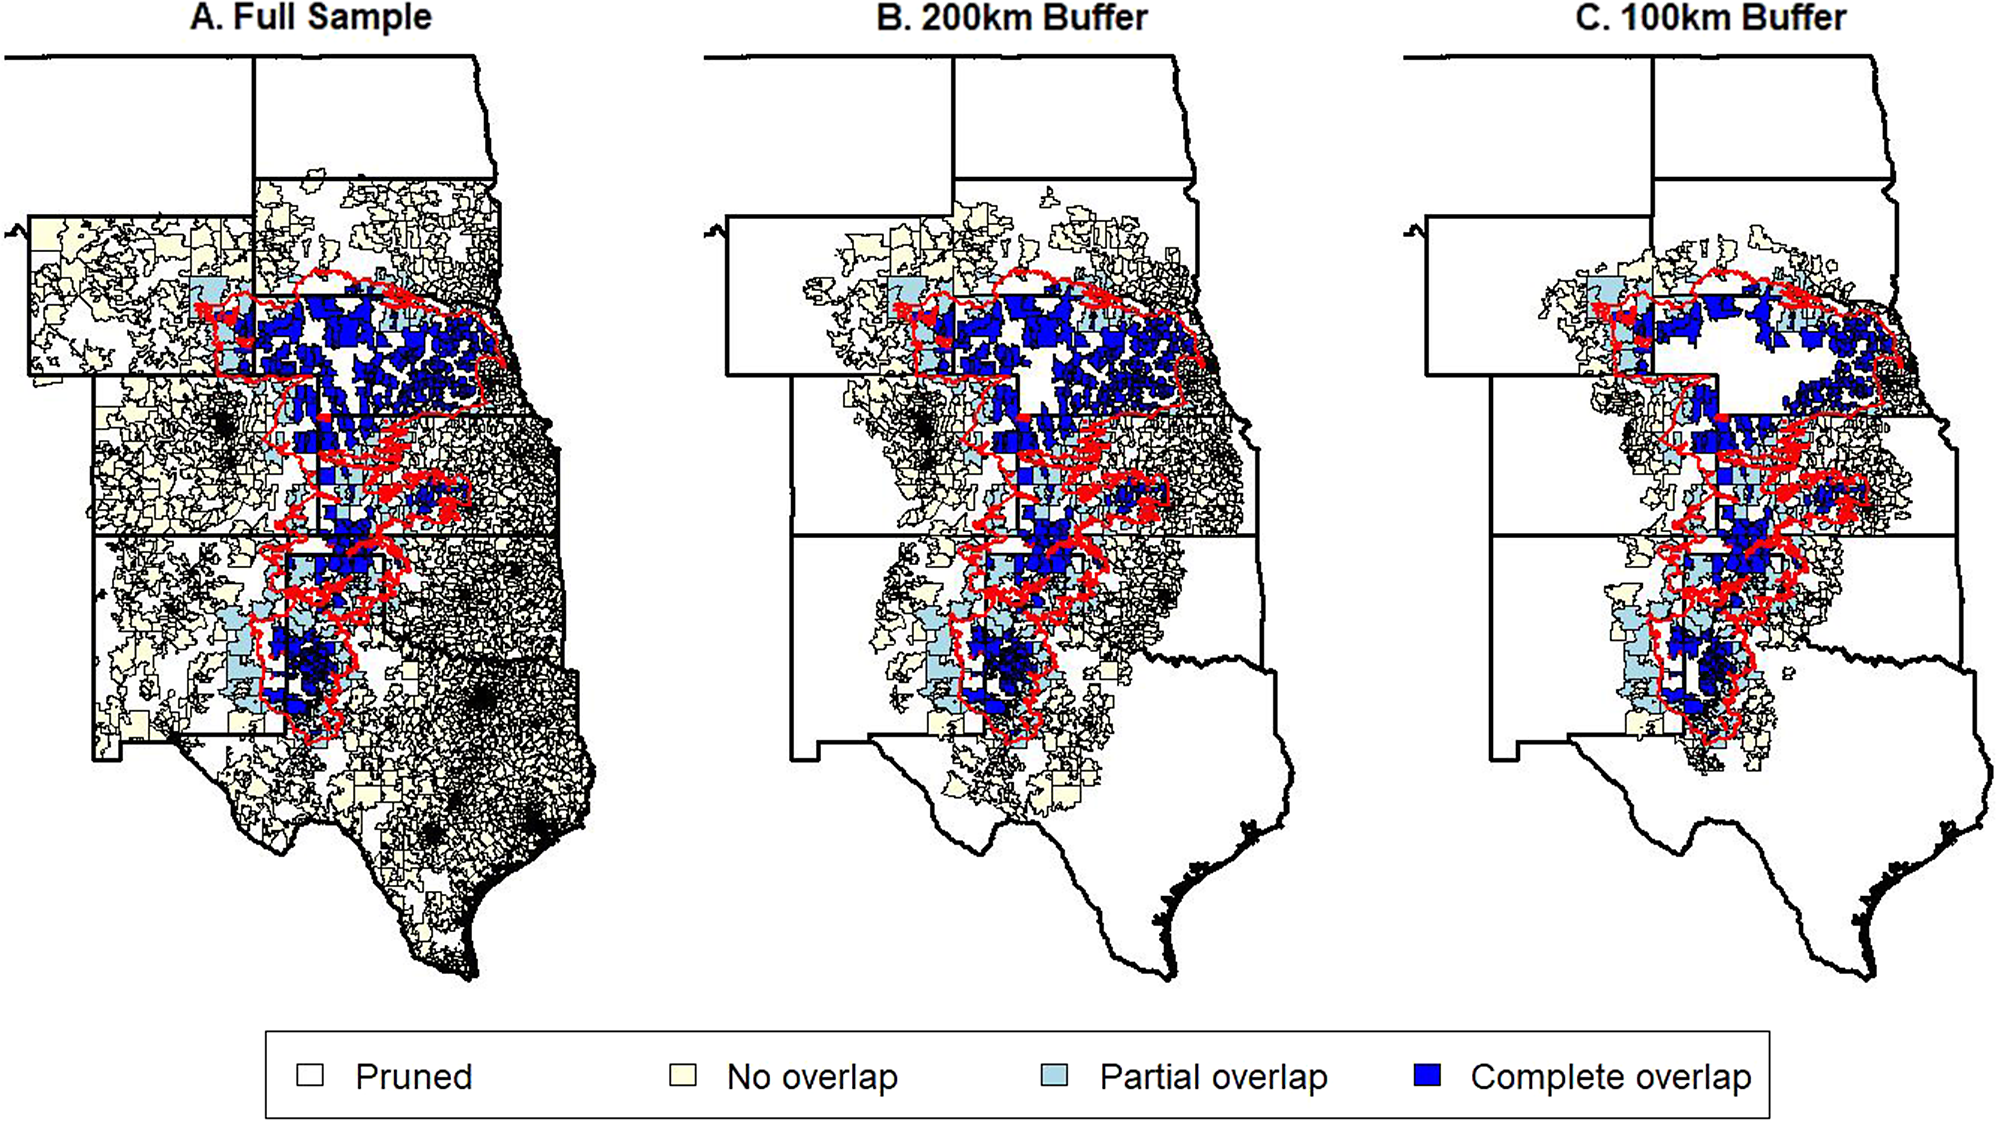
The within-state difference-in-differences design ensures that estimates are driven by over-time comparisons between counties located within the same state over time, ruling out potentially confounding state-specific shocks (for instance, ensuring that the outcome, conservative voting, is measured from the same state-specific senatorial and gubernatorial races). For further robustness, we implement the difference-in-differences design in a spatially matched sample of counties along the boundary of the Ogallala Aquifer. To implement the spatial matching in a manner that preserves the within-state design, we: i) identify the line segment of the Ogallala Aquifer boundary intersecting each state; ii) compute the geodesic distance of each county centroid to the nearest point on the within-state line segment; and iii) prune from the sample any counties beyond a given buffer (200 or 100 kilometers) based on this distance metric. This ensures that all estimates are derived from over-time comparisons between spatially proximate counties along the border of the Ogallala Aquifer within the same state.
By limiting analysis to spatially proximate counties, we mitigate concerns about potentially confounding nonparallel trends that may result from comparing dissimilar counties that are located far away from each other. However, another concern that arises is spatial spillovers—exposure to the technological shock potentially impacts the economies and electoral outcomes of nearby counties. To address this concern, in some specifications we prune counties on the boundary itself, so that the sample is restricted to “pure” treatment (completely within the aquifer) and control (completely outside of the aquifer) counties with the buffer layer of partially intersecting counties in between and most at risk for spillovers pruned from the sample. Figure 4 depicts a comparison of the counties that are included in the full sample and those that are included in the spatially matched samples.
Spatial Matching
Notes: Panels depict counties included in different spatially matched samples of counties. Counties shaded by degree of aquifer coverage.
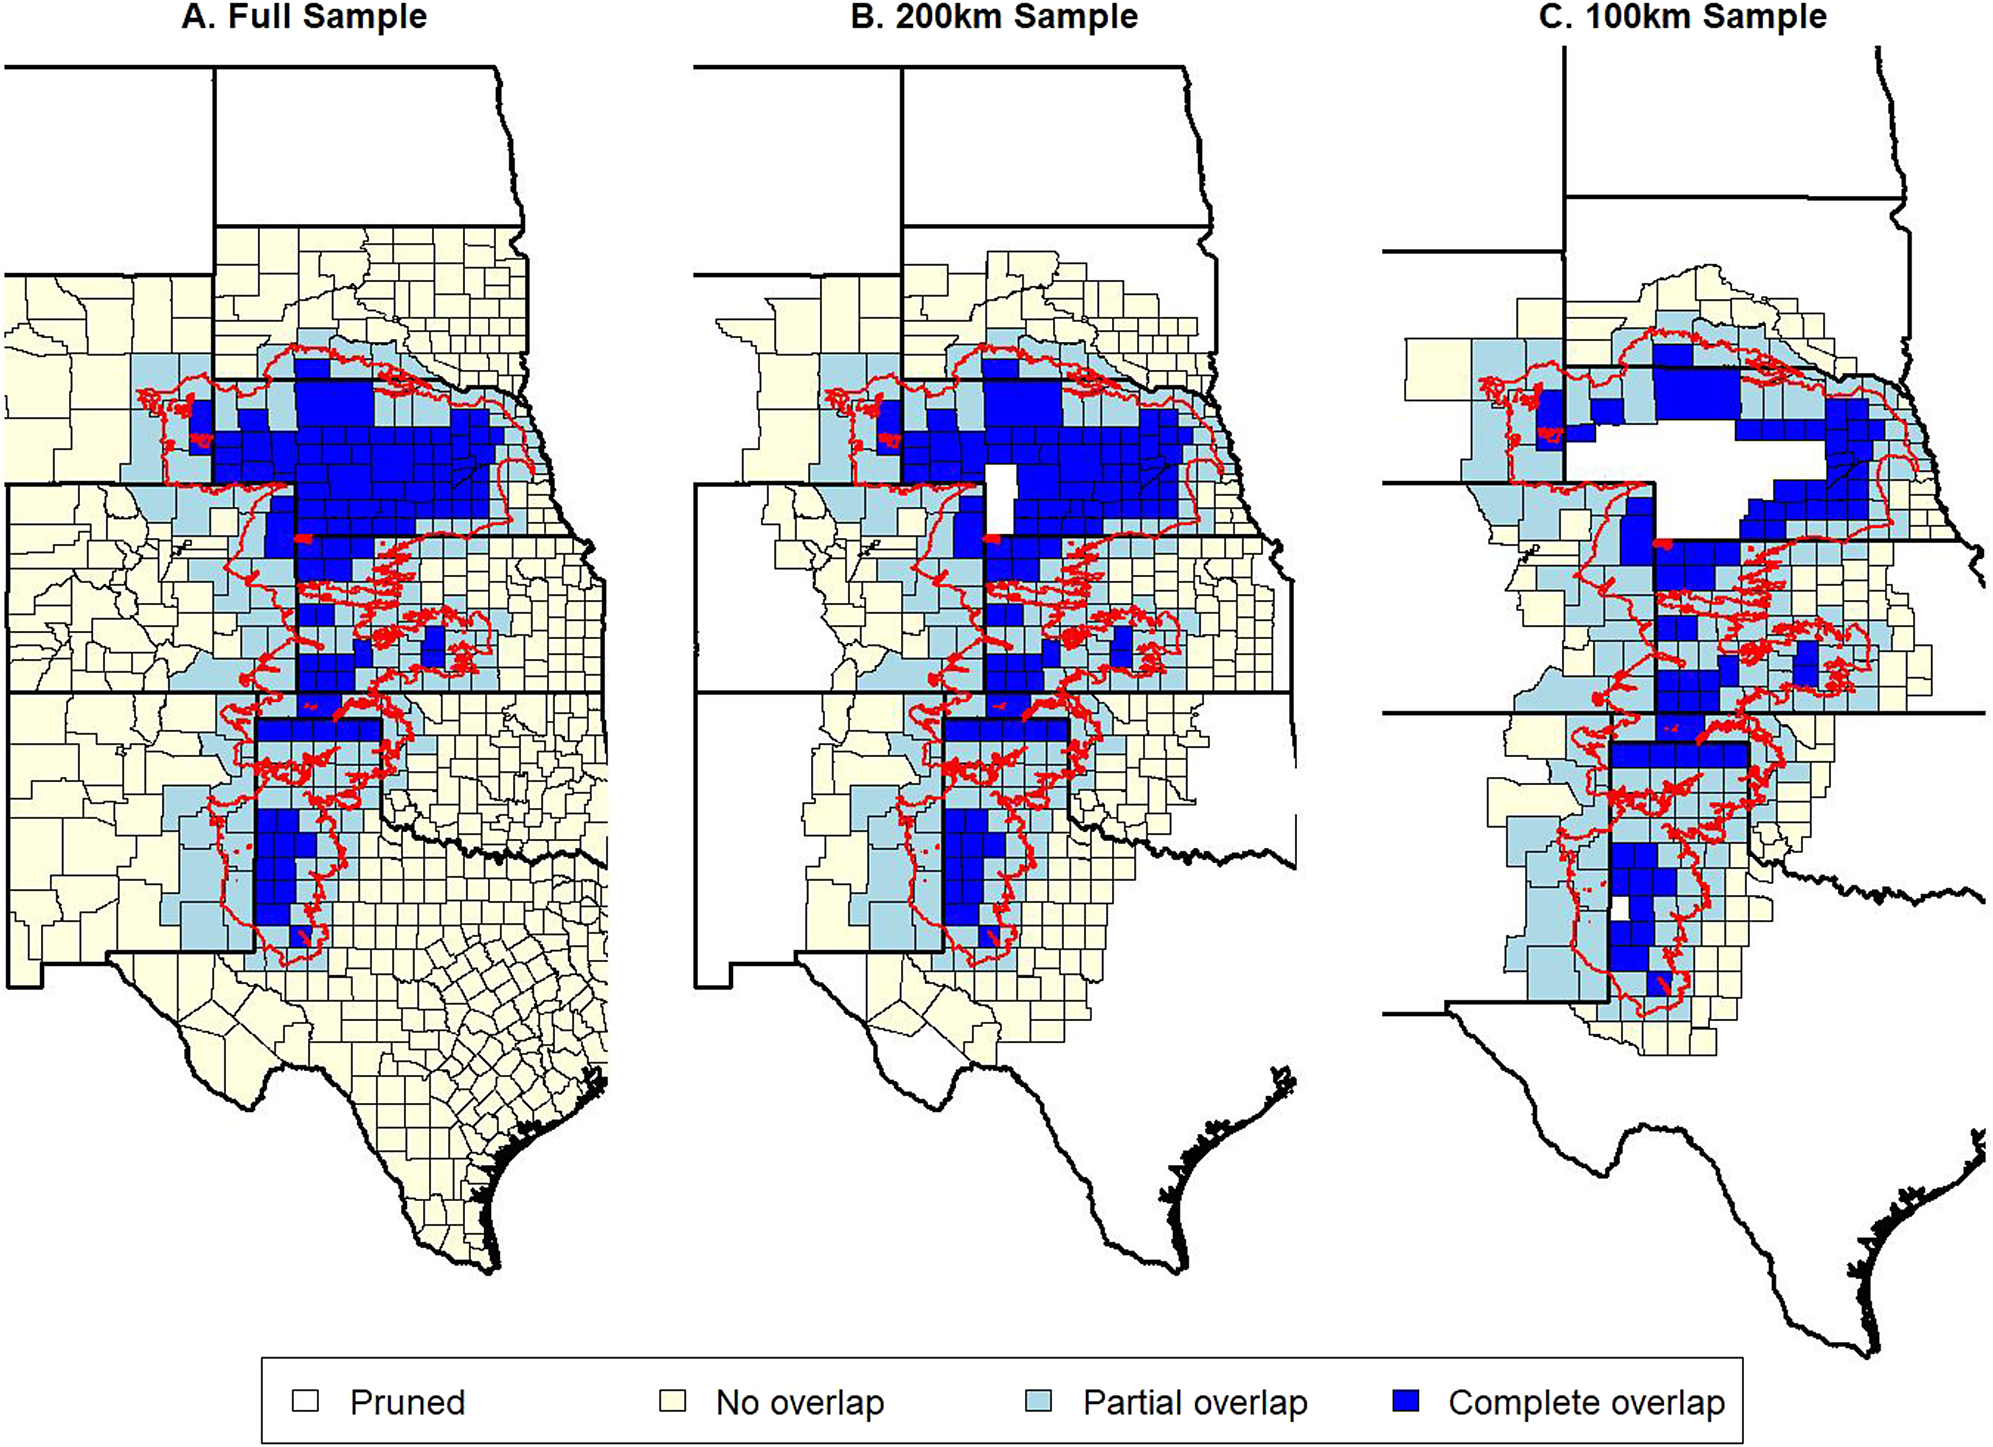
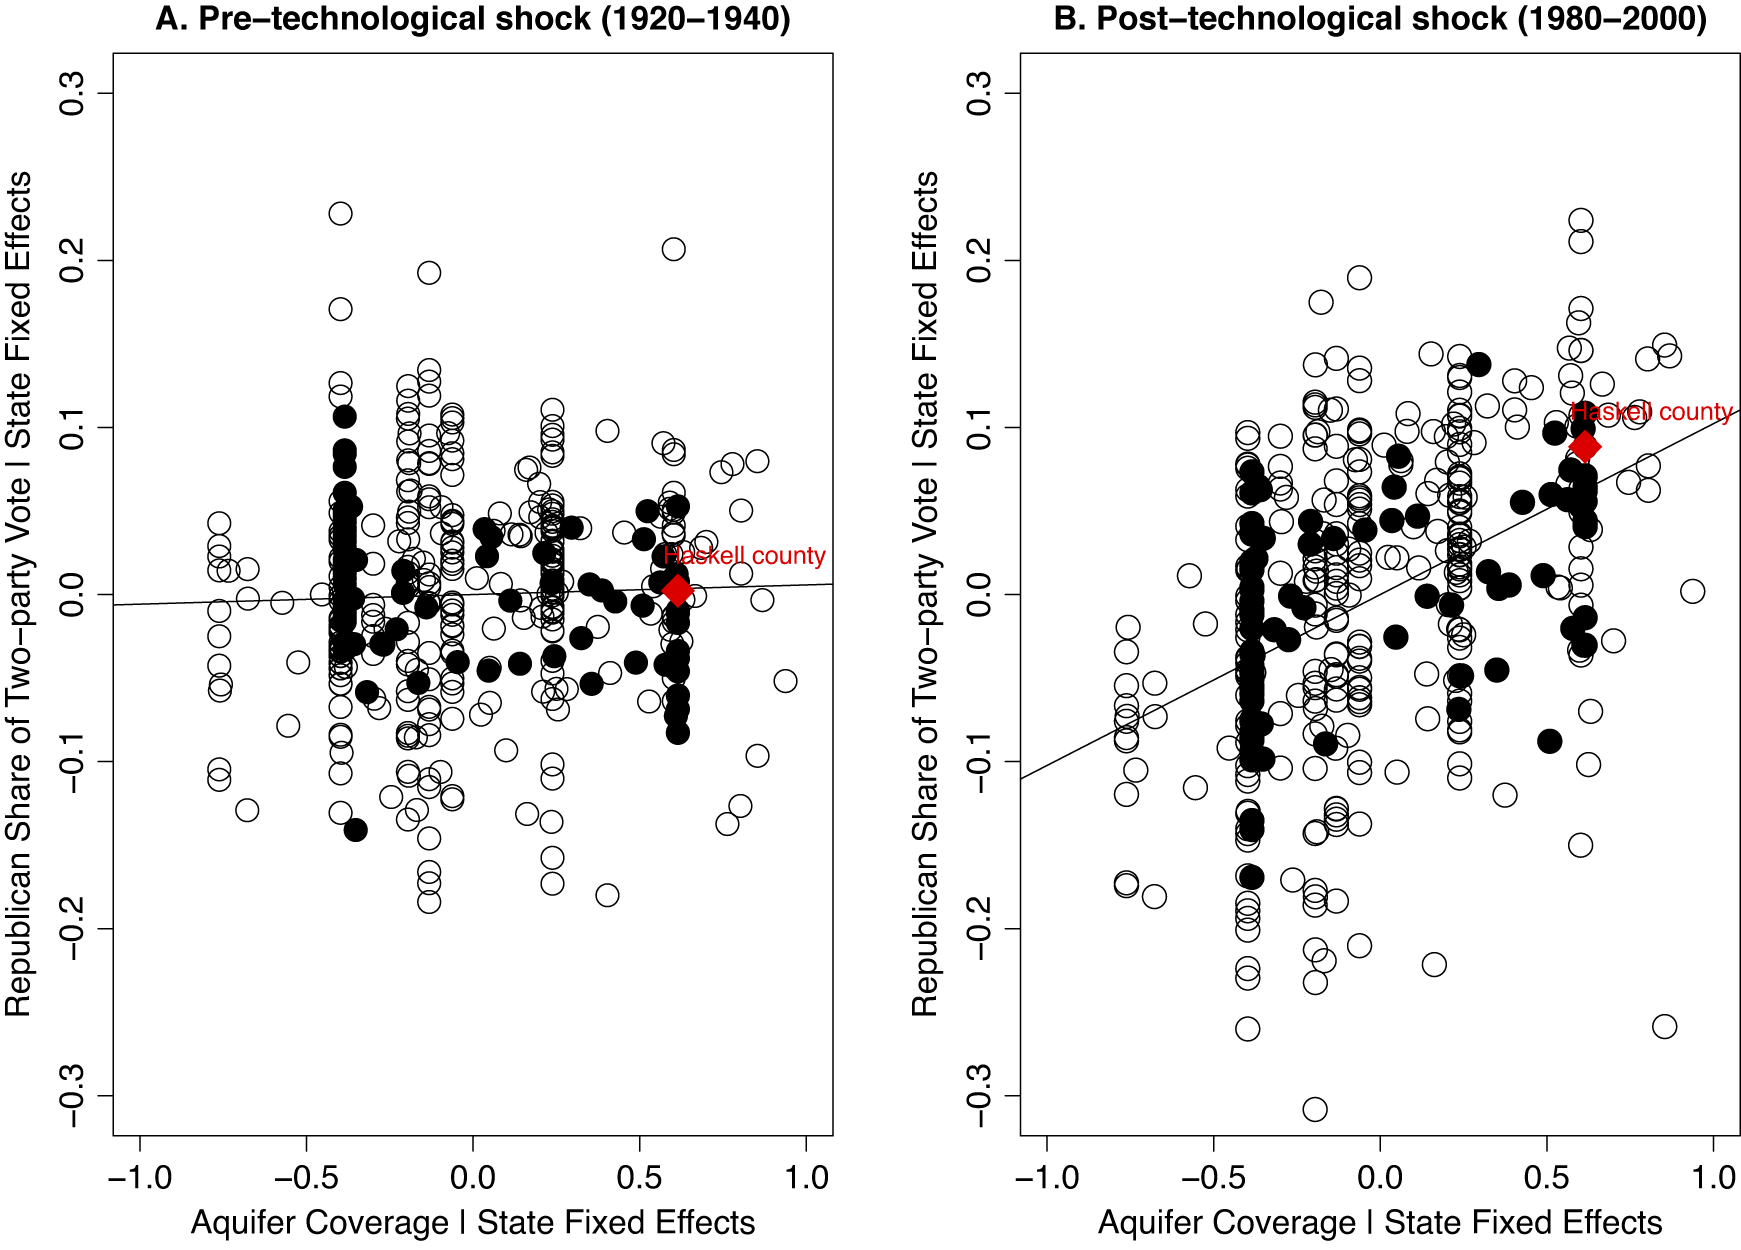
Figure 5 provides a scatter plot representing the intuition behind the empirical strategy. Panel A depicts the relationship between aquifer coverage and conservative voting across counties within 200 km of the Ogallala Aquifer boundary in the pre-technological shock period, after partialing out state fixed effects. For illustrative purposes, Kansas counties are represented with shaded points. We highlight the point that corresponds to Haskell County with a red diamond. As the scatter plot and fitted OLS regression line make clear, there was little association between aquifer coverage and the Republican Party’s share of the two-party presidential vote in the pre-shock period 1920–1940. A county like Haskell, which lies completely within the boundaries of the Ogallala Aquifer, was no more conservative in its voting patterns than other counties in the same state with less overlap with the Ogallala Aquifer. Panel B depicts the same relationship in the post-shock period 1980–2000. As the scatterplot and fitted OLS regression line illustrate, counties like Haskell with greater aquifer coverage experienced a larger improvement in the Republican Party’s electoral performance compared to counties with less aquifer coverage, plausibly because they were more exposed to the post-war irrigation technology shock that transformed the Great Plains.
Aquifer Coverage and Conservative Voting Before and After Technological Shock
Notes: Unit of analysis is the county (200-km buffer zone sample). Shaded points correspond to counties in Kansas. Panel A and B depict residual correlation between county-level aquifer coverage and the Republican share of the two-party vote in presidential elections after partialing out state fixed effects in the pre-shock (1920–1940) and post-shock (1980–2000) periods, respectively.
The identifying assumption in difference-in-differences designs is the parallel trends assumption, which assumes that, counter-factually absent the post-war irrigation technology shock, counties with greater overlap with the Ogallala Aquifer would have followed parallel electoral trends over time as compared to other spatially proximate counties within the same state with less overlap. In an additional set of specifications, to study pre- and post-technological shock time trends, this paper estimates regressions on a full county-election year panel dataset which flexibly interacts the aquifer coverage variable with decadal dummy variables, while also controlling for state-year effects. If the parallel trends assumption is valid, then there should have been no trend in the association between aquifer coverage and conservative voting in the decades preceding the technological shock but a large and positive relationship that emerged in the decades following the technological shock.
Several major events impacted the Great Plains around the technological shock under study—namely the Dust Bowl and Depression, the New Deal, World War II, as well as the racial realignment of the US South. If their impact was common across counties with more or less aquifer coverage in a state, they are not a source of bias (their impacts are absorbed by the state-year fixed effects). However, we also address potential nonparallel trends across counties by controlling for measures of county-level exposure to these events, both as lower-order terms as well as in interaction with time. These include: i) a measure of county-level wind erosion based on share of county land impacted by “severe wind erosion” according to a SCS map published in 1937 (see Supplementary material for details); ii) a measure of New Deal exposure based on a measure of spending across major programs per capita based on the dataset assembled by Fishback, Horrace, and Kantor (Reference Fishback, Horrace and Kantor2005); iii) a measure of drought intensity computed in terms of the share of months between 1930 and 1936 in which a county had a Palmer index score of less than negative three computed from historical gridded monthly raster data from National Oceanic and Atmospheric Administration (NOAA); iv) a measure of the number of county-level enlistments in World War II; v) a measure of white share of the population as of the 1940 census; and vi) a measure of residential stability/migratory turnover in terms of the share of respondents in the full count 1940 census indicating that they had resided in the same house 5 year prior.
To account for correlation of errors within counties over time, as well as correlation of errors across space in a given election, we estimate standard errors adjusted for two-way clustering within counties and within state-periods. Throughout, we limit the sample to counties (93% of the sample) with stable boundaries between the start year of 1920 and the end year of 2000 (the preceding decades of the 1900s and 1910s were characterized by a large number of boundary changes, including the admission of New Mexico and Oklahoma as new states). We drop counties in Montana and North Dakota as they do not intersect with the Ogallala Aquifer and therefore do not contribute to estimation because they would be fully absorbed by state-period fixed effects.
MAIN RESULTS
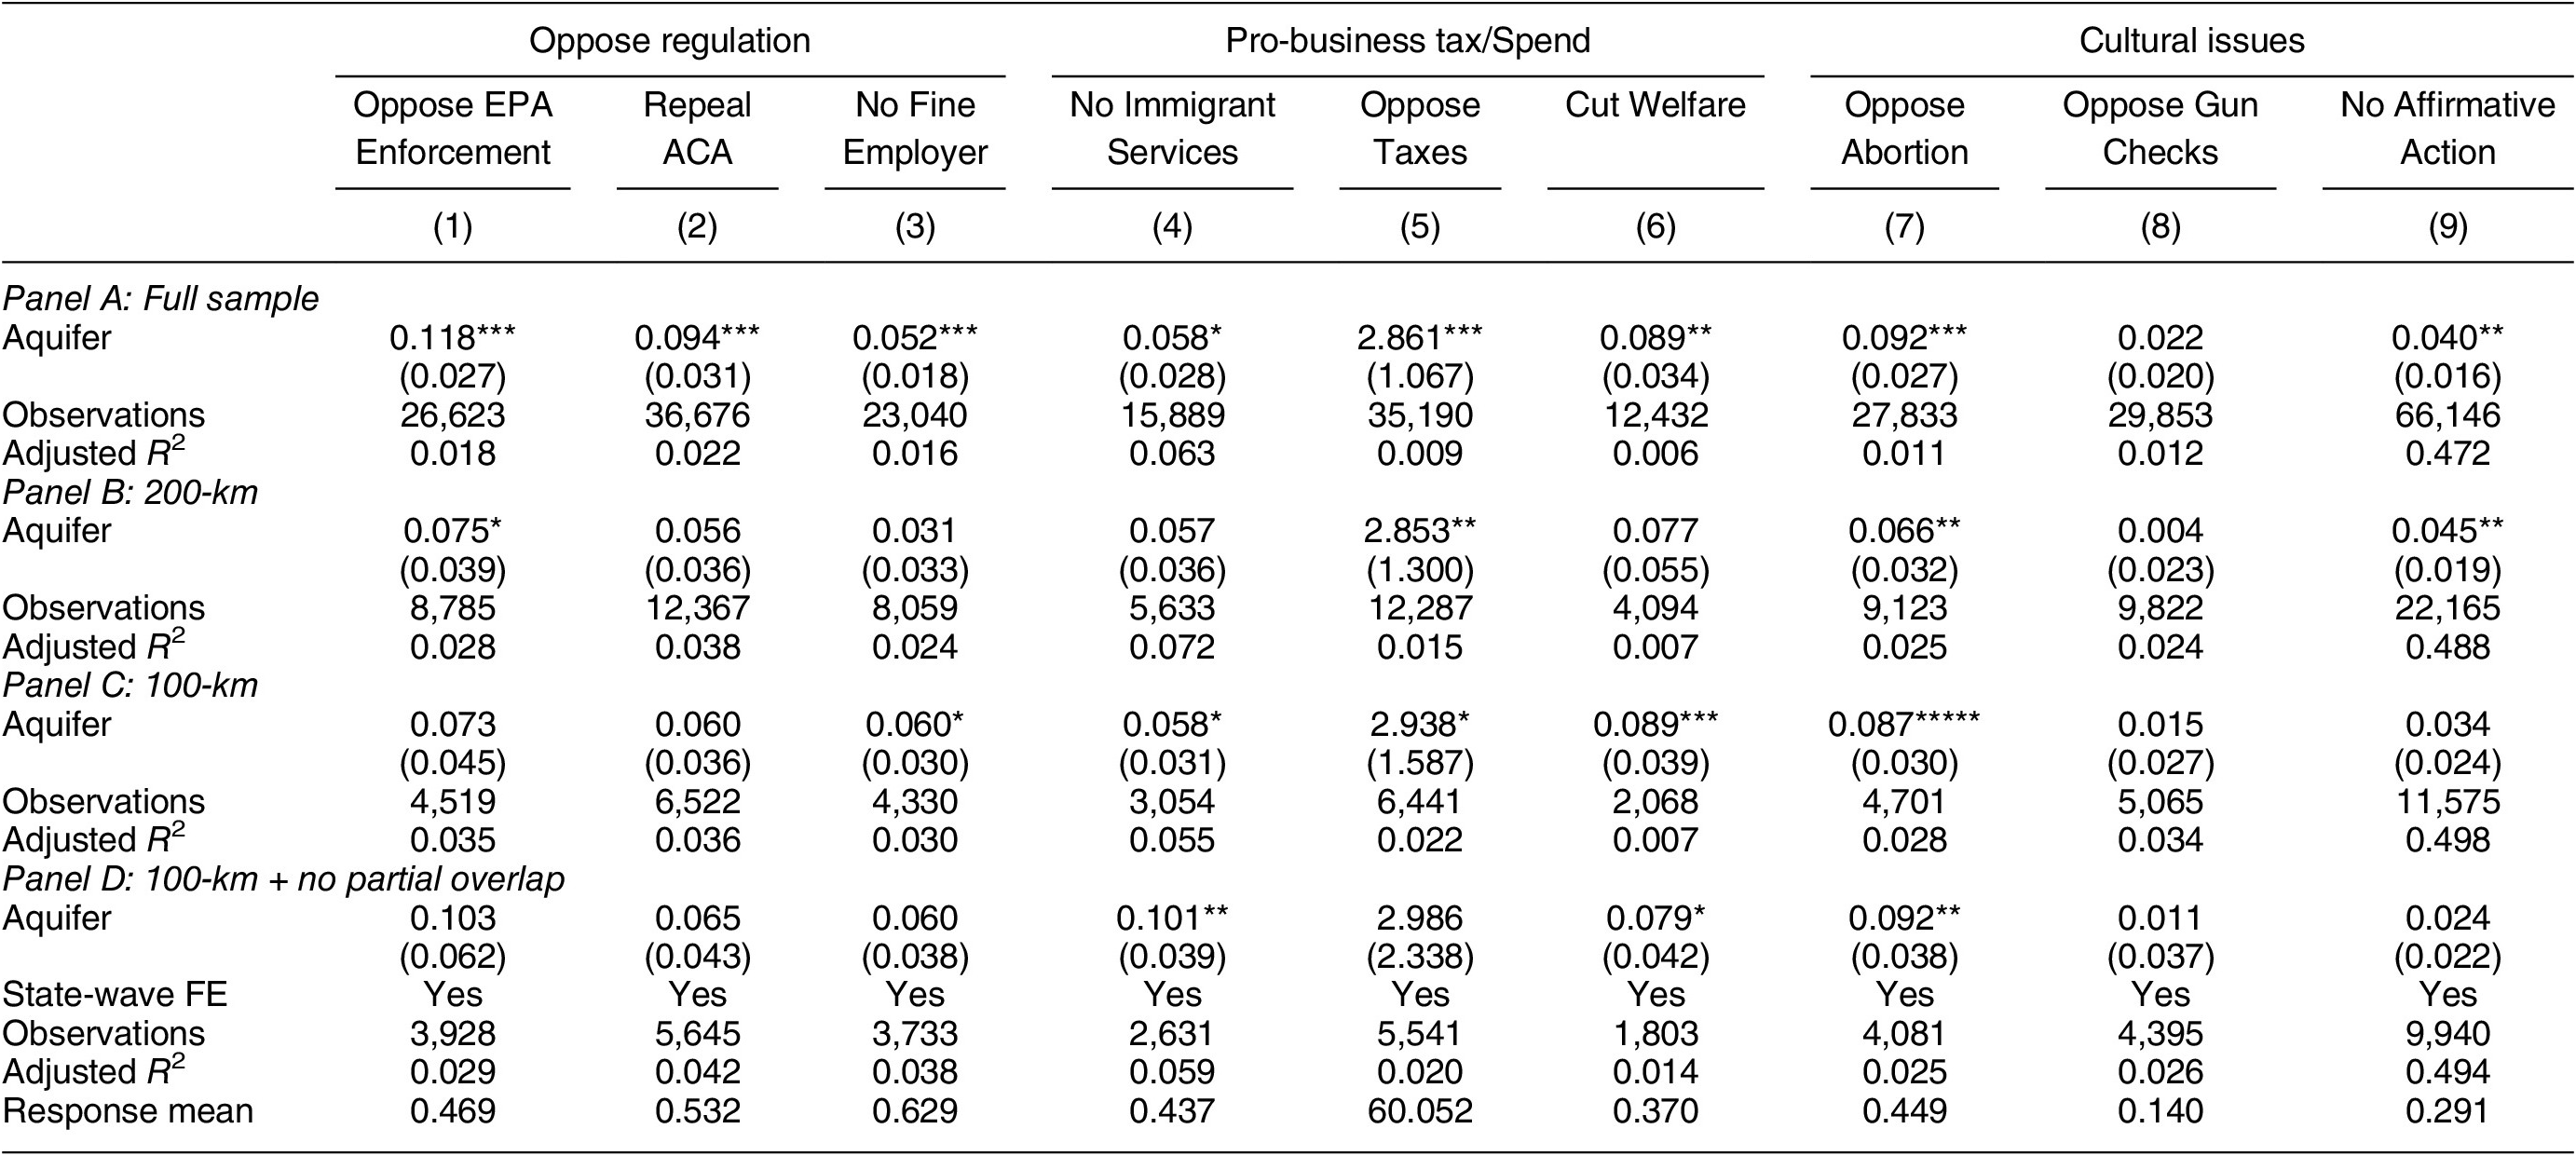
Table 1 presents the main set of results. Panel A reports analyses using the full sample of counties, panel B for the 200-km buffer sample of counties, and panel C for the 100-km buffer sample of counties. Columns (1)–(3) report coefficient estimates for the baseline specification, which indicate that the post-war irrigation technology shock had a large impact on conservative voting. For instance, the coefficients on the interaction term in panel B (the 200-km buffer sample) suggest that compared to a spatially proximate county with no aquifer coverage in the same state, a county with full aquifer coverage experienced a 9.7 percentage point relative increase in the Republican Party’s share of the two-party vote in presidential elections from the pre- to the post-technological shock period (a 7.8 percentage point relative increase in senatorial elections and a 6.4 percentage point relative increase in gubernatorial elections). By contrast, the coefficients on the lower-order term indicate that there was no association between aquifer coverage and conservative voting across counties in the pre-technological shock period.
Impact of Technological Shock on Conservative Voting
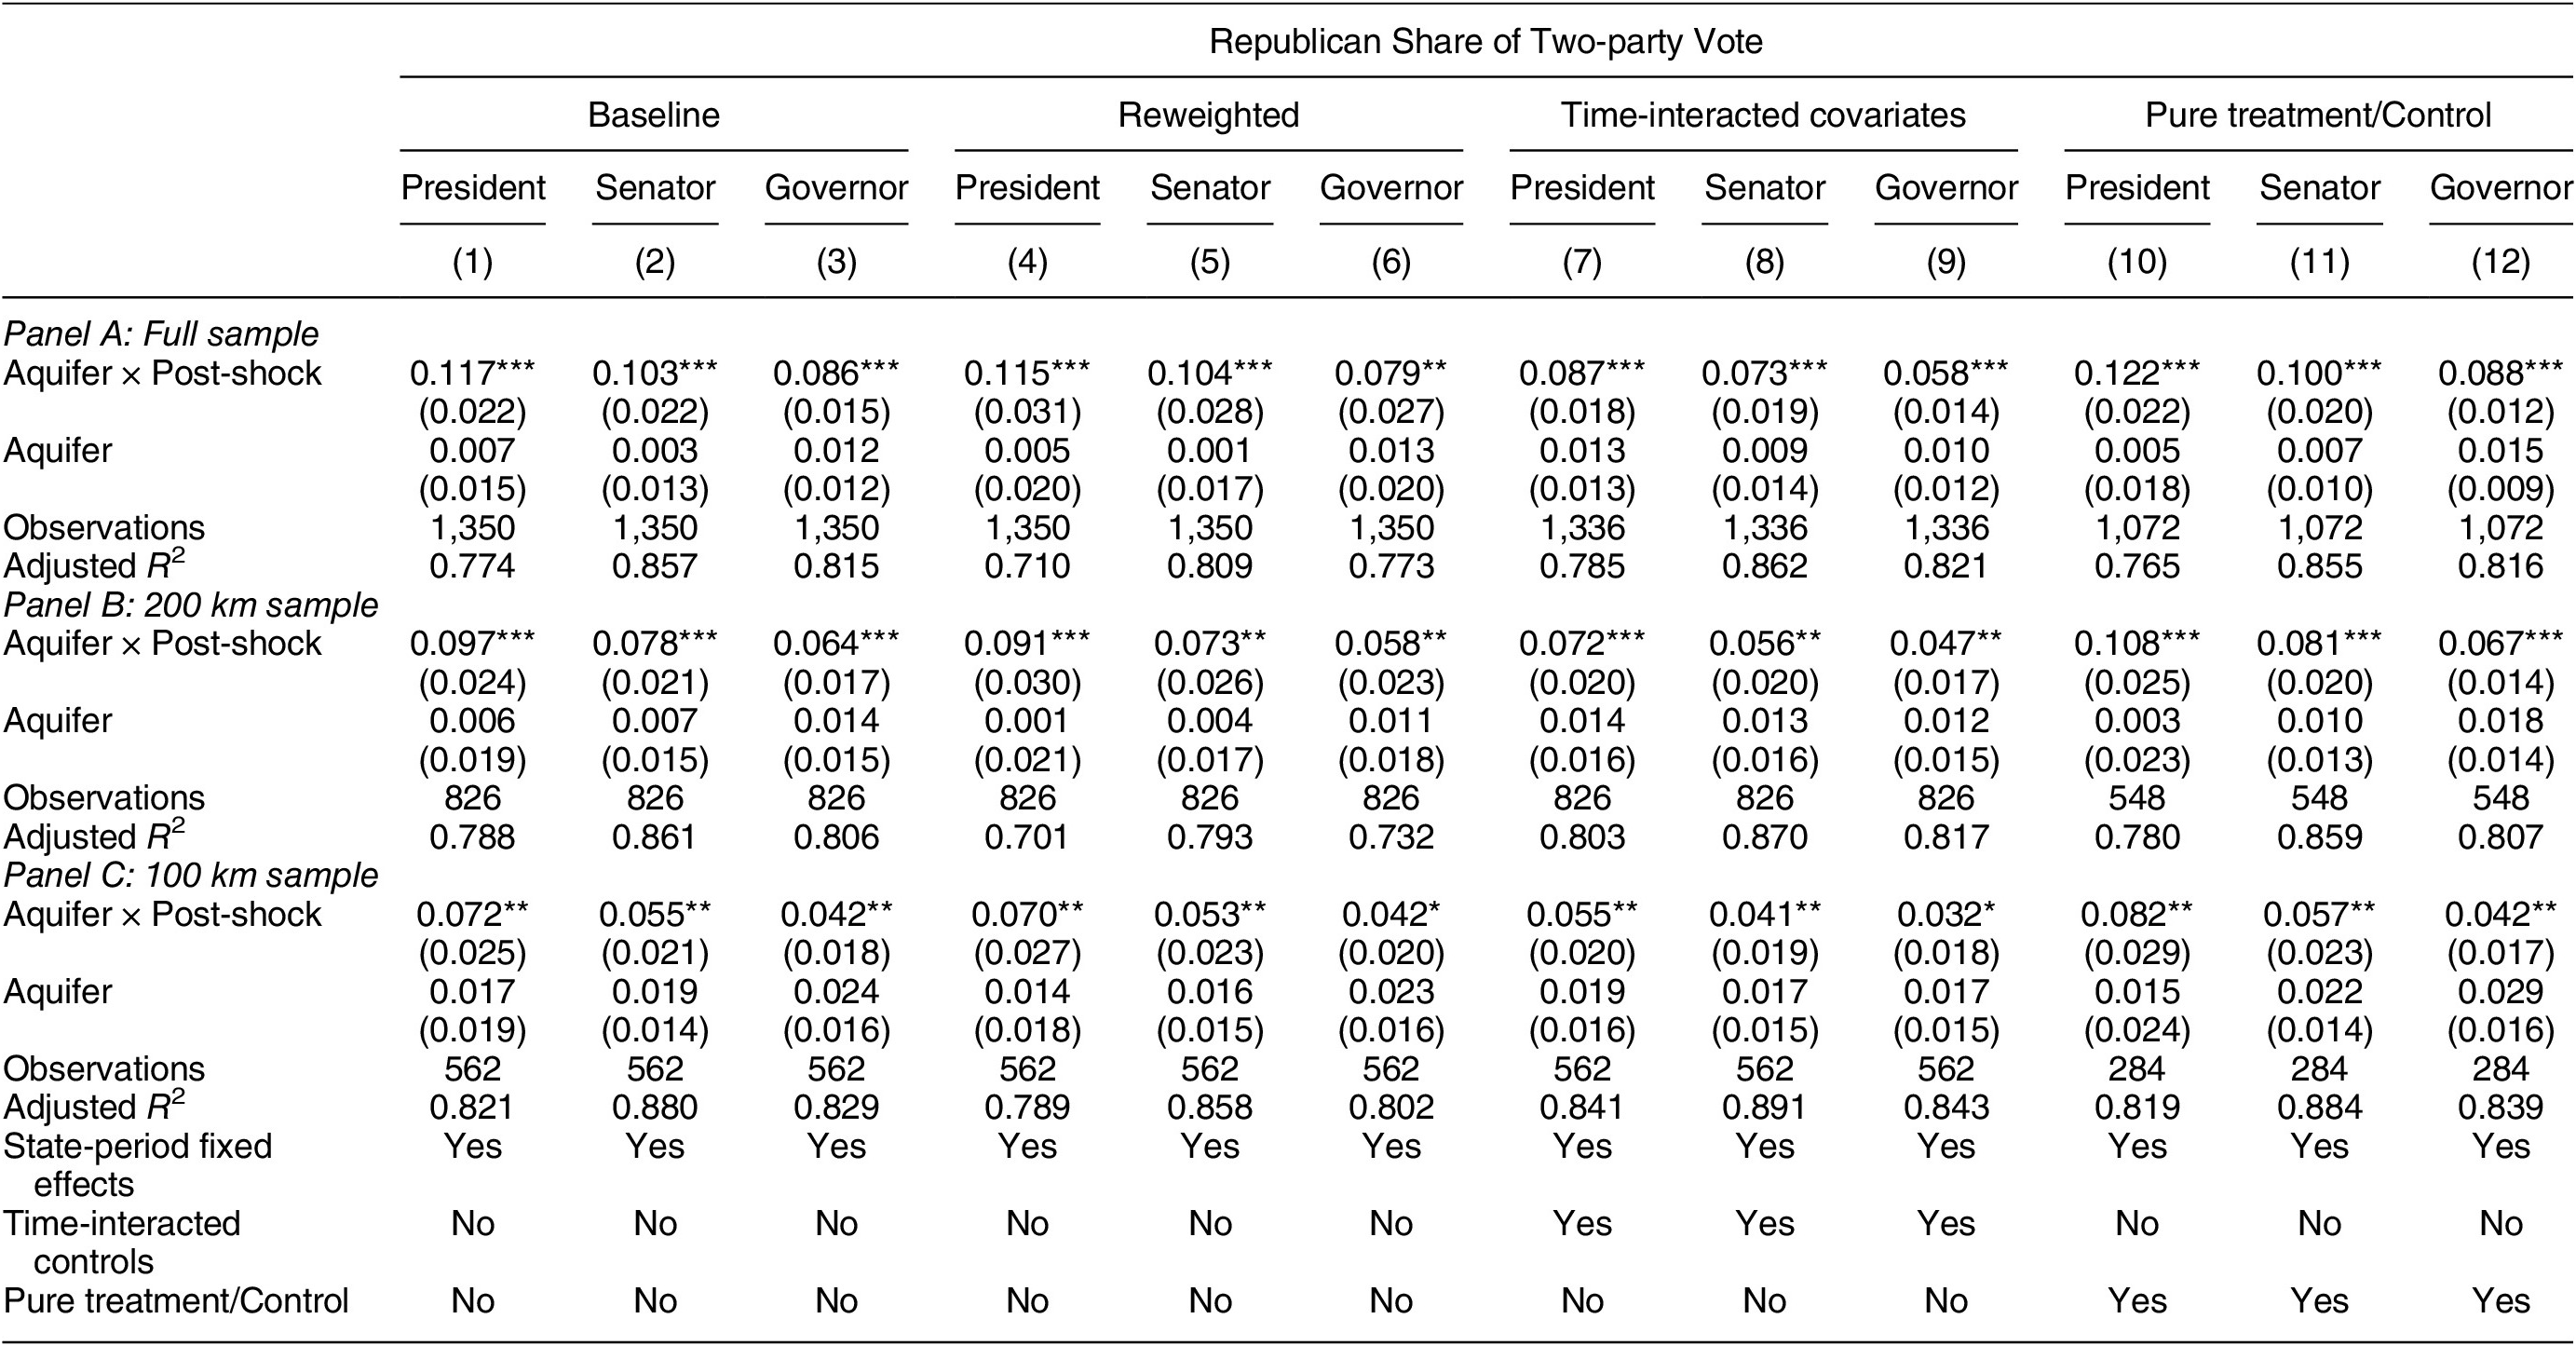
Notes: Unit of analysis is county-period average (pre-period is 1920–1940 and post-period is 1980–2000). Outcome is the Republican Party’s share of the two-party vote in presidential, senatorial, or gubernatorial elections, depending on specification. Aquifer is a cross-sectional measure of the share of county land overlying Ogallala Aquifer. Post-shock is a time dummy variable taking a value of one for the post-shock period and zero otherwise. Columns (1)–(3) report baseline specification. In columns (4)–(6) regression weights are applied to recover pooled average of within-state difference-in-differences estimates weighted by number of observations in each state. Controls (see text) included as lower-order terms and interacted with post-shock variable in columns (7)–(9). Columns (10)–(12) include only counties fully inside/outside aquifer. Analysis estimated by OLS. Standard errors adjusted for clustering by county and state-period reported in parentheses. *p $ < $
0.1; **p
$ < $
0.1; **p $ < $
0.05; ***p
$ < $
0.05; ***p $ < $
0.01.
$ < $
0.01.
Columns (4)–(6) reweight the OLS regressions so that coefficients represent a pooled average of within-state effects weighted only by the number of counties in each state. These coefficients are extremely similar to those in the baseline specification, indicating that the estimates are not driven by the over-weighting of any particular state. Columns (7)–(9) additionally control for county-level exposure to a variety of pre-treatment shocks (variables described in detail in the preceding section) as lower-order terms as well as in interaction with post-technological shock time-based dummy variables in order to absorb potential nonparallel trends across counties as a function of these pre-treatment variables. While the coefficients of interest shrink slightly, they remain large and positive across specifications.
Columns (10)–(12) address concerns about spatial spillovers by pruning counties partially intersecting the boundary of the Ogallala Aquifer, so that the sample is comprised only of “pure” treatment counties fully contained within the aquifer and control counties fully outside of the aquifer. Consistent with the existence of spatial spillovers, the coefficients tend to become larger in this specification. Estimates from the 200-km buffer sample suggest that compared to a spatially proximate county with no aquifer coverage in the same state, a county with full aquifer coverage experienced a 10.8 percentage point relative increase in the Republican Party’s share of the two-party vote in presidential elections, an 8.1 percentage point relative increase in senatorial elections, and a 6.7 percentage point relative increase in gubernatorial elections from the pre- to the post-technological shock period.
This helps to make sense of a noticeable pattern: across empirical specifications, though the coefficients remain substantively large and statistically significant, the estimated magnitude of the impact of the technological shock tends to be smaller in specifications that prune the sample to a smaller buffer along the boundary of the Ogallala Aquifer. While some of this may be due to the elimination of potentially confounding differences between spatially distant counties, it may also be due to the existence of spatial spillovers, which tend to attenuate estimates, especially in spatially proximate samples.
Another empirical pattern that emerges is that the coefficient estimates are consistently greater in magnitude in the case of presidential voting than in senatorial elections, and greater in senatorial elections than in gubernatorial elections. One reason for this may be due to the dynamics of party positioning. In national elections, the platforms of the Democratic and Republican Parties are sharply polarized, whereas, in more state-specific elections, the Democratic Party may have greater scope to moderate its platforms to win over rural voters.
Were these effects plausibly due to the disproportionate impact of the post-war irrigation technology shock in counties with greater overlap with the Ogallala Aquifer? Table 2 estimates the same type of regressions but now looks at measures of irrigation technology adoption as the outcome variable. Columns (1)–(3) look at impacts on the percentage of county farmland that is irrigated according to agricultural censuses. The coefficient estimate in column (2) based on a 200-km buffer sample suggests that a county with full aquifer coverage experienced an approximately 13.9 percentage point improvement in irrigation from the 1920–1940 period to the 1980–2000 period, relative to a spatially proximate county with no aquifer coverage in the same state. Columns (4)–(6) look at a particularly capital-intensive form of irrigation—center-pivot irrigation—as estimated from satellite imagery. The estimate from column (5) suggests that a county with full aquifer coverage gained approximately 105 additional center-pivot irrigation systems per 1000 sq km from the 1920–1940 period to the 1980–2000 period, relative to a county with no aquifer coverage in the same state.
Impact of Technological Shock on Irrigation Uptake
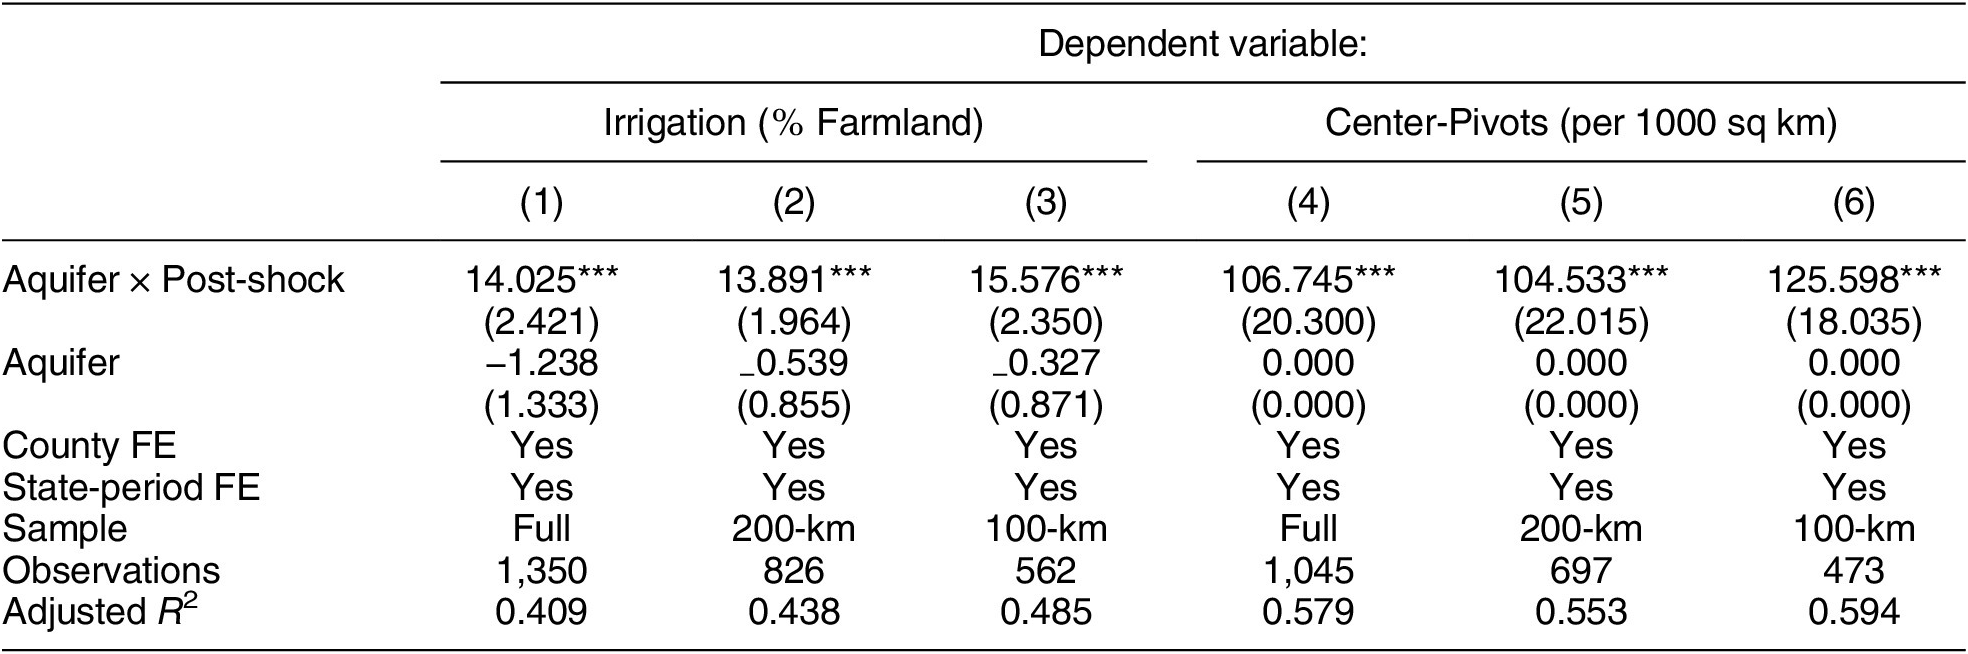
Notes: Unit of analysis is county-period average (1920–1940 average comprises pre-period and 1980–2000 average comprises post period). Irrigation is average percentage of farmland that is irrigated as computed from agricultural censuses conducted in 1920, 1925, 1930, 1935, and 1940 (pre-period) and 1982, 1987, 1992, and 1997 (post-period). Center pivots is computer vision estimate of center-pivot irrigation systems per 1000 sq kilometers from satellite imagery averaged 1985–2000 (the variable takes a value of zero for all counties in the pre-shock period as the technology did not exist at this time). Analysis estimated by OLS. Standard errors adjusted for clustering by county and state-period reported in parentheses. *p
$ < $
0.1; **p
$ < $
0.05; ***p
$ < $
0.01.
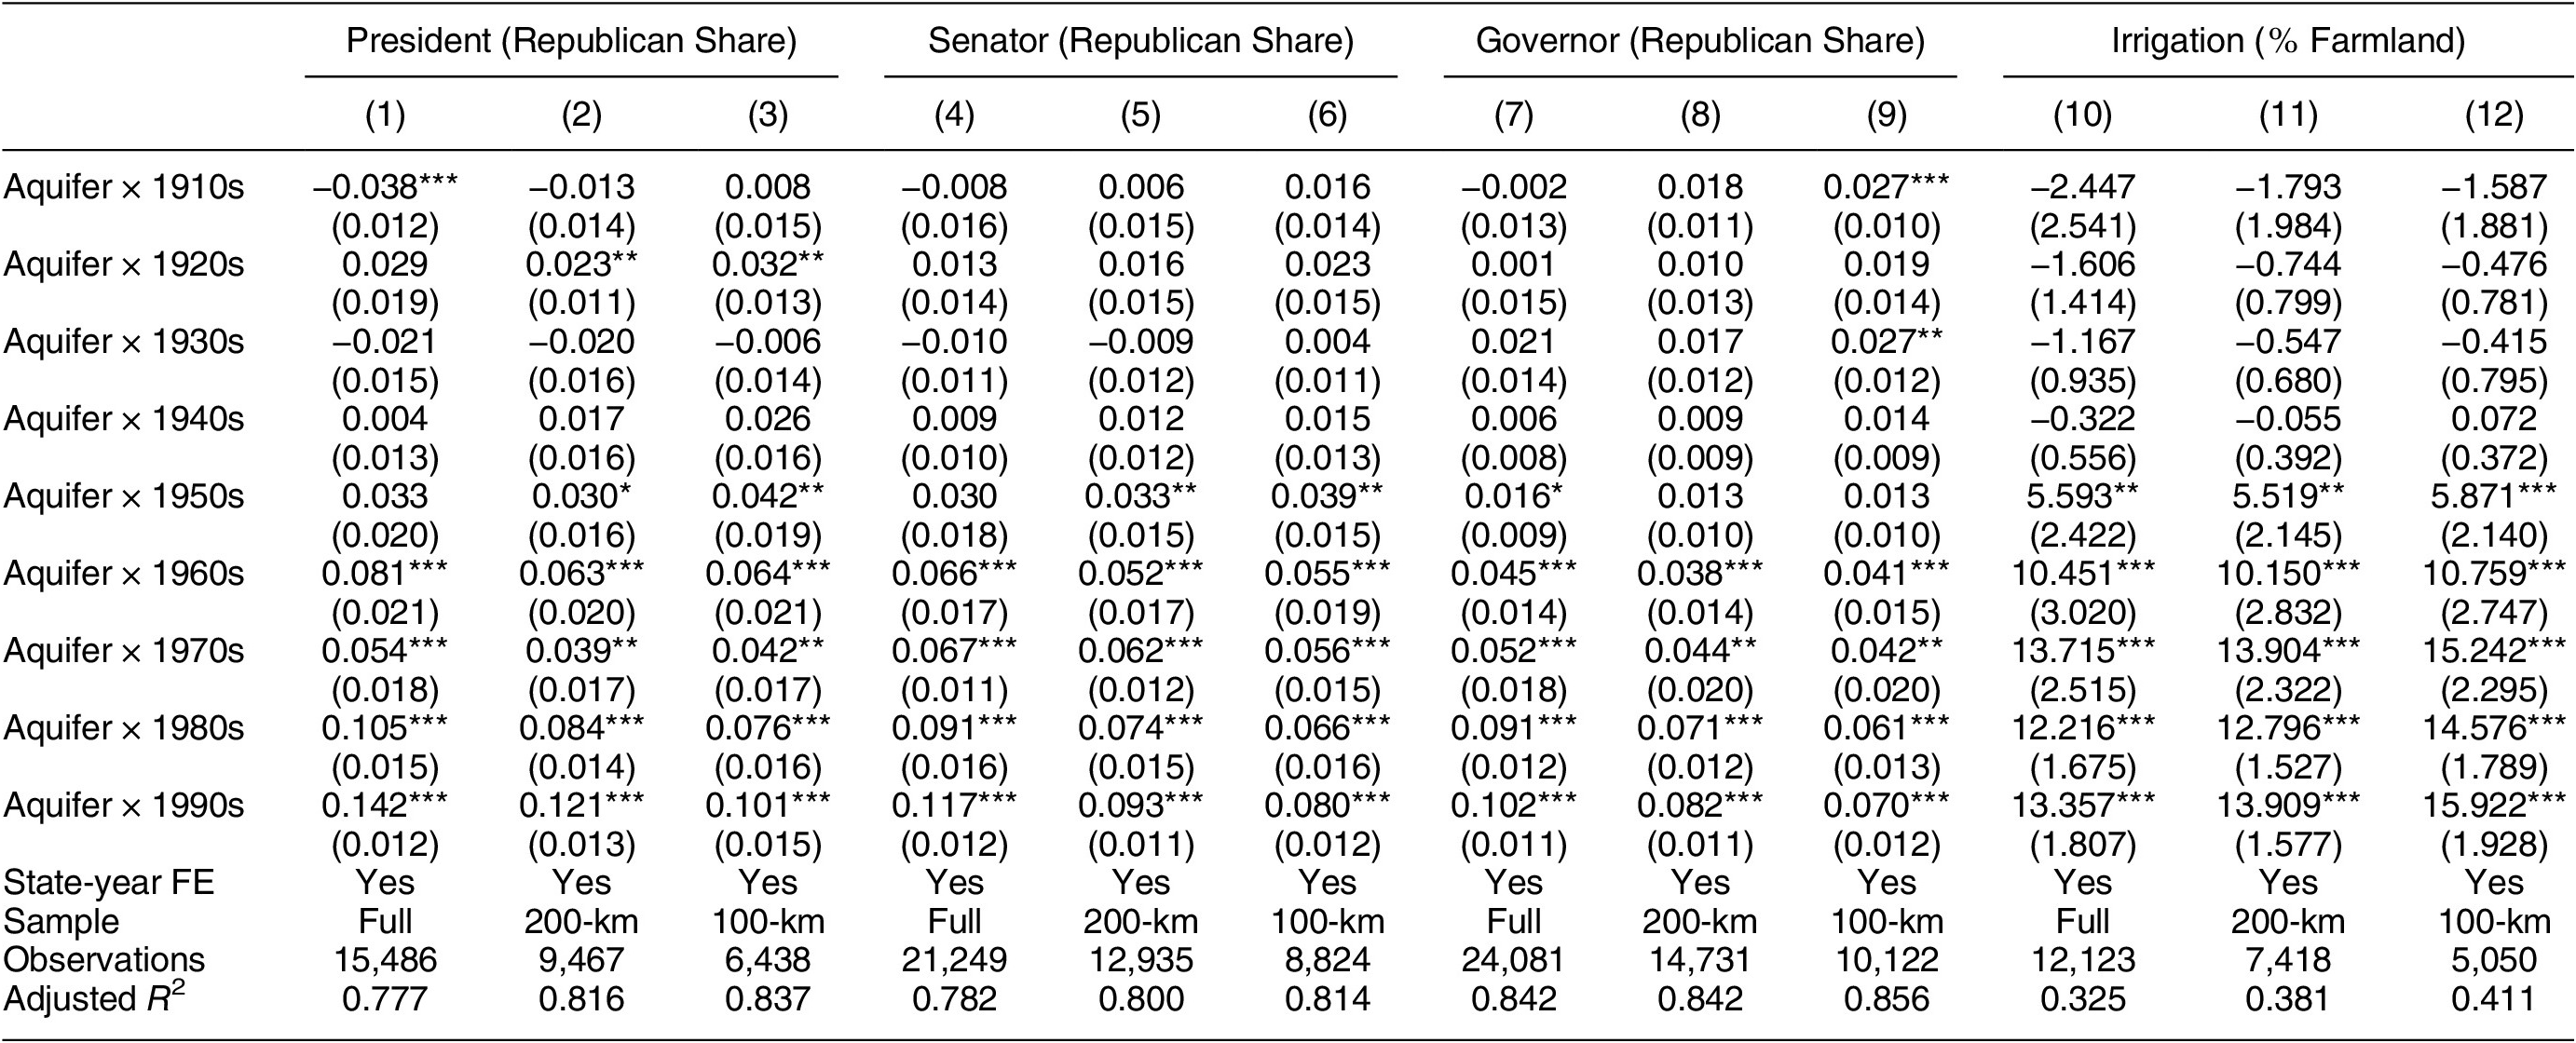
Table 3 reports coefficients from flexible specifications using a full county-year panel dataset of election returns and reporting coefficients on decadal dummy variables interacted with the aquifer coverage variable, controlling for state-year fixed effects. The coefficients in columns (1)–(9) indicate that across empirical samples and type of election, there was no statistically detectable association between aquifer coverage and conservative voting in the 1910s, 1920s, and 1930s and that this null relationship was stable until a positive relationship began to emerge exactly when the new irrigation technologies were introduced. These effects grew over time, consistent with the gradual uptake of irrigation technologies. Columns (10)–(12) report a parallel set of results for the spread of irrigation. These show that, prior to the availability of technology needed to exploit groundwater at scale, there was no association between county-level aquifer coverage and irrigation but a large and positive relationship that emerged from the post-shock period onward.
Technological Change and Elections Over Time
Notes: Unit of analysis is county-year (election year in the case of electoral outcomes and agricultural census year in the case of irrigation). Analysis estimated by OLS. Standard errors adjusted for clustering by county and state-year reported in parentheses. *p
$ < $
0.1; **p
$ < $
0.05; ***p
$ < $
0.01.
Figure 6 subjects the association between aquifer coverage and conservative voting to statistical tests for pre- and post-shock trends by omitting the interaction term between aquifer coverage and the dummy variable indicating the 1930s (the decade preceding the introduction of the new irrigation technology) and including state-year fixed effects and county fixed effects (to deal with sample selection issues as some counties drop out in the 1910s). This permits an analysis of whether the relationship between aquifer coverage and outcomes displayed a statistically detectable difference relative to that existing in the 1930s. As panels A through C indicate, there was no visibly confounding pre-trend in the estimated relationship between aquifer coverage and conservative voting prior to the technological shock, but a large positive trend emerged thereafter, due to the disproportionate spread of irrigation to counties with greater aquifer overlap from the 1940s onward as documented in panel D.
Pre- and Post-Technological Shock Trends
Notes: Plot depicts coefficient on aquifer coverage variable interacted with decadal dummy variables, with the 1930s left out as the reference category. Vertical bars are 95% confidence intervals. Vertical axis range is plus or minus one standard deviation of the outcome in panels A through C and two standard deviations in panel D. All specifications control for state-year and county fixed effects and are based on the 100-km buffer sample of counties. Analysis estimated by OLS. Standard errors adjusted for clustering within counties and state-years. Full results reported in Supplementary Table A5.
TESTS OF CHANNELS
This section of the paper explores potential channels by empirically examining the impact of the technological shock on a range of intermediate outcomes measured from agricultural, population, and religious censuses.
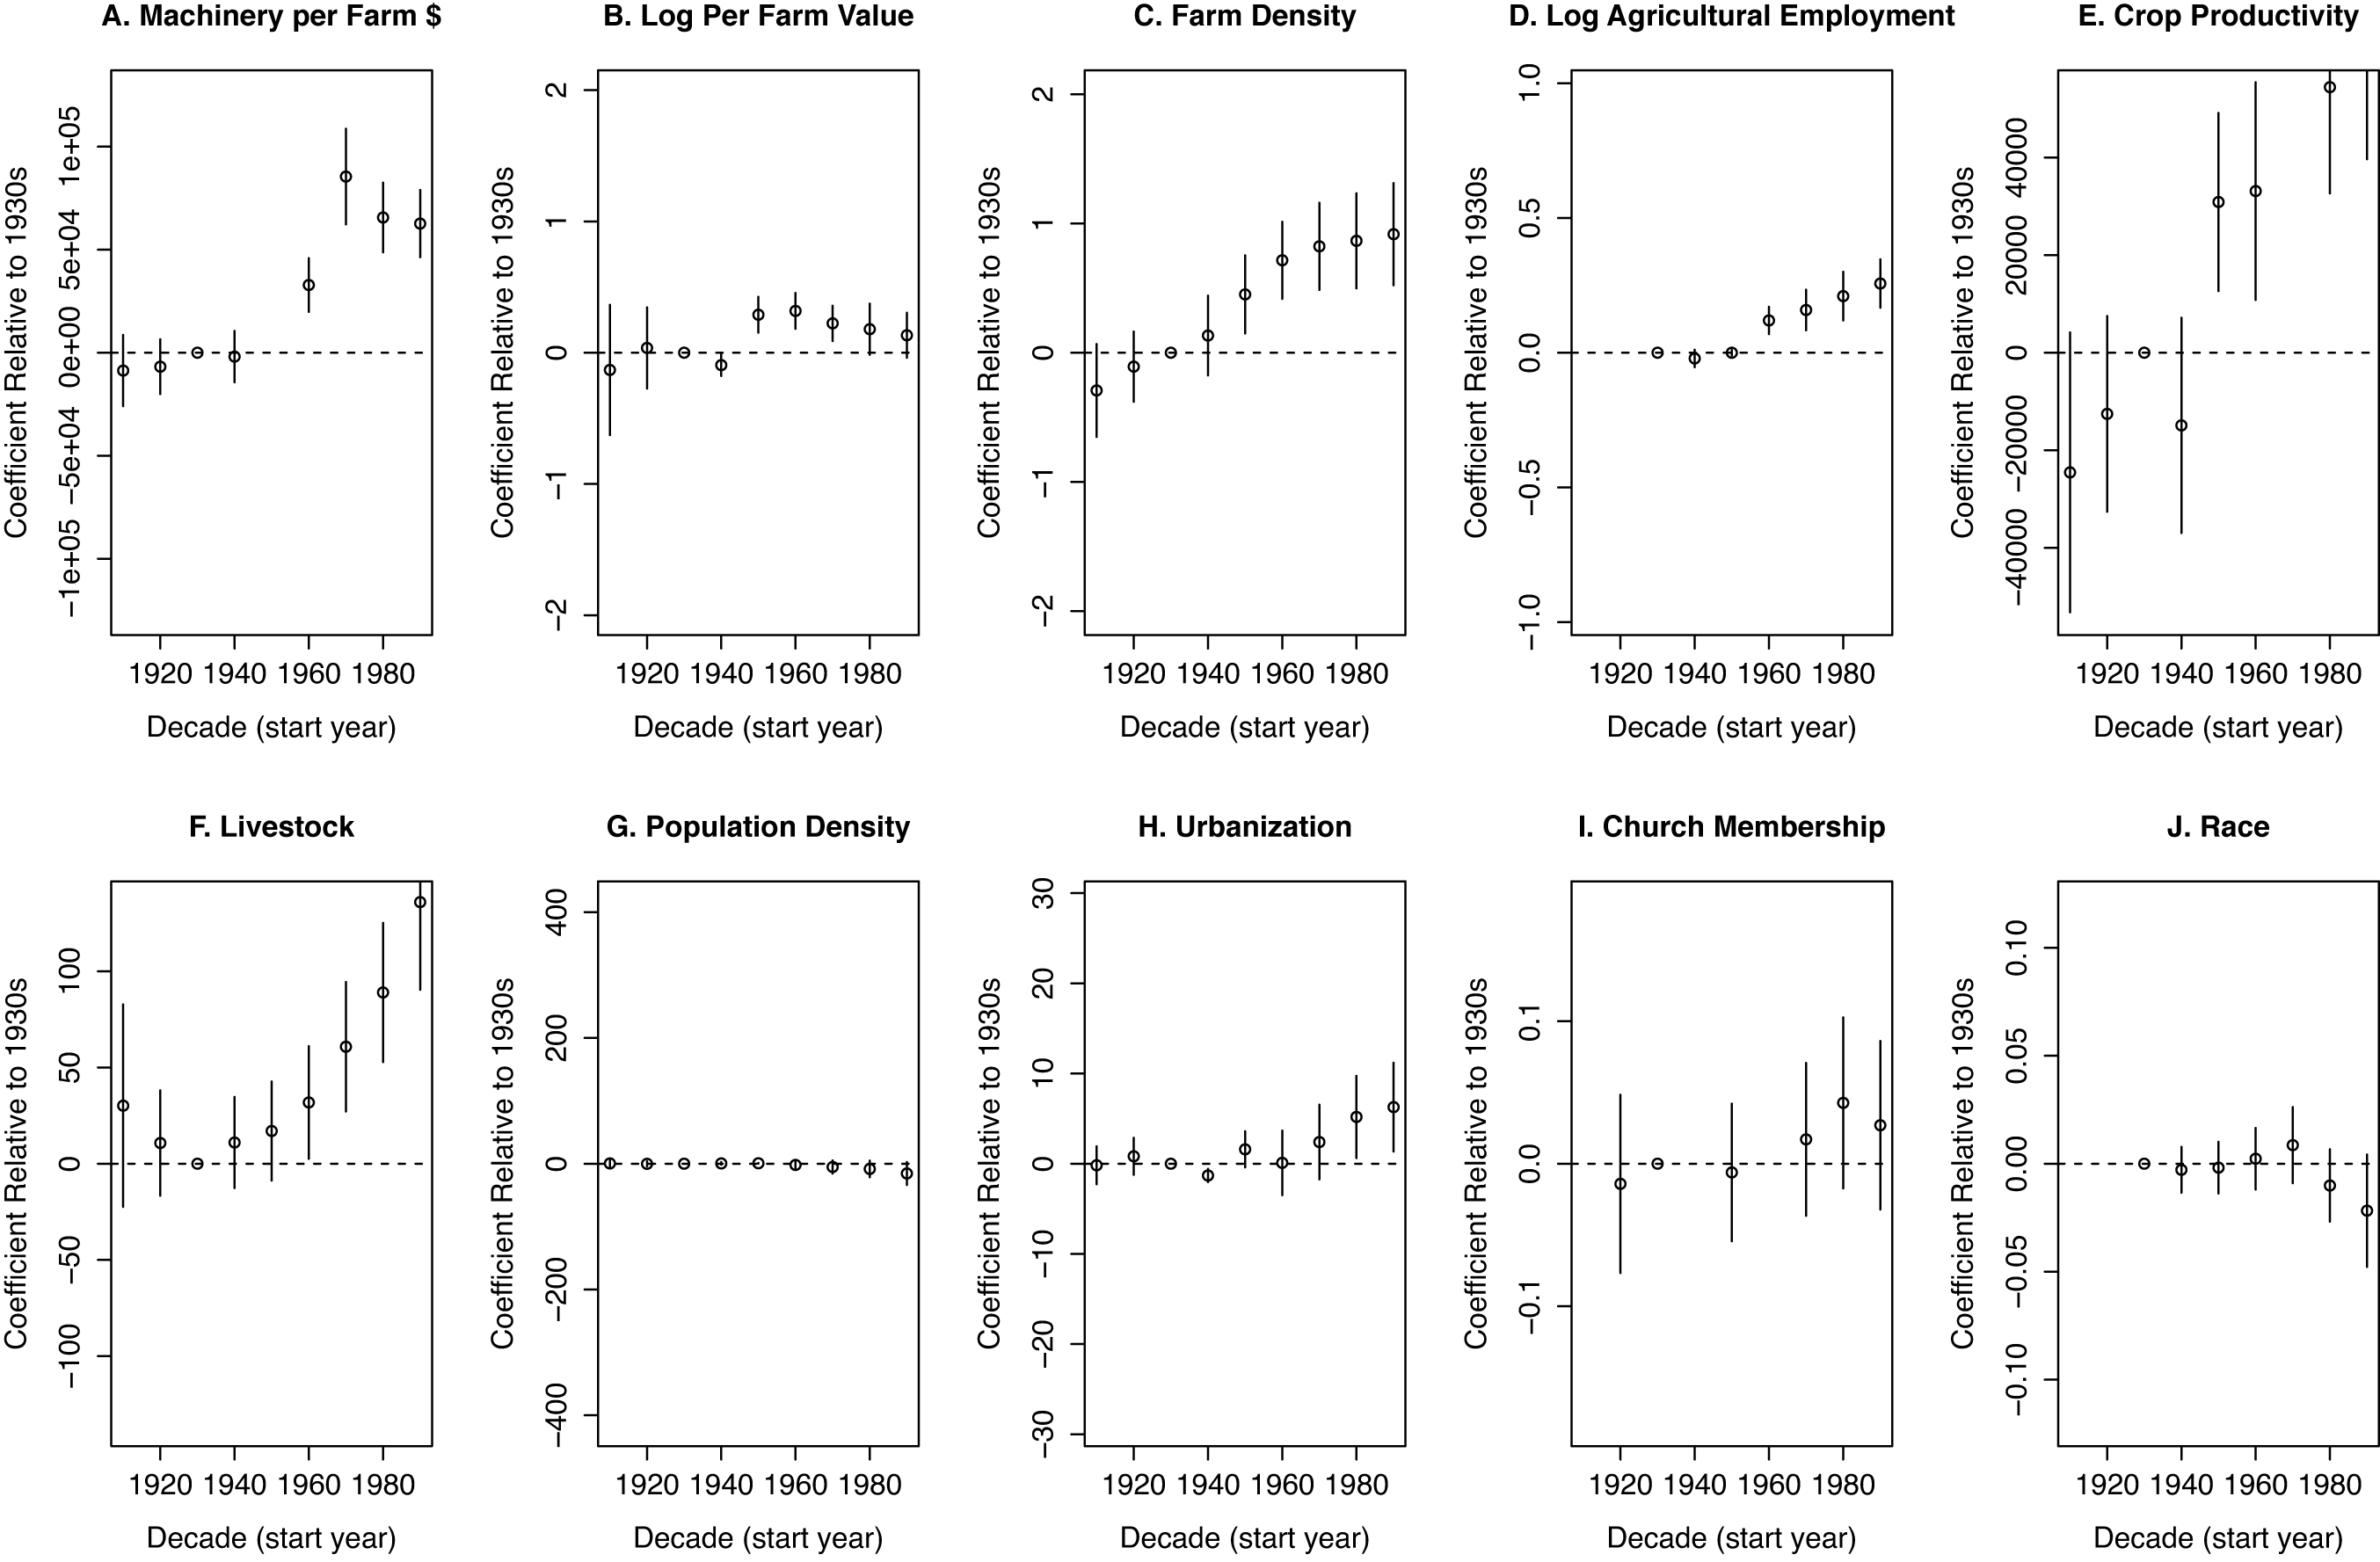
Table 4 investigates the decade-by-decade association between aquifer coverage and different outcomes. Columns (1)–(3) investigate the impact of the post-war irrigation technology shock on the capital intensity of agriculture, as captured by the per-farm value of machinery and the density and average market value of farm property (land and buildings) in 2016 dollars. As the coefficients indicate, capital costs jumped in counties with greater aquifer coverage after the technological shock, as did the scale of farming operationalized in terms of the density and market value of farms. Panels A, B, and C of Figure 7 subject these time trends to a statistical test and give a sense of their magnitude by scaling the vertical axis by plus or minus a standard deviation of the outcome variable.
Potential Channels
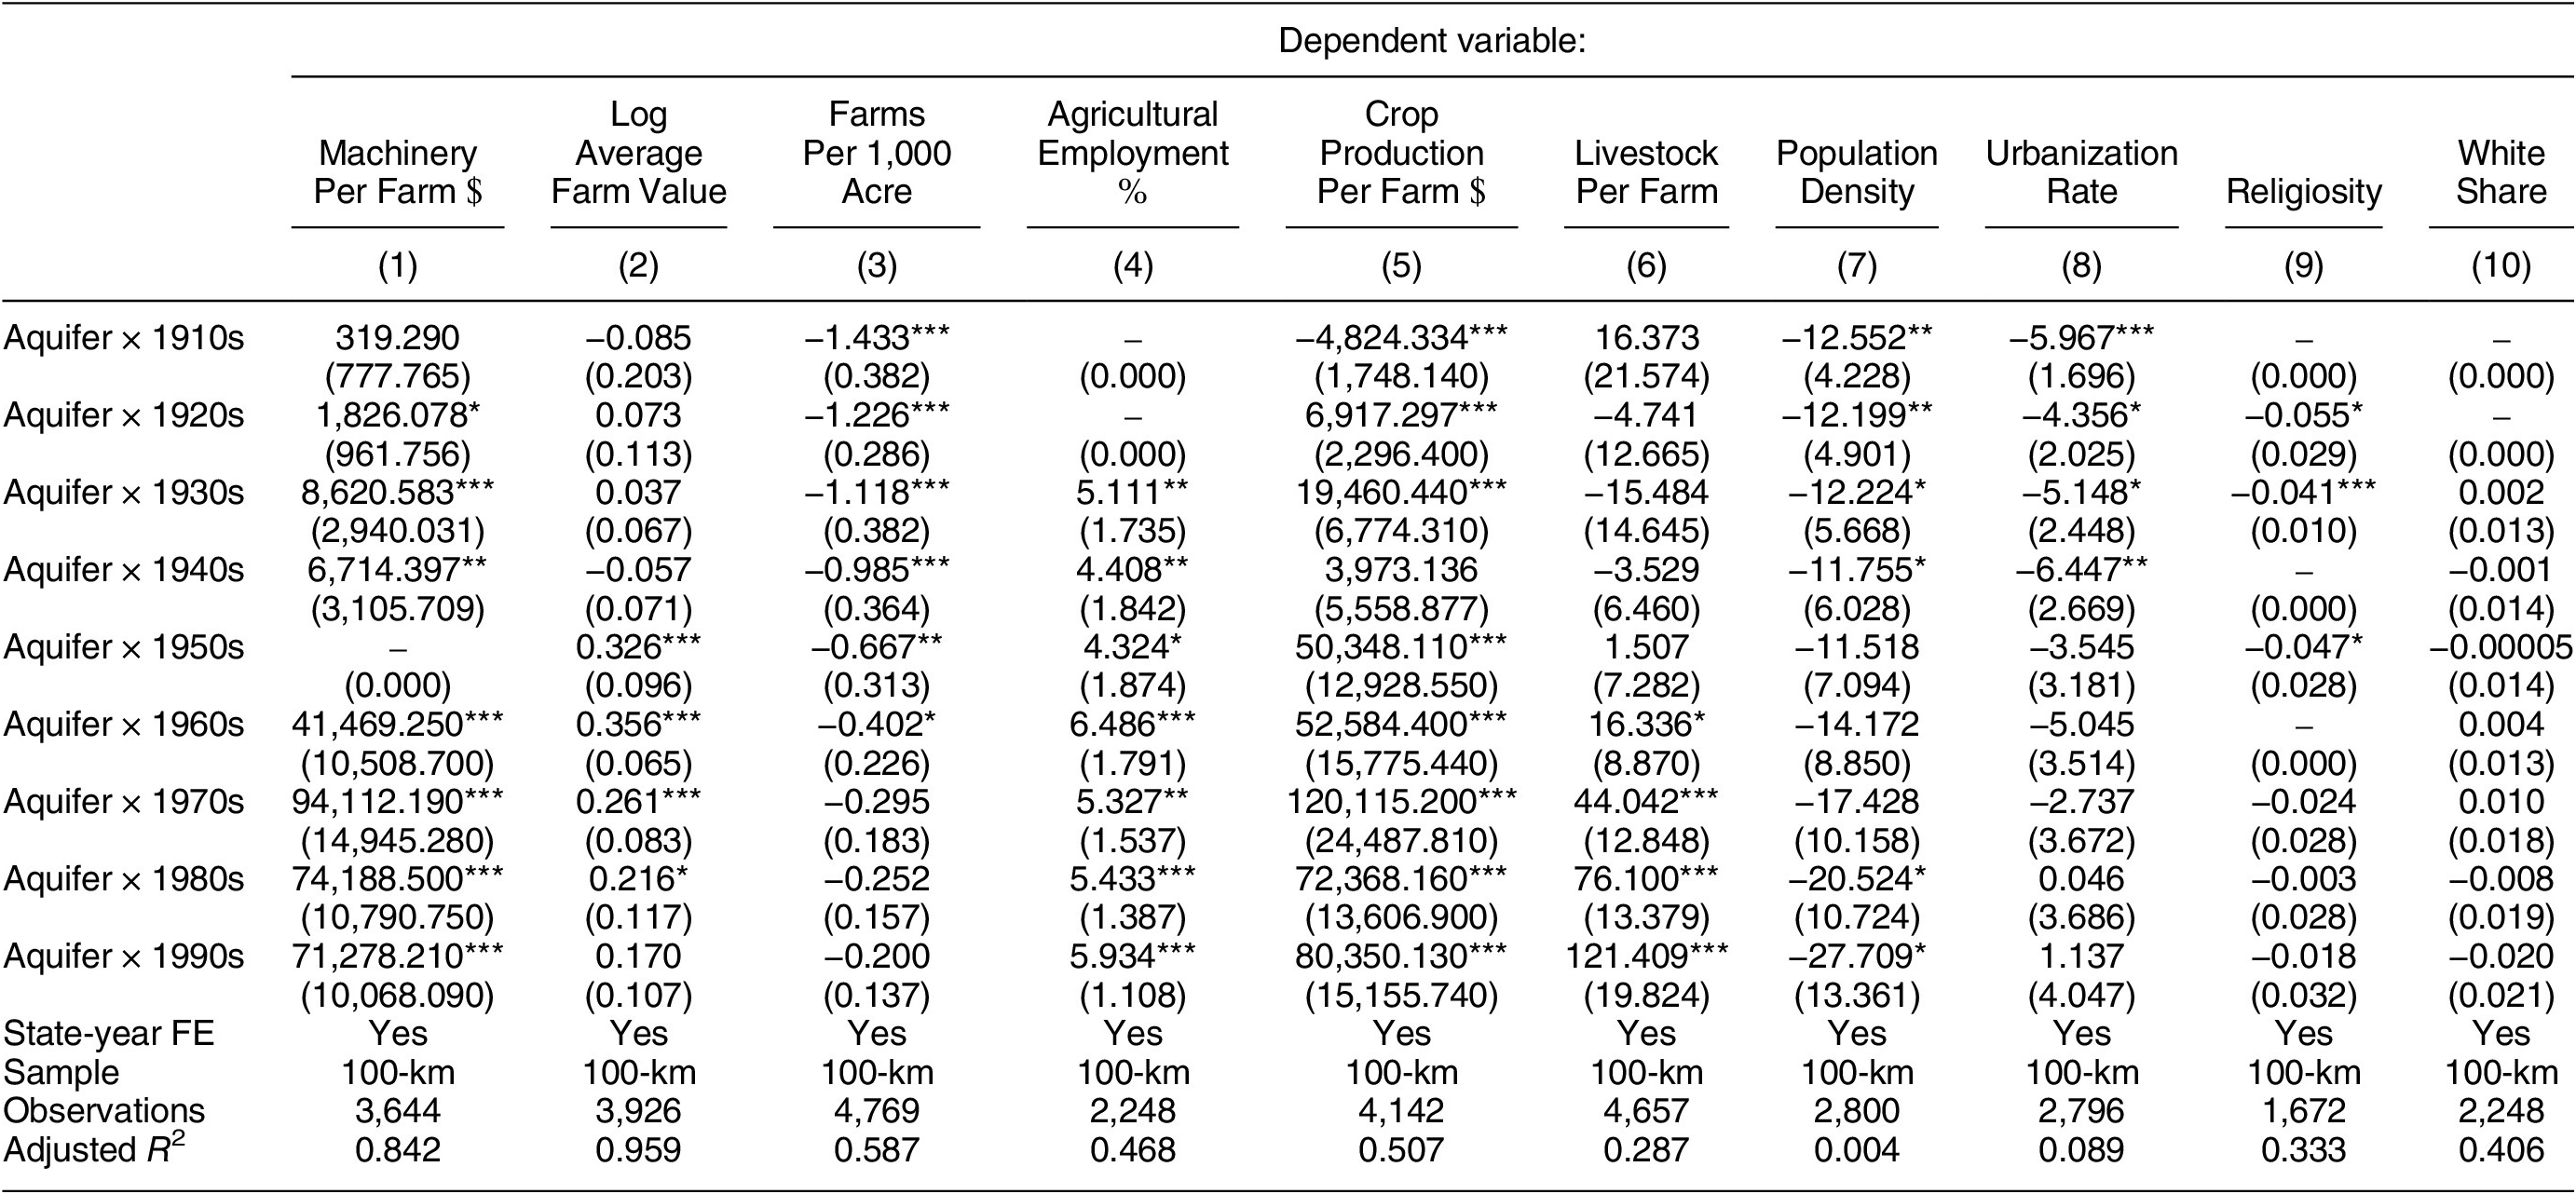
Notes: Unit of analysis is county-year (agricultural, population, or religious census year depending on outcome). Machinery is market value of machinery. Average farm value is market value of farm land and buildings. Farm density is the number of farms per 1,000 acres of county land. Agricultural employment is the percentage of workforce employed in farms. Crop production per farm is total value of crop production divided by number of farms. Livestock is the total number of cattle and pigs divided by the number of farms. All dollar amounts adjusted for inflation to 2016 dollars. Population density is the number of people per 1,000 acres of county land. Urbanization is the percentage of the county population living in census-defined urban areas. Religiosity is church membership per capita. White share is white share of population. Analysis estimated by OLS. Standard errors adjusted for clustering by county and state-year. *p
$ < $
0.1; **p
$ < $
0.05; ***p
$ < $
0.01.
Potential Channels
Notes: Plots depict coefficient on aquifer coverage variable interacted with decadal dummy variables, with the 1930s left out as the reference category. Vertical bars are 95% confidence intervals. In each plot, vertical axis range is plus or minus one standard deviation of the outcome variable. All specifications control for state-year and county fixed effects and are based on the 100-km buffer sample of counties. Analysis estimated by OLS. Standard errors adjusted for clustering within counties and state-years. See Supplementary Table A5 for table version.
Zip Codes of Respondents in CCES Data
Notes: Plots depict zip codes in CCES data in different empirical samples.
Columns (4)–(6) look at proxies for the structural power of the agricultural sector. The estimate in column (4) shows that counties with greater aquifer coverage remained more agricultural in their workforce in the context of long-term secular decline in farm employment. In the Great Plains, 13% of the working population was employed in agricultural occupations (defined by the census as those working on farms) in the 1990s, down from 51% in the 1930s. In this context, retention of an additional six percentage points of the workforce in the farm sector in the 1990s implies a difference that is large in percent terms. Panel D of Figure 7 demonstrates this by taking the natural log of the agricultural employment variable so that coefficients have a percent change interpretation. Columns (5) and (6) and panels E and F of Figure 7 show that per-farm output of crops and livestock—associated with the agglomeration of industries like feedlots and meatpacking plants—also experienced a large relative increase in areas more exposed to the post-war technological shock. These results suggest that the increasing capital intensity of farming, together with the entrenchment of local economic dependence upon the agricultural sector, plausibly played an important role in the increasing electoral conservatism of counties more impacted by the post-war irrigation technology shock.
But could the conservative electoral shift in counties with greater aquifer coverage be explained by alternative mechanisms? One of the best cross-sectional predictors of county-level voting patterns is a county’s population density (Rodden Reference Rodden2019). Could the results be driven by a process of depopulation and de-urbanization, as improved agricultural productivity keeps places relatively more rural? This is not supported by the data. Column (7) of Table 4 and panel G of Figure 7 reveal that counties with greater aquifer coverage experienced a modest relative decline in their levels of population density over time relative to counties with less aquifer coverage. Column (8) and panel H show that counties with greater aquifer coverage experienced a relative improvement in urbanization (the percentage of the population living in census-defined urban areas) over time, plausibly due to the formation or retention of small towns in areas of intensive agriculture. These set of results do not support the idea that the conservative shift was driven by intrinsic differences in the degree of rurality as measured with differences in population density or urbanization rates.
Could the conservative shift be explained by the spread of social conservatism in rural places, due either to racial composition or religiosity? Column (9) looks at decadal associations between aquifer coverage religiosity as proxied by the church membership per capita. The coefficients reveal a modest but statistically insignificant relative increase in religiosity, casting doubt on this channel. Did counties more impacted by the post-war technological shock change remain more racially homogenous? We examine this possibility in column (10) with a measure of the white share of the population over time. We find that, if anything, areas with greater aquifer coverage became relatively slightly less white over time, likely due to the influx of Latino workers to areas of intensive agriculture beginning in the 1980s.
CONTEMPORARY POLICY PREFERENCES
This section assembles geo-coded survey data on contemporary policy preferences and compares the reported preferences of individuals residing inside the Ogallala Aquifer boundary, where capital-intensive agriculture thrives as a result of the long-term legacy of the post-war irrigation technology shock, to those of individuals residing outside of the aquifer boundary. We utilize data from the CCES waves conducted between 2006 and 2020 (Kuriwaki Reference Kuriwaki2021), comprising tens of thousands of respondents in annual nationally representative samples, which together provide a large sample of respondents located in the Great Plains who can be geo-coded to the zip code level.
The explanatory variable is the share of a respondent’s zip code that overlies the Ogallala Aquifer. In the preferred specification, we include only zip codes within a 100-km buffer of the aquifer boundary in each state and prune from the sample zip codes partially overlying the Ogallala Aquifer. We control for state-survey wave fixed effects, so that the estimates are driven by comparisons between individuals who live in zip codes completely (but barely) within the boundaries of the Ogallala Aquifer and individuals who live in zip codes completely (but barely) outside of the boundaries, comparing between individuals in the same state and surveyed in the same year. All regressions are estimated by weighted least squares, utilizing cumulative survey weights, with standard errors clustered by state-survey wave and county.
Table 5 reports the results, looking at how reported policy preferences differ across individuals living just inside versus outside of the boundaries of the Ogallala Aquifer on nine different issues reflecting conservatism on regulation, tax and spending, and cultural issues. Columns (1)–(3) of panel D (the preferred specification) indicate that people living just inside the boundaries of the Ogallala Aquifer are about 10.3 percentage points more likely to express opposition to strengthened enforcement of the Clean Air Act and Clean Water Act if it costs US jobs, consistent with the opposition of agribusiness interests to environmental regulation. They are about 6.5 percentage points more likely to support the repeal of the Affordable Care Act, which imposes health insurance mandates on large-scale employers of hired labor. Column (3) suggests that they are 6 percentage points more likely to oppose fines for employers hiring undocumented laborers, a practice common at agribusiness firms and farms. Some coefficients are imprecisely estimated, though this is due to a loss of statistical power as the sample is pruned; the coefficient estimates in panel D are virtually identical to those of specifications (in panels A through C) which use larger samples and report statistically significant coefficient estimates due to a greater number of observations and smaller standard errors.
Individual Policy Preferences Inside and Outside of the Ogallala Aquifer Boundary
Notes: Unit of analysis is individual, across CCES completed between 2006 and 2020. Oppose EPA is an indicator of whether respondent expresses opposition to “strengthening enforcement of Clean Air Act and Clean Water Act even if it costs US jobs” (question in 2014–2019 survey waves). Repeal ACA is an indicator of supporting repeal of Affordable Care Act (2012–2019 survey waves). Oppose fine is an indicator of whether respondent expresses opposition to fining US businesses that hire illegal immigrants (2007, 2010, 2013–2017 waves). Prohibit immigrant is an indicator of whether respondent supports “prohibit[ing] illegal immigrants from using emergency hospital care and public schools” (2012–14 waves). Oppose taxes is preference scale from 0 (increasing taxes) to 100 (spending cuts) in response to budget deficit (2006–2008, 2010–2017 waves). Cut welfare is an indicator of whether respondent indicates preference for reducing welfare spending (2016 and 2018 waves). Limit abortion is an indicator of whether the respondent opposes “always allow[ing] a woman to obtain an abortion as a matter of choice” (2014–2019 waves). Oppose gun check is an indicator of whether the respondent opposes requiring background checks for all gun sales (2013–2019 waves). No affirmative action is an indicator of somewhat or strong opposition to affirmative action (2008–14 waves). Standard errors adjusted for two-way clustering within state-survey wave and county. *p
$ < $
0.1; **p
$ < $
0.05; ***p
$ < $
0.01.
Columns (4)–(6) investigate differences in policy preferences regarding tax and spending issues. Column (4) indicates that respondents living inside the Ogallala Aquifer boundary are 10.1 percentage points more likely to support prohibiting immigrants from access to public services, consistent with preferences for small government, especially forms of spending that would benefit workers. Column (5) indicates that people residing inside the boundaries of the Ogallala Aquifer are relatively more likely to favor cutting spending, as opposed to raising taxes, in order to pay for a budget deficit, also indicating a preference for small government. Column (6) indicates that respondents living inside the Ogallala Aquifer boundary are about 7.9 percentage points more likely to support cutting government spending on welfare, a stance consistent with opposition to redistributive taxation and spending.
Columns (7)–(9) investigate policy preferences on polarizing “culture war” issues as opposed to purely economic issues. Column (7) indicates that respondents living inside the boundaries of the Ogallala Aquifer are about 9 percentage points more likely to oppose always giving a woman the right to choose to have an abortion under any circumstances. Column (8) suggests that respondents living inside versus outside of the boundary of the aquifer do not significantly differ in their attitudes toward requiring background checks for all gun purchases. Column (9) indicates that respondents are slightly (about 2.4 percentage points) more likely to express opposition to affirmative action, a question that touches on issues related to race. These results suggest that technological change may have had some spillover effects on social/moral attitudes, consistent with the influence of conservative political entrepreneurs emphasizing cultural issues that activate a place-based/rural sectoral identity.
CONCLUSION
At the turn of the twentieth century, the Great Plains were a politically centrist region which often supported left-wing parties and politicians like those belonging to the Populist movement. But by the end of the twentieth century, large swathes of the Great Plains had evolved into some of the most conservative areas in the US, typifying the conservative electoral shift that took place across rural America and that indeed has taken place in the rural sector in other advanced capitalist economies.
What explains this puzzling transformation? In a lively debate (Bartels Reference Bartels2006; Frank Reference Frank2007; Gelman Reference Gelman2009), scholars have debated the extent to which the culture wars have contributed to the rise of rural conservatism. In this paper, we have suggested that much of the rise of rural conservatism can be traced to long-term technological and economic change, which played a key role in the rise of agribusiness and the long-term transformation of rural states into red states—whose political power is amplified by a territorial upper chamber—as well as the spatial polarization of politics into a right–left, rural–urban divide (Cramer Reference Cramer2016; Grumbach, Hacker, and Pierson Reference Grumbach, Hacker and Pierson2021; Rodden Reference Rodden2019). Drawing on a natural experiment—the post-war introduction of new irrigation technologies which disproportionately impacted counties with greater overlap with the Ogallala Aquifer—this paper has provided causally identified evidence demonstrating that new technologies made new politics in rural America.
This paper has posited three potential mechanisms linking technological change to right-wing voting, including the selection of farms for scale, the “structural” power exerted by agribusiness in areas where it has become a dominant industry, and the organized influence of agribusiness on rural political life. We illustrated these channels with evidence from repeated ethnographic studies of a county in southwestern Kansas visited by sociologists over a 50-year period spanning the pre- and post-technological shock periods and also provided some quantitative evidence consistent with these channels, including evidence that individuals residing just inside the boundaries of the Ogallala Aquifer today are systematically more conservative in their policy preferences than those living just outside. Yet we do not observe policy preferences in the pre-shock period and more work is needed to empirically pin down mechanisms, especially regarding how conservative political preferences emerged not only among an emergent class of affluent land and business owners but were transmitted from agribusiness interests to the mass public.
There are several fruitful pathways for future research to investigate potential mechanisms. Future studies could make use of full count census data and other micro-level data such as comprehensive voter files to investigate changes in the composition of the electorate associated with the increasing scale of agriculture, using either cross-sectional or over-time designs. Qualitative studies of the type employed classically by Gaventa (Reference Gaventa1982) in his study of company/coal-mining towns are well positioned to elaborate the different faces of power through which dominant industries use their structural power to shape local political life; one could imagine analogous studies in agribusiness-dominated communities. Finally, to study the organized influence of agribusiness, future studies might make use of spatially disaggregated micro-data on campaign contributions, which research has shown to flow into localities in the case of other geographically concentrated industries like fracking (DiSalvo and Li Reference DiSalvo and Li2022). Moreover, empirical studies of rightward shifts in other rural regions would also be valuable to study how these putative mechanisms might generalize. These are all promising paths for future empirical research.
SUPPLEMENTARY MATERIAL
To view supplementary material for this article, please visit http://doi.org/10.1017/S0003055424000200.
DATA AVAILABILITY STATEMENT
Research documentation and data that support the findings of this study are openly available at the American Political Science Review Dataverse: https://doi.org/10.7910/DVN/FVCGN8.
ACKNOWLEDGMENTS
For valuable feedback, we thank Gary Cox, Carles Boix, Mark Brilliant, Francisco Garfias, Christopher Ojeda, Adriane Fresh, Jeff Jenkins, Devesh Kapur, Marika Landau-Wells, Debra Leiter, Bryan Leonard, Tesalia Rizzo, Melissa Rogers, Pavi Suryanarayan, Jessica Trounstine, Steven White, Daniel Ziblatt, and seminar participants at: SAIS, Johns Hopkins University; Hoover Institution, Stanford University; WZB Social Science Center; PIPE workshop, University of Southern California; HPE virtual workshop; and APSA annual meeting 2020. Thanks to Osvaldo Valencia and Iven Morales for valuable research assistance. Thanks to Carlos Algara for sharing data and librarians at the National Archives for assistance with maps. Part of this research was completed while Aditya Dasgupta was a W. Glenn Campbell and Rita Ricardo-Campbell National Fellow at the Hoover Institution, Stanford University.
CONFLICT OF INTEREST
The authors declare no ethical issues or conflicts of interest in this research.
ETHICAL STANDARDS
The authors affirm this research did not involve human participants.


 Open access
Comments
No Comments have been published for this article.