


Introduction
The extreme paucity of hominin fossils and organic artefacts from the Lower Palaeolithic means that our understanding of early hominin culture, society and cognition is largely reconstructed from lithic technology, particularly handaxes. These bifacial tools first appeared in Africa around 1.76 million years ago (Mya) (Lepre et al. Reference Lepre2011), marking a departure, cognitively and physically, from the core and flake-based technology of the preceding Oldowan toolkit (Toth & Schick Reference Toth and Schick2018; Wynn & Gowlett Reference Wynn and Gowlett2018). Precisely what purpose(s) handaxes served—for example, whether they had a novel practical function or were an innovation that made certain tasks easier—has been the subject of extensive study and debate (e.g. de Mortillet Reference de Mortillet1883; Isaac Reference Isaac1977; Keeley Reference Keeley1981). The existence of hypertrophic ‘giant’ handaxes is often singled out as something different; their sheer size and weight making them functionally dubious (although functional explanations cannot be entirely ruled out).
Handaxes have been posited as a means of mediating social position within hominin societies, possibly through display (e.g. Gamble Reference Gamble1999: 125–41; McNabb Reference McNabb2007: 354; see also papers in Gamble & Porr Reference Gamble and Porr2005). Consequently, giant specimens factor heavily in social interpretations that look to establish the broader meaning behind handaxes. ‘Oddities’ from the British record, such as the Furze Platt and Shrub Hill giants, were central to Kohn and Mithen's (Reference Kohn and Mithen1999) provocative hypothesis that overlarge and symmetrical handaxes were used in Darwinian displays of male fitness. Spikins (Reference Spikins2012) relates these qualities to expressions of patience and thus trustworthiness. White and Foulds (Reference White and Foulds2018), meanwhile, approach high incidences of bilateral symmetry, often a feature of giant forms, from a different angle, using a neurological basis to suggest that hominins derived pleasure from producing a visually pleasing object. Similarly, Wynn and Berlant (Reference Wynn, Berlant, Overmann and Coolidge2019) suggest that ‘overdetermined’ handaxes, such as giants, might provide insight into the incipient aesthetic sensibilities of the handaxe makers. Giant handaxes might thus be understood to result from a peak shift response; the exaggeration of already pleasurable attributes (in this case, size) in order to elicit a heightened emotional response.
High levels of symmetry have often been discussed alongside gigantism in handaxe research; however, while recent studies have paid overdue attention to diachronic trends in symmetry (e.g. Hodgson Reference Hodgson2015; White & Foulds Reference White and Foulds2018; Hoggard et al. Reference Hoggard, McNabb and Cole2019), giants have largely been ignored. This article therefore seeks to address three key questions in our understanding of giant handaxes, while focusing on the British record:
1. What is the frequency of giant handaxes in Britain and can chronological patterning be detected?
2. What are the dominant morphologies of giant handaxes and is there a link between gigantism and high degrees of symmetry?
3. Can any patterns identified in Britain also be seen in European handaxe assemblages?
Materials and methods
The British Lower Palaeolithic record is well suited to answering questions of long-term non-directional trends in stone tool typology and technology. The Acheulean, of which handaxes are considered the fossile directeur, occurs in Britain from Marine Isotope Stage (MIS) 13 (~500 thousand years ago (kya)) at the latest, and as early as MIS 15 (~600kya) given the most recent dates from Fordwich and the Bytham River terraces (Davis et al. Reference Davis2021; Lewis et al. Reference Lewis2021; Key et al. Reference Key2022). During the Middle Pleistocene (781–126kya), global climatic oscillations produced a predictable pattern of colonisation, settlement and abandonment, with waves of hominins populating the British landscape during the warmer interglacials and abandonment or local extinction characterising the cooler glacial periods (White & Schreve Reference White and Schreve2000; Shipton & White Reference Shipton and White2020). These colonisation and localised extinction events have been associated with distinct, temporally constrained patterns within the British Acheulean record that may represent changes to culturally maintained handaxe morphology (Bridgland & White Reference Bridgland and White2014, Reference Bridgland and White2015; White & Bridgland Reference White, Bridgland, Pope, McNabb and Gamble2017; White et al. Reference White2018, Reference White, Ashton and Bridgland2019).
In order to explore the questions set out above, we obtained length data from a sample of 4160 handaxes from 47 Acheulean sites spanning MIS 15 to MIS 9. For the purposes of this article, we treat the numerical designation for each interglacial as shorthand for deposits covering the main warm peak and bracketed by the prolonged warming and cooling limbs evident in the marine isotope record (e.g. MIS 11 represents the MIS 12–11–10 cycle), with each cycle lasting roughly 100 000 years. Approximate dates for the warm phases of each stage relevant to this paper are as follows: MIS 15 ~610–560 kya; MIS 13 ~524–474 kya; MIS 11 ~427–364 kya; MIS 9 ~328–301 kya. While many of the sites selected are well-excavated and well-dated ‘flagship’ sites, others represent more mixed ‘dredger’ assemblages (e.g. Dunbridge; sensu Gamble Reference Gamble, Gamble and Lawson1996), are only tentatively dated (e.g. Whitlingham) or were subject to some degree of bias in collection and curation, not least for size (e.g. Furze Platt). These disadvantages cannot be ignored but are offset by the size of the dataset. A recent discovery of further giant handaxes in Britain since the acceptance of this article is acknowledged here (Ingrey et al. Reference Ingrey, Duffy, Bates, Shaw and Pope2023). These may potentially be of MIS 9 date but further work is required to verify this.
Symmetry data were generated for a subset of 2988 of these artefacts using Hardaker and Dunn's (Reference Hardaker and Dunn2005) FlipTest (v0.9). This provides each artefact with an Index of Asymmetry score, with lower scores indicating greater planform symmetry, to a minimum of 1 (i.e. perfect symmetry). Index of Asymmetry scores can then be converted into six symmetry classes, ranging from Class 1 (near perfect symmetry) to Class 6 (very low symmetry) (see online supplementary material (OSM) section 2). A full rationale behind the sites selected for the dataset, their age attribution and the methods used in the analyses is available in the OSM section 1.
Results
Distribution and frequency of giant handaxes in Britain
Figure 1 displays length data for the 4160 handaxes within our sample. The mean length is 115mm (±34mm). The normal distribution indicates that a small group of handaxes fall outside of the bell curve above approximately 220mm (around three standard deviations above the mean). As no clear definition is currently available as to what constitutes a giant handaxe, we use these findings as the basis of a rubric to divide the handaxes in our dataset into four length categories: small (<80mm), average (80–150mm), large (150–220mm) and giant (>220mm) (Table 1; see OSM section 2 for further details).
Histogram displaying the distribution of British Lower Palaeolithic handaxes according to length showing a normal distribution (red line). Each bin corresponds to 10mm increments (figure by Frederick Foulds).

Handaxes within the dataset grouped according to length class and divided according to MIS stage. *Note that the single giant handaxe associated with MIS 6 is the Stanton Harcourt giant, which is likely to be derived from older deposits.

Of the 42 handaxes classed as giants (Table 2), 33 can be confidently assigned to the MIS 10–9–8 climatic cycle, which marks the final expressions of the Acheulean in Britain. Of the remainder, five are from contexts that are presently undated but are potentially of MIS 9 date, a single example comes from an MIS 11 context, two from MIS 13 contexts and one is in a derived state within MIS 6 gravels and most probably originates from older deposits. This clearly demonstrates that while constituting only one per cent of the British Pleistocene archive, giant handaxes are most frequent in assemblages from MIS 9 contexts. This enhances the chronological patterning identified in Roe's morphometric groups (Roe Reference Roe1968; Bridgland & White Reference Bridgland and White2014, Reference Bridgland and White2015; White et al. Reference White2018). Giant handaxes predominantly occur in Roe's Group I (pointed, with cleavers) and Group III (plano-convex, i.e. Wolvercote), both associated with MIS 9. Giants also occur in the assemblage from Broom, on the Devon/Dorset border, in proportions comparable to other MIS 9 sites, although this assemblage defies classification in terms of Roe's groups. Most of the handaxes from this site are produced on Upper Greensand chert rather than flint and show a higher proportion of ovate and asymmetrical ‘lopsided’ handaxes compared to other MIS 9 assemblages (Hosfield & Green Reference Hosfield and Green2013).
Giant handaxes (>220mm) in the British Lower Palaeolithic in order of increasing length (see Table S1 for dating references).

Other than the giants, there is little visual difference in handaxe size between interglacials (Figures 2 & 3). Average size varies by only 10–20mm, although MIS 11 does have a higher percentage of small handaxes, while MIS 15 handaxes appear larger overall. A one-way analysis of variance (ANOVA) demonstrates that there is a statistically significant difference in handaxe length between the MIS stages (F(2) = 92.37, p = <0.001). Application of Tukey's honestly significant difference (HSD) post-hoc analysis found statistically significant pairwise differences between all the MIS stages under analysis (see Table S3). This confirms that handaxes associated with MIS 15 are, on average, larger than those from the other MIS stages, as Figures 2 and 3 suggest, and that handaxes associated with MIS 11 are, on average, smaller (see OSM section 3). We note, however, that our MIS 15 sample is based on two sites, Brandon Fields and Fordwich, the latter of which evidences the use of naturally elongated pipe-flint that may have fostered the production of larger, minimally worked bifacial tools. We are thus hesitant to suggest the pattern seen in MIS 15 is real until an increased dataset for this period is available.
A comparison of handaxe length in Britain between MIS 15, 13, 11 and 9. Handaxes are grouped into 10mm bins, as per Figure 1. The figure shows that there appears to be limited variation in the length of handaxes between MIS 13, 11 and 9, while MIS 15 displays a greater degree of larger handaxes (figure by Frederick Foulds & Mark White).

A comparison of handaxe length between MIS 15, 13, 11 and 9, with handaxes grouped according to length class. As per Figure 2, MIS 15 displays a greater proportion of handaxes in the large class, while small handaxes are much more limited. MIS 11 displays a greater proportion of small handaxes. Giant handaxes represent a very small percentage of the total assemblage, emphasising their status as extreme outliers beyond the usual variation in handaxe length (figure by Frederick Foulds & Mark White).

Additionally, the post-hoc analysis reveals that handaxes from MIS 13 and MIS 9 are, on average, larger than the intervening MIS 11, with handaxes from MIS 9 also being on average larger than those from MIS 13. The reason for this relationship between handaxe length and MIS, and whether it relates in any way to cultural differences concerning the recolonisation of Britain during each interglacial period, requires further testing that is beyond the scope of this article.
The majority of giant handaxes are from sites in the Thames Valley and its southern tributaries, although they are also found in the Norfolk Yare, the Axe Valley and Solent River deposits. They mostly occur in areas where primary chalk-flint outcrops were locally available (Figure 4), perhaps suggesting that one key factor in the production of giants may have been the abundance of large nodules, although this does not seem to have been an obstacle in flint poor areas upstream of the Goring Gap at Wolvercote and Stanton Harcourt (see below), nor does it seem to have inspired gigantism at older sites similarly situated near a good source of flint (e.g. Boxgrove, Elveden). The apparent absence of giant handaxes from the flagship MIS 9 Thames site at Stoke Newington represents a collection-bias issue. The original collector, Worthington Smith, gave away most of the largest and most attractive handaxes to distinguished visitors (White Reference White2023), some of which may now be found in collections outside the British Museum and some of which are lost. Smith illustrated several in his Reference Smith1894 book Man, the primeval savage, but the locations of most are currently unclear.
Geological map displaying the locations of sites with giant handaxes in relation to underlying bedrock geology, coloured as per the British Geological Society scheme. Colours for chalk bedrock are highlighted in the legend. Note that large clasts in overlying superficial deposits largely reflect local geology and ‘exotic’ raw materials would generally be smaller in size (map by Frederick Foulds, sources: ESRI, GTOPO30, Shuttle Radar Topography Mission (SRTM) and National Elevation Data (NED) data from the USGS. Contains British Geological Survey materials © NERC 2023 published under the Open Government Licence v3.0).

The typology of giant handaxes
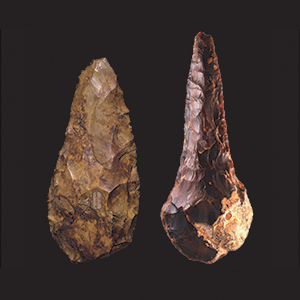
Thirty-five (83%) of the giant handaxes identified in the British record are pointed in form, predominantly lanceolate or ficron types (Figure 5). Ficrons are rare forms characterised by a pointed planform with biconcave edges (Figure 6), which have been identified as part of a typological pairing with chisel-ended cleavers (Roe Reference Roe1968; Cranshaw Reference Cranshaw1983) that is now argued to be chronologically restricted to MIS 9 (Wenban-Smith Reference Wenban-Smith2004; Bridgland & White Reference Bridgland and White2014, Reference Bridgland and White2015; Davis et al. Reference Davis2016; White & Bridgland Reference White, Bridgland, Pope, McNabb and Gamble2017; White et al. Reference White2018). Possible reasons for the connection between gigantism and pointed/ficron forms are discussed below, but it is important to note that while many giants are ficrons, not all ficrons are giants; overall ficrons range in length from 63 to 307mm.
Frequency of morphological types represented by handaxes classified as ‘giant’ (≥220mm; n = 42) (figure by Frederick Foulds).

Examples of giant pointed and ficron handaxes: A) the ‘Beast of Biddenham’ (length = 253mm); B) a giant ficron from Canterbury West (length = 285mm) (photographs courtesy of the British Museum (A) and The Seaside Museum, Herne Bay (B)).

Gigantism and symmetry
In order to investigate whether handaxe symmetry increases with size, we focus primarily on MIS 9, as this is the period in which most giant forms within the dataset fall and for which the greatest amount of symmetry data was available. A simple scatter plot of length versus Index of Asymmetry scores for MIS 9 handaxes indicates that there is a great deal of variation in the sample (Figure 7) (see OSM section 4 for details of symmetry analysis), although there is a weak negative correlation between length and Index of Asymmetry score (r(2352) = −.16, p = <0.001), suggesting, to some extent, that as size increases handaxes become more symmetrical.
Scatter plot comparing length and AI scores for 2354 British MIS 9 handaxes. The trend line indicates an R2 value of 0.02 (figure by Frederick Foulds & Luke Dale).

When MIS 9 handaxes are assigned to size categories, the pattern of increasing symmetry with size is further emphasised (Figure 8). A one-way ANOVA demonstrates a statistically significant difference between the AI scores of the different length categories (F(2) = 14.13, p = <.001). A Tukey's HSD post-hoc analysis shows significant pairwise differences in Index of Asymmetry scores between giant and average-sized handaxes, with an average difference in Index of Asymmetry scores of -1.80 (p = <0.01), and also between large and average-sized handaxes, with an average difference of -0.63 (p = <0.001). In both cases this indicates that handaxes within the larger size categories have lower AI scores (and thus increased symmetry). There is no statistically significant difference in Index of Asymmetry scores between average-sized and small handaxes. Although the available symmetry dataset for MIS 15–11 is much smaller, and suffers from inherent biases, it is noted that MIS 11 displays a similar trend to MIS 9 (see OSM section 4 for further discussion).
Stacked bar chart displaying the percentage frequency of symmetry classes within each of the four size classes, which appears to indicate an increase in the frequency of handaxes falling into symmetry classes 1–3 (virtually perfect to high symmetry; see OSM 2) as size increases (figure by Frederick Foulds).

The higher levels of symmetry seen in large and giant handaxes during MIS 9 and MIS 11, however, belies the overall trend in symmetry in the British record (White & Foulds Reference White and Foulds2018; Hoggard et al. Reference Hoggard, McNabb and Cole2019). Symmetry within the wider handaxe assemblage is highest during MIS 13 and 11, when the modal symmetry class is 2 (very high levels of symmetry) compared to 6 (very low levels of symmetry) for MIS 9 (Figure 9). This might indicate that appearance and finesse was only a concern for MIS 9 hominins when large handaxes were being made, although it is equally clear that symmetry is an extremely variable quality with many smaller examples also reaching high levels of symmetry. Only the smallest (<100mm in length) and most roughly or quickly made handaxes tend to fall into the lowest symmetry classes.
A comparison of the percentage frequency of handaxes falling into each symmetry class within MIS 15–9 (figure by Frederick Foulds).

Discussion
Giant handaxes have been frequently cited in key discussions of hominin culture, society and cognition. Our data show that they became more prevalent in Britain just prior to the Lower–Middle Palaeolithic transition (~300–250kya). This period in Britain has already been established as a period of increasing archaeological complexity, with the regional picture showing a succession of stone tool industries that starts with a non-handaxe phase, followed by the appearance of handaxes and then a final phase in which apparently hierarchical core working (also known as proto-Levallois) becomes more prolific (Bridgland et al. Reference Bridgland2013; Bolton Reference Bolton2015; White & Bridgland Reference White, Bridgland, Pope, McNabb and Gamble2017; Rawlinson Reference Rawlinson2021; Rawlinson et al. Reference Rawlinson, Dale, Ashton, Bridgland and White2022). The attribution of giant handaxes to MIS 9 adds to this complexity.
The presence of giant handaxes seems unrelated to local raw materials. Some have been found long distances from suitable raw material; for example, at Wolvercote and Stanton Harcourt, on the Thames terraces west of the Goring Gap, a region lacking both bedrock flint and large, high-quality flint clasts (MacRae Reference MacRae1987; Bridgland Reference Bridgland1994). Good-quality raw material was located some 25–40km away, indicating that either flint nodules or, more likely, finished handaxes were deliberately carried to these sites (Lee Reference Lee2001; Ashton Reference Ashton2008). This can be compared to evidence of longer raw material transfer distances at Caune de l'Arago, France (Wilson Reference Wilson1988)—another site from which a giant has been recovered—indicating a significant investment in time and energy that far exceeds that involved in the more typical Lower Palaeolithic transfer distances of less than 5km (Féblot-Augustins Reference Féblot-Augustins1993). The need for handaxes more generally within areas with a paucity of suitable raw material emphasises the potential for the presence of giant handaxes to have carried some additional meaning or ‘value’, perhaps extending beyond the ‘performative’ aspects of their production (cf. Gamble Reference Gamble1999: 125–141; McNabb Reference McNabb2007: 354; see also papers in Gamble & Porr Reference Gamble and Porr2005). Another possibility is that giant handaxes were produced at distant raw-material sources with the intention of an extended use-life through progressive resharpening, which may have led to the distinctive plano-convex form of several Wolvercote handaxes (Ashton Reference Ashton2008). When considered through this lens, the giant Wolvercote handaxes may represent tools that had been prematurely discarded and, consequently, were less intensively reduced.
That giant handaxes are often ficrons, a type otherwise rare in Britain, is also worthy of note. Large, symmetrical ficrons are visually striking objects, with that from Canterbury West described as “magnificent” by the collector and antiquarian Armstrong Bowes, and the Cuxton giant as “flamboyant” (Wenban-Smith Reference Wenban-Smith2004: 14; Knowles Reference Knowles2023). The relationship between size and ficron morphology is unclear but could indicate a desire to maintain length while reducing width in the upper and central portions of the handaxe. This may have taken place in order to correct errors in planform symmetry or to extend use-life through resharpening (Davis et al. Reference Davis2016). Studies of Acheulean assemblages have shown that those with high mean length tend towards being narrower (Gowlett Reference Gowlett2013) and it has been suggested that the narrowness of longer bifaces may have been introduced to control weight (Crompton & Gowlett Reference Crompton and Gowlett1993; Gowlett Reference Gowlett, Gamble and Porr2005). Alternatively, ficrons may represent an inherent design choice, decided upon before flaking began for reasons that are now lost to us. As Gowlett (Reference Gowlett2013) notes, the decision to create an elongated form must have been deliberate due to the special effort required to produce them; with no more than 5–10 per cent of Acheulean handaxes displaying pronounced elongation, the suggestion that forms, such as ficrons, may have had some type of inherent meaning must be considered. In any case, there is a clear and intriguing association between extravagant form, large size and high symmetry that seems to transcend purely technical functionality and approaches artistry.
While giant handaxes have been described as essentially functionless objects, experiments have shown that replicas exceeding the largest British giant can still be used effectively (Key & Lycett Reference Key and Lycett2016); giants could also have been used two-handed (Crompton & Gowlett Reference Crompton and Gowlett1993), as digging tools (Khaksar & Modarres Reference Khaksar and Modarres2024) or as static implements across which materials were drawn (Foulds et al. Reference Foulds2017). Nevertheless, when considering their unusual forms and high symmetry, it seems likely that British giant handaxes had some enhanced meaning beyond their basic functionality (e.g. Kohn & Mithen Reference Kohn and Mithen1999; McNabb Reference McNabb2007; Spikins Reference Spikins2012).
Wynn and Berlant (Reference Wynn, Berlant, Overmann and Coolidge2019) suggest that the 1.7Mya giant handaxe from the African Olduvai FLK West site was probably the product of an individual producing a form that was personally gratifying with no consideration of community-based aesthetic judgement: in essence, it did not form part of a normative social tradition and was either idiosyncratic or potentially produced with another (single) individual in mind. Community-based standards in aesthetics appear to have emerged much later, tentatively around 500 000 years ago (500kya), as indicated by an increased attention to features such as twisted profiles and the rare use of ‘framing’ effects to preserve fossils on areas of cortex (White et al. Reference White, Ashton and Bridgland2019; Wynn & Berlant Reference Wynn, Berlant, Overmann and Coolidge2019). The interest in producing giant handaxes may reflect an aesthetic peak shift, or an exaggeration of pleasing visual qualities (in this case, symmetry and size). For White and Foulds (Reference White and Foulds2018), the peak-shift effect was linked to a sensory pleasure-reward system associated with the production of any handaxe (perhaps relating to their associations with pleasurable activities, such as food production and social contact), which were in turn heightened by the production of peak-shifted ‘rarities’, including giants. As well as the increased ‘kick’ enjoyed by the maker, such objects may also have inspired awe or fear in observers (cf. Spikins Reference Spikins2012).
Giant handaxes may also have had a semiotic role. Pope and colleagues (Reference Pope, Russel and Watson2006: 54) suggested that discarded handaxes had stigmergic qualities—displaying an unintentional organisation—and that their structured discard in the natural environment could mark “game intercept opportunities, freshwater or other resources”. It is easy to imagine that the visually striking giants would have served particularly well in this role; the structured discard of such objects may have facilitated a ‘release from proximity’, or the ability to maintain social ties remotely through the use of these tools as an intermediary (Pope et al. Reference Pope, Russel and Watson2006: 53).
The presence of giant handaxes earlier in the Lower Palaeolithic and across the Acheulean world demonstrates that the ability and desire to produce them pre-dated MIS 9 and is not exclusive to Britain. At Caune de l'Arago, in southern France, a finely made, 330mm-long lanceolate handaxe was excavated from layer P, dating to MIS 14 (Barsky & de Lumley Reference Barsky and de Lumley2010). De Mortillet (Reference de Mortillet1883) noted several handaxes longer than 230mm in younger deposits (~MIS 11 and 9) from northern France—three from St Acheul (Somme), one from Thennes (Somme), two from Vaudricourt (Pas-de-Calais) and two from Montguillain (Oise)—although vague provenance and the complex nature of the terrace deposits means that none of these can be more securely dated. Occasional giants have also been found in the Levant and Middle East, such as the 220mm roughout from Qesem cave in Israel, dating to 420–200kya (Barkai et al. Reference Barkai, Gopher, Solodenko and Lemorini2013), while a 265mm-long basalt handaxe was found at Wadi Dabsa, Saudi Arabia (Foulds et al. Reference Foulds2017). A more persistent production of large handaxes, picks and cleavers has been recognised at Porto Maior in north-west Spain, dating to MIS 8–7, suggesting African affinities (Méndez-Quintas et al. Reference Méndez-Quintas, Santonja, Pérez-González, Duval, Demuro and Arnold2018). Foulds et al. (Reference Foulds2017) usefully recorded 23 assemblages from Africa, where the longest handaxe from Olduvai is 330mm (TK LF, Bed II, 1.4 Myr; Tanzania), from Isenya is 253 mm (level VI, 700kya; Kenya) and from Kalambo Falls is 350mm (B5, 300kya; Zambia). Other sites in southern Europe and the Levant have also been compared to the African Acheulean record (e.g. Moncel et al. Reference Moncel2015), where there is a greater emphasis on cleavers, picks and larger handaxes that are often made on flakes and classified under the broader term ‘Large Cutting Tools’.
The phenomenon in Britain during MIS 9, however, displays a rather different technological approach over a limited period, with greater adherence to symmetry and form. This is highlighted by comparison with contemporaneous sites in western Europe. For France, the Somme Valley provides the closest comparisons (Lamotte & Tuffreau Reference Lamotte and Tuffreau2016). The assemblage from Cagny l'Epinette has 33 handaxes, with the largest less than 170mm in length, while Revelles has 52, all under 190mm. The slightly older assemblage (MIS 10) from Ferme de l'Epinette has 31 handaxes, all smaller than 180mm. In the Paris Basin, the complex at Soucy is attributed to MIS 9 (Lhomme Reference Lhomme2007). The rich assemblage from site 3 (level P) contains 178 handaxes with a maximum length of 155mm, and no specimen from the other Soucy sites exceeds 180mm (Lhomme, pers. comm.). The sequence at Orgnac in the Ardèche dates from MIS 10 to 8 and the 79 handaxes are all less than 200mm in length (Moncel et al. Reference Moncel, Moigne and Combier2012; Moncel pers. comm.). In Brittany, at Menez-Dregan, levels 5 and 6 have been dated to MIS 9 (Ravon et al. Reference Ravon, García-Medrano, Moncel and Ashton2022). All 29 handaxes are under 160mm in length (García-Medrano, pers. comm.), although intractable raw materials of predominantly sandstone and microgranite beach pebbles are probably responsible for their comparatively small size.
Raw materials may also be a factor at Atapuerca (northern Spain), where Gran Dolina (TD10.1) and Galería (II and III) are broadly attributed to MIS 9 and MIS 11–8, respectively. At both sites, a mix of quartzite, sandstone and Neogene chert were used for handaxe manufacture, often with the use of flakes as blanks. None of the 63 handaxes exceeds 180mm in length (García-Medrano et al. Reference García-Medrano, Moncel, Maldonado-Garrido, Ollé and Ashton2023; García-Medrano pers. comm.).
The increased production of giant handaxes during MIS 9 in Britain appears to reflect a distinctive material culture unique to the region, one of many small-scale variations on the broader Acheulean technocomplex present in a ‘cultural mosaic’ across northern Europe from around 600kya, which permitted social cohesion within groups occupying large high-latitude ranges (Ashton & Davis Reference Ashton and Davis2021). Further analysis of sites beyond those discussed above is needed to identify any similarities or differences between the British and European records in terms of chronological patterning and typological preferences.
Conclusion
Giant handaxes appear to be a phenomenon that increased in importance with the final expressions of the Acheulean in Britain, particularly in assemblages dating from MIS 9, immediately before the Lower–Middle Palaeolithic transition. They were typically pointed or ficron in type and were generally highly symmetrical. The attention paid to ‘superfluous’ size and symmetry, the extravagant shape of many of the large ficrons and the occasional evidence of anomalously long material transfer distances strongly suggest that giant handaxes were objects imbued with additional meaning or value. As previously suggested, this value may have been personal, social or cultural; the great size and unusual shape may have appealed to incipient aesthetic tastes, representing a ‘peak shift’ in design through the exaggeration of size.
Acknowledgements
Luke Dale would like to thank Chen Shen (Royal Ontario Museum), Imogen Gunn (Cambridge Museum of Archaeology & Anthropology) and Nicholas Crowe (Pitt Rivers Museum) for providing access to their collections. For information on the sites, we would also like to thank Vincent Lhomme (Soucy), Paula García-Medrano (Brandon Fields, Menez-Dregan and Atapuerca) and Marie-Helene Moncel (Orgnac).
Funding statement
The research undertaken that forms this article was partly funded by RCUK AHRC doctoral scholarships awarded to LD (AH/L503927/1) and AAR (AH/R002444/1), as well as the AHRC-funded major research project “Digital Technologies, Acheulean handaxes and the Social Landscapes of the Lower Palaeolithic” (AH/W009951/1). NA also acknowledges the funding of the Pathways to Ancient Britain project by the Calleva Foundation.
Data statement
Data underpinning this research is available from the authors on request.
Supplementary material
To view supplementary material for this article, please visit https://doi.org/10.15184/aqy.2024.30.


 Open access