


Introduction
The geodetic mass balance is the change in net mass of a glacier or glaciated region determined through elevation comparisons. There are many studies outlining the approach of using elevation data to estimate mass balances (Reference FinsterwalderFinsterwalder, 1954; Reference EchelmeyerEchelmeyer and others, 1996; Reference Andreassen, Elvehøy and KjøllmoenAndreassen and others, 2002; Reference Cox and MarchCox and March, 2004). Comparisons of geodetic and traditional mass balances on the same glacier have demonstrated that the two methods can lead to different values (Reference KrimmelKrimmel, 1999; Østrem and Haakensen, 1999). However, errors associated with the traditional mass balance tend to be systematic, making a geodetic balance more accurate over longer periods (Reference Cox and MarchCox and March, 2004), and in some studies (e.g. Reference Elsberg, Harrison, Echelmeyer and KrimmelElsberg and others, 2001) the geodetic balance is used to adjust the traditional balances.
The use of elevation changes to determine glacier and ice-cap mass balance has become more prevalent with the increasing number of available altimetry measurements, made from either aircraft or satellites (Reference Arendt, Echelmeyer, Harrison, Lingle and ValentineArendt and others, 2002; Reference Bamber, Krabill, Raper, Dowdeswell and OerlemansBamber and others, 2005). However, the time periods for these recent measurements are restricted to the past few decades, at most, while longer-term comparisons are needed to relate glacier change to climate variation. Often, the only recourse is to analyze elevation changes from older maps, despite their poor precision compared to more recent products. Nonetheless, they remain the only possible data source for shedding light on previous glacier geometries without re-performing the original photogrammetry, a significant undertaking.
Svalbard has about 36 000 km2 of glaciers of various types (ice fields, outlet, tidewater and smaller cirque glaciers), the majority of which are polythermal (Hagen and others, 1993). Climate on Svalbard varies spatially (Reference Hagen, Liestøl, Roland and JørgensenHagen and others, 1993, 2003), with an interior characterized by lower precipitation amounts compared to the coastal regions (Reference Winther, Bruland, Sand, Killingtveit and MarechalWinther and others, 1998; Reference HumlumHumlum, 2002). The instrumental climate record for Svalbard, from Longyearbyen, is relatively short, extending not much earlier than 1911 (Reference Nordli and KohlerNordli and Kohler, 2003). During the 20th century, temperatures gradually rose, and the retreat of Svalbard glaciers from their Last Glacial Maximum position occurred sometime after about 1920 (Reference Nordli and KohlerNordli and Kohler, 2003).
The net mass balance for the whole of Svalbard has recently been assessed using two different methods (Reference Hagen, Kohler, Melvold and WintherHagen and others, 2003a, Reference Hagen, Melvold, Pinglot and Dowdeswellb), yielding estimates between –0.27 and –0.12ma–1w.e. Reference Bamber, Krabill, Raper, Dowdeswell and OerlemansBamber and others (2005) have suggested an increased thinning rate in recent years based on repeat aerial surveys in 1996 and 2002. However, there is at present no long-term baseline reference for these elevation change comparisons. In this study, we compare older maps of Svalbard to modern digital elevation models (DEMs) to derive average elevation changes over a significantly long time interval (1936/38–1990).
Data
The oblique photographic aerial surveys of 1936/38 made by the Norwegian Polar Institute (NPI) were the basis for the first accurate topographic maps of Svalbard. Contour maps were created at a scale of 1 : 100 000 with 50m contour intervals from the oblique aerial photographs, which were taken at approximately 3000ma.s.l. During the 1990s, NPI hand-digitized the older maps, such that the contours are stored digitally as a series of northing and easting points at the measured 1936/38 elevations.
The accuracy and precision of the 1936/38 maps is limited, due to the technology available at the time and to the relatively high flying height. The accuracy of glacier contours varies by elevation, with upper elevation contours less accurate than for the lower elevations. This is due in part to the flight plan, which was preferentially around the coast looking inland, such that the distance to the image point of the higher-elevation areas was typically greater, and to the lower contrast in the upper regions of glaciers.
The most recent complete aerial survey over Svalbard was carried out by NPI in late summer 1990, and comprises vertical aerial photographs at a scale of 1 : 50 000. A DEM based on these aerial photos is in the process of being created by NPI using a modern digital photogrammetric workstation. The DEM is incomplete at this writing, however, so the study region is restricted to those areas for which the photogrammetric work is completed. The resolution of the DEM is 20m and it has a horizontal accuracy of ±2–3 m.
Method
The early maps were created using the European Datum 1950 (ED50), and therefore had to be converted to World Geodetic System 1984 (WGS84), the datum for the 1990 DEM. We use a regional transformation available in ESRI ArcGIS; while more accurate local conversion is available based on comparing older NPI ED50 control point coordinates to newer WGS84 positions (obtained through differential global positoning system (GPS)), the ArcGIS conversion is adequate and does not lead to appreciable errors.
Each digitized point of the 1936/38 contours is then interpolated into the pixels of the 1990 DEM using bilinear interpolation. This yields a database of irregularly spaced points with two elevation attributes which are differenced and spatially interpolated (Reference HutchinsonHutchinson, 1989) to create two-dimensional maps of elevation change. Elevation changes are converted into volume changes through a hypsometric approach, similar to the traditional mass-balance calculation when balances are assumed to be functions of elevation (Oerlemans and Hoogendoorn, 1989; Østrem and Brugman, 1991). Mean elevation changes are determined for each elevation bin by averaging interpolated pixels.
The relationship between elevation changes and traditional balance at a point is defined by:

where h is elevation, b is the net specific mass balance and q
i are the ice fluxes in the x and y directions (Reference PatersonPaterson, 1994). Integration of Equation (1) over the entire glacier surface results in the flux terms cancelling (assuming steady state), so elevation changes can be converted into geodetic balances independent of dynamics. Although an ice mass is rarely in steady state, it is feasible to assume this condition as the magnitudes of the elevation changes are much larger than the ice fluxes (Reference PatersonPaterson, 1994). The integrated term on the lefthand side of Equation (1) is the geodetic balance,  and is then equivalent to the traditional mass balance on the righthand side.
The geodetic balance, is obtained by first calculating the total volume change by summation of the average elevation changes weighted by the glacier hypsometry (area–elevation distribution):
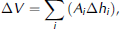
where Δhi is the average elevation change, Ai is the area and i is the corresponding altitude interval. The hypsometry from the map with the larger glacier area should be used. The cumulative net geodetic balance is then derived by dividing the volume changes by the average of both areas (Reference FinsterwalderFinsterwalder, 1954; Reference EchelmeyerEchelmeyer and others, 1996; Reference Arendt, Echelmeyer, Harrison, Lingle and ValentineArendt and others, 2002) to account for glacial retreat or growth.
The 1936/38 and 1990 aerial surveys were completed in late summer, although the exact timing varies by area. Some workers apply a correction to account for ablation and emergence during the period between the photographic dates (Reference Krimmel and OerlemansKrimmel, 1989, Reference Krimmel1999; Reference EchelmeyerEchelmeyer and others, 1996; Reference Andreassen, Elvehøy and KjøllmoenAndreassen and others, 2002; Reference Cox and MarchCox and March, 2004). In our case, the relatively large magnitude of the elevation changes over the 54 year time interval and the low mass turnover of Svalbard glaciers (Hagen and others, 2003b) implies that the correction factor will be negligible in light of the overall changes.
Another adjustment commonly included in geodetic balance calculation is for changes in the firn density profile (Reference Krimmel and OerlemansKrimmel, 1989; Reference Sapiano, Harrison and EchelmeyerSapiano and others, 1998). We assume that in steady-state conditions the density profile from the surface to the firn/ice transition is constant through time (Reference BaderBader, 1954) such that the elevation changes are composed completely of ice, and a single density of 0.9 kgm–3 can be used. This assumption is weakest in the transition area between the accumulation and ablation zones, for cases in which either the mean or transient equilibrium-line altitude (ELA) is significantly different in the two epochs. However, given that no measurements of firn density are available for the older epoch, and the relatively long baseline, we prefer to assume constant density rather than introduce artificial assumptions about its temporal and spatial fluctuations. The results in this study will all be in ice equivalent units unless otherwise stated.
Errors
The error of an elevation change determined from two maps depends on a number of factors, including the quality of the original photography, spatial and geodetic transformations, the scale of the imagery (related to the flying height), the accuracy of the geodetic referencing network, and of course the skill of the photogrammetrist (Reference AndreassenAndreassen, 1999).
We use point elevation differences over non-glacier land areas to quantify the elevation errors associated with glacier changes. We assume that the majority of errors derive from the 1936/38 map, since it is based on high-oblique photography with lower quality and the higher flying height, and therefore take the 1990 DEM as the more reliable of the two epochs. Elevation differences over non-glacier areas can be explained by a geolocation (horizontal) error in either or both of the maps. The elevation error that results from geolocation errors is the product of the horizontal error and the tangent of the slope angle (Reference EchelmeyerEchelmeyer and others, 1996); the greater the slope of the surface, the greater the apparent elevation error.
A further consideration is to ascertain whether the 1936/38 contours are actually determined from the aerial photography, for in some areas it is apparent that contours are hand-drawn with no reference to actual photogrammetric measurements. These infilling contours are simply crude estimates made for the sake of completing the map and cannot be used to determine elevation changes. The ESRI ArcGIS ‘Viewshed’ function uses a DEM and a vector of observer or camera location points to determine the number of such observer points visible in a particular pixel. A Viewshed analysis was performed on the 1936/38 aerial survey by digitizing the approximate x and y coordinates for each of the photograph points in the 1936/38 imagery. Seven parameters are required to for the Viewshed function, including the locations, viewing angles and elevations of the observer points (ESRI ArcGIS).
The resulting Viewshed image (Fig. 1) assesses the relative quality of the aerial survey; the greater the Viewshed parameter, the better the photographic coverage of the area. The Viewshed grid is then used to filter out pixels that are not visible from the photographs. There are apparently a number of non-visible areas, some the result of mountain shadowing, but some due to the search radius parameter chosen, which limits the distance from each observer point that the function searches. A larger search radius decreases the non-visible areas significantly; experimentation in test areas revealed that 15 km was a reasonable radius choice.
Viewshed map for the 1936/38 images. The greyscale represents the Viewshed parameter, the number of aerial photographs (points) which can see individual pixels in the DEM. The darker the pixels, the better the aerial coverage from the photographs.

Figure 2 shows the relation between the non-glacier elevation differences (errors) with both slope and Viewshed. There is a distinct pattern of decreasing means and standard deviations with decreasing slope and increasing values of the Viewshed parameter. To characterize the map errors, we filter the population of non-glacier land differences to remove points with slopes greater than 20˚ and Viewshed values less than two images, to make them representative for glacier areas. Application of the filter decreases the variance of the non-glacier point elevation changes by ~35%. After filtering, the average non-glacier land elevation difference is –3.1 m, with a standard deviation of 12.2 m (Table 1).
The relationship between absolute value of the non-glacier elevation differences as a function of (a) DEM slope in degrees and (b) Viewshed parameter. (a) is a box-and-whisker plot. The box has lines at the lower quartile, median and upper quartile values which represent 50% of the data. The whiskers display the extent of the rest of the data. Outliers are plotted as points. The notches represent the uncertainty about the means.

Non-glacier point elevation difference statistics for seven regions. The mean difference is the systematic bias used to adjust elevation change curves. The standard deviation, ɛ, is the individual point elevation accuracies, while ɛ V and ɛ B are the error estimates for volume change and cumulative balance, respectively

Table 1 shows error estimations for each region, giving the mean non-glacier land elevation differences, the error for the cumulative geodetic balances (area-weighted average elevation change) and for the volume changes. The mean difference is the bias between maps, which is used to adjust the final elevation change curves. Little bias is apparent in the north and west regions analyzed, while a significant bias exists from Nordenskiöld central and southwards. This is attributed to ground-control point errors used in the creation of the 1936/38 contour maps. The standard deviation about the mean (ɛ) represents the uncertainty within an individual point elevation change. To propagate the uncertainties into error estimates for volume change and cumulative geodetic balance, a standard error (Equation (3)) is applied to each elevation bin,

where N represents a measure of the sample size. There is significant spatial autocorrelation for the non-glacier land differences, so simply taking N as the number of digitized contour points leads to error underestimation. Analysis of semivariograms revealed that spatial autocorrelation exists at distances of up to ~500 m, which translates into four uncorrelated measurements per km2. Conservatively, we assume that only one uncorrelated measurement occurs within 1 km2, and, as such, N becomes the area (in km2) of each elevational bin (i.e. the number of measurements in an elevation bin). Volume change error, ɛ V, is then the summation of the standard errors multiplied by the hypsometry of each region:

Similarly, the error associated with the area-average elevation change, ɛ B, is simply the volume change error divided by the average of both areas, A. This approach emphasizes the reduction in error that occurs through the summation of large spatial areas while accounting for the spatial autocorrelation.
Results
Western Svalbard
There are mostly small valley glaciers in Brøggerhalvøya, Oscar II Land and Prins Karls Forland (Fig. 3), totalling about 520 km2 (1936/38). The glaciers of Brøggerhalvøya/Oscar II Land are generally polythermal cirque glaciers (Reference LiestølLiestøl, 1988), whereas piedmont glaciers dominate Prins Karls Forland (Reference Hagen, Liestøl, Roland and JørgensenHagen and others, 1993). Some larger glaciers, Uversbreen, Comfortlessbreen and Aavatsmarkbreen, are included within the analysis. However, the Viewshed parameter for these areas shows that the photographic aerial coverage is very poor, so that some of the difference data are removed. The well-studied glaciers Kongsvegen and Kronebreen are not included, as the 1990 DEM coverage does not extend to these regions yet.
Elevation change map over parts of Svalbard (1936/38–1990) showing the divisions of the seven regions used in this analysis. The grid references are WGS84 UTM zone 33 north.

Brøggerhalvøya/Oscar II Land experienced a 12% glacial area decrease while Prins Karls Forland experienced a 30% glacier area decrease (Table 2). All glaciers of the regions are retreating, with a maximum of 100 and 145m frontal thinning for Brøggerhalvøya/Oscar II Land and Prins Karls Forland, respectively. Many of the smaller glaciers have experienced elevation losses across the entire surface of the glacier, including all of Prins Karls Forland (Fig. 4). A trend toward glacier thickening at the upper elevations is apparent moving eastward within the regions.
Elevation change map of northwest Svalbard (Brøggerhalvøya/Oscar II Land (east) and Prins Karls Forland (west)). The shaded region indicates areas where the Viewshed parameter is 0 or 1, which were removed from the analysis.

Area, volume change and mass balances for the seven regions. All estimates are given in ice equivalent units

The hypsometric (area–altitude) distribution for Brøggerhalvøya/Oscar II Land is greatest between 250 and 550ma.s.l., with the 54 year average ELA (position where the elevation change curve approaches zero) at 350m (Fig. 5a). The greatest hypsometric weight controlling the mass balance of the region therefore is at a high enough altitude to maintain accumulation and firn. Prins Karls Forland, on the other hand, has most of its glaciated area at lower altitudes (50–250 m), with the entire elevation change curve below zero (Fig. 5a). The glaciers of Prins Karls Forland are generally downwasting, with an annual geodetic balance three times more negative than Brøggerhalvøya/ Oscar II Land. The latter may be attributed to its more coastal location, as well as having a lower hypsometric distribution making the region more sensitive to temperature increases.
Elevation change curves and hypsometry for (a) northwest Svalbard: Brøggerhalvøya/Oscar II Land (BO) and Prins Karls Forland (PK); (b) central Svalbard: Nordenskiöld west (NW), Nordenskiöld central (NC) and Heer Land (HL); (c) south Svalbard: Nathorst Land (NL) and Wedel Jarlsberg Land (WJ).

Central Svalbard
Central Svalbard is characterized by relatively high precipitation at the coasts and the drier conditions inland (Reference Winther, Bruland, Sand, Killingtveit and MarechalWinther and others, 1998). This is apparent when looking at the distribution and size of glaciated areas, where the east coast (Heer Land) is highly glaciated, 68%, while Nordenskiöld central and west consist of 19% and 18% glaciers, respectively. The east coast also consists of ice caps and outlet glaciers, while Nordenskiöld central and west contain mainly small valley and cirque glaciers.
Nordenskiöld west decreased in glacial area by ~25%, while the majority of glaciers in the region have decreased in elevation across their surfaces, including the larger Grønfjordbreen. Fridjovbreen is the only glacier with significant elevation increases. It is a surge-type glacier, however, that recently surged in 1995 (Reference Murray, Luckman, Strozzi and NuttallMurray and others, 2003), 5 years after the end of the elevation change period (1936–90) in this study. We note that the clear trend of glacial build-up from 1936/38 to 1990 (Fig. 6) confirms the relative accuracy of the estimated changes from these two maps.
Elevation changes in central Svalbard (central and west Nordenskiöld and Heer Land regions). Note that the east coast experienced significant elevation increases and five of the eight glaciers that surged (pre- and post-1990) occur in this region.

Nordenskiöld central has similarly decreased in glacial area by ~20%. Slight elevation increases occur on the two larger ice fields containing Slakbreen and Drønbreen. Heer Land glacier areas decreased by ~15%, where all glaciers have retreated from their 1936/38 positions despite the fact that some glaciers surged. Nonetheless, interior areas show significant elevation increases (Fig. 6), which can be attributed to westward-moving winter low-pressure systems that deposit the largest snow amounts (Reference Winther, Bruland, Sand, Killingtveit and MarechalWinther and others, 1998). The annual geodetic balance of –0.16ma–1 is the least negative out of all the regions in this study.
Analysis of the elevation change curves (Fig. 5b) leads to two conclusions about the glacial (and climatic) regionality of central Spitsbergen. First, Nordenskiöld central has the highest ELA, at ~850ma.s.l., implying a drier climate than the other two regions. Second, the elevation change gradient is steepest for Heer Land, in comparison to the other two regions of central Svalbard, implying more dynamic glacial behaviour since steeper mass-balance gradients indicate greater mass turnover (Østrem and Brugman, 1991). In fact, all glaciers on Heer Land show elevation increases in their upper regions, while five glaciers have surged before and after 1990.
There is ample evidence of the geometric effects of surging in Heer Land. Surging glaciers are characterized by long quiescent and short surge phases. During the quiescent phase, the accumulation area increases in elevation while the ablation area decreases. The short surge period is characterized by rapid mass flow of ice down-glacier, resulting in elevation decreases in the accumulation area and increases in the ablation area.
Bakaninbreen surged in the late 1980s (Reference Murray, Dowdeswell, Drewry and FrearsonMurray and others, 1998), leading to a distinct pattern seen in Figure 6. The central part of the glacier experienced increases of up to 100 m, coinciding with the location of the surge termination just downstream of the 90˚ bend in the glacier (Reference Murray, Dowdeswell, Drewry and FrearsonMurray and others, 1998), while the accumulation area of the glacier decreased in elevation from the transfer of mass during the surge. Thomsonbreen and Hyllingbreen display a similar surge pattern, with elevation decreases in the upper regions and increases in the lower regions. The pattern is not as distinct as on Bakaninbreen, since the Thomsonbreen surge occurred from 1950 to 1960 and the Hyllingbreen surge from 1970 to 1980 (Reference Hagen, Liestøl, Roland and JørgensenHagen and others, 1993), allowing some elevational adjustment in the decades before the 1990 DEM was created. Richardsbreen, a tidewater glacier in 1936/38, shows the largest decreases at the front, with increases at the upper elevations, another example of surge-glacier build-up. Richardsbreen later surged sometime between 1990 and 2002 (NPI, 2006). Most recently, Skobreen surged in 2004–05, while the 1936/38–1990 changes show similar build-up patterns.
Southern Svalbard
The southernmost regions receive the largest amounts of precipitation on Svalbard (Reference Winther, Bruland, Sand, Killingtveit and MarechalWinther and others, 1998), and also contain the largest glaciated area analyzed in this study. The glacier area on Nathorst Land decreased 22%, where the majority of ice loss stems from one large tidewater glacier, Doktorbreen. Elevation decreases of up to –150m are evident on most of the area’s glaciers, and most glaciers experience slight increases at higher altitudes. No surges are apparent in Figure 7.
Elevation change map of south Svalbard (Nathorst Land and Wedel Jarlsberg Land), 1936–90.

Wedel Jarlsberg Land contains the largest ice area within this study, and consists mainly of ice caps and outlet glaciers with few small valley glaciers. Glaciated area decreased by 11%, with large elevation losses at the fronts of the outlet glaciers, while the upper elevations thickened. The elevation increases also suggest a potential surge-build up, especially on Polakkbreen, Finsterwalderbreen and Amundsenisen. The elevation change pattern on Amundsenisen is similar to more recent changes measured from 1991 to 2001 (Reference Hagen, Eiken, Kohler and MelvoldHagen and others, 2005), although surface lowering on the southern parts of the glacier seems to be smaller during the 1936/38–1990 epoch. One post-surge is apparent on Hessbreen, which is known to have surged in 1974 (Reference Hagen, Liestøl, Roland and JørgensenHagen and others, 1993). Recherchebreen surged in 1948, although this is not apparent in Figure 7. Elevation decreases occur in both the accumulation and ablation areas, so the glacier has not adjusted to pre-surge altitudes, and may not do so.
The elevation change gradient (Fig. 5c) of Wedel Jarlsberg Land is similar to that of Nathorst Land, with large decreases between 100 and 200ma.s.l., approaching zero at ~500ma.s.l. A difference between the two regions lies in the hypsometry, with most of the glaciated area of Wedel Jarlsberg Land lying lower than that of Nathorst Land. The elevation change curve for Nathorst Land is slightly more negative than that for Wedel Jarlsberg Land, so the annual geodetic balance for Nathorst Land is slightly more negative than that for Wedel Jarlsberg Land.
Discussion
Care must be taken when determining the hypsometric elevation change averages (Δh from Equation (1)) from contour points. In this study, contour points extracted from the original digitization tend to be more numerous towards the edges of the glacier (due to the curvature of the contour). Long-term elevation changes on the edges of a shrinking glacier are also slightly smaller than those in the centre. Simply averaging contour points, therefore, creates underestimated (and unrepresentative) averages for each elevation band. Others have found that pixel averages are relatively independent of the interpolation procedure used (e.g. Reference AndreassenAndreassen, 1999) where the same underestimated trend between contour point averages is found. This emphasizes the importance of having a representative (elevation-change) average for the areas from which they derive.
In addition, the use of hypsometric averaging assumes that the data are spatially representative for all glacier areas analyzed. The application of the Viewshed function and subsequent removal of points where data are either not available or severely suspect results in a spatial bias, as those data points are generally located on inland glacial areas. Inland regions typically contain elevation increases, so removal of these data may result in geodetic balance estimates being biased more negatively than if those areas were included.
In the 54 year period 1936/38–1990, Svalbard glaciers have lost large amounts of ice, while the inner regions of the larger ice caps and fields show elevation increases. There is marked climatic regionality within Svalbard, clearly seen from the spatial variability in the relative percentage of glaciated area, as well as from the long-term geodetic balances implied by the volume changes (Table 2).
The regionality of the geodetic balance (Fig. 8) can be directly related to topography, and to climatic patterns that tend to influence Svalbard with a moisture-bearing low-pressure system from the southeast (Reference Hagen, Liestøl, Roland and JørgensenHagen and others, 1993). Prins Karls Forland has the most negative annual geodetic balance of the regions, which results from its coastal location as well as having most of its glacial area at lower altitudes. Brøggerhalvøya/Oscar II Land, despite being situated only ~25–30 km east of Prins Karls Forland, has the second least negative geodetic balance, which is attributed to a higher hypsometry as well as a more inland location. Similarly, central Nordenskiöld has a small geodetic balance due to its interior location (drier) and higher-altitude hypsometry. The coastal regions in central Svalbard, Heer Land and Nordenskiöld west, have varying geodetic balances despite having more similar precipitation regimes than that of central Nordenskiöld. The east coast, however, experiences more accumulation as more winter precipitation comes with easterly winds than westerly winds (Reference Winther, Bruland, Sand, Killingtveit and MarechalWinther and others, 1998). The more negative geodetic balance of Nordenskiöld west reflects the effect of warm westerly weather systems, similar to that of Prins Karls Forland. The less negative balance of Heer Land implies a potential dominance of winter on the net balance of the east coast of Svalbard. Southern Svalbard has the most negative geodetic balances of all the regions analyzed. Nathorst Land has a slightly more negative geodetic balance than Wedel Jarlsberg Land, reflecting its location being protected from the east and south from winter storms.
Annual geodetic mass balances for the seven regions. The most negative mass balances occur in the south and west, while less negative balances occur on the east coast and inland regions.

Most of the regions show elevation decreases at low altitudes, and increases at higher altitudes (except Prins Karls Forland). Heer Land, in particular, shows the most drastic pattern of elevation increases at higher altitudes. Five glaciers in this region have surged between 1936 and 1990, while the rest of the glaciers in the region show marked elevation increases. This spatial pattern is consistent with that observed during the quiescent phase of a surging glacier. Nathorst Land did not have any surging glaciers in the period 1936–90, although elevation increases are significant upon three connected glaciers (Parbreane, Svalbreen and Rokkbree), suggesting mass build-up. Wedel Jarlsberg Land has had two past glacier surges (Hessbreen and Recherchebreen) during the study period, while three glaciers show signs of surge build-up (Polakkbreen, Zawadzkibreen and Amundsenisen). It is not completely clear whether the elevation increases are caused by precipitation increases (Reference Raper, Bamber and KrabillRaper and others, 2005) or from slow dynamic responses (Reference Hagen, Eiken, Kohler and MelvoldHagen and others, 2005). The elevation change patterns and surge history of this study imply a larger dynamic influence than that controlled by meteorologic factors alone.
Reference Hagen, Kohler, Melvold and WintherHagen and others (2003a, Reference Hagen, Melvold, Pinglot and Dowdeswellb) estimated the annual mass balance of Svalbard to between –0.12 and –0.27ma–1w.e., based upon data from the late 1960s to about 2000. Assuming a density of 0.9 kgm–2, the estimated annual geodetic balance for the regions analyzed in this study is –0.30ma–1w.e. The north and northeastern regions of Svalbard are presumably more in balance than the south and western regions, so this estimate may be slightly too negative for the entire Svalbard archipelago. Nonetheless, it is in agreement with previous Svalbard estimates and represents a longer-term average (1936–90) for the central and southern regions of Svalbard.
Reference Bamber, Krabill, Raper, Dowdeswell and OerlemansBamber and others (2005) estimated the average rates of thinning over the period 1996–2002 by averaging elevation differences without (hypsometric) weights for three glaciers in Wedel Jarlsberg Land. Their annual thinning rate estimate of –0.47ma–1 for the period 1996–2002 is slightly more negative than our geodetic balance estimate for the region from 1936 to 1990 (–0.43ma–1).
However, the averaging methods for the latter estimates are different and the coverage is limited within the flight-line estimates. Therefore, we take the same points as in Reference Bamber, Krabill, Raper, Dowdeswell and OerlemansBamber and others (2005) to determine elevation change for three periods (I: 1936–90; II: 1990–96; III 1996–2002) for three glaciers in southern Svalbard (Table 3). Mean annual elevation changes are obtained from an unweighted average, as the point distributions are more heavily weighted towards the larger ice masses (Reference Bamber, Krabill, Raper, Dowdeswell and OerlemansBamber and others, 2005). Average thinning rates are given for the individual glaciers as named in Reference Bamber, Krabill, Raper, Dowdeswell and OerlemansBamber and others (2005), but emphasis is placed on the entire southern Svalbard estimate.
Mean and standard deviations (SD) of δh/δt point estimates over three glaciers in southern Svalbard for the periods 1936–90, 1990–96 and 1996–2002. Profiles from Reference Bamber, Krabill, Raper, Dowdeswell and OerlemansBamber and others (2005)

Southern Svalbard has experienced an increased thinning rate through the three periods. The rate of thinning has doubled between periods I and II, and tripled between periods II and III (Table 3). The Reference Bamber, Krabill, Raper, Dowdeswell and OerlemansBamber and others (2005) profiles are not representative for the whole of Wedel Jarlsberg Land, which is apparent since the mean annual thinning rate derived from the profiles (–0.07ma–1) is much smaller than the annual geodetic balance for Wedel Jarlsberg Land (–0.43ma–1) for period I. This discrepancy emphasizes the differences between geodetic balance estimations (area-weighted) and annual thinning rate estimates from center-line profiles.
Conclusion
In this study, we use old topographic maps made from oblique aerial photographs to study glacier elevation changes over a long time interval (54 years). Non-glacier land elevation differences are used to quantify the errors associated with the glacial elevation changes, while slope and Viewshed (the number of aerial photographs that provide coverage of a particular point) are shown to be related to these differences. The Viewshed parameter helps to remove poorly visible data points where contours may be schematic rather than derived from photogrammetry. Slope is used to create representative statistics for quantifying elevation errors over glaciers. By averaging over large areas, the errors can be greatly reduced. If careful assessment of the non-glacier land elevation differences is undertaken, older topographic maps from oblique aerial photographs provide useful glaciological information and, as in this study, provide a baseline from which modern elevation change estimates can be compared.
Svalbard glaciers (for the regions analyzed) have been retreating and losing mass in the period 1936–90, with a 16% area decrease and a total volume change of –86.03± 3.64 km3 (1.59km3 a–1). There is a distinct regionality to the elevation change patterns, which can be attributed to variations in topography (hypsometry) and climatic regime. Many of the regions in Svalbard experience elevation increases at the upper altitudes, which has been attributed to increasing precipitation (Reference Raper, Bamber and KrabillRaper and others, 2005) or to dynamics (Reference Hagen, Eiken, Kohler and MelvoldHagen and others, 2005). Finally, in southern Svalbard, mean annual thinning rates from three consecutive periods show that the rate of thinning has increased dramatically since 1990.
Acknowledgements
We thank the Norwegian Polar Institute for providing office space, computer facilities and data for the completion of this project. Special thanks to the Mapping Department for greatly assisting with technical support and acquisition of the data. T. Murray and J. Bamber provided useful comments and suggestions that greatly improved the manuscript.



