
The collection of high spatial resolution elevation information in the coastal zone has become more widespread in the last ten years. For example, the majority of the southern UK coast is now covered by onshore airborne light detection and ranging (LiDAR) data at up to 1 m spatial resolution, extending from the low water mark to up to several kilometres inland (see the Channel Coastal Observatory web service: www.channelcoast.org). Over 30 % of the southern UK coastline is also covered by multibeam swath bathymetry data of similar spatial resolution, which often overlaps or joins with the airborne LiDAR data to provide continuous elevation surface coverage from onshore to offshore. The collection of such information is facilitated by the DEFRA-funded National Network of Regional Monitoring Programmes of England (Bradbury et al. 2002). Similar elevation data have been shown in other locations to be highly suitable to coastal research and management activities (Klemas Reference Klemas2013; Leon et al. Reference Leon, Phinn, Hamylton and Saunders2013), and this contribution demonstrates how such data can be used for detailed geological mapping studies.
Ground-based laser scanning and aerial photography at high spatial and temporal resolution, for example, down to centimetres and with annually repeated surveys, are also being used increasingly to focus on specific issues in the coastal zone, such as coastal flooding in low lying areas (Cobby et al. Reference Cobby, Mason and Davenport2001; Coveney & Fotheringham Reference Coveney and Fotheringham2011) and slope instability in cliff-dominated areas (Rosser et al. Reference Rosser, Petley, Lim, Dunning and Allison2005; Colenutt et al. Reference Colenutt, Mason, Cocuccio, Kinnear and Parker2013). In adjacent offshore areas, additional surveying techniques such as seabed sampling, acoustic backscatter (Ulrick Reference Ulrick1982) and shallow seismic surveys also provide additional layers of information to aid further detailed scientific interpretations, which in turn enable better coastal management (Colenutt et al. Reference Colenutt, Mason, Cocuccio, Kinnear and Parker2013).
A direct application of such high quality observational information is improvement in geomorphological and geological surveys to act as a baseline for better coastal characterisation (Brooke et al. Reference Brooke, Creasey and Sexton2010). The underlying aim is to deliver a continuous data collection and derived surveying profile through the nearshore environment, which is often lacking in such information and consequently sometimes referred to as the ‘White Ribbon’ (Mason et al. Reference Mason, Rainbow and McVey2006; Leon et al. Reference Leon, Phinn, Hamylton and Saunders2013). Given the high levels of human activity in this coastal zone, a fuller representation of environmental factors such as geology is clearly desirable and the novel techniques presented here aim to show how this could be tackled. In a wider sense, such improved surveying can contribute towards the multi-disciplinary scientific evidence base required by Government for the management of coastal erosion risk and geohazards, development of environmental policy, integration of terrestrial and marine planning regimes, and sustainable use and conservation of coastal and marine resources (Colenutt et al. Reference Colenutt, Mason, Cocuccio, Kinnear and Parker2013).
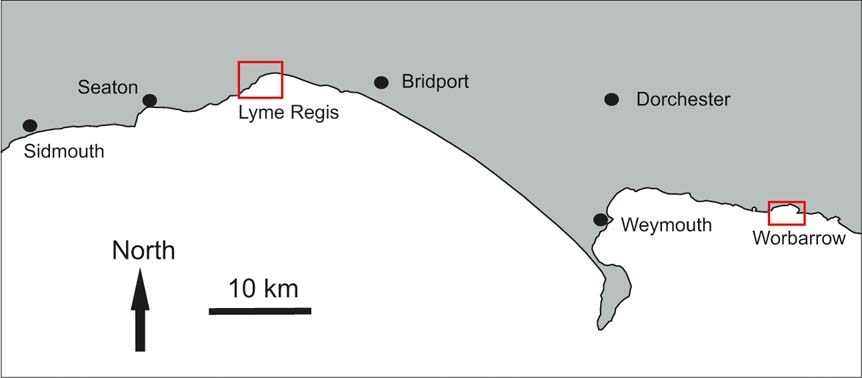
This contribution uses two case examples from the Dorset coastline of southern England to demonstrate how such multi-spatial- and temporal-resolution elevation information can be combined and used for detailed geological mapping studies. These case studies are located at Lyme Regis and Worbarrow Bay (Fig. 1), both well-known localities on the ‘Jurassic Coast’, which was declared a World Heritage Site by UNESCO in 2001. This work includes the use of innovative digital techniques for visualisation and spatial analysis. The potential of this approach to support improved understanding of coastal geohazards such as landsliding is demonstrated, as well as the wider implications for coastal management and research.
1. Data methodology: processing and visualisation
The complex, multi-scalar, multi-format nature of observational spatial data in the coastal zone requires a significant amount of processing to maximise its scientific interpretation potential. The airborne LiDAR, bathymetry and ground-based laser scan datasets discussed here are frequently viewed separately, but the real power comes from their integration and simultaneous, three-dimensional viewing. The following section describes how data from the Dorset coast have been accessed, processed and visualised with this aim in mind. The resulting continuous elevation surface forms the basis for seamless coastal geological interpretation, as demonstrated in the case studies.
1.1. Data sources
The elevation data used in this study are derived principally through the DEFRA-funded Strategic Regional Coastal Monitoring Programmes of England, managed and delivered under the Open Government Licence by the Channel Coastal Observatory (CCO) (Bradbury et al. 2002). The CCO data management centre is hosted by the New Forest District Council, in partnership with the University of Southampton and the National Oceanography Centre.
The higher-resolution (c.1 m spatial resolution) nearshore bathymetry data for the first case study at Lyme Regis (Fig. 1), extending to 1 km offshore, was collected as part of the SW sector of the Strategic Regional Coastal Monitoring Programme. In the present study, lower resolution bathymetry data (at c.7 m spatial resolution) accessed via the UK Hydrographic Office (UKHO) was also used to complete the coverage extending to up to 12 km offshore from Lyme Regis. The bathymetry data used in the second case study at Worbarrow Bay forms part of the dataset collected under the Dorset Integrated Seabed Survey (DORIS) project, which extends up to 15 km offshore (this data can be viewed via the Dorset Wildlife Trust web service: www.dorsetwildlifetrust.org.uk). DORIS is a collaborative project involving the Dorset Wildlife Trust, the Maritime and Coastguard Agency, CCO and the Royal Navy, with major funding from the Viridor Credits Environmental Company. Other partners include Natural England, the Dorset Strategic Partnership, the National Oceanography Centre and the University of Southampton. The airborne LiDAR data in both case studies, extending in a strip to approximately 2 km onshore, were collected by the Environment Agency and the unfiltered data used to generate a terrain model that still includes vegetation and building features. All of this airborne LiDAR and bathymetry data has been made available via the CCO through their web services under the Open Government Licence.
Ground-based laser scanning data, of the type used in the Lyme Regis case study (Fig. 3), have also been collected by the CCO since 2012 as an enhancement to ongoing coastal monitoring work.
These elevation data have been brought together in this study with existing British Geological Survey (BGS) mapping information, as part of the Marine Environmental Mapping Programme (MAREMAP: www.maremap.ac.uk), to underpin a fresh approach to visualisation and surveying of geology and geomorphology in the coastal zone.
This integrated approach to data collection, delivery and interpretation reflects the growing demand for and availability of high resolution data for environmental analysis of the coast. This is, in turn, related to the need for improved management and monitoring of the effects of interaction between natural and human-induced changes in the coastal zone.
1.2. Data processing
For the first stage of processing in this study, the airborne unfiltered LiDAR and higher resolution bathymetric data were obtained from the CCO as a series of ASCII ‘.asc’ grid files of 1 m spatial resolution, ranging in collection dates from 2007 to 2010. This included the nearshore bathymetry data at Lyme Regis and the DORIS bathymetry data at Worbarrow Bay. The individual tiles for these datasets were merged together, in ArcToolbox (an extension of the ESRI Geographic Information System (GIS) software), to form a continuous elevation surface at 1 m spatial resolution for each dataset. The merging order was such that where there was overlap of one, or more, years, the most recently acquired data would take precedence. Where the merged outputs contained isolated pixels with no associated digital number, the holes were filled with a weighted mean of the 3×3 matrix surrounding the missing pixel. The filled merged output was exported as a GeoTiff raster image to enable comparative visualisation with other datasets in digital imaging and visualisation software.
Further offshore at Lyme Regis, the bathymetric data were obtained from the UKHO as simple ASCII ‘.xyz’ data. This file can be imported into a wide range of proprietary software to produce enhanced visualisations of the bathymetric surface. A typical workflow involves the importation of the ASCII ‘.xyz’ files into DMagic, or a similar processing software package, to produce a single mosaic ASCII ‘.asc’ grid file at an appropriate resolution. The offshore UKHO data for Lyme Bay were used to form a continuous bathymetric surface at 7 m spatial resolution, which was the best spatial resolution output based on the survey acquisition parameters. The grid files were then re-sampled, in ArcToolbox, to 1 m spatial resolution using a fast nearest neighbour resampling method. This method assigns to the output pixel the digital number of the nearest input pixel, as the input cell size (7 m) is divisible by the output cell size (1 m) it will not change the values of the cells. The maximum spatial error will be one-half the input cell size. The resampling allows the lower resolution offshore bathymetric data to be merged with the nearshore bathymetric and onshore topographic data of 1m spatial resolution to generate a seamless elevation layer. Higher-resolution offshore bathymetry data are also available at Lyme Regis (as displayed on the Dorset Wildlife Trust DORIS web service) but these have not been used in the current coastal study, where the 7 m resolution surface was deemed sufficient for the current development purposes.
The UKHO data in Lyme Bay were converted from Chart Datum (CD) to Ordnance Datum (OD) using the most appropriate offset to eliminate the visible step in the merged datasets. In this instance, differences between CD and OD from selected UK ports were consulted and the value of −2.73 m deemed most appropriate for the south coast of England.
1.3. Generation and visualisation of a seamless multi-source elevation surface
The next step of the process was to merge together the continuous elevation surfaces described above for the LiDAR and bathymetry datasets. When working with such data spanning the coastal zone and offshore, not only does the spatial resolution have to be considered, but also the co-ordinate reference system of the individual data sources. Bathymetric data from UKHO was received in a WGS84 geographical co-ordinate reference system, whereas all data from CCO was in a projected co-ordinate reference system, British National Grid on OSGB36 datum. To allow a seamless surface to be produced the UKHO data were re-projected from WGS84 into British National Grid on OSGB36 datum using the parameters provided in Table 1.
OSGB petroleum transformation parameters from OSGB36 to ETRF89 (WGS84) from UK Offshore Operators Association (1999). Shows the three-dimensional spatial distance (d) and rotation (Rot) parameters applied. Scale is the distortion scale in parts per million (ppm).
Any gaps in the data were dealt with by setting a false value for the height at a nominal 100 m below the lowest recorded value for the surface. This was in order to allow easier viewing in GeoVisionary, whilst still enabling clear identification of where the holes occurred.
The resulting seamless coastal elevation surface was then available for visualisation in a variety of GIS or 3-D visualisation packages. In this study, visualisation was performed through the GeoVisionary software package (produced through a collaboration between BGS and Virtalis: www.virtalis.com/geovisionary), because of its suitability for geological surveying, as demonstrated in the case studies (see section 2). In order to allow visualisation, the elevation surface was converted into a Virtual Streaming Image layer format required by GeoVisionary. This streaming approach enables smooth, fast, three-dimensional visualisation with interactive fly-though of very large datasets at variable scales, which has been found to facilitate geological analysis.
1.4. Ground-based laser scan data processing
The ground-based laser scanning data were treated separately due to their very high (centimetres) resolution and file size. The data collected by the CCO using a Leica Scanstation C10 has a maximum point spacing of 0.3 m, with a vertical accuracy of 0.015 m and a typical survey (of the type shown in Figure 3, covering about 1 square km) contains around 17 million data points. As a further aid to interpretation of the laser scanning data, a digital camera was mounted on the tripod to acquire colour photography with the laser scan data, thus providing red-green-blue (RGB) values for each simultaneous measurement point.
It was found best to overlay this dense point cloud information onto the seamless elevation surface generated from the merged LiDAR and bathymetric data, rather than to merge it. This approach enables more detailed visualisation of the geology at particular localities, as demonstrated in the Lyme Regis case study.
In processing terms, the laser scan data used in this study were obtained from the CCO as a series of XYZRGB ASCII text ‘.txt’ files. The data were processed to generate a single comma-delimited ASCII ‘.csv’ file for importation to the GIS and GeoVisionary visualisation software.
2. Applications to geological & geomorphological surveying
The emerging high resolution observational data described above provide many new opportunities for advancements in coastal scientific surveying and research, not least in the offshore extension of onshore geological maps and sub-surface models to give a more complete picture of the geological underpinnings in the coastal zone. Existing, higher resolution onshore BGS surface mapping, carried out at typical standard survey scale of 1:10,000, stops effectively at the low water mark (LWM). However, it is clearly advantageous to understand in detail how the geology extends offshore, to where the published mapping is generally at a much smaller scale (for example, represented by the 1:250,000 scale BGS DiGRock bedrock dataset) and of lower levels of detail, particularly closer to the coastline. This disjoin between the onshore and offshore geological mapping contributes to the coastal ‘White Ribbon’ mentioned earlier (Mason et al. Reference Mason, Rainbow and McVey2006; Leon et al. Reference Leon, Phinn, Hamylton and Saunders2013).
The two geological case studies described here at Lyme Regis and Worbarrow Bay (Fig. 1) concentrate on the offshore extension and linking of the bedrock geology, but the principles described are equally applicable to the overlying geological layers, such as superficial and mass movement deposits.
The bedrock of this part of the World Heritage Site coast extends from Lower Jurassic to Cretaceous in age (Arkell Reference Arkell1947; Wilson et al. Reference Wilson, Welch, Robbie and Green1958; House Reference House1993; Callomon & Cope Reference Callomon, Cope and Taylor1995; Barton et al. Reference Barton, Woods, Bristow, Newell, Westhead, Evans, Kirby, Warrington, Riding, Freshney, Highley, Lott, Forster and Gibson2011; West Reference West2013). It exerts a strong control on the land surface geomorphology, due both to strong lithological variations and faulting and folding, relating to the tectonic effects of the Miocene-age Alpine Orogeny (Barton et al. Reference Barton, Woods, Bristow, Newell, Westhead, Evans, Kirby, Warrington, Riding, Freshney, Highley, Lott, Forster and Gibson2011).
Superficial deposits in this part of the Dorset coast are represented principally by limited areas of tidal flat deposits, and more extensive often-gravelly beach deposits, exemplified by Chesil Beach (Carr & Blackley Reference Carr and Blackley1974). Mass movement deposits are extensive and well known along the Dorset Coast (Allison Reference Allison1992), formed primarily by downslope movement of materials through slip, flow and fall mechanisms in landslide complexes. There are many well-known landslide localities, such as Black Ven near Lyme Regis (Gallois Reference Gallois2009), frequently developed in Jurassic mudstones and limestones, and their Cretaceous overburden. Although these mass movement deposits are commonly observed in the cliff zones, the emerging offshore data show that in some cases they extend offshore, and appear to be of more than one generation (Gallois Reference Gallois2011).
2.2. Lyme Regis case study
The Lyme Regis case study demonstrates how an improved understanding of the link between the onshore and offshore bedrock geology can potentially aid the analysis of large coastal cliff landslide complexes.
Data available in the coastal strip at Lyme Regis include 1 m horizontal resolution airborne LiDAR and multibeam bathymetry, covering the coastal zone up to several kilometres both onshore and offshore of the tidal zone. These surfaces can be digitally ‘stitched’ together as described in section 2, to present a 3-D digital terrain surface extending seamlessly from onshore to offshore. Further offshore in Lyme Bay, additional bathymetry data, such as 7 m resolution UKHO data, can similarly be joined, further extending the seamless elevation surface. When displayed in the GeoVisionary package (see section 1.3), ‘virtual’ geological surveying can be carried out by digitising in three dimensions onto the surface to trace key geological features. The sophisticated nature of modern 3-D visualisation packages such as GeoVisionary allows dynamic manipulation of hill-shading (incidence angle and azimuth) during active ‘flying’ to bring out the often subtle geomorphological featuring in low-angle seabed platforms adjacent to the coast. Such an approach allows improved definition of all of the key categories of geology and geomorphology, comprising: the underlying bedrock structure; the extent and nature of landslide complexes; the full extent of beach deposits; and any hard engineering structures along the coast.
For mapping of the bedrock, the primary focus of this study, the methodology involved tracing of topographic features (ridges, breaks in slope) formed by contrasts or discontinuities in the underlying geology, such as harder limestone bands or fault features. This was aided by importing the existing onshore 1:10,000 scale geological vector-based mapping (BGS DiGMapGB-10 dataset) and draping it on the high resolution elevation surface, a technique that proved to be very effective for improved geological assessment, particularly in steep cliff sections. Onshore geological formations can then be linked seamlessly to the nearshore platform with good levels of confidence up to several km offshore, depending on the complexity of the geology.
Figure 2 shows this technique applied to the area to the east of Lyme Regis, where the well-known Black Ven landslide complex occurs in the cliff zone (Jones & Lee Reference Jones and Lee1994; Chandler & Brunsden Reference Chandler and Brunsden1995; Gallois Reference Gallois2008). Mapping of known divisions in the onshore bedrock can be extended seamlessly offshore to provide a complete picture of the bedrock geology controlling the form of the coastline. The boundaries between the Jurassic lithostratigraphical units are marked by thicker limestone beds which form positive (convex) landscape features on land, evident as ‘steps’ in the Black Ven cliffs (Fig. 2A). These boundary beds can be mapped as extending into the well-exposed nearshore platform which is clearly evident in the bathymetric images (Fig. 2). The stratigraphical variations within and between the Blue Lias Formation and the overlying Shales-with-Beef and Black Ven Marl members can be carefully identified and matched to the known Jurassic stratigraphy. The onshore part of the mapping confirms that the Jurassic sequence cropping out in the landslide area ranges from Blue Lias Formation at the base, up through divisions of the Charnmouth Mudstone Formation, including the Shales-with-Beef, Black Ven Marl and Belemnite Marl members (e.g., Lang Reference Lang1924, Reference Lang1936; Lang & Spath Reference Lang and Spath1926; Hesselbo & Jenkins Reference Hesselbo, Jenkins and Taylor1995; Bloos & Page Reference Bloos and Page2002), overlain unconformably by the Cretaceous Gault Formation and Upper Greensand Formation, Foxmould and Whitecliff Chert members (Owen Reference Owen1975; Edwards & Gallois Reference Edwards and Gallois2004).
The Lyme Regis case study area, west Dorset; location shown in Figure 1: (A) view towards the NNE, at an oblique viewing angle of 45° above horizontal, of the seamless coastal elevation surface, displayed in GeoVisionary. The red outline shows the geological mapping case study area depicted in (B). The blue outline shows the area of the laserscan survey shown in Figure 3. The 1 km scale bar is for the centre of the oblique view (below where shown); (B) the resulting seamless geological map, in planar view, for the Black Ven area just to the NE of Lyme Regis. The SW corner of map area is at grid reference [SY 3446 9224]; the NE corner is at [SY 3652 9354]. For the bedrock, only the Blue Lias Formation (Bli, in pale grey) and the Shales-with-Beef Member (SwB; of the Charnmouth Mudstone Formation) are shown. This boundary is mapped by matching the bedrock ridges seen on the surface (in particular in the nearshore platform) to the known lithostratigraphy and tracing key marker beds. Uncoloured, darker grey areas outside of this are not mapped for bedrock. Faults in the nearshore platform are shown as black continuous lines, with ticks indicating downthrow side. Inferred onshore projections of these faults through the bedrock underlying the Black Ven landslide complex are shown as red dashed lines. The black dashed lines show an anticline (diamond legend) and syncline (crosses legend) pair affecting the bedrock offshore. The yellow vertical hatching shows the outline of the ‘active’ Black Ven Landslide complex; note the offshore extension, representing preserved fronts of previous landslides extending to beneath mean low water level (see text).

The methodology also includes using geometric tools in GeoVisionary to measure bedding dips on defined planar rock surfaces in the eroded bedrock platform of the submerged near-shore (revealed in the bathymetry surfaces). Onshore and offshore outcrops of known geological formations can also be traced in three dimensions to define the orientation of the bedrock bedding surfaces.
In order to produce the output digital map (Fig. 2B), the second stage of the methodology involves manipulating the GeoVisionary ‘virtual fieldwork’ survey lines in a GIS to create a polygon feature layer based on seeding the linework with known DiGMapGB-10 attribution. GIS maps produced in this way can be further attributed, for example, with a range of engineering geology or environmental factors. The BGS has developed the System for Integrated Geoscience Mapping (SIGMA), as an extension to ArcGIS, for this purpose. The SIGMA process has already been extensively used for onshore surveying applications (Jordan Reference Jordan2010; Jordan & Pennington Reference Jordan and Pennington2011). In the current study, SIGMA has been used innovatively in two case studies to produce a seamless coastal geological map, extending the existing onshore 1:10,000 scale geological map to several kilometres offshore (with the potential for further extension at a similar resolution to up to 15 km offshore to take advantage of the high-resolution bathymetric data in Lyme Bay and the DORIS area). This approach demonstrates the significant potential of this technique for wider seamless surveying in the coastal zone and, indeed, more widely across the UK Continental Shelf.
Results from this lithological and structural bedrock analysis in the Lyme Regis case study confirm a low-angle seaward (southerly) dip of the Jurassic strata extending for most of the length of the Black Ven landslide complex. In the offshore area, the bedrock is clearly exposed, allowing the structure to be interpreted (Fig. 2B). The general structure includes offshore dipping beds along most of the length of the complex, which swing to easterly (coast-parallel) dip in the west around the closure of a WSW–ENE-trending syncline, possibly controlling the lateral extent of the landslide in that direction.
Steeply inclined faults can be mapped in the nearshore marine platform, and extended using feature mapping across the eastern extent of the landslide complex (Fig. 2B), revealing an apparent link between the morphology of the landslide and the bedrock structure. Indeed, the overall structure of the landslide appears to be strongly influenced by the combined offshore dip of the bedrock layers and their ‘segmentation’ by the cross-strike faults, interacting with major landslide failure surfaces occurring on the principal bounding units within the Jurassic sequence. This interpretation agrees with previous studies (Denness et al. Reference Denness, Conway, McCann and Grainger1975; Gallois Reference Gallois2008, Reference Gallois2009; Barton et al. Reference Barton, Woods, Bristow, Newell, Westhead, Evans, Kirby, Warrington, Riding, Freshney, Highley, Lott, Forster and Gibson2011), but adds significant detail by drawing out the structure in the nearshore bedrock platform. When combined with the seamless elevation surface, this information on the surface outcrop and structure of the bedrock has the potential to provide key input data for improved three-dimensional geological modelling of the unstable coastal cliff zone.
Additionally, near Lyme Regis and elsewhere, ground-based laser scanning has been used to provide further surveying detail down to 0.1 m resolution. Such very highly detailed survey information can be used in a targeted way to provide further insights into the stability and evolution of unstable cliff complexes, such as that at Monmouth Beach to the west of Lyme Regis (Fig. 3). Repeated laser scanning surveys in such settings can demonstrate short-term (e.g. annual) temporal changes and improve prediction of cliff instability and coastal retreat (Poulton et al. Reference Poulton, Lee, Hobbs, Jones and Hall2006). Used together with the seamless airborne LiDAR and nearshore bathymetry elevation data, this can prove to be a very powerful approach for furthering coastal research.
Laserscan survey of the cliffs at Monmouth Beach just to the west of Lyme Regis; view toward the W, at an oblique viewing angle of about 15° above horizontal; displayed in GeoVisionary. Coloured point cloud data is draped over the seamless onshore–offshore LiDAR-bathymetry surface shown in Figure 2A (indicated by blue outline), to define further detail in the unstable cliffs of Blue Lias and Charnmouth Mudstone. The headland in the distance is at approximately grid reference [SY 3273 9094]; the beach at the front right is at approximately grid reference [SY 3332 9143]. The 150 m scale bar is approximate and is for the central part of the oblique view (below where shown).

The GeoVisionary-SIGMA mapping techniques used above for bedrock geology can equally be extended for mapping of overlying geological deposits, such as those produced by mass movement. As shown in Figure 2B, the outline of the active area of the Black Ven landslide has also been mapped accurately using GeoVisionary and SIGMA. As well as this onshore extent, the mass movement deposits can also be mapped as extending into the intertidal and subtidal zone. The arcuate and partly eroded ‘toes’ of landslide flows occurring, for example, in 1957 and 1958 (Chandler & Brunsden Reference Chandler and Brunsden1995) can be seen and defined precisely. There is also wider evidence preserved in the offshore setting at Lyme Regis of potentially much earlier ‘fossil’ landslide events (Gallois Reference Gallois2011), and the mapping techniques presented here are currently being applied by the authors to surveying these and similar deposits along the Dorset coast.
2.3. Worbarrow Bay case study
Worbarrow Bay lies further to the east along the World Heritage Site coast, several kilometres to the east of Lulworth Cove on the Isle of Purbeck (Fig. 1). Along this part of the coast, the tectonic effects of the Alpine Orogeny are very apparent in the steep dips and folding of the bedrock units within the Purbeck–Isle of Wight Disturbance (Underhill & Paterson Reference Underhill and Paterson1998), as exemplified in the Lulworth Crumple Zone seen at Stair Hole at Lulworth (Westhead & Mather Reference Westhead and Mather1996; Barton et al. Reference Barton, Woods, Bristow, Newell, Westhead, Evans, Kirby, Warrington, Riding, Freshney, Highley, Lott, Forster and Gibson2011).
The bedrock units seen in Worbarrow Bay range in age from the late Jurassic Kimmeridge Clay to the Cretaceous Chalk. The combined effect of the high lithological variation and the tectonic deformation in these bedrock units exerts a strong geomorphological control at the surface, apparent in both the onshore and offshore settings.
As at Lyme Regis, a seamless elevation surface has been generated from the 1 m spatial resolution onshore airborne LiDAR and offshore bathymetry data (Fig. 4). This surface forms the ideal basis for the detailed joining of the onshore mapping with offshore seabed featuring, enabling ‘completion’ of the onshore 1:10,000 scale BGS bedrock (BGS DiGMapGB-10) map across Worbarrow Bay. In this part of Dorset, the higher resolution offshore bathymetry data form part of the DORIS bathymetry dataset which extends up to 15km offshore, and ongoing work between the authors and colleagues at Southampton University is extending this offshore mapping across that dataset. The aim is to produce a seamless onshore–offshore digital geological map for the entire ‘DORIS area’, using the techniques piloted in this study, which would reveal the complete geological underpinnings of the World Heritage Coast.
The Worbarrow Bay case study area, displayed in GeoVisionary; location shown in Figure 1. Shows the seamless geological mapping, extending from the existing onshore BGS 1:10,000 scale digital bedrock map (DiGMapGB-10) to the offshore bedrock mapping at the same effective surveying scale. View towards the N, at an oblique viewing angle of 45° above horizontal. Limestones in the Portland and Purbeck Limestone groups can be seen forming distinct scarp features running across the seabed linking Mupe (M) and Worbarrow Tout (W) headlands (orange and pale brown colours). Resistant sandstones in the Lower and Upper Greensand formations, and harder units in the lower parts of the Chalk form distinct seabed features tracking across the northern part of bay past Arish Mell (A) (green and blue colours). Wealden Formation sandstones and mudstones underlie the central part of the bay (khaki colour). Kimmeridge Clay underlies the southern area of the map (dark orange), extending offshore, where scarp features known to be formed by the Kimmeridge Ledges limestone beds can be seen. Fault lines are shown in red. The SW corner of the map is at grid reference [SY 8406 7888]; the NE corner is at [SY 8716 8071].

Results of the present work at Worbarrow include offshore mapping down to the Member level in the Purbeck Group – there are five members in total (Westhead & Mather Reference Westhead and Mather1996) – and demonstration of complex minor, cross-strike faulting (Fig. 4). The resistant limestones of the Portland Limestone Group (Coe Reference Coe, Hesselbo and Parkinson1996) also form strong featuring across Mupe Bay, in parallel to that formed by the overlying Purbeck Group limestone. These limestones are known to form a significant escarpment on the sea floor, extending up to 10 km offshore (Ainsworth et al. Reference Ainsworth, Braham, Gregory, Johnson, King and Underhill1998).
The detailed bathymetry data also reveal sharply defined scarp and dip-slope geomorphological featuring in the sea floor underlain by the Kimmeridge Clay Formation. These features are formed by thin limestone beds known as ‘stone bands’, or the ‘Kimmeridge Ledges’, from the way they control the morphology of the wave-cut platform further to the east in Kimmeridge Bay (Arkell Reference Arkell1947; Cox & Gallois Reference Cox and Gallois1981; Gallois Reference Gallois2000). Again, these seabed features can be extended a significant distance (over 12 km) offshore across the DORIS dataset.
Much of the floor of central Worbarrow Bay is underlain by the Wealden Formation (Fig. 4), which is formed of muddy sandstone with lensoid sand and conglomerate units that form well-defined but laterally discontinuous ridges (Ruffell & Batten Reference Ruffell and Batten1994; Hopson et al. Reference Hopson, Wilkinson and Woods2008). Resistant, frequently cherty sandstones at base of the Greensand and harder chalks at the base of the Cretaceous Chalk (Bristow et al. Reference Bristow, Mortimore and Wood1997; Rawson et al. Reference Rawson, Allen and Gale2001; Barton et al. Reference Barton, Woods, Bristow, Newell, Westhead, Evans, Kirby, Warrington, Riding, Freshney, Highley, Lott, Forster and Gibson2011) form strong onshore and seabed featuring in the north of the bay.
3. Discussion & conclusions
This paper uses geological case studies at two localities on the Dorset World Heritage Site coastline to demonstrate a ‘whole coast’ approach to surveying. Significant advances in the acquisition, release and processing of onshore and seabed topographic surveying data are increasingly enabling the construction of seamless elevation surfaces extending across the coastline. This includes the use of high spatial and temporal resolution airborne LiDAR, and nearshore and offshore bathymetry surveys, supplemented by targeted use of ground-based laser scanning surveys. The resultant elevation surfaces, in turn, provide a resource for spatially continuous assessment of environmental factors across the coastal zone, including underlying geology and related surface geomorphology. The case studies along the Dorset coast described in this contribution show how is it possible to extend existing detailed onshore BGS geological mapping seamlessly into the nearshore, to provide new insights into the underpinnings of this complex coastline. The nature of coastal retreat and sea-level change along this part of the south coast of England means that significant bedrock exposure occurs at the seabed in the nearshore setting, with significant geomorphological features, related to lithostratigraphical variations in the bedrock, clearly identifiable and mappable using digital ‘virtual fieldwork’ techniques.
Given that around 50 % of UK waters are now covered by good quality bathymetric information (A. J. Evans, pers. comm. 2013), the potential for more extensive and systematic geological surveying using the techniques piloted in this study is significant. As an increasing proportion of the coastline is covered by high resolution nearshore bathymetry, this will also enable a better and more continuous join to the onshore, looking forward to a progressive elimination of the geological ‘White Ribbon’.
Although the present case studies have focused on bedrock geology mapping, the same digital geological surveying and GIS map-making techniques can be applied to other geological ‘layers’, such as mass movement (landslide) deposits and superficial deposits (including Quaternary sediments and ‘modern’ Holocene coastal and seabed sediments). Equally, these techniques could be applied in other disciplines, such as for mapping of habitats. Together, this information will underpin future research into coastal evolution, which in turn has the potential to contribute to better predictive coastal management and hazard and risk mapping.
The generation of seamless elevation surfaces has been applied successfully in some other environmental settings; for example, for analysis of reef evolution on the northern Great Barrier Reef (Leon et al. Reference Leon, Phinn, Hamylton and Saunders2013), and in coastal analysis around Ireland (Coveney & Monteys Reference Coveney, Monteys, Pe'eri and Long2011). Alongside the kind of geological analysis illustrated in this study, there is therefore significant potential to improve the scientific understanding of the coastal zone across multiple scientific disciplines. For example, a better geological understanding of the coastline will be beneficial for research into coastal evolution and sea-level change effects, including cliff stability and coastal flooding.
As well as being naturally complex, the coastal zone is increasingly under pressure from the effects of human activities. As a consequence, there is a complex overlapping network of regulations controlling, for example, development planning, resource use, industrial or recreational activities (Colenutt et al. Reference Colenutt, Mason, Cocuccio, Kinnear and Parker2013; DEFRA 2013; Mason et al. Reference Mason, Kinnear, Colenutt, Cocuccio, Parker, Dorst, van Dijk, van Ree, Boers, Brink, Kinneging, van Lancker, de Wulf and Nolte2012). These include the Town & Country Planning Act (1990), the Marine & Coastal Access Act (2009), the Transport & Works Act (1992) and the Energy Act (2004), amongst others. It will clearly be beneficial to both regulators and land- or marine-area users to have access to improved scientific evidence to underpin their decisions, and there is great potential to provide that afforded by the new observational data and interpretation techniques described here.
4. Acknowledgements
The authors would like to thank and acknowledge the following: the CCO data collection teams (both SE Team and SW Team); the CCO data management team (GeoData); the BGS data processing and GIS team (in particular, Rhys Cooper and Diego Diaz-Doce); the BGS DiGMapGB team; the BGS GeoVisionary team (in particular, Bruce Napier); Virtalis; and the BGS SIGMA team (in particular, Jenn Bow). This paper is published with the permission of the Executive Director, British Geological Survey (NERC). BGS/NERC Reference: IPR/187-11CN.


 Open access