




1. Introduction
Human values are deeply embedded in how people experience, interpret and interact with the world, yet in design practice they are often addressed implicitly rather than systematically. Designers routinely make decisions that shape users’ experiences, behaviors and interpretations, but the role of values in these decisions is rarely made explicit or supported through structured methods. Although approaches such as value-sensitive design and participatory frameworks have highlighted the importance of values, they often fall short in providing tools that are at once empirically grounded, theoretically coherent and practically usable in everyday design work.
At the same time, Evidence-Based Design (EBD) has established itself as a way of strengthening design decisions through empirical knowledge. However, its application has been more prominent in domains where outcomes can be measured directly, such as healthcare environments, and less developed in areas where meaning, interpretation and values play a central role. Similarly, triangulation is widely used in research to improve validity by combining multiple methods or data sources, but it is rarely treated as a guiding logic for developing design methods and tools.
Similar concerns have been raised within the design science community regarding how design knowledge can be generated and translated into practical design support artifacts. Recent discussions emphasize that design research contributes not only through artifact creation but also through the production of transferable knowledge about designing and design processes (Gero & Milovanovic Reference Gero and Milovanovic2020; Papalambros et al. Reference Papalambros, Gero, Maier, Cagan, Ahmed-Kristensen, Albers, April, Blessing, Boujut, Cantamessa, Cascini, Chakrabarti, Chen, Clarkson, Jiao, Eckert, Feinberg, Gericke, Hanna, Holtta-Otto, Jankovic, Jin, Kleinsmann, Knight, le Masson, Lewis, Linsey, Luo, McMahon, Nagai, Pigosso, Reich, Reid, Seepersad, Seifert, Shealy, Summers, Vermaas, Wartzack, Yang and Yannou2025).
This paper builds on the assumption that addressing values in design requires more than adding ethical considerations at the end of the process. Instead, it requires a research approach that can translate abstract value concepts into forms that designers can work with throughout the design process. To this end, the paper proposes a triangulation-driven design research methodology that integrates empirical data, theoretical perspectives and iterative design experimentation.
The approach is demonstrated through the development of HuValue, a design tool intended to support designers in identifying, articulating and reflecting on human values during design activities. However, the main contribution of this paper is not the tool itself, but the research logic through which it was developed. By showing how different forms of evidence can be brought together and gradually shaped into a usable design artifact, the paper aims to make the underlying methodology explicit and transferable.
More specifically, this paper contributes by (1) outlining a reproducible approach to developing design tools that combines empirical research, theoretical grounding and iterative design work; (2) illustrating how triangulation can function as a generative, rather than merely validating, element within design research; and (3) providing insights into how such tools are taken up in practice, based on their use in a design education setting.
By focusing on the process through which values are operationalized, rather than only on the resulting artifact, this study contributes to design science research concerned with the development of methods, constructs and artifacts that can support design practice in complex and value-laden contexts. This paper does not aim to validate a specific tool or value framework, but to make explicit a research logic for developing such tools.
2. Background and conceptual framing
2.1. Evidence-based design (EBD)
EBD is commonly defined as a research-informed approach that integrates empirical findings into design decision-making to improve human experience and performance (Ulrich et al. Reference Ulrich, Zimring, Zhu, DuBose, Seo, Choi, Quan and Joseph2008). Emerging from environmental psychology, healthcare and architecture, EBD represents a shift from intuition-driven design toward empirically grounded interventions. Early work by Proshansky, Ittelson and Rivlin (Proshansky, Ittelson & Rivlin Reference Proshansky, Ittelson and Rivlin1970) and Sommer (Reference Sommer1969) established systematic links between environments and human behavior, while Nightingale’s (Reference Nightingale1860) observations in healthcare contexts anticipated later design–outcome research.
Ulrich’s (Reference Ulrich1984) control-comparison studies provided foundational empirical validation of EBD by demonstrating measurable effects of environmental design on patient recovery. Subsequent contributions by Kaplan & Kaplan (Reference Kaplan and Kaplan1989) advanced psychological explanations for these effects. Although generative design approaches such as Alexander, Ishikawa & Silverstein’s (Reference Alexander, Ishikawa and Silverstein1977) pattern language influenced design thinking, they lacked the empirical validation that later became central to EBD.
The institutionalization of EBD was consolidated through large-scale research synthesis, most notably Ulrich et al.’s (Reference Ulrich, Zimring, Zhu, DuBose, Seo, Choi, Quan and Joseph2008) review of over 1,000 studies, which demonstrated EBD’s capacity to generate actionable design guidelines. While initially concentrated in healthcare architecture, EBD expanded into organizational and educational environments (Brill Reference Brill1984; Tanner Reference Tanner2009), signaling its broader applicability.
More recently, EBD has evolved beyond the built environment through the integration of mixed-methods, simulation technologies and behavioral measurement tools (Heydarian et al. Reference Heydarian, Carneiro, Gerber, Becerik-Gerber, Hayes and Wood2015). Contemporary research positions EBD as a general design research logic applicable to product, service and system design. Frameworks such as the D3 model (Lee & Ahmed-Kristensen Reference Lee and Ahmed-Kristensen2025) and set-based design approaches (Toche, Pellerin & Fortin Reference Toche, Pellerin and Fortin2020) illustrate how empirical evidence can inform early-stage decision-making across complex innovation contexts. These developments highlight EBD’s relevance as a methodological foundation for tool development, rather than solely outcome evaluation.
2.2. Triangulation as a design research logic
Within EBD, triangulation refers to the integration of multiple methods, data sources or theoretical perspectives to strengthen validity and interpretive robustness (Heale & Forbes Reference Heale and Forbes2013). Rather than functioning solely as a validation technique, triangulation operates as a core design research logic, particularly suited to complex, value-laden phenomena.
Methodological triangulation – combining qualitative and quantitative approaches – enables convergence and divergence analysis, revealing patterns that remain stable across methods while exposing contextual nuances (Meydan & Akkaş Reference Meydan and Akkaş2024). In design research, this is especially important where single-method approaches fail to capture experiential, social and normative dimensions.
In product and tool design, triangulation supports reconciling heterogeneous forms of evidence, including user interviews, observations, performance metrics and expert judgment. For example, Manganelli et al. (Reference Manganelli, Threatt, Brooks, Healy, Merino, Yanik, Walker and Green2014) demonstrate that methodological triangulation improved hospital overbed tables by integrating stakeholder interviews, task analysis and usability studies. Similarly, Weber (Reference Weber2025) employed mixed-method triangulation to evaluate public transportation information systems, combining user feedback with behavioral and system data.
Triangulation also enhances transparency and trustworthiness in design research. Farmer et al. (Reference Farmer, Robinson, Elliott and Eyles2006) showed that systematic cross-verification improves reliability in healthcare studies, while Bans-Akutey & Tiimub (Reference Bans-Akutey and Tiimub2021) emphasize the need for reflexivity to manage methodological complexity. When applied rigorously, triangulation enables design outcomes that are empirically justified, contextually sensitive and ethically defensible.
2.3. Human values in design
Human values play a fundamental role in shaping perception, behavior and meaning-making, yet their integration into design practice often remains implicit. Several design approaches explicitly address values, but they differ substantially in how values are identified and operationalized. Value-sensitive design emphasizes ethical accountability by mapping stakeholder harms and benefits to predefined moral values (Friedman et al. Reference Friedman, Kahn, Borning and Huldtgren2013). Value-led participatory design foregrounds emergent values through stakeholder collaboration (Iversen, Halskov & Leong Reference Iversen, Halskov and Leong2012), while value-centered design focuses on context-specific value elicitation through iterative engagement (Cockton Reference Cockton2005). Despite their contributions, these approaches often lack comprehensive, designer-oriented value frameworks that balance empirical grounding, theoretical coherence and practical usability.
Existing value taxonomies from philosophy, sociology and psychology vary widely in structure. Early philosophical frameworks proposed broad value categories (Weber, Scheler, Perry), while psychological models offered extensive ungrouped lists (Maslow, Rokeach). More structured approaches, such as Schwartz’s (Reference Schwartz1992) 10 motivational value domains and Peterson & Seligman’s (Reference Peterson and Seligman2004) virtue classification, introduced clustering strategies but were not developed for design application. A cross-disciplinary review of value theories identified 13 influential value frameworks (Table 1).
Lists of values (1900–2004), including the scholars’ names, their disciplines and their references
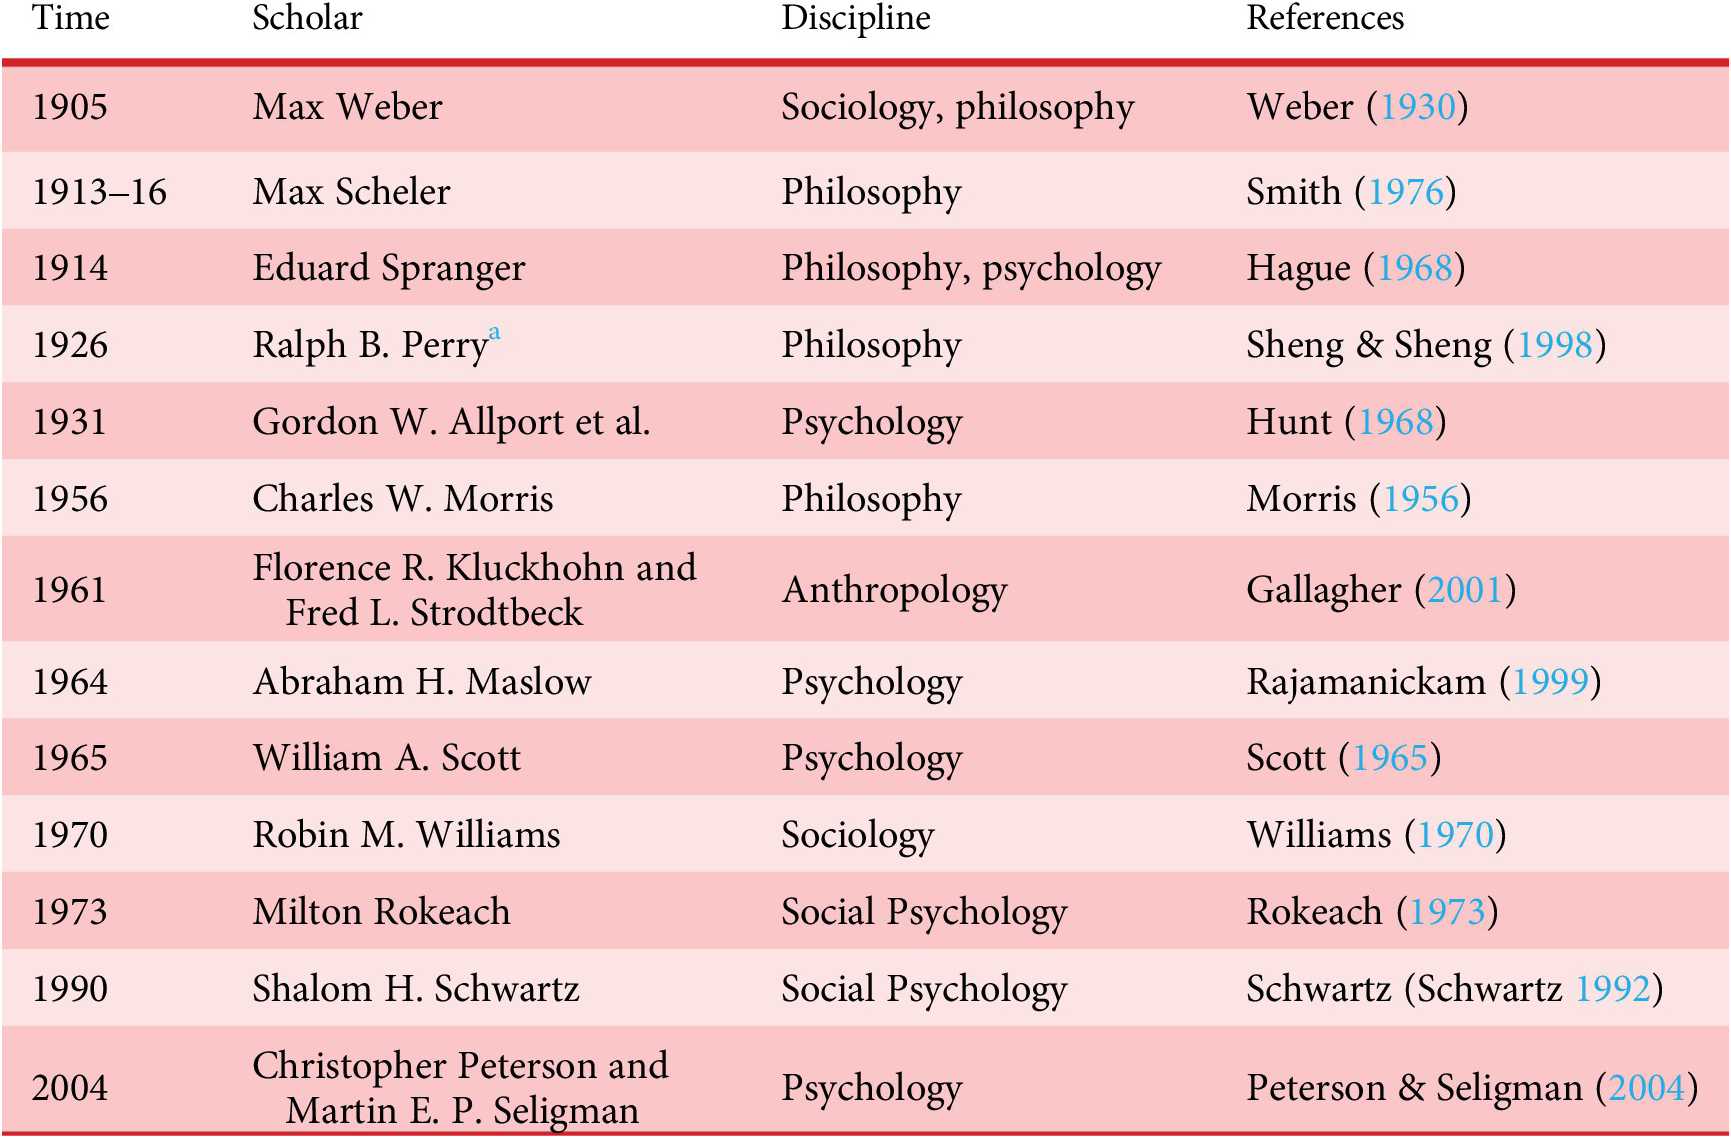
Table 1. Long description
A four-column table with headers: Time, Scholar, Discipline, and References.
* 1905: Max Weber; Sociology, philosophy; Weber 1930.
* 1913-16: Max Scheler; Philosophy; Smith Reference Smith1976.
* 1914: Eduard Spranger; Philosophy, psychology; Hague Reference Hague1968.
* 1926: Ralph B. Perry; Philosophy; Sheng and Sheng Reference Sheng and Sheng1998.
* 1931: Gordon W. Allport et al.; Psychology; Hunt Reference Hunt1968.
* 1956: Charles W. Morris; Philosophy; Morris Reference Morris1956.
* 1961: Florence R. Kluckhohn and Fred L. Strodtbeck; Anthropology; Gallagher Reference Gallagher2001.
* 1964: Abraham H. Maslow; Psychology; Rajamanickam 1999.
* 1965: William A. Scott; Psychology; Scott 1965.
* 1970: Robin M. Williams; Sociology; Williams Reference Williams1970.
* 1973: Milton Rokeach; Social Psychology; Rokeach Reference Rokeach1973.
* 1990: Shalom H. Schwartz; Social Psychology; Schwartz 1992.
* 2004: Christopher Peterson and Martin E. P. Seligman; Psychology; Peterson and Seligman 2004.
A key limitation of widely adopted models – particularly Schwartz’s framework – is the exclusion of spirituality as a distinct value domain, despite its prominence in human experience (Maslow Reference Maslow1964; Rokeach Reference Rokeach1973; Walker Reference Walker2013). For design contexts concerned with meaning, identity and lived experience, value frameworks must encompass all fundamental dimensions of life.
Dooyeweerd’s (Reference Dooyeweerd1955) theory of modal aspects provides a philosophically grounded alternative by organizing reality into non-overlapping yet interdependent dimensions of meaning, including analytical, formative, lingual, social, economic, aesthetic, juridical, moral and faith aspects. This structure aligns with how individuals conceptualize values in relation to lived experience and offers a coherent foundation for design-oriented value categorization (Strijbos & Basden Reference Strijbos and Basden2006; Basden Reference Basden2011).
2.4. Implications for a triangulation-driven design methodology
Together, the literature on EBD, triangulation and human values reveals the need for a research strategy that integrates empirical patterns, conceptual completeness and practical applicability. Existing approaches either privilege empirical rigor without addressing values systematically or engage values without sufficient methodological grounding.
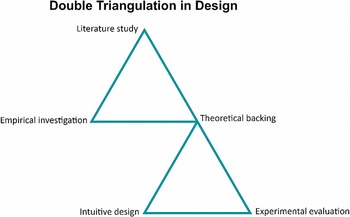
Addressing this gap requires a triangulation-driven methodology in which empirical investigation informs structural relationships, philosophical theory provides conceptual coherence and iterative design experimentation enables translation into usable tools. Accordingly, the present study adopts a multiphase research design combining a cross-disciplinary literature review, a large-scale human values survey (HVS), theoretical synthesis based on Dooyeweerd’s modal aspects and iterative tool development and evaluation. The following section provides details on how this triangulation logic was operationalized methodologically.
3. Methodology
This study adopts a triangulation-driven design research approach to develop and evaluate a value-oriented design tool. Rather than using triangulation solely as a validation technique, it is treated here as a guiding logic for structuring the research process itself (Farmer et al. Reference Farmer, Robinson, Elliott and Eyles2006; Heale & Forbes Reference Heale and Forbes2013). The aim was not simply to combine different sources of evidence, but to allow empirical findings, theoretical perspectives and design experimentation to inform and reshape one another over time.
3.1. Research design and overall approach
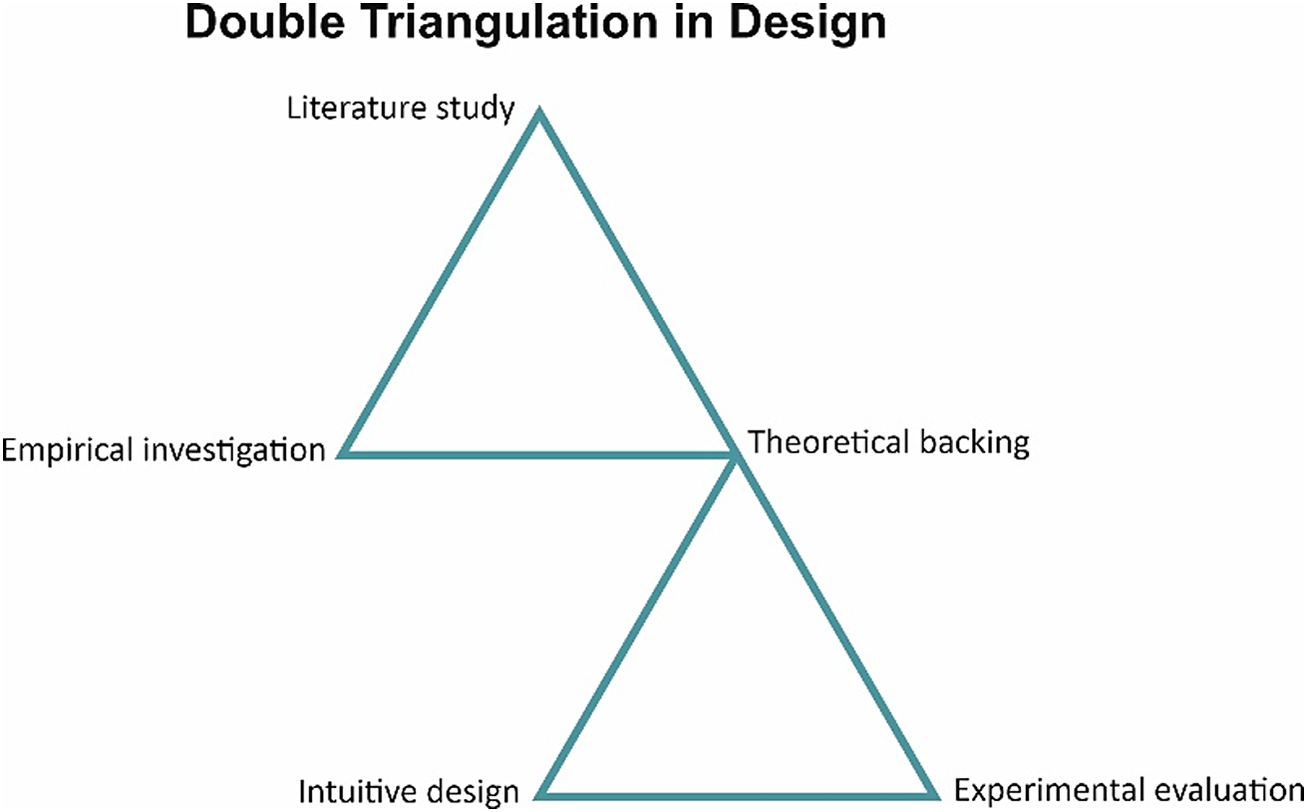
The research was organized as a multiphase process consisting of five interconnected components: (1) literature review, (2) empirical data collection, (3) theoretical grounding, (4) iterative tool development and (5) quasi-experimental evaluation. An overview of this structure and the relationships between these components is presented in Figure 1.
Overview of the triangulation-driven research design employed in this study. The figure illustrates the five interconnected research steps – literature review, empirical data collection, theoretical grounding, iterative tool development and quasi-experimental evaluation – and their reciprocal relationships within the overall design research process.
Rather than treating design experimentation solely as a validation stage, the proposed approach views it as a source of knowledge generation. This perspective is consistent with design science research that considers design cognition, experimentation and artifact development as complementary mechanisms for producing knowledge about design processes and outcomes (Gero & Milovanovic Reference Gero and Milovanovic2020).
This structure was chosen deliberately. Early stages of the research revealed that neither empirical data alone nor existing theoretical value models were sufficient to produce a framework that designers could readily use. Empirical approaches provided observable patterns but lacked conceptual clarity, while theoretical frameworks offered structure but did not always align with how values were interpreted in practice. The triangulation strategy was therefore adopted to bridge this gap.
Importantly, these phases were not conducted in a strictly linear sequence. Instead, insights from each phase informed decisions in the others. For example, clustering results from the empirical study were not immediately fixed into a final framework but were tested through design iterations, while theoretical distinctions were reconsidered when they led to ambiguity in use (see Figure 1).
3.2. Empirical data collection and analytical choices
The empirical component of the study was based on the HVS, conducted with 568 participants from 69 nationalities. Participants represented a diverse international sample in terms of nationality, educational background and age, providing a broad basis for exploring cross-cultural patterns in value prioritization. The detailed procedure of the survey, including sampling strategy and data preparation, has been reported in earlier work (Kheirandish Reference Kheirandish2018, pp. 47–72; Kheirandish et al. Reference Kheirandish, Funk, Wensveen, Verkerk and Rauterberg2020b), but key elements are summarized here to make the present study self-contained.
A card-sorting method was used instead of Likert-scale rating to allow participants to actively group and prioritize values. This choice was motivated by the exploratory nature of the study and is consistent with approaches that seek to capture relational structures rather than isolated value judgments. Participants worked with a set of 63 value items, which were derived from a synthesis of value frameworks across philosophy, sociology and psychology (see Table 1) (The 63 value items in the survey include both adjectives (e.g., healthy, honest) and nouns (e.g., freedom, family security). This linguistic variation follows the structure of the Schwartz Value Survey (Schwartz Reference Schwartz1992), which distinguishes between instrumental values expressed as adjectives (modes of behavior) and terminal values expressed as nouns (end states). The original item formulations were retained to preserve conceptual fidelity with the established instrument.).
To analyze the grouping data, hierarchical cluster analysis was applied. This method was selected because it allows for the exploration of alternative value structures without imposing a predefined number of clusters. Consistent with prior value research (Schwartz Reference Schwartz1992), clustering solutions between five and thirteen groups were examined. Two configurations – a seven-group structure and a nine-group structure – demonstrated the highest levels of coherence and interpretability and were therefore retained for further analysis (see Figure 7).
A key methodological decision was to carry both configurations forward into the design phase rather than selecting a single solution at this stage. This allowed the practical implications of each structure to be evaluated through design use, rather than relying solely on statistical criteria.
3.3. Theoretical grounding and integration
To provide conceptual structure, the empirical clustering results were interpreted in relation to Dooyeweerd’s theory of modal aspects (Dooyeweerd Reference Dooyeweerd1955; Basden Reference Basden2011). This framework was selected because it offers a multidimensional view of human experience, enabling values to be understood as belonging to distinct but interrelated aspects of life.
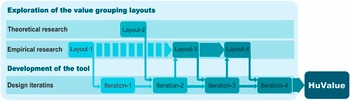
The theoretical model was not imposed directly onto the empirical data. Instead, it was used as an interpretive lens to examine the coherence and completeness of the clustering results. In several cases, tensions emerged between empirical groupings and theoretical distinctions – most notably in the treatment of social and spiritual values. These tensions were not resolved analytically but were explored further during tool development (see Figure 2).
Overview of the four value grouping layouts explored during the iterative development of the HuValue tool. The layouts reflect different combinations of empirical clustering results and theoretical structuring, including seven- and nine-group configurations tested across successive design iterations.
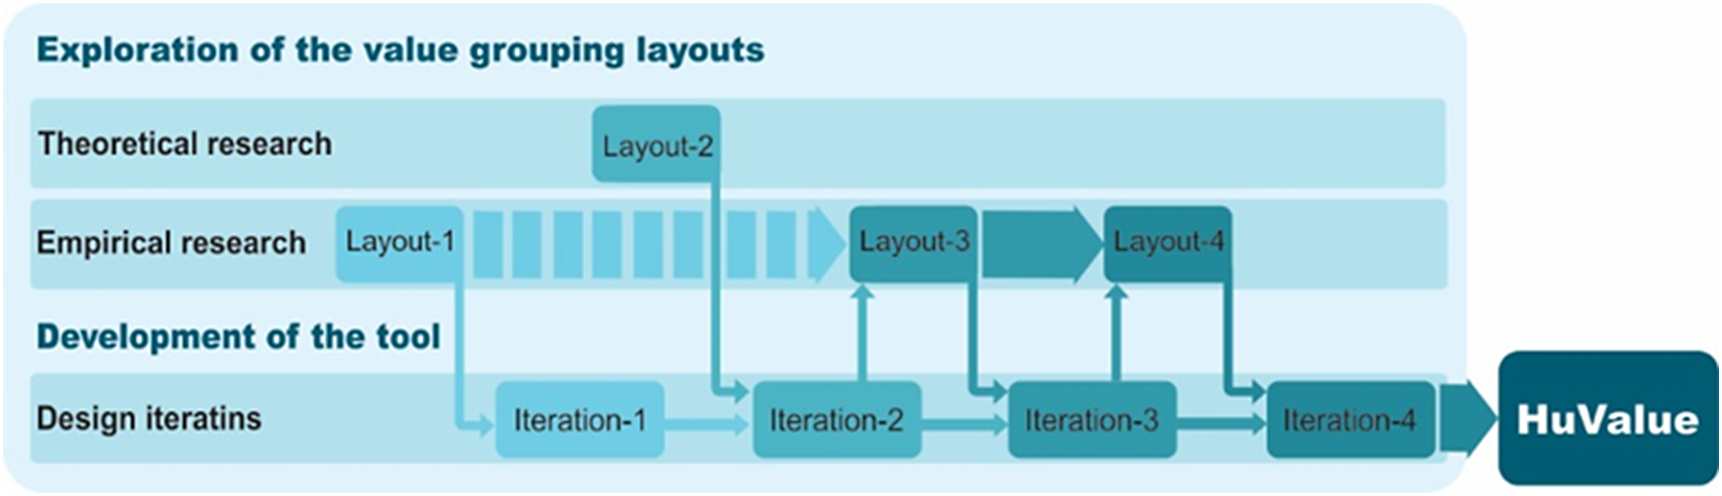
Figure 2. Long description
The flowchart is organized into three horizontal tracks under the heading Exploration of the value grouping layouts.
1. Theoretical research track. Contains Layout-2, which has a downward arrow pointing to Iteration-2 in the bottom track.
2. Empirical research track. Starts with Layout-1 on the far left. A dashed arrow points right toward Layout-3, which then has a solid arrow pointing to Layout-4. Layout-3 and Layout-4 both have downward arrows pointing to Iteration-3 and Iteration-4 respectively.
3. Development of the tool track. Labeled Design iteratins at the bottom, it contains four sequential boxes. Iteration-1 receives an arrow from Layout-1. Iteration-2 receives an arrow from Layout-2 and points upward to Layout-3. Iteration-3 points upward to Layout-4. Iteration-4 receives an arrow from Layout-4 and terminates in a large arrow pointing to a final dark teal box labeled HuValue.
Vertical relationships show that empirical layouts and theoretical research feed into specific design iterations, which in turn refine subsequent layouts until the final tool is produced.
3.4. Tool development as iterative design experimentation
The development of the HuValue tool was approached as a process of iterative design experimentation rather than as the implementation of a predefined framework. Four successive iterations of the tool were developed, each reflecting different configurations of value groupings and representational formats (see Figures 3–6).
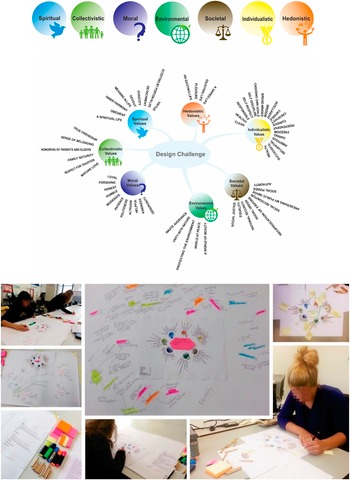
First iteration of the HuValue tool based on an early empirically derived seven-group value structure. The circular layout was designed to support perspective-taking across multiple value dimensions during early-stage design exploration.
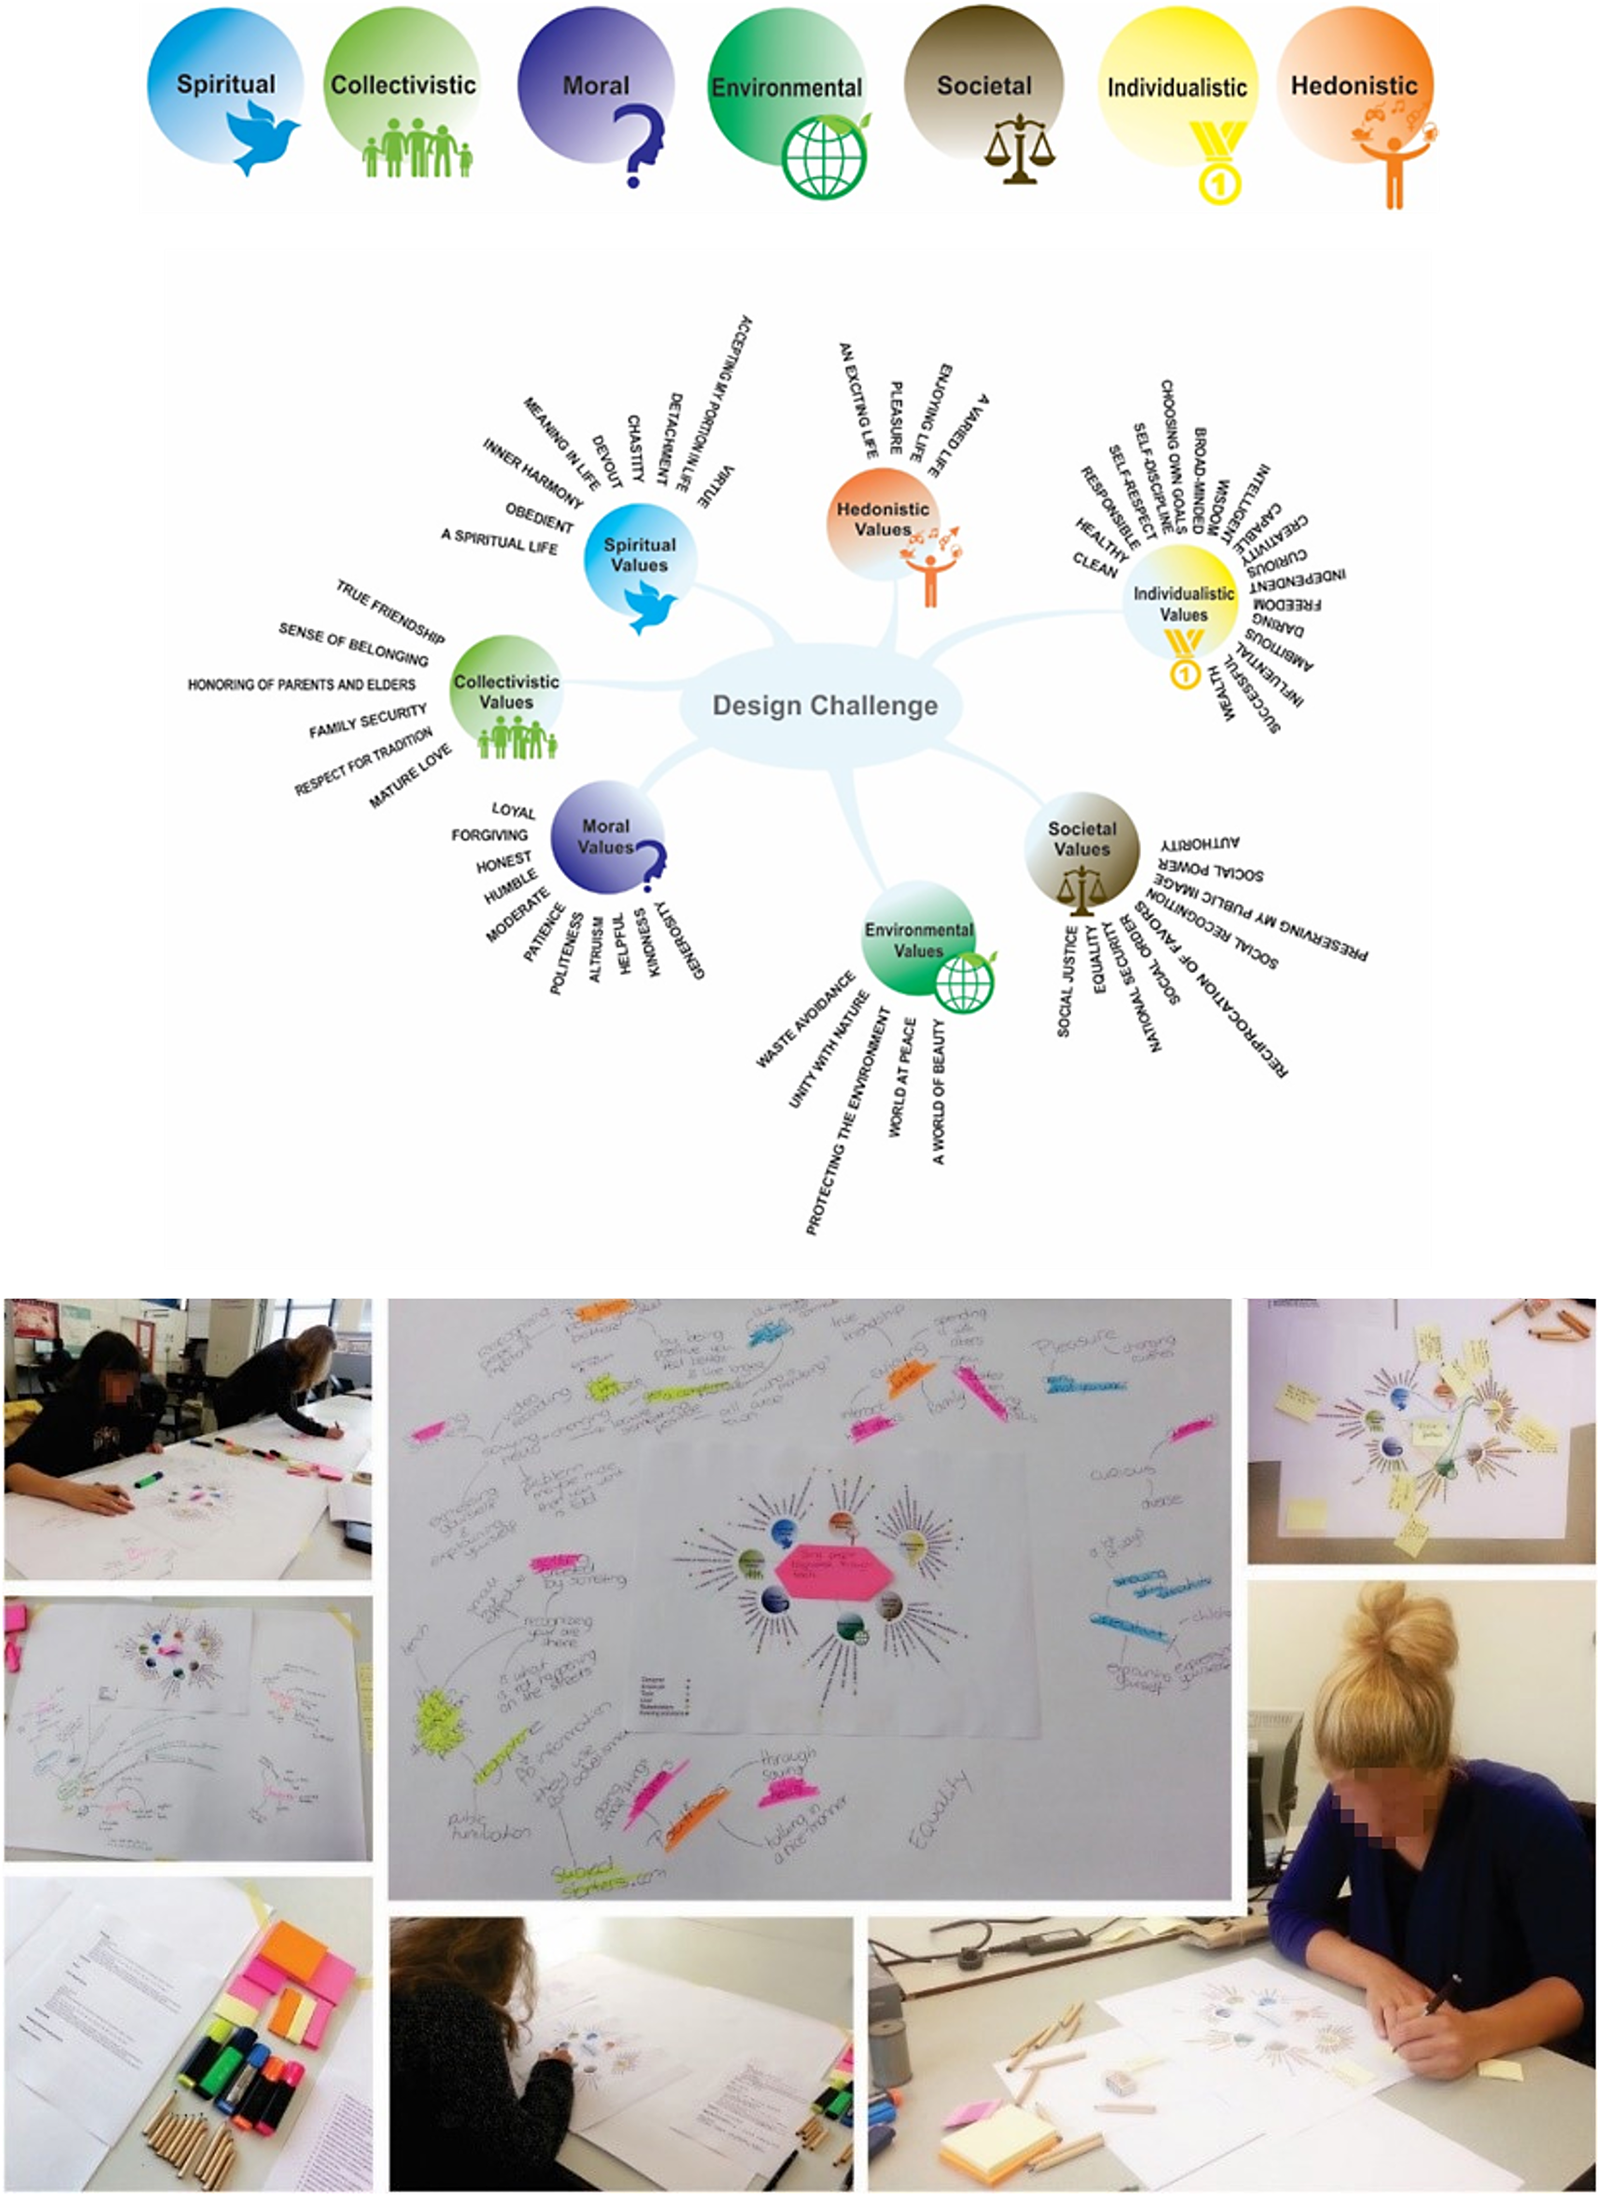
Figure 3. Long description
The top section displays seven circular icons representing value groups. From left to right they are Spiritual (blue bird), Collectivistic (green family), Moral (purple question mark), Environmental (green globe), Societal (brown scales), Individualistic (yellow medal), and Hedonistic (orange figure).
Below this is a radial diagram with ‘Design Challenge’ at the center. Seven colored nodes branch out from this core.
1. Hedonistic Values (top) includes an exciting life, pleasure, enjoying life, and a varied life.
2. Individualistic Values (top-right) includes broad-minded, wisdom, choosing own goals, self-discipline, self-respect, responsible, healthy, clean, intelligent, capable, creativity, curious, independent, freedom, daring, ambitious, influential, wealth, and successful.
3. Societal Values (bottom-right) includes social justice, equality, national security, social order, reciprocation of favors, social recognition, preserving my public image, social power, and authority.
4. Environmental Values (bottom) includes waste avoidance, unity with nature, protecting the environment, world at peace, and a world of beauty.
5. Moral Values (bottom-left) includes loyal, forgiving, honest, humble, moderate, patience, politeness, altruism, helpful, kindness, and generosity.
6. Collectivistic Values (middle-left) includes true friendship, sense of belonging, honoring of parents and elders, family security, respect for tradition, and mature love.
7. Spiritual Values (top-left) includes meaning in life, inner harmony, obedient, a spiritual life, devout, chastity, detachment, accepting my portion in life, and virtue.
The bottom half of the image contains seven photographs showing researchers in a studio setting. They are interacting with large printed versions of the radial diagram, adding sticky notes, and writing annotations during a collaborative design session.
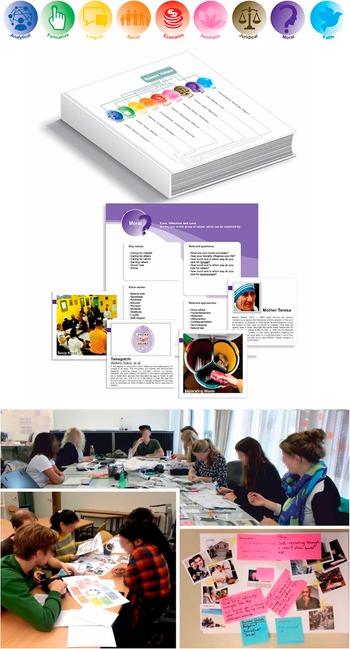
Second iteration of the HuValue tool incorporating a nine-group value structure informed by theoretical grounding. This iteration introduced descriptive value labels, example-based support and a structured card set to assist interpretation and application during design activities.
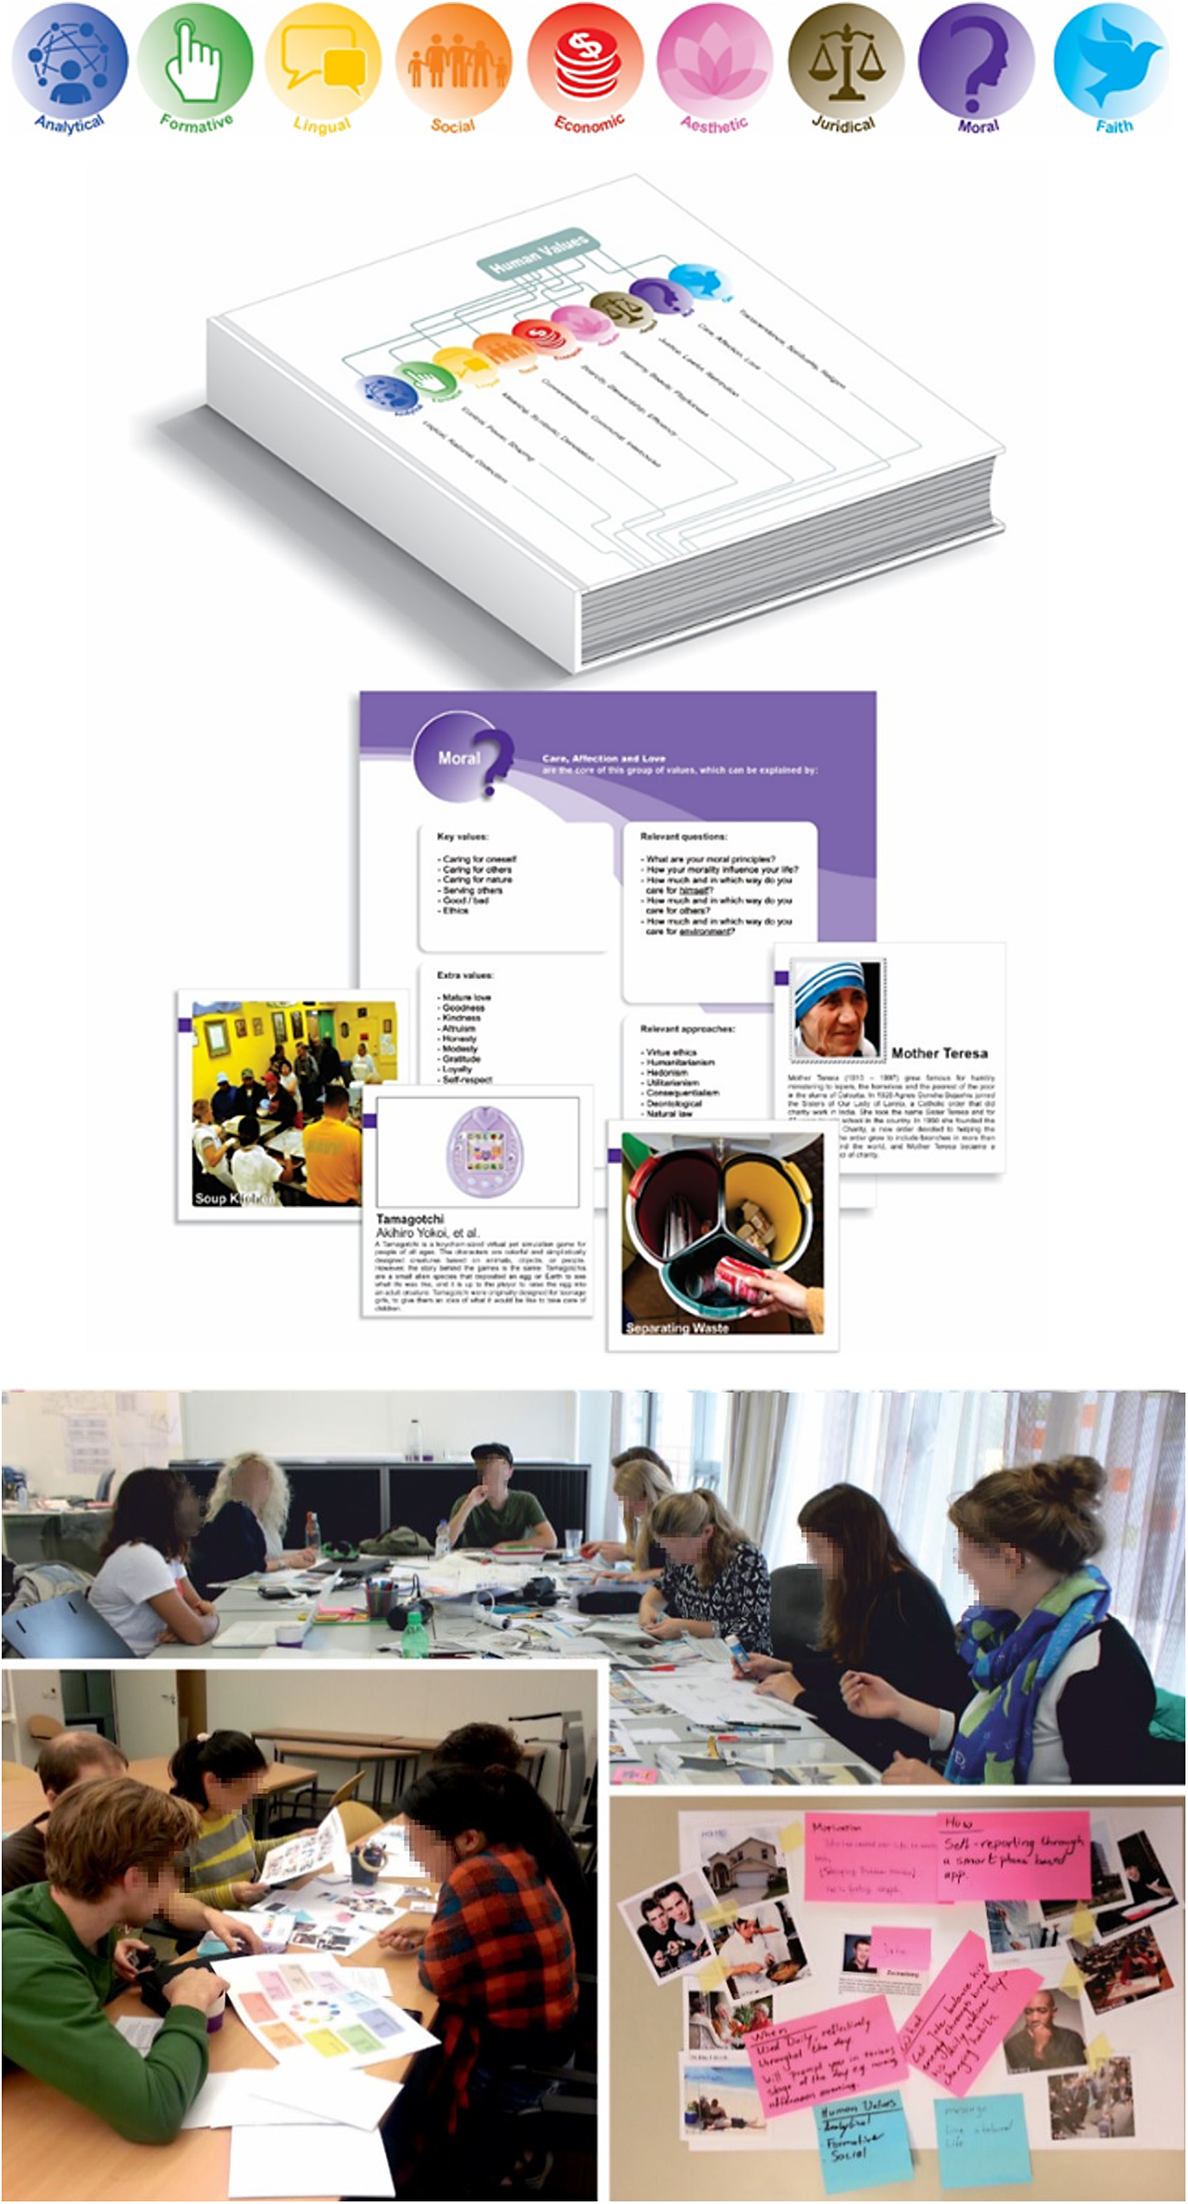
Figure 4. Long description
The image is organized into four vertical sections.
At the top is a horizontal row of nine circular icons representing value groups. From left to right: Analytical (blue, network), Formative (green, hand), Lingual (yellow, speech bubbles), Social (orange, family), Economic (red, coins), Aesthetic (pink, lotus), Juridical (brown, scales), Moral (purple, question mark), and Faith (light blue, dove).
Below the icons is a 3 D rendering of a white book titled Human Values. The cover features a diagram connecting the nine colored icons to specific descriptive labels via thin lines. The labels include: Logic, Knowledge, Science; Technique, Skill, Labor; Language, Signs, Symbols; Family, Community, Friendship; Money, Business, Efficiency; Beauty, Harmony, Art; Justice, Rights, Law; Ethics, Good, Bad; and Belief, Spirituality, Hope.
In the middle section, a detailed purple card for the Moral value is shown. It includes sections for Key values (e.g., Caring for oneself, Ethics), Relevant questions (e.g., What are your moral principles?), Extra values (e.g., Kindness, Loyalty), and Relevant approaches (e.g., Virtue ethics, Utilitarianism). Surrounding this card are four example cards: Soup Kitchen (Social), Tamagotchi (Formative), Separating Waste (Moral), and Mother Teresa (Moral).
The bottom section contains two photographs of design activities. The left photo shows a group of researchers sitting around a table covered in papers and cards. The right photo shows a close-up of a workspace where a participant is reviewing the HuValue chart, alongside a physical mood board with pink and blue sticky notes, photographs, and handwritten annotations describing user motivations and behaviors.
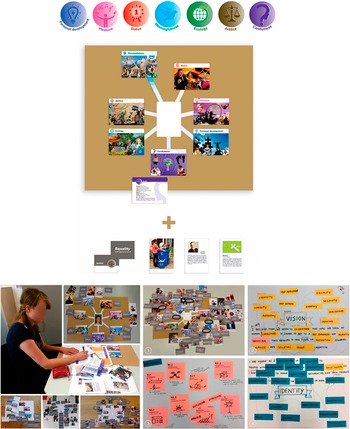
The third iteration of the HuValue tool was developed from the empirically derived clustering results. The tool combines a value wheel with value word cards and picture cards to support stakeholder analysis, reflection and communication of value considerations in design processes.
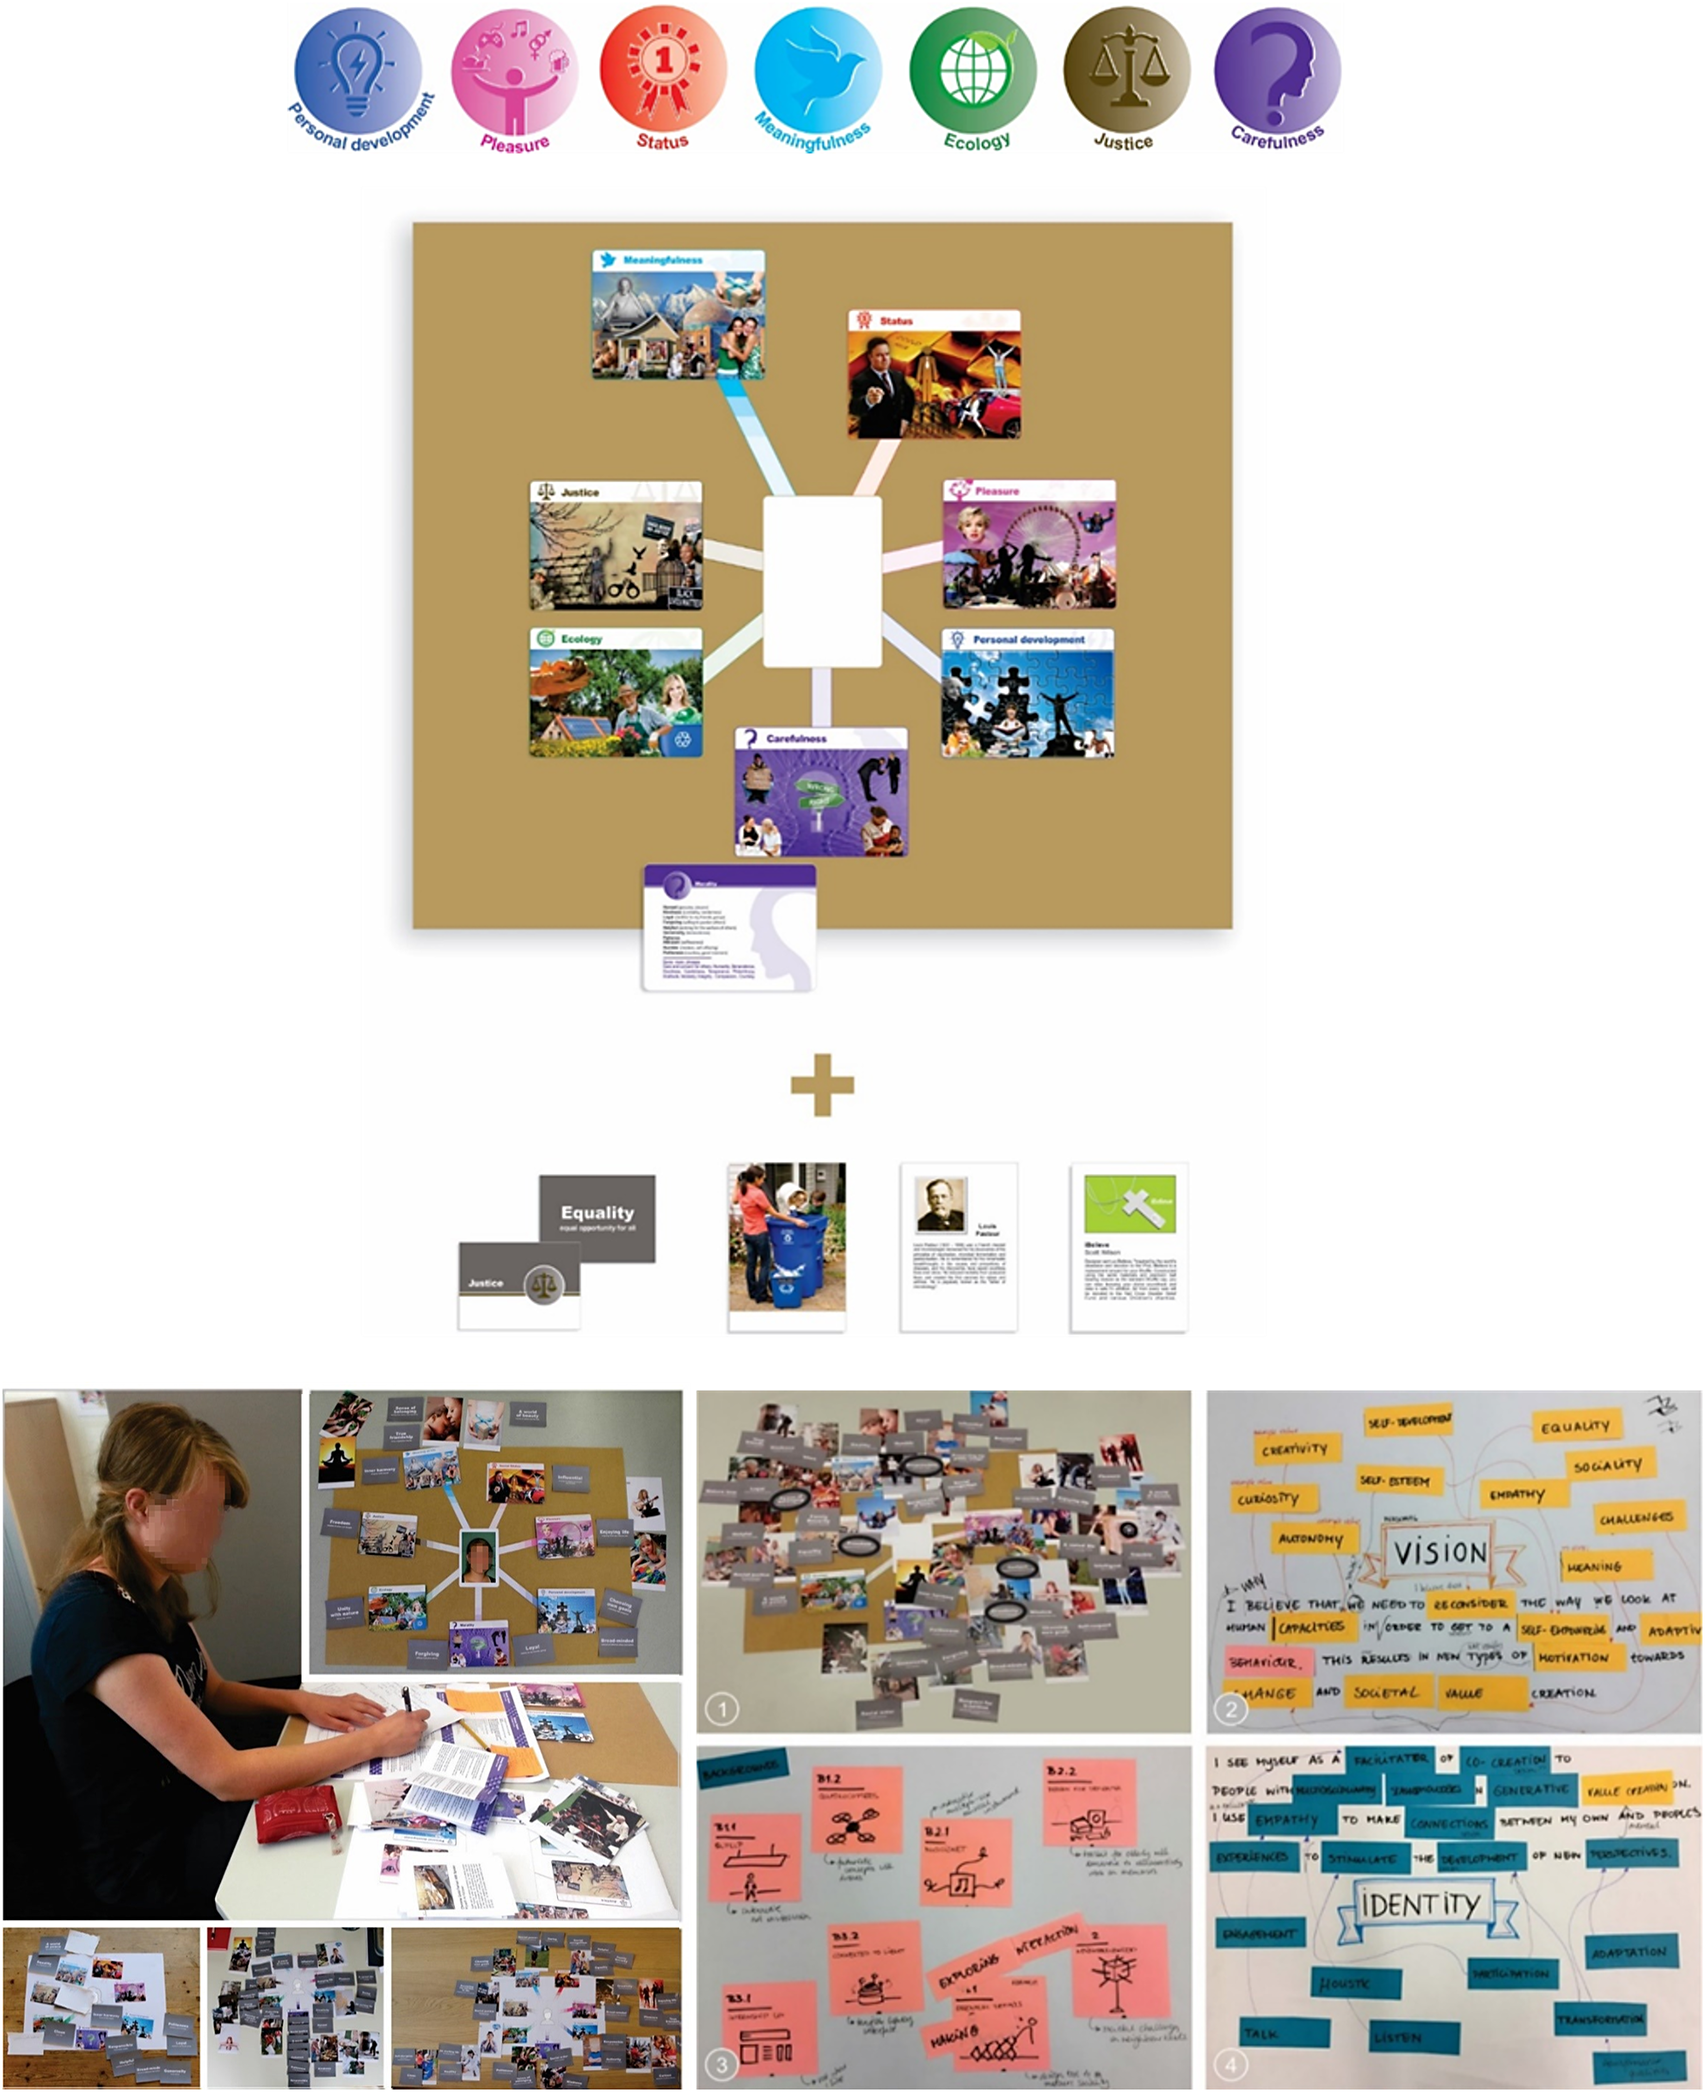
Figure 5. Long description
The image is organized into four vertical sections.
At the top is a horizontal row of seven circular icons representing value categories. From left to right they are. Personal development (blue lightbulb), Pleasure (pink figure with musical notes), Status (red number 1 ribbon), Meaningfulness (cyan dove), Ecology (green globe), Justice (gold scales), and Carefulness (purple question mark).
Below this is a radial diagram on a tan background. A central white rectangle is connected by colored lines to seven picture cards arranged in a circle. The cards correspond to the icons above. Meaningfulness (top left), Status (top right), Pleasure (middle right), Personal development (bottom right), Carefulness (bottom center), Ecology (bottom left), and Justice (middle left). A detailed text card for Status is shown overlapping the bottom of the diagram.
The third section shows a plus sign followed by four sample cards. A grey Equality card, a photo card of people recycling, a biographical card of Louis Pasteur, and a green Justice card with text.
The bottom section is a grid of nine panels showing the tool in use.
- The largest panel on the left shows a researcher writing while interacting with the value wheel and cards.
- Three small panels at the bottom left show different arrangements of cards on tables.
- The center panel shows a large board densely covered in cards and circular markers.
- The right panels show hand-drawn mind maps. One is centered on the word VISION surrounded by orange sticky notes like Creativity, Curiosity, and Empathy. Another is centered on the word IDENTITY surrounded by blue sticky notes like Engagement, Honesty, and Adaptation.
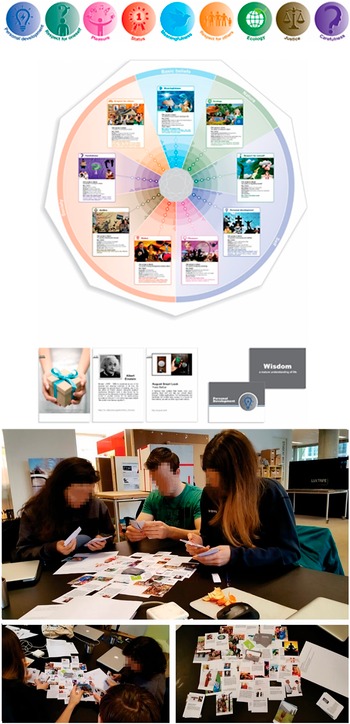
Final version of the HuValue tool based on a nine-group human value framework. The tool consists of a value wheel, value word cards and picture cards designed to support value-sensitive analysis, ideation and evaluation across different stages of the design process. The final tool iteration (Layout-4) adopted a nine-group structure, separating spiritual and social values and subdividing personal development into distinct categories. Preparatory pilot testing with student groups showed improved comprehension of value distinctions, higher engagement during group activities and more precise articulation of value–design relationships. These results supported the tool’s readiness for formal experimental evaluation.
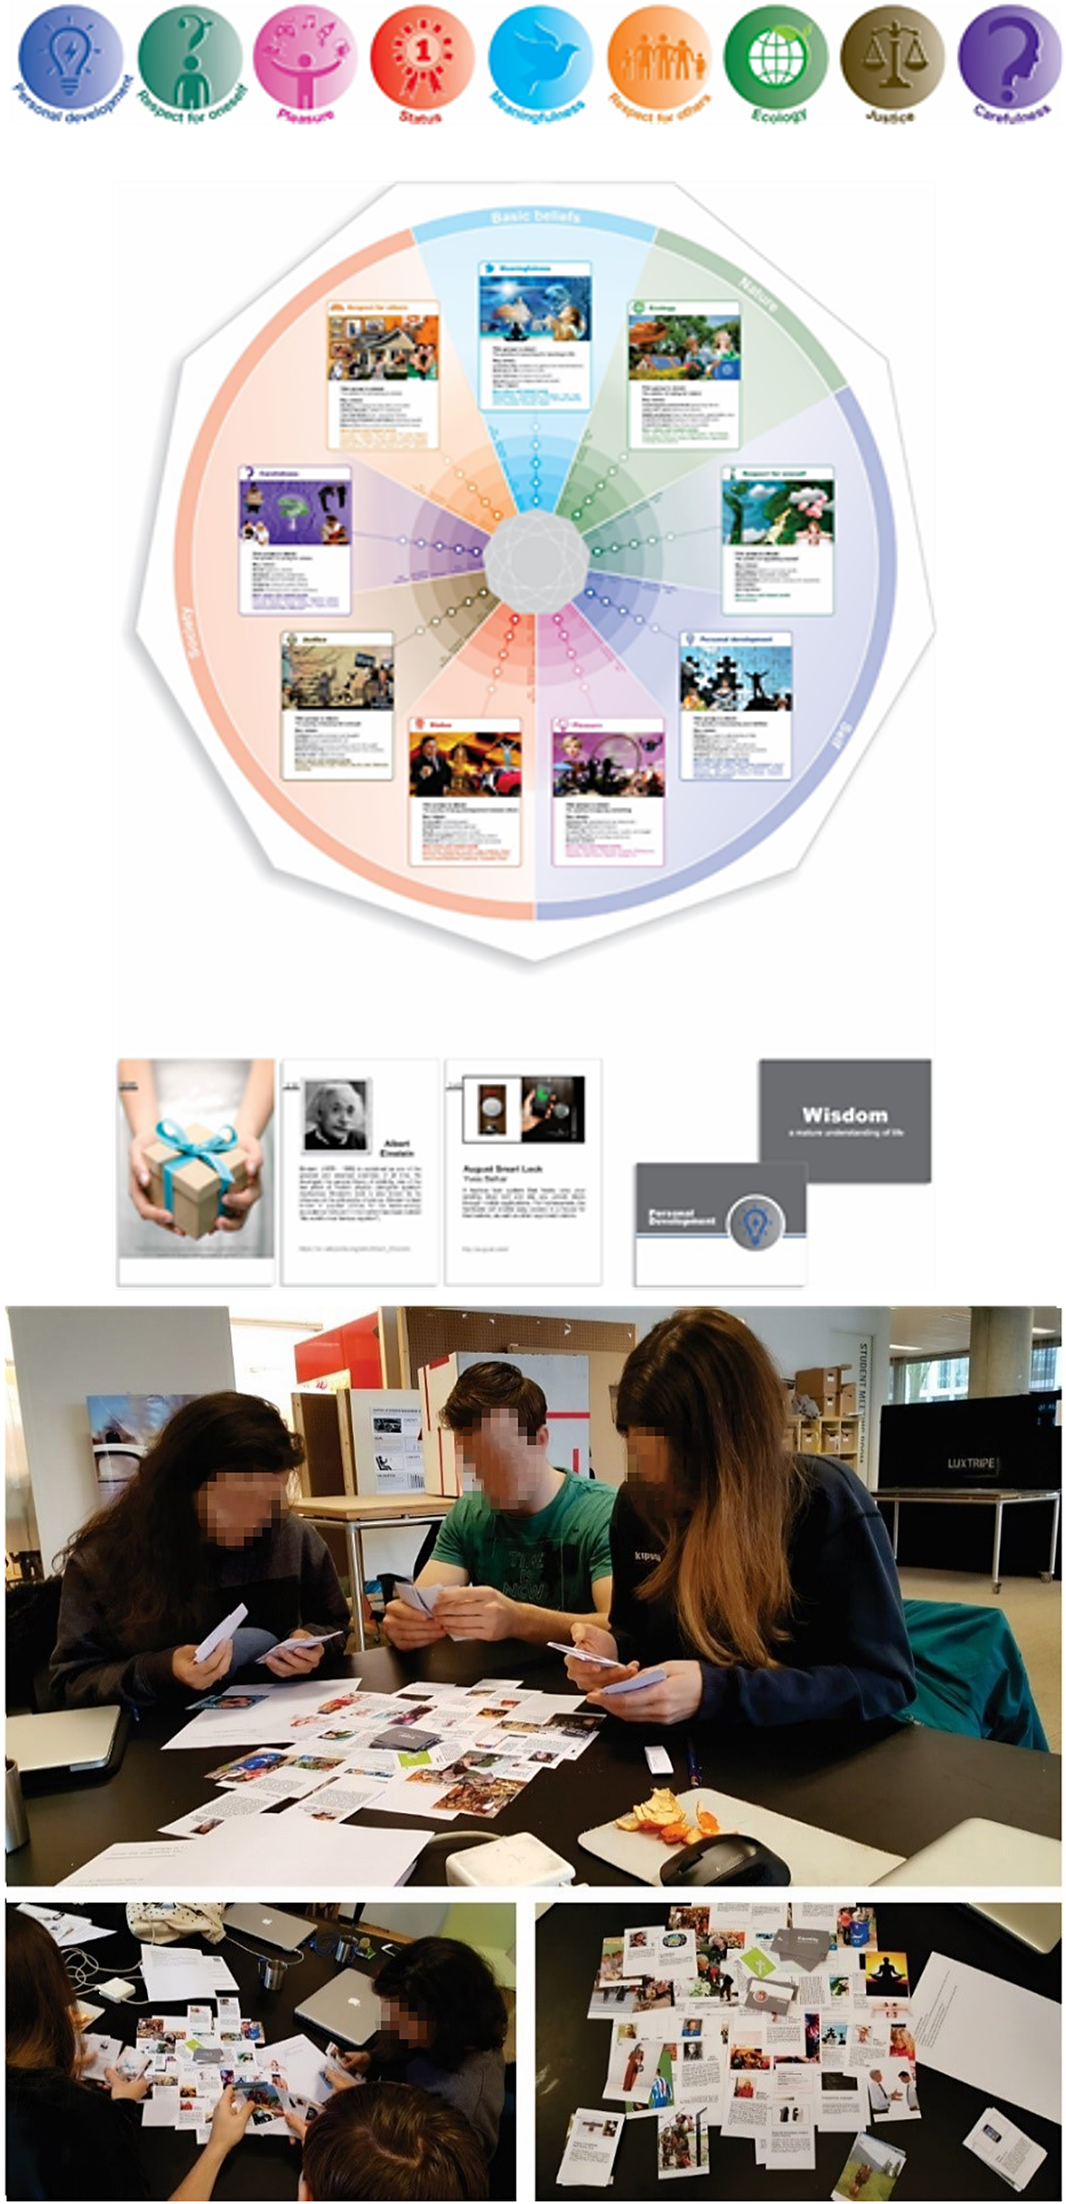
Figure 6. Long description
The image is organized into four vertical sections.
At the top is a horizontal row of nine circular icons representing human values. From left to right: Personal development (light bulb), Respect for oneself (person with question mark), Pleasure (person with arms raised), Status (number 1 ribbon), Meaningfulness (bird), Respect for others (group of people), Ecology (globe), Justice (scales), and Carefulness (question mark).
Below the icons is a large nonagonal radial diagram. At the center is a grey core. Radiating outward are nine colored segments, each containing a series of concentric circles and a representative picture card. The segments are grouped into three overarching categories labeled on the perimeter: Basic beliefs (top), Nature (top-right), Self (right and bottom-right), and Society (left and bottom-left). Each segment corresponds to one of the nine values.
In the third section, four sample cards are shown. Two are picture cards featuring imagery like a gift box or a portrait of Albert Einstein with descriptive text. Two are value word cards, one labeled Wisdom and another labeled Personal Development with its corresponding icon.
The bottom section consists of three photographs showing the tool in a real-world setting. The largest photo shows three students sitting at a table, actively sorting and discussing the value cards. Two smaller photos below show top-down views of the cards spread out on tables during a collaborative design session.
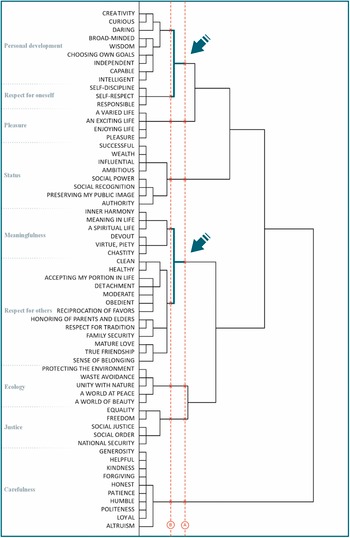
Hierarchical cluster dendrogram derived from the grouping data of the HVS (n = 568). The dendrogram visualizes alternative clustering solutions, including the seven-group and nine-group value structures examined in this study. Cluster points A and B indicate the solutions retained for further testing in tool development.
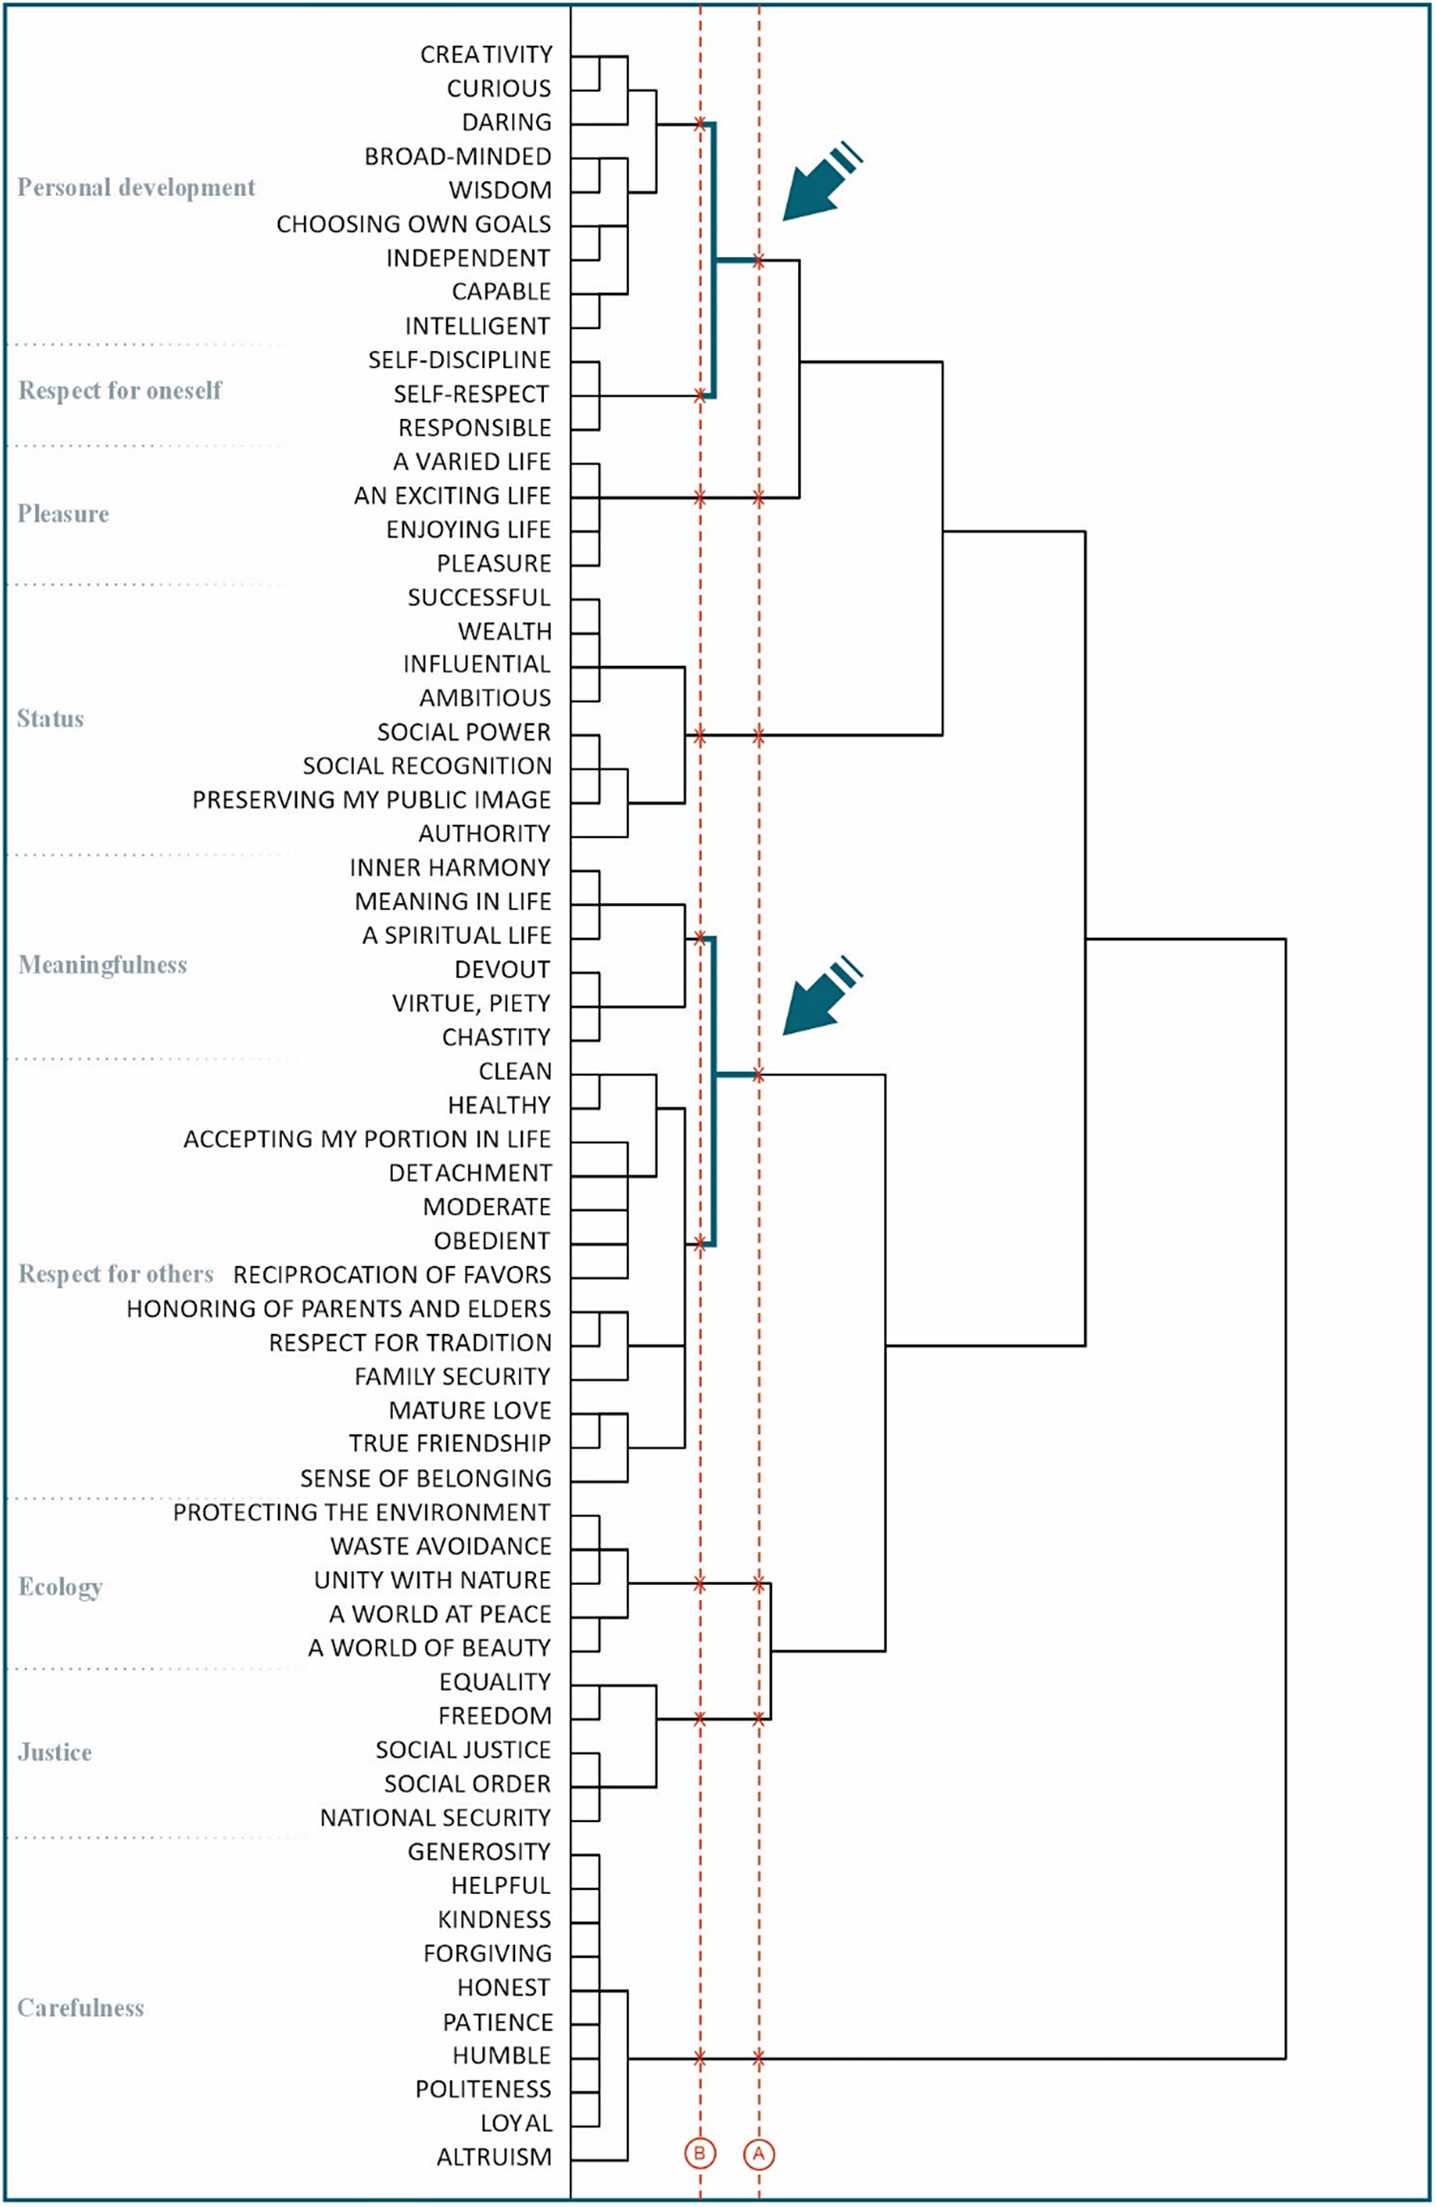
Figure 7. Long description
The dendrogram is organized with a vertical list of 57 specific value labels on the left, grouped into nine overarching categories. From top to bottom, these categories are Personal development, Respect for oneself, Pleasure, Status, Meaningfulness, Respect for others, Ecology, Justice, and Carefulness.
Horizontal lines extend from each value label, branching and merging to the right to form clusters. Two vertical red dashed lines intersect the dendrogram. Line B, located further to the left, represents a nine-group solution. Line A, located further to the right, represents a seven-group solution.
Two teal arrows point to specific cluster nodes. The first arrow points to the junction where Personal development and Respect for oneself merge. The second arrow points to the junction where Meaningfulness and Respect for others merge. These teal-highlighted segments indicate the structural differences between the two solutions. The final broad clusters on the far right merge all categories into two primary branches before joining into a single root.
The iterative studies were not designed as controlled comparisons between the seven-group and nine-group structures. Changes in value structure and changes in tool representation occurred simultaneously across iterations. Therefore, the findings should not be interpreted as causal evidence that the nine-group structure alone produced improved outcomes. Rather, the iterative process revealed recurring interpretive difficulties associated with combining social and spiritual values and separating personal-development-related values. The final nine-group configuration was selected because it consistently supported clearer articulation and discussion of values across design activities, while remaining practically manageable for participants.
Each iteration was evaluated through pilot testing with design students. The focus was on how participants interpreted value categories, how easily they could apply them in design tasks and how the tool supported activities such as ideation, reflection and evaluation. Observations from these sessions revealed recurring issues, including ambiguity in value interpretation and increased cognitive load when too many distinctions were introduced.
One of the most significant findings from this phase concerned the distinction between social and spiritual values. In the seven-group configuration, these values were combined, which led to inconsistent interpretations across participants. In contrast, separating these dimensions in the nine-group configuration resulted in clearer articulation and more consistent use. A second observation concerned self-related values. Participants often distinguished between values associated with personal growth and development (e.g., creativity, curiosity, wisdom) and those associated with self-respect and self-regulation (e.g., responsibility, self-discipline).
Although this distinction was less prominent than the social–spiritual separation, it contributed to the adoption of the nine-group structure. This observation informed the selection of the final framework (see Figure 6; Kheirandish Reference Kheirandish2018, pp. 75–113).
In this way, design experimentation functioned not only as a means of refining the tool, but also as a way of evaluating and revising the underlying value framework.
This highlights a key element of the proposed methodology. Design experimentation was not used solely to improve the artifact itself, but also to generate knowledge about the underlying conceptual framework. Through iterative use, design activities became a mechanism for evaluating, challenging and revising theoretical structures that had emerged from the empirical and theoretical phases. In this sense, artifact development functioned simultaneously as a process of tool refinement and knowledge creation, consistent with contemporary design science perspectives on the role of design inquiry and experimentation in theory development (Simonse, Simons & Skalska Reference Simonse, Simons and Skalska2023; Papalambros et al. Reference Papalambros, Gero, Maier, Cagan, Ahmed-Kristensen, Albers, April, Blessing, Boujut, Cantamessa, Cascini, Chakrabarti, Chen, Clarkson, Jiao, Eckert, Feinberg, Gericke, Hanna, Holtta-Otto, Jankovic, Jin, Kleinsmann, Knight, le Masson, Lewis, Linsey, Luo, McMahon, Nagai, Pigosso, Reich, Reid, Seepersad, Seifert, Shealy, Summers, Vermaas, Wartzack, Yang and Yannou2025).
3.5. Evaluation in a design education context
The final version of the HuValue tool was evaluated through a quasi-experimental study conducted within a first-year industrial design course. The experimental design and detailed results have been reported in earlier publications (Kheirandish Reference Kheirandish2018, pp. 117–191; Kheirandish et al. Reference Kheirandish, Funk, Wensveen, Verkerk and Rauterberg2020a), but are summarized here to support the interpretation of findings in this paper.
The evaluation was conducted within two first-year industrial design projects on the themes of Sleep and Internet of Things (IoT). Student teams developed conceptual design proposals that were documented through final reports and project presentations. These materials were subsequently analyzed to examine how the HuValue tool was used throughout the design process.
Participants were assigned to three conditions: trained group (TG), introduction group (IG) and control group (CG). All groups worked on design projects within the same course context, allowing for comparison of how the tool was adopted and applied. Data collection combined multiple sources, including workshop observations, analysis of design outcomes and project documentation. This multimethod approach enabled triangulation across different types of data, capturing both structured and emergent uses of the tool.
The evaluation strategy combines quantitative and qualitative evidence to assess the influence of the tool on design outcomes and design activities. Such mixed-method approaches have increasingly been advocated in design science research to capture both performance-related outcomes and broader learning effects in design contexts (Raghunath et al. Reference Raghunath, Koronis, Karthikayen, Silva and Yogiaman2023).
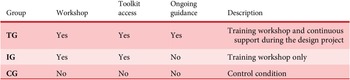
The three conditions enabled comparison of the effects of training, tool availability and continuous support on value-oriented design activities (Table 2).
Overview of participant groups and intervention conditions
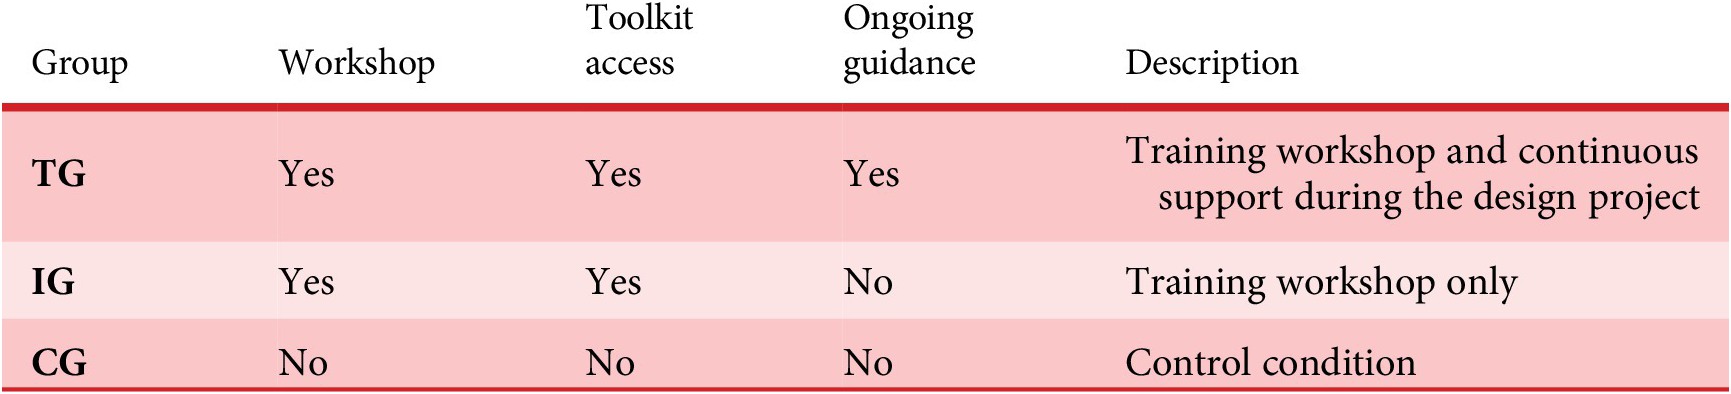
Table 2. Long description
The table consists of five columns: Group, Workshop, Toolkit access, Ongoing guidance, and Description.
* Row 1 (T G): Workshop: Yes; Toolkit access: Yes; Ongoing guidance: Yes; Description: Training workshop and continuous support during the design project.
* Row 2 (I G): Workshop: Yes; Toolkit access: Yes; Ongoing guidance: No; Description: Training workshop only.
* Row 3 (C G): Workshop: No; Toolkit access: No; Ongoing guidance: No; Description: Control condition.
Rather than focusing solely on predefined performance metrics, the evaluation aimed to understand how the tool was appropriated in practice – how designers interpreted value categories, integrated them into their process and adapted the tool to their own working styles. This approach is consistent with the overall research logic of the study, which emphasizes the interaction between empirical evidence, theoretical structure and design practice.
4. Results
This section presents the empirical outcomes of the study by bringing together findings from three interconnected parts of the research: (1) the HVS, (2) the iterative development and testing of the HuValue tool and (3) the quasi-experimental evaluation in a design education context. Rather than reporting these as isolated results, the section highlights how each contributed to the refinement of the value framework and its operationalization.
4.1. Results of the human values survey (HVS)
The first set of findings concerns how participants prioritized and grouped human values. Analysis of the ranking task (Step 1 of the HVS) revealed a consistent pattern across the dataset (n = 568), despite the diversity of participants (69 nationalities). The most frequently prioritized values included healthy (28.2%), freedom (25.5%), family security (21.3%), honest (21.1%) and a spiritual life (21%). These values reflect a combination of physical well-being, autonomy, relational stability, moral orientation and existential meaning, suggesting that participants’ value hierarchies extend across multiple aspects of life rather than being concentrated in a single domain.
It is important to note that “most frequently selected” refers here to the number of participants who placed a given value among their highest-ranked positions during the card-sorting task, rather than a simple frequency count. This distinction is relevant because participants were allowed to assign equal rankings or omit values, resulting in a distribution that reflects relative importance rather than fixed ordering.
The grouping task (Step 2 of the HVS) provided the basis for structural analysis. As shown in the dendrogram in Figure 7, hierarchical cluster analysis of the grouping data resulted in multiple possible configurations. Among these, two clustering solutions – seven groups (cluster point A) and nine groups (cluster point B) – showed the highest levels of internal coherence and interpretability.
The nine-group structure, later adopted in the final framework, consists of value groups such as carefulness, justice, ecology, respect for others, meaningfulness, status, pleasure, respect for oneself and personal development. Compared to the seven-group structure, the key structural difference lies in the separation of social and spiritual/meaning-related values, which are combined in the seven-group model but distinct in the nine-group model.
These results indicate that while empirical clustering can reveal stable patterns in how people relate values, multiple plausible structures can coexist. This observation informed a key methodological decision: rather than selecting a single structure based purely on statistical criteria, both models were carried forward into the design phase for further evaluation.
4.2. Results of iterative tool development and pilot testing
The second set of findings emerged from the iterative development of the HuValue tool, where the empirical structures were translated into tangible design artifacts (see Figures 3–6). Across four iterations, different value grouping configurations and representations were tested in design activities with students.
Early iterations based on the seven-group structure supported broad reflection but revealed recurring ambiguity in interpretation. In particular, participants struggled to distinguish between interpersonal (social) concerns and existential or belief-related (spiritual) values when these were combined under a single category. This often led to inconsistent interpretations across groups and required facilitator intervention.
In later iterations, the introduction of a nine-group structure led to clearer differentiation between value types. Participants were able to articulate value-related arguments more precisely and demonstrated more consistent mapping between identified values and design decisions. Here, “consistent mapping” refers to the alignment between the values explicitly identified during analysis and those reflected in design concepts and justifications presented in project reports.
At the same time, increasing the number of value categories introduced a different challenge: cognitive load. Some participants reported difficulty navigating the full set of value cards under time constraints, particularly when working with analytically oriented or abstract value categories. However, this effect was mitigated by the use of visual elements – especially picture cards – which supported interpretation and discussion.
The final version of the tool (Figure 6), developed through the refinements shown in Figure 5, integrates these insights. It combines a nine-group value framework with three complementary components: a value wheel, value word cards and picture cards. This configuration was found to support both individual reflection and collaborative discussion, enabling participants to externalize and negotiate value considerations more effectively.
The iterative evolution of the HuValue tool reflects a broader design science perspective in which conceptual models and supporting artifacts are progressively refined through repeated cycles of application and reflection. Similar observations have been reported in studies of value-model development, where both the structure of the model and its practical representation evolve as new evidence becomes available during the design process (Bertoni & Bertoni Reference Bertoni and Bertoni2019).
4.3. Results of the quasi-experimental evaluation
The quasi-experimental evaluation was conducted in the context of a first-year undergraduate design project between February and June 2017. From a cohort of 192 students, two project themes were randomly selected, resulting in 16 project groups of four students each (64 students in total). The groups were divided into three conditions: six TGs, six IGs and four CGs. TG received both an introductory workshop and step-by-step guidance during the semester; IG received only the introductory workshop; and CG received no specific support related to human values or the HuValue tool (Kheirandish et al. Reference Kheirandish, Funk, Wensveen, Verkerk and Rauterberg2020a).
4.4. RQ1: Relevance and applicability of the tool
Analysis of project reports and presentations showed that the HuValue tool was used across multiple phases of the design process, including vision definition, ideation, concept development and evaluation. However, its use varied significantly depending on the level of support. All six TGs (6/6) used the tool in their design process. In comparison, only two of the six IGs (2/6) reported using the tool and one CG (1/4) used it after informally receiving it from students in another condition. Statistical analysis confirmed that tool use was significantly dependent on training, χ 2(2) = 20.436, p = .001.
The tool was most frequently applied in early design stages. It was used for defining design goals in seven project groups (26%), selecting final concepts in five groups (18%) and identifying and discussing relevant values in four groups (15%). Additional uses included exploring user perspectives, developing value-informed concepts and supporting group discussions through picture cards.
Across groups that used the tool, design concepts were more frequently accompanied by explicit value-based reasoning. For example, in one project, a group explicitly linked the value of respect for others to design decisions concerning accessibility features for elderly users, demonstrating how values informed both concept development and evaluation. Students did not apply the tool as a fixed procedure but adapted it flexibly as a reflective and discussion-oriented resource within their design process.
4.5. RQ2: Role of training in tool use
Clear differences were observed between the experimental conditions in terms of both the extent and quality of value integration.
Value use was significantly dependent on training, χ 2(6) = 23.886, p = .001. Groups that received structured support (TG) demonstrated broader coverage of value categories, more explicit articulation of values and stronger alignment between identified values and design outcomes.
Evaluation of the final design concepts further confirmed this pattern. Three independent designers assessed the concepts across the nine value clusters based on predefined value indicators derived from the nine value clusters. The total value score differed significantly between conditions, F(2, 15) = 4.265, p = .038. TGs achieved the highest scores (M = 5.83, SE = .63), followed by IGs (M = 4.83, SE = .57) and CGs (M = 3.25, SE = .48).
At the level of individual value clusters, TGs addressed a wider range of values, including meaningfulness, ecology, status and carefulness, which were largely absent in the CGs. However, the difference in value diversity was not statistically significant, F(2, 15) = 2.691, p = .105. This suggests that training primarily influenced the strength and explicitness of value integration rather than simply increasing the number of value categories addressed.
In contrast, IGs showed intermediate behavior: they were able to reference values but often did so inconsistently and without fully integrating them into their design process.
4.6. Summary of findings
Taken together, the results show that:
-
• Empirical analysis can reveal multiple plausible value structures, but their practical usefulness must be evaluated in design contexts.
-
• Iterative design experimentation plays a critical role in refining both the structure and representation of value frameworks.
-
• The HuValue tool enables designers to articulate and work with values more explicitly, particularly when supported by training.
-
• The integration of values into design is not automatic but develops through guided use and iterative engagement.
These findings are not presented as standalone empirical results, but as evidence supporting the proposed double triangulation-driven research logic.
5. Discussion
This study set out to explore how human values can be operationalized within design practice through a triangulation-driven research approach. Rather than treating values as abstract or external considerations, the aim was to understand how they can be translated into forms that designers can actively work with. The findings provide several insights into this process, particularly regarding the role of triangulation, the structuring of value frameworks and the use of design tools in practice.
5.1. Triangulation as a generative research logic
One of the central outcomes of this study is a clearer understanding of triangulation not only as a means of validation, but as a way of structuring design research. While combining multiple methods is not new, what emerges here is the role of triangulation in shaping the development process itself.
In this study, empirical data, theoretical perspectives and design experimentation did not function as separate layers of evidence. Instead, they interacted continuously. For example, the empirical clustering of values produced more than one plausible structure, and the decision between these structures could not be made on statistical grounds alone. It was only through iterative design use that differences in interpretability and applicability became visible.
This suggests that in value-laden design contexts, evidence cannot be reduced to a single type. Empirical patterns, conceptual distinctions and practical usability all contribute to what can be considered “valid” design knowledge. In this sense, triangulation operates less as a tool for confirming results and more as a process for negotiating between different forms of insight.
At the same time, it is important to acknowledge that triangulation in this study does not replace the need for methodological rigor within each component. Rather, it depends on it. The contribution here is therefore not the use of multiple methods per se, but the way in which their results are brought into dialogue during the development of a design artifact.
5.2. Structuring human values: between empirical patterns and conceptual clarity
The comparison between the seven-group and nine-group value structures highlights a recurring tension in design research: the difference between what is empirically observable and what is conceptually meaningful in practice.
From a purely analytical perspective, both clustering solutions were valid. However, their use in design activities revealed important differences. The seven-group structure, while simpler, led to ambiguity – particularly when social and spiritual values were combined. Participants often interpreted these categories differently, which made it harder to use them consistently in design discussions.
In contrast, the nine-group structure introduced clearer distinctions, even though it increased the number of categories. This resulted in more explicit reasoning and more consistent connections between values and design decisions. These findings suggest that, for design purposes, conceptual clarity may be more important than structural simplicity.
More broadly, this points to a limitation of relying solely on existing value models. While widely used frameworks such as Schwartz’s model provide a strong empirical basis, they do not necessarily align with how designers interpret and apply values in practice. The integration of Dooyeweerd’s modal aspects helped address this gap by providing a more comprehensive structure, but it was the interaction with design use that ultimately determined its effectiveness.
5.3. Design tools as mediators: between theory and practice
The development of the HuValue tool illustrates how design artifacts can function as mediators between abstract concepts and practical application. Rather than simply representing the value framework, the tool actively shaped how values were understood and used.
Observations from the pilot studies showed that certain aspects of the framework only became visible through use. For instance, the ambiguity between value categories did not emerge clearly in the analytical phase but became apparent when participants attempted to apply them in design tasks. In this sense, the tool functioned not only as an outcome of the research but also as a means of generating insight.
This challenges a linear view of design research in which theory is developed first and then applied. Instead, the findings support a more iterative relationship in which theory and artifact coevolve. Design tools, in this context, are not just instruments for applying knowledge, but also for refining it.
5.4. Training and the situated nature of method adoption
The quasi-experimental evaluation provides further insight into how design tools are adopted in practice. While the HuValue tool was used across different groups, the depth and consistency of its use varied significantly depending on the level of training.
Participants who received structured guidance were more likely to integrate values explicitly and systematically into their design work. They not only used the tool more consistently, but also demonstrated a broader and more deliberate engagement with value considerations. In contrast, participants with only initial exposure tended to use the tool more selectively, and often without fully integrating it into their process.
These findings suggest that the use of value-oriented design tools is not self-evident. It requires a degree of familiarity and practice. This aligns with the idea that design methods are not simply applied, but learned and adapted within specific contexts.
At the same time, the fact that even minimally supported groups were able to appropriate the tool indicates a degree of flexibility. The tool did not enforce a fixed way of working but allowed designers to integrate it into their existing practices.
5.5. Contribution to design science
From a design science perspective, the contribution of this study lies primarily in making the research process explicit. Rather than presenting only a final artifact or framework, the study shows how such outcomes can be developed through the interaction of empirical research, theoretical structuring and design experimentation.
More broadly, the study contributes to design science by demonstrating how artifact development can simultaneously produce practical design support and theoretical knowledge. This aligns with contemporary interpretations of design science as a discipline concerned not only with creating artifacts but also with generating transferable knowledge about designing and design processes (Papalambros et al. Reference Papalambros, Gero, Maier, Cagan, Ahmed-Kristensen, Albers, April, Blessing, Boujut, Cantamessa, Cascini, Chakrabarti, Chen, Clarkson, Jiao, Eckert, Feinberg, Gericke, Hanna, Holtta-Otto, Jankovic, Jin, Kleinsmann, Knight, le Masson, Lewis, Linsey, Luo, McMahon, Nagai, Pigosso, Reich, Reid, Seepersad, Seifert, Shealy, Summers, Vermaas, Wartzack, Yang and Yannou2025).
More specifically, the study contributes by: demonstrating how triangulation can be used as a structuring logic for design research, showing how abstract constructs such as human values can be translated into design-relevant forms and providing insight into how design tools are interpreted and used in practice. The contribution is not the introduction of triangulation itself, but its operationalization as a design research logic for tool development.
Importantly, these contributions are not tied to a specific tool or value framework. Instead, they point toward a more general approach to developing design methods in contexts where multiple forms of knowledge need to be integrated.
5.6. Limitations and scope
The findings of this study should be understood within the context in which the research was conducted. The evaluation took place in a design education setting with first-year students, which provides a controlled but limited view of how the tool might be used in professional practice.
In addition, the value framework developed in this study is based on a specific combination of empirical data, theoretical perspectives and design decisions. Alternative configurations are possible, and the framework should not be interpreted as exhaustive.
Finally, the study focuses on the integration of values within the design process rather than on the long-term impact of resulting designs. Future work could extend this by examining how value-oriented design tools influence outcomes in real-world contexts.
6. Concluding reflection
Taken together, the results suggest that integrating human values into design is less a matter of identifying the “right” values and more a matter of creating conditions in which values can be explored, articulated and negotiated. The triangulation-driven approach presented in this study offers one way of structuring such a process, linking empirical insight, conceptual understanding and design practice in a way that remains open to refinement through use.
Funding statement
Open access funding provided by Eindhoven University of Technology
Ethics statement
Approval of all ethical and experimental procedures and protocols was granted by the Institutional Review Boards of the Eindhoven University of Technology under Case No. 514.

 Open access

