


Population representativeness in prospective cohort studies is key to the generalisability of results on the relationship between diet and health. The recruitment of individuals from underrepresented groups such as deprived and socio-economically disadvantaged populations remains an important challenge(Reference George, Duran and Norris1,Reference Davis, Arnold and Mills2) , leading to efforts to better understand barriers and facilitators to participation in such research projects. Barriers to participation of these populations in prospective cohort studies include length and complexity of questionnaires, commitment and time burden, lack of incentives and mistrust in research(Reference Bonevski, Randell and Paul3–Reference Côté, Harrison and Lapointe6).
Along with efforts to facilitate participation, additional strategies are needed to compensate for the lack of representation of socio-economically disadvantaged populations in prospective cohort studies evaluating the association between dietary intakes and health outcomes. Machine learning (ML), which encompasses methods and approaches that have the capacity to learn from data without being explicitly programmed, has become of great interest in predictive modelling due to potential advantages over traditional statistical models. Traditional statistical models, like linear and logistic regression, are based on a set of rules and assumptions that do not allow for much flexibility and have limited capacity to deal with a large number of variables(Reference Côté and Lamarche7–Reference Morgenstern, Rosella and Costa9). Comparatively, ML algorithms are more flexible, make fewer assumptions and can process high-dimensional data. ML algorithms may allow the creation of predictive models trained largely on population samples that underrepresent deprived or socio-economically disadvantaged groups, while still performing reliably in such populations. Indeed, prior studies have demonstrated that ML algorithms can identify predictors of health outcomes that are generalisable across multiple subgroups within a population sample(Reference Rodriguez, Padilla, Bruce, Bichel-Findlay, Otero, Scott and Huesing10–Reference Ravaut, Harish and Sadeghi12), suggesting that certain predictor–outcome relationships may be robust across sociodemographic strata. Although this approach should not be interpreted as a reason to lessen efforts to recruit underrepresented groups in nutrition epidemiology research, ML‑based predictive models developed using current population-based data may help promote greater equity in how such models are applied within healthcare. Finally, whether ML algorithms can identify predictors of diet quality indices that are robust across a range of sociodemographic characteristics has yet to be evaluated.
While some argue that ML could help mitigate biases in healthcare(Reference Chen, Joshi and Ghassemi13), concerns have also been raised in relation to its potential to amplify existing societal biases and disparities(Reference Gianfrancesco, Tamang and Yazdany14,Reference McCoy, Banja and Ghassemi15) . In a review on bias in ML to address non-communicable diseases at a population level, authors raised a lack of discussion surrounding bias and ML algorithms in population health settings(Reference Birdi, Rabet and Durant16). These findings highlight the importance of evaluating the validity of ML algorithms across diverse population groups. Therefore, this study aimed to test the accuracy of ML algorithms developed using data from a general population to predict various diet quality indices among a group of individuals that is typically underrepresented in research. More precisely, the study aimed to develop ML algorithms that predict three indices of diet quality in a general sample from the NutriQuébec project and validate their applicability to a sample with a high deprivation score, representing a low socio-economic status. We hypothesised that ML algorithms predict the indices of diet quality with the same accuracy in both the general sample and the high deprivation sample of the NutriQuébec project.
Methods
Study population
The NutriQuébec project is a prospective cohort study that aims to document the dietary practices and behavioural determinants of health of the Québec population over time. The NutriQuébec project design and methodology have been previously detailed(Reference Lapointe, Laramee and Belanger-Gravel17). Briefly, recruitment for the NutriQuébec project began in 2019 and will continue uninterruptedly at least until 2026. The NutriQuébec project recruits adults aged 18 years and above and living in the Province of Québec, Canada. Participants must speak French or English, have access to the Internet and have a valid email address. Participants are invited annually to complete a series of questionnaires over a 1-month period regarding their sociodemographic characteristics, physical activity, alcohol, tobacco and drug use, physical and mental health, screen use, sleep habits and household food security. Baseline (first year of participation) characteristics for each participant were used for this analysis. Participants are also invited each year to complete up to three web-based 24-h recalls measuring food intakes. The 24-h recalls are administered using a web-based tool, the R24W, which has been shown to have reasonable relative validity(Reference Jacques, Lemieux and Lamarche18–Reference Lafrenière, Lamarche and Laramée21). The complete list of questionnaires is provided in online Supplementary Table 1.
To address the underrepresentation of socio-economically disadvantaged populations observed in the NutriQuébec cohort up to 2022, the project intensified efforts in 2023 to recruit participants from socio-economically disadvantaged groups, with a target of 500 new participants over three years. Recruitment was conducted in collaboration with community organisations serving low-income populations across nine of the seventeen administrative regions of the Province of Québec. The NutriQuébec team provided on-site support to facilitate participation, and financial compensation was offered as an incentive.
The present analyses are based on data collected between June 2019, the start of the study, and June 2025, the start of the analyses. Participants who were pregnant, had more than 50 % of missing data, had missing data for variables related to the deprivation score or had missing data for the diet quality indices were excluded from the analyses.
Diet quality indices
The development of ML algorithms and associated prediction performance are context-dependent, that is, results obtained through the development of an ML algorithm to predict one index of diet quality may not be identical to those for other indices of diet quality. ML algorithms were therefore developed to predict three distinct dichotomous surrogates of diet quality labelled as low or high: overall diet quality, vegetables and fruit consumption (VFC) and ‘other foods’ consumption (OFC). Overall diet quality assesses dietary patterns in a comprehensive way by measuring adherence to the 2019 Canada’s Food Guide (CFG) recommendations on healthy food choices (see below). VFC and OFC assess more simple surrogates or indices of diet quality. A high VFC corresponds to a favourable dietary practice and has been extensively used as a marker of diet quality in nutrition research. A high OFC corresponds to an unfavourable dietary practice as OFC represents foods and beverages not included in the 2019 CFG recommendations, like sweets, highly processed foods and sugary drinks. OFC generally encompasses foods classified as category 4 (ultra-processed foods) of the NOVA classification system(Reference Monteiro, Levy and Claro22).
Dietary intakes were measured at baseline (first year of participation) using one to three 24-h recalls that were administered to the NutriQuébec participants over a 1-month period on three randomly selected separate unannounced days (2 weekdays and 1 weekend day). At each recall, participants were requested to report all the foods and beverages they had consumed in the previous 24 h. Each food or beverage listed in the web-based 24-h recalls is associated with nutritional values sourced from the latest Canadian Nutrient File (the latest version being v2015)(Reference Deeks, Verreault and Cheung23), permitting the automated calculation of nutrient intakes for each participant. Overall diet quality was estimated using the Healthy Eating Food Index-2019 (HEFI-2019), which measures adherence to the 2019 CFG recommendations on healthy food choices(Reference Brassard, Elvidge Munene and St-Pierre24,Reference Brassard, Elvidge Munene and St-Pierre25) . The HEFI-2019 includes ten components for a total of 80 points, with higher scores indicating a higher adherence to 2019 CFG. The amount of vegetables and fruits and ‘other foods’ reported in the 24-h recalls were converted to reference amounts (RA), which in Canada represent amount of food typically consumed in one sitting in grams for solid foods or in millilitres for liquids(26). There is no universal adequate or inadequate cut-off for the consumption of vegetables and fruits, ‘other foods’ and overall diet quality in Canada. In that context, arbitrary cut-off values were used to define low and high consumption. VFC was dichotomised based on the population target in the Province of Québec of five servings or more per day (low: < 5·0 RA/d; high: ≥ 5·0 RA/d)(27). OFC was dichotomised based on the median in the NutriQuébec sample (low: ≤ 5·0 RA/d; high: > 5·0 RA/d). Overall diet quality (HEFI-2019) was dichotomised based on the median in the NutriQuébec sample (low: ≤ 48·9 points; high: > 48·9 points). For VFC and overall diet quality, high can be considered favourable behaviours, whereas high for OFC can be considered an unfavourable behaviour.
Predictor variables
The questions from the questionnaires administered to the NutriQuébec participants (online Supplementary Table 1) were used as predictor variables in the present analyses. Questions from the Food security questionnaire and the Fruit and vegetable questionnaire were excluded since these variables were directly related to the outcome variables or to the deprivation score. All other questionnaires were reviewed to exclude any questions directly related to the outcome variables or the deprivation score. When applicable, compounded scores/indices instead of individual questions were included as predictor variables (Pittsburgh Sleep Quality Index(Reference Buysse, Reynolds and Monk28), Medical Outcome Study Short Form(Reference Garratt, Ruta and Abdalla29) and Physical Activity Questionnaire(Reference Godin30,Reference Wareham, Jakes and Rennie31) ). Categorical variables were dummy-coded with a specific binary code for missing data. Missing data for continuous variables were imputed using multivariate imputation by chained equations(Reference van Buuren and Groothuis-Oudshoorn32). In total, 122 predictors were included in the analyses.
Total deprivation score
Socio-economic status in the scientific literature is commonly assessed using any one or combinations of the following variables: the level of education, household income, marital status, occupation as well as social and material deprivation(Reference Bae, Lim and Yang33–Reference Hollingshead35). For the purpose of this study, a deprivation score based on household income per consumption unit, education, social deprivation and material deprivation was developed to represent socio-economic deprivation. Household income was measured with the question: ‘For the past 12 months, what was the approximate total income (gross income), from all sources before taxes and other deductions, of all members of your household?’. Household income was then divided by the number of consumption units (CU), defined as follows: 1 CU for the first adult, 0·5 CU for each additional household member aged 14 years or older and 0·3 CU for each child under 14 years of age. Information on education was obtained with the question: ‘What is the highest certificate, diploma or degree that you have completed?’. Based on the postal code, social and material deprivations were assessed using the Material and Social Deprivation Index developed by the Institut national de santé publique du Québec (36). Social deprivation reflects a poor social network, that is, being widowed, separated or divorced, living alone or in a single-parent family. Material deprivation reflects deprivation of goods and conveniences and a low proportion of employment in the living area. These metrics are based on the measure of material and social deprivation in dissemination areas in the Province of Québec, with quintiles of material deprivation and social deprivation assigned to individuals according to their postal code(36).
The total deprivation score was calculated using the following four subscores: household income per consumption unit (1 to 5 points, higher points indicating a lower household income based on the following categories: ≥ 100 000 CAD$, 70 000–< 100 000 CAD$, 45 000–< 70 000 CAD$, 25 000–< 45 000 CAD$ and < 25 000 CAD$), participant’s education (1 to 5 points, higher points indicating a lower education based on the following categories: University degree, CEGEP degree, Trade school degree, High school degree and No diploma), material deprivation (1 to 5 points based on predetermined values, with higher points indicating higher material deprivation) and social deprivation (1 to 5 points based on predetermined values, with higher points indicating higher social deprivation) (online Supplementary Table 2). The resulting total deprivation score was calculated as the sum of these four subscores, with higher scores on a 20-point scale indicating a higher degree of deprivation.
Participants were classified into fifths based on the distribution of the deprivation score in the study sample. Participants with a score within the first four fifths (deprivation scores < 13 points) were referred to as the general NutriQuébec sample, in which the ML algorithms were developed and tested. These participants closely reflect the characteristics of individuals most often represented in prospective cohort studies. Participants with a deprivation score in the highest fifth (≥ 13 points) represented a socio-economically disadvantaged population, often underrepresented in cohort studies, and this sample was used as the validation sample.
Data modelling
ML is a data-driven approach, in which algorithms can learn to perform a classification task through a training process. The general NutriQuébec sample used to develop and test the algorithms was randomly split into two non-overlapping datasets: the train set (75 %) and the test set (25 %). The train set was used to develop and optimise the ML algorithms to perform the classification task (i.e. predicting the two labels (low/high) of the diet quality indices). More specifically, during the training process, the labels of the diet quality indices (low/high) are visible to the algorithms, with the purpose of letting the algorithms identify (learn) the variables that best predict the labels of the diet quality indices without human intervention. The test set, in which the labels are unknown to the algorithms, is used to evaluate the performance of the algorithms using metrics such as accuracy (proportion of correct predictions) and area under the receiver operating curve (AUROC). Finally, the validation step that verifies applicability of the algorithms to other populations was undertaken in the high deprivation sample (as defined above).
Random forest (RF) algorithms were used for the classification task(Reference Zhang and Ma37). RF algorithms generate multiple decision trees with bootstrapped samples of the data. The predicted class label in the test set was determined by averaging the predicted label of each decision tree from the RF algorithm. The hyperparameters were tuned using Bayesian optimisation, an iterative process based on Bayes theorem(Reference Wu, Chen and Zhang38). This technique is considered more efficient and accurate for the optimisation of hyperparameters than traditional optimisation techniques, like GridSearch (Reference Wu, Chen and Zhang38). All analytical steps of the algorithm development (train, test and validation) were bootstrapped 100 times to generate measurement errors and 95 % CI.
Interpretability and explainability of ML algorithms are necessary to assure transparency in the development of ML algorithms and their ethical use in healthcare research(Reference Amann, Blasimme and Vayena39–Reference Wojtusiak41). Steps towards transparency can include choosing interpretable algorithms and reporting variables retained by the algorithm for prediction. Accordingly, the discriminant variables retained by the RF algorithms were examined. Specifically, variable importance was assessed using mean decrease in impurity, which quantifies the total decrease in impurity attributable to each variable across all the trees. The top ten predictor variables were identified based on their aggregated importance across bootstrap iterations. Importance values were normalised to obtain the relative contribution of each predictor, expressed as a percentage of the total importance of all variables retained by the model. Higher percentages indicate that the variable consistently contributed more to reducing model impurity and thus had greater influence on the model predictions.
Since the NutriQuébec sample is not a representative sample of the general Québec population, sensitivity analyses were performed while training the RF algorithms using a weighted resampling technique. Briefly, the train set was resampled to generate a sample representative of the Québec population based on sex, age, education and Census metropolitan area data (online Supplementary Table 3). For instance, the original train set contained 77·5 % of females. Using the weighted resampling technique, the generated train set contained 50 % of females, consistent with the distribution of sex in the general Québec population. The classification algorithms were developed using this weighted train set and then tested and validated in sensitivity analyses using the approach described above. All analyses were carried out in Python 3.9.13.
Results
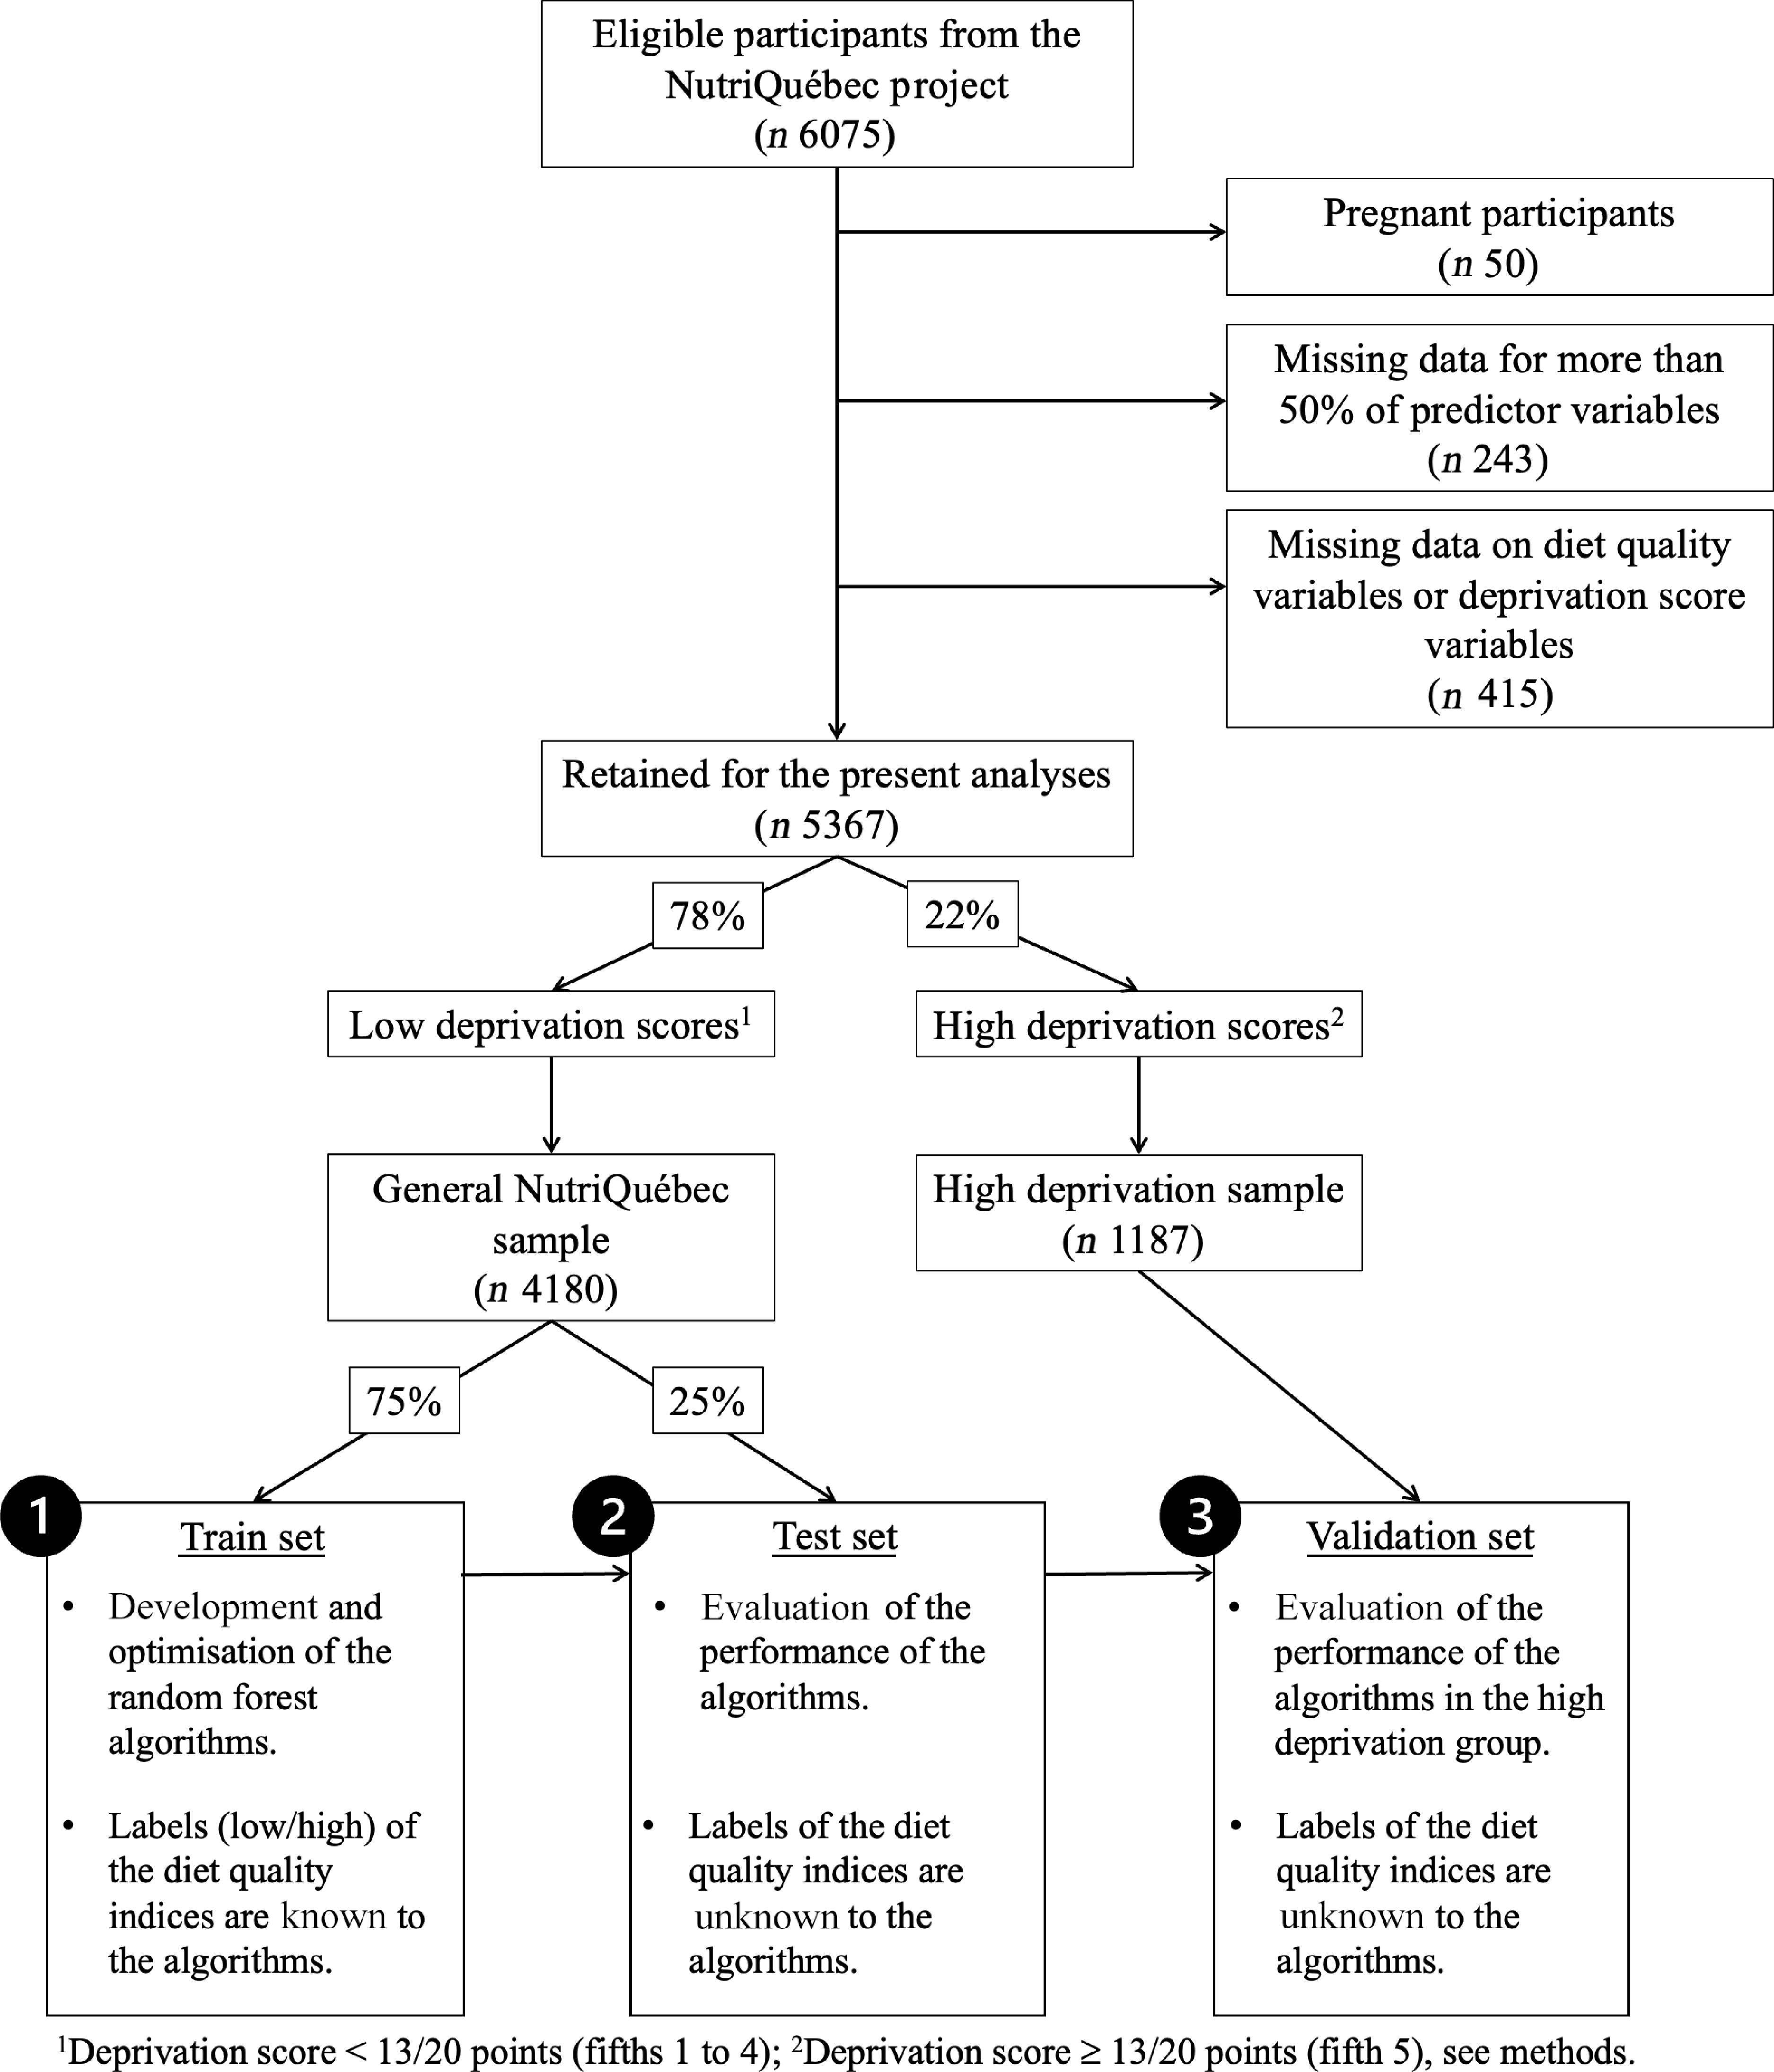
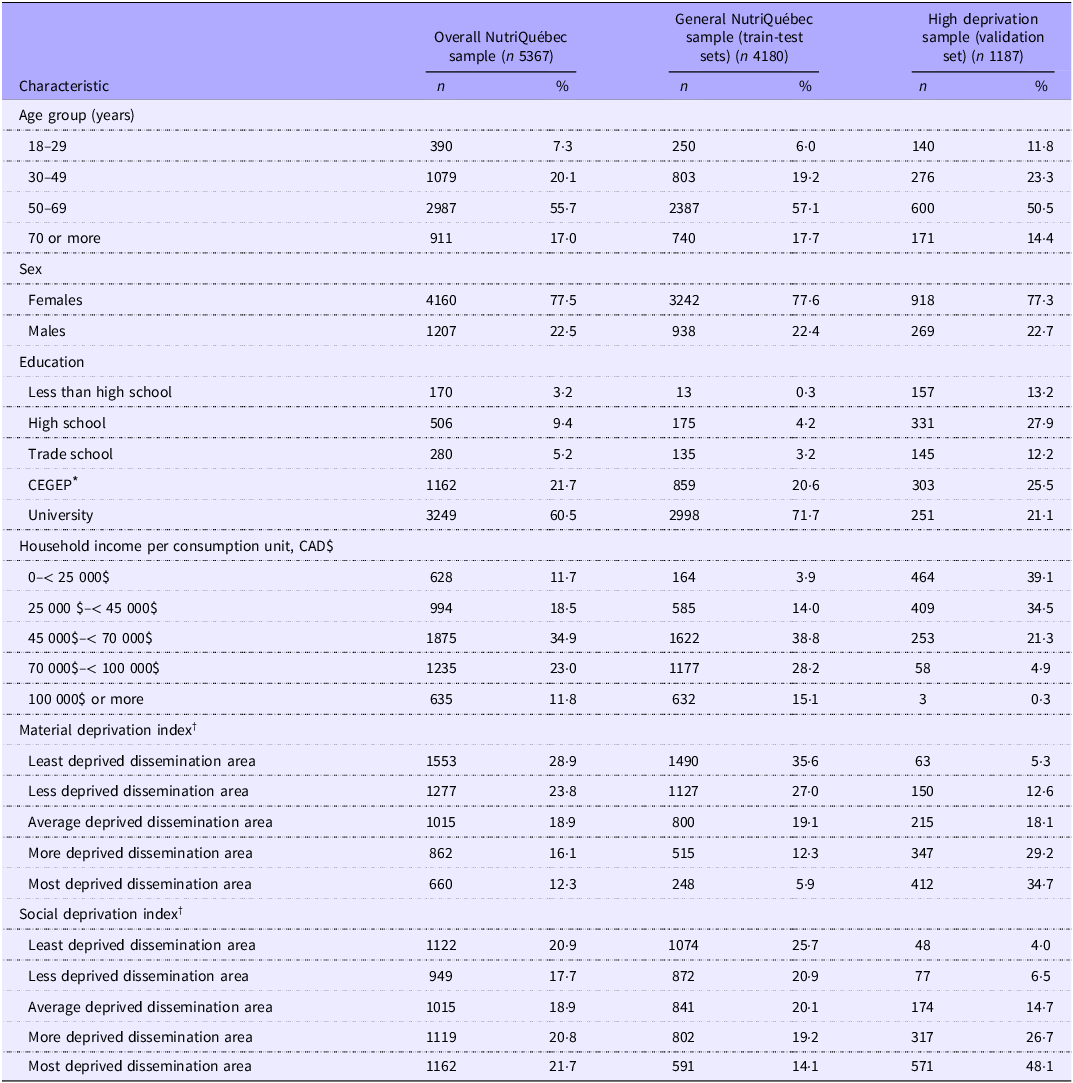
Figure 1 summarises the study flow chart as well data modelling steps. Among the 6075 active participants in the NutriQuébec study, 5367 met inclusion criteria. Table 1 presents the characteristics of the full sample, the train-test set and validation set. Female participants, individuals with higher education and individuals with higher incomes were overrepresented in all sample sets, but as per the grouping assignment, the high deprivation sample included proportionately more individuals with lower education attainment, with lower income and experiencing more social and material deprivation.
Study flow chart and schematic representation of the data modelling steps. In step 1, the random forest (RF) algorithms are trained to predict the three diet quality indices using data from 75 % of participants with low deprivation scores in the general NutriQuébec sample. In step 2, the performance of the RF algorithms is evaluated using data from the remaining 25 % of participants with low deprivation scores in the general NutriQuébec sample. In step 3, the RF algorithms are validated in the sample of participants with high deprivation scores (validation set).

Sociodemographic characteristics of the participants in the overall NutriQuébec sample, the general NutriQuébec sample (train-test sets) and the high deprivation sample (validation set)

* CEGEP is a preuniversity and technical college institution specific to the Québec educational system.
† Institut national de santé publique du Québec (2016) Index of material and social deprivation compiled by the Bureau d’information et d’études en santé des population (BIESP) from 1991, 1996, 2001, 2006, 2011 and 2016 Canadian Census data.
Diet quality indices at the individual level were measured using the average of data from two or three R24W recalls (50·1 % and 27·7 % of participants, respectively) or from one recall in 22·1 % of participants. Mean (sd) VFC, OFC and overall diet quality scores in the NutriQuébec overall sample, that is, prior to splitting the sample into various sets, were 4·8 (sd 2·7) RA/d, 5·8 (sd 4·0) RA/d and 48·0 (sd 10·8) points, respectively. The percentage of participants labelled as high was 44·3 % for VFC, 50·4 % for OFC and 50·1 % for overall diet quality in the NutriQuébec overall sample. As expected due to random sampling, there were approximately an equal number of low/high labels in the general NutriQuébec sample (train and test sets, not shown). In the high deprivation sample (validation set), the percentage of participants labelled as high was 31·7 % for VFC, 53·9 % for OFC and 36·2 % for overall diet quality.
Total deprivation score
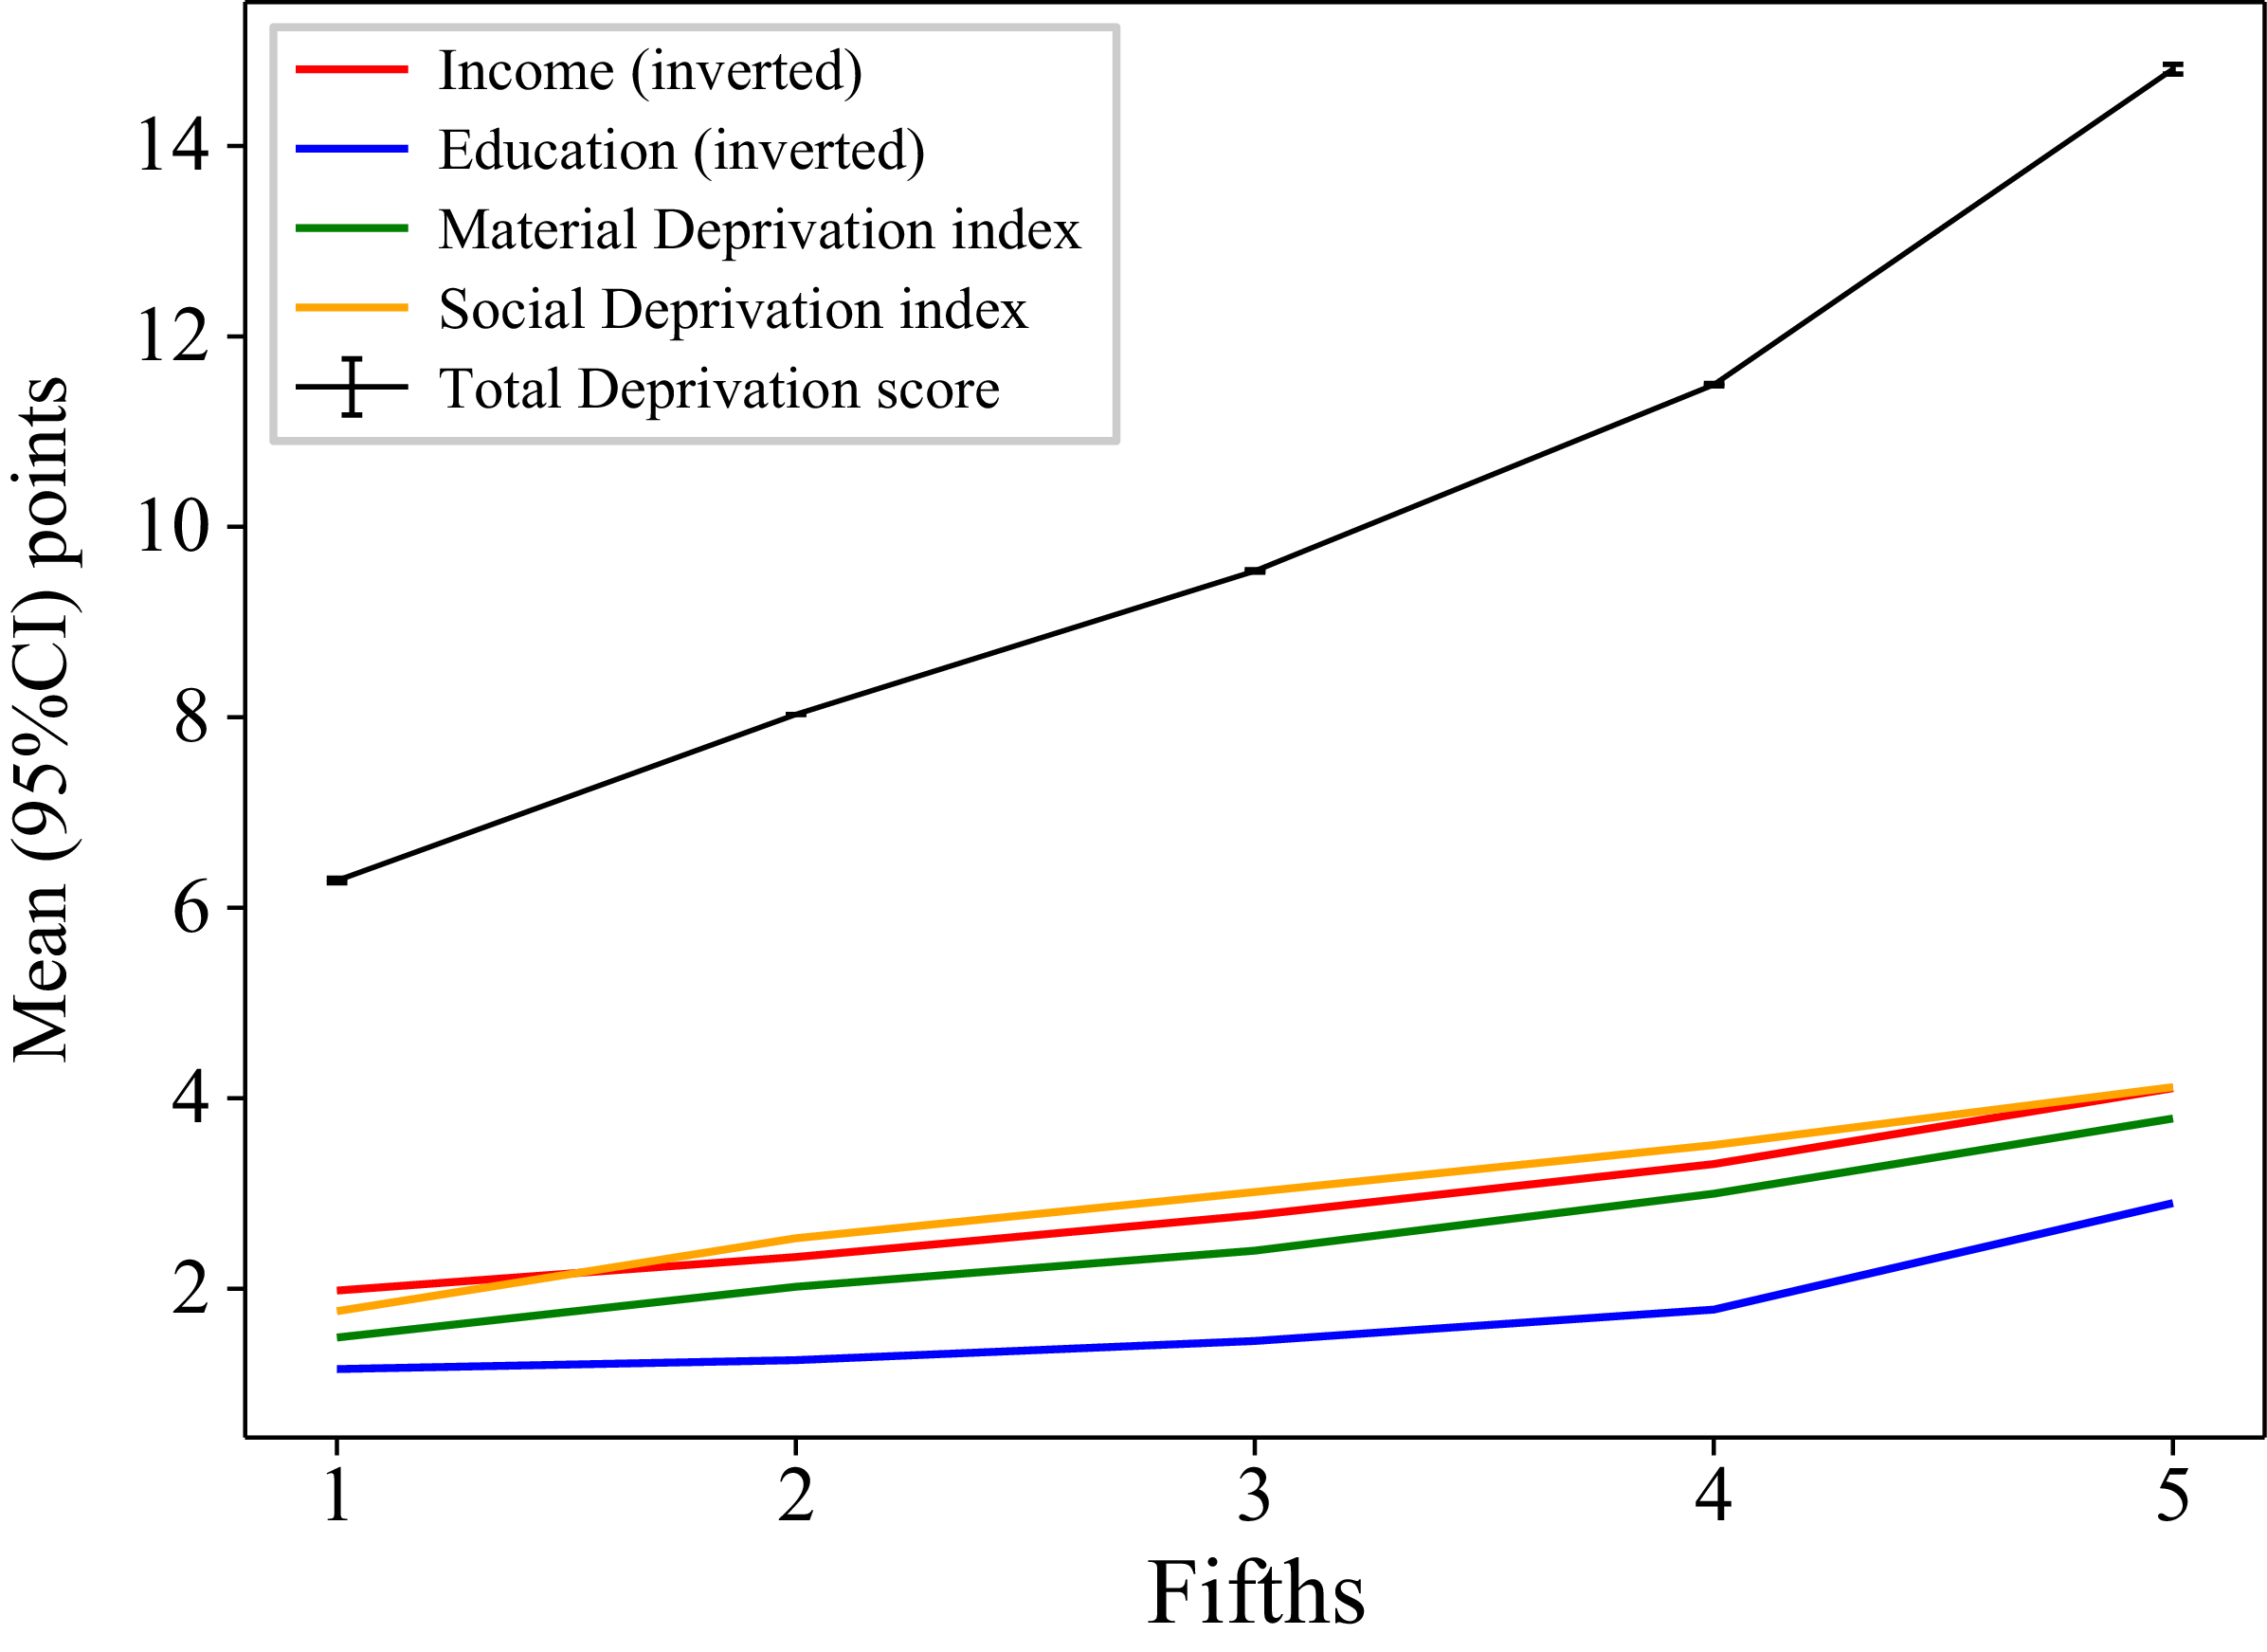
Figure 2 presents the mean total deprivation score and mean subscores per fifth of total deprivation score. The scores of the 4 subscores increased from the lowest to the highest fifth of the total deprivation score. The mean total deprivation score was 9·1 (95 % CI 8·8, 9·3) points in the general NutriQuébec sample (train-test sets, which included fifths 1 to 4 of the total deprivation score) and 14·8 (95 % CI 14·5, 15·0) points in the high deprivation sample (validation set, which included the highest fifth of the total deprivation score).
Mean (95 % CI) points of the total deprivation score (/20) and subscores per fifth of the total deprivation score (see methods for details).

Predicting diet quality indices
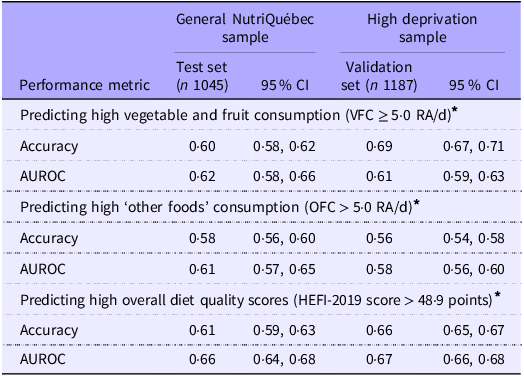
Table 2 presents the prediction performance of the RF algorithms for VFC, OFC and overall diet quality scores in the general NutriQuébec sample (test set) and in the high deprivation sample (validation set). The RF algorithms predicted high VFC, high OFC and high overall diet quality scores in the NutriQuébec sample (test set) with accuracies of 0·60 (95 % CI 0·58, 0·62), 0·58 (95 % CI 0·56, 0·60) and 0·61 (95 % CI 0·59, 0·63), respectively. Comparable or higher accuracy and AUROC values were obtained when applying the RF algorithms to predict VFC, OFC and overall diet quality scores in the group with a high deprivation score. In general, similar results were obtained when the ML algorithms were tested using the resampled weighted data (online Supplementary Figure 1).
Prediction performance of ML algorithms to predict high vegetable and fruit consumption, ‘other foods’ consumption and overall diet quality in the test and validation sets

ML, machine learning; VFC, vegetable and fruit consumption; AUROC, area under the receiver operation curve.
* See methods for detail.
Exploratory analyses of most discriminant variables
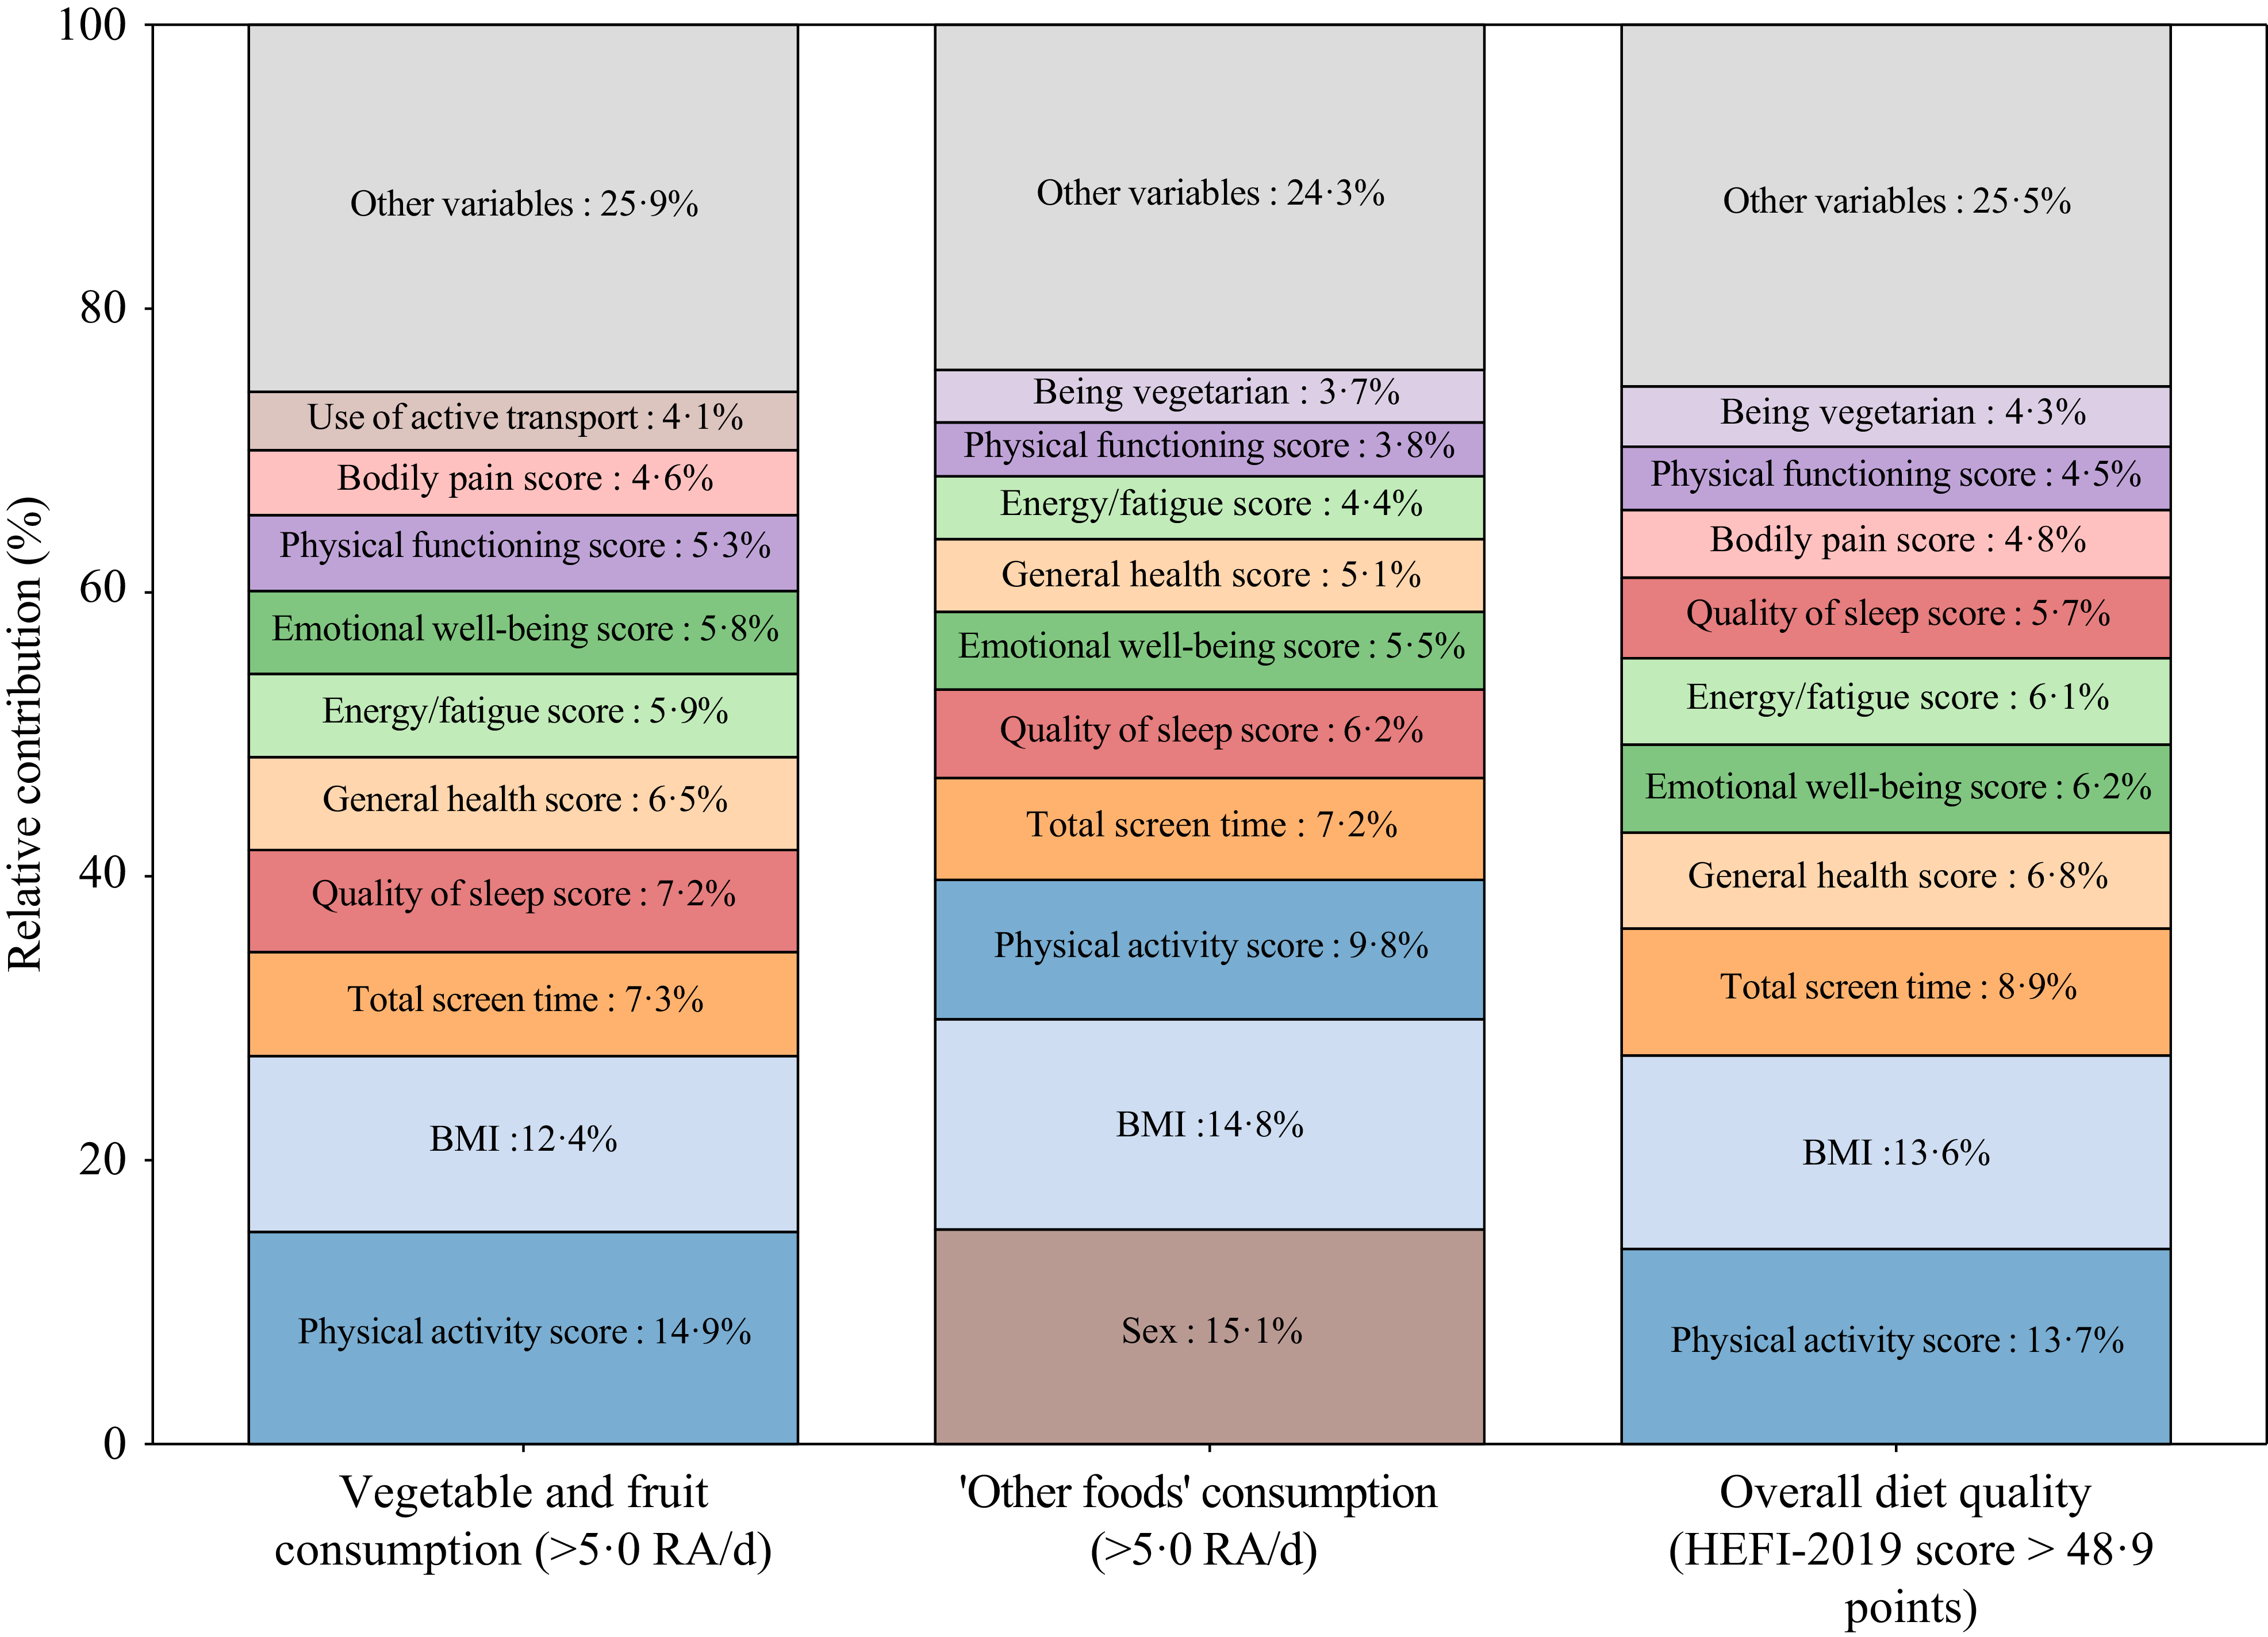
The percentages of predictor variables retained by the RF algorithms to predict VFC, OFC and overall diet quality scores in the test set were 25 % (n 31), 48 % (n 58) and 26 % (n 32) of all variables considered (n 122), respectively. The ten most discriminant variables retained by the RF algorithms for each diet quality index are presented in Figure 3 along with their corresponding relative contribution to the model. Interestingly, eight of the ten most discriminant variables were the same for all three diet quality indices. Physical activity score (Godin-Shephard Leisure-Time Physical Activity Questionnaire; assesses self-reported leisure-time physical activity(Reference Godin30)), BMI, total screen time, quality of sleep score (Pittbsburgh Sleep Quality Index; assesses self-reported sleep quality and disturbances over 1 month(Reference Buysse, Reynolds and Monk28)) and general health score (SF36 health survey questionnaire; assesses health status through a shortened version of a battery of 149 health status questions(Reference Garratt, Ruta and Abdalla29)) were consistently among the most discriminant variables in all three models. Very similar results were obtained when the RF algorithms were trained and tested using resampled weighted data (online Supplementary Figure 2).
Ten most discriminant predictor variables among all the variables retained by the random forest (RF) algorithms to predict the three diet quality indices and their corresponding relative contribution to the model. Relative contribution to the model corresponds to the relative contribution of each predictor to reducing model impurity across 100 bootstrap RF models. Higher percentages indicate greater relative reduction in model impurity and thus had greater influence on the model predictions. All variables contributed independently in each algorithm. Each of the variables retained in the RF algorithm was generated by different questions in the different questionnaires. HEFI-2019, Healthy Eating Food Index-2019; RA, reference amounts, see methods for details.

Discussion
The use of ML algorithms may help mitigate the challenge associated with underrepresentation of socio-economically disadvantaged groups in prospective cohort studies by identifying predictors of diet quality indices applicable to such groups. This study aimed to verify the accuracy of ML algorithms developed based on data from a general population to predict three diet quality indices among a socio-economically disadvantaged group. Consistent with our hypothesis, RF algorithms developed to predict diet quality indices in a general population performed at least as well in predicting ‘high’ v. ‘low’ VFC, OFC and overall diet quality scores in a group experiencing high deprivation.
To date, only a few studies have verified applicability and performance of ML-based population-level predictive algorithms in specific groups of the general population(Reference Birdi, Rabet and Durant16). To our knowledge, no study has assessed the performance of ML algorithms predicting diet quality across sample subgroups, limiting the ability to make direct comparisons with other studies. Nonetheless, our findings align with a few studies demonstrating that ML algorithms may identify predictor variables that are applicable across different subgroups(Reference Rodriguez, Padilla, Bruce, Bichel-Findlay, Otero, Scott and Huesing10–Reference Ravaut, Harish and Sadeghi12). For instance, Ravaut et al. developed and validated a gradient boosting decision tree algorithm (XGBoost) to predict onset of type 2 diabetes at the population level(Reference Ravaut, Harish and Sadeghi12). The algorithm had high discriminant and calibration metrics in groups of the population divided according to age, sex, race/ethnicity and material deprivation. Although our findings suggest that predictive algorithms may be used for targeting nutrition interventions across several groups of the population, including in populations often underrepresented in research, more studies are needed to confirm this hypothesis.
A key point to emphasise is that the RF algorithms in the present study predicted VFC, OFC and overall diet quality scores with relatively low accuracy and AUROC values in the general NutriQuébec sample as well as in the high deprivation group. Performance may have been hindered by potential misclassification of participants. Indeed, the capacity of the ML algorithms to correctly classify participants depends first and foremost on the correct labelling of such participants. Since diet quality indices are based on self-reported dietary intakes, they are subject to random and systematic errors, which can lead to misclassification and, consequently, reduced prediction performance. It is also possible that the set of predictor variables included in the analyses was not associated strongly enough with the predicted outcomes to achieve higher performance metrics. Several important determinants of food choices such as motivation for healthy eating, dietary influence of others, food outlet density or food knowledge(Reference Marshall, Jimenez-Pazmino and Metoyer42,Reference Stok, Hoffmann and Volkert43) were not measured in the NutriQuébec project and hence not considered in the development of the RF algorithms. The extent to which inclusion of such determinants would have improved the performance metrics of the RF algorithms remains uncertain. Nonetheless, values are comparable to results from other studies predicting diet quality indices using ML algorithms(Reference Côté, Osseni and Brassard44,Reference Côté, Brassard and Robitaille45) . We previously observed that nine different ML algorithms predicted adequate VFC with accuracies ranging from 55 to 65 %(Reference Côté, Osseni and Brassard44) and two different ML algorithms predicted overall diet quality scores with accuracies of 64 % and 65 %(Reference Côté, Brassard and Robitaille45). Very few studies have evaluated the prediction performance of ML algorithms for the prediction of diet quality surrogates or indices. Additional studies with larger and more diverse samples are therefore needed to assess the performance of ML algorithms for the prediction of diet quality.
In exploratory analyses and to address interpretability and explainability, the variables contributing the most to the RF algorithms were examined. Variables related to BMI, physical activity, sleep quality and health status were important predictors of all three diet quality indices. These findings are relevant as ML-based algorithms may eventually help identify potential targets for future interventions addressing key diet quality indices in specific groups of the population. Accordingly, future research should focus not only on the performance metrics of ML models but also on the relevance and validity of the features used to predict diet quality indices. Although the predictors identified in this study were applicable to a socio-economically disadvantaged group, replication and further validation are essential. Although it was not the case here, predictive variables may differ according to socio-economic status, and acknowledging this variability is critical to minimising representation bias in algorithms applied across different populations.
The present study has strengths and limitations. Having tested three diet quality indices representing a favourable, an unfavourable and a more complex dietary behaviour is a strength. The use of a deprivation score that reflects several aspects of a deprived socio-economic status is also a strength. However, representation of socio-economically disadvantaged groups may have been limited due to eligibility criteria, including in terms of literacy, digital access and language. The sample was also not representative of the Québec population. The weighted resampling somewhat mitigated this bias. The study being cross-sectional, the predictors of the diet quality indices retained in the ML algorithms cannot be considered as being causal. Having access to an additional external validation set would have been valuable, as external validation is crucial to ensure both the applicability across different populations and the robustness of results(Reference Cabitza, Campagner and Soares46). The sample size was relatively small, which can affect prediction performance(Reference van der Ploeg, Austin and Steyerberg47). The data were collected amidst the COVID-19 pandemic, although we have shown that eating habits did not appear to change significantly during this period in the NutriQuébec cohort(Reference Lamarche, Brassard and Lapointe48). The dietary intake data measured using the R24W is prone to random error, which was not accounted for as there is currently no RF algorithm to do that. Finally, we have tested only one ML algorithm with three different indices of diet quality. The extent to which other ML algorithms such as decision tree, support vector machines and ensemble learning applied to a variety of other diet quality indices needs to be examined in future research.
In conclusion, findings from the present study suggest that ML algorithms trained using data from a general population are applicable in a group of the population with a lower socio-economic status for the prediction of specific diet quality indices. This implies that ML algorithms may be promising tools to identify predictors of healthy eating that are robust across different characteristics of a population, including underrepresented groups such as populations with a high degree of deprivation, and to support the development of successful population-based dietary interventions. However, the prediction performance of the algorithms remained relatively low. Thus, caution is advised when developing and using ML algorithms to predict various diet quality indices. Additional studies are needed to further evaluate the applicability of such algorithms to a broad range of populations with different characteristics, including those often underrepresented in research.
Supplementary material
For supplementary material/s referred to in this article, please visit https://doi.org/10.1017/S0007114526106783
Acknowledgements
The authors are grateful to all participants for their contribution to this study.
This work was supported by the Québec government (2018–2025). The Québec government had no role in the design, analysis or writing of this article.
B. L., C. L., A. L., S. L., S. D., A. B-G. and S. I. K. designed the study; M. C. analysed the data and performed analyses; M. C. and M. R. wrote the paper; B.L. had primary responsibility for final content. All authors read and approved the final manuscript.
The authors declare no conflicts of interest.
Data described in the manuscript, code book and analytic code will be made available upon request pending application and approval.
This study was conducted according to the guidelines laid down in the Declaration of Helsinki, and all procedures involving human subjects were approved by the Research Ethics Committee of Université Laval (ethics number: NutriQuébec project, 2018–042 Phase II et IV A-16 / 25-04-2023; NutriQuébec – CARTaGENE project, 2022-211) and is registered at ClinicalTrials.gov (NCT04140071, https://clinicaltrials.gov/study/NCT04140071). Written informed consent was obtained from all participants.


 Open access