INTRODUCTION
Taiwan's 2016 election produced the first legislative majority for the perennial opposition Democratic Progressive Party (DPP) while their presidential candidate, Tsai Ing-wen, became Taiwan's first female president. Although female presidents and prime ministers are not rare in Asia, Tsai is an outlier in that previous examples had familial ties to a government official or member of the democratization movement. However, it remains unclear to what extent Tsai's popularity generated greater support for DPP candidates or whether discontent with the incumbent Kuomintang (KMT) simply benefited both races. In other words, to what extent did Tsai's candidacy encourage coattail voting? In addition, if Tsai's popularity at the time generated greater support for the DPP than otherwise would be expected from partisan ideology, to what extent would such coattails also be present for Tsai's main opponent, Eric Chu of the KMT, or that of James Soong of the People First Party (PFP)?
A coattail effect is the influence of a party's candidate in one election on the performance of co-partisans in other races (e.g. Miller Reference Miller1955). This phenomenon has a well-established literature in the American context, especially in terms of a presidential–legislative interaction (e.g. Born Reference Born1984; Mondak Reference Mondak1990; Mondak Reference Mondak1993; Campbell Reference Campbell1986; Hogan Reference Hogan2005), with far less attention to such effects in non-Western democracies. Taiwan's 2016 election, the second in which presidential and legislative elections were held concurrently, provides a unique opportunity to address the extent to which presidential candidate support influences legislative offices. Taiwanese presidential candidates frequently campaign for their co-partisan legislative candidates and 2016 continued the tradition of presidential candidates serving as the formal leader of their respective parties (see Roy Reference Roy2003, 183–231; Peng, Peng, and Chen Reference Peng, Peng and Chen2011, 118), factors that should increase the likelihood of coattail voting.
The Taiwan case also allows for an analysis of presidential coattails in an institutionally more complex electoral environment. Like fellow East Asian democracies Japan and South Korea, Taiwan uses a mixed member system for elections to their unicameral Legislative Yuan, allocating seats in single member districts (SMDs) as well as seats filled by proportional representation (PR). Unlike many other mixed systems that coexist with a presidential system (e.g. Mexico, South Korea), Taiwan's elections since 2012 run concurrently, simplifying the identification of coattails, although voters cast separate physical ballots for each race (president, legislative district, legislative party list). While the coattail literature primarily focuses on how presidential candidates influence support for lower level district candidates, and some research on mixed systems addresses coattails in passing (e.g. Riera Reference Riera2013; Rich Reference Rich2015), it says little regarding support for the party more broadly with the literature primarily seeing the party vote under a PR system as outside the definition of coattail voting. A popular presidential candidate logically should attract voters to the party list as well as to co-partisans running in districts and in the process encouraging straight party voting despite the use of separate physical ballots. However, such effects have yet to be measured in mixed systems.
This article makes two contributions to the coattail voting literature. First, this analysis uses two means to measure coattail voting. Building on similar work in the US (e.g. Born Reference Born1984; Ferejohn and Fiorina Reference Ferejohn, Fiorina, Chubb and Peterson1985; Mondak Reference Mondak1989; Mondak Reference Mondak1993), I compare presidential and legislative vote shares at the district level in Taiwan. Then, following existing survey work (e.g. Mondak Reference Mondak1990; Mondak and McCurley Reference Mondak and McCurley1994; Jacobson Reference Jacobson2009), I use post-election survey data from Taiwan to assess coattails in districts and the party list, connect this literature to the broader split-ticket voting literature within mixed systems (e.g. Kohno Reference Kohno1997; Karp et al. Reference Karp, Vowels, Banducci and Donovan2002; Gschwend Reference Gschwend2007; Moser and Scheiner Reference Moser and Scheiner2009). Secondly, a sizeable literature, although often controlling for partisan identification, does not address previous voting behavior for both offices (e.g. Campbell and Sumners Reference Campbell and Sumners1990; Flemming Reference Flemming1995; Hogan Reference Hogan2005; Godbout Reference Godbout2013; Huang and Wang Reference Huang and Wang2014). This analysis contributes to the debates on how to measure coattail voting by controlling for previous voting behavior at both the presidential and legislative vote level to isolate coattail effects. If coattail effects are present, we should expect popular presidential candidates to increase the likelihood of voting for the party's district candidate, the party list, and straight-ticketing voting for the Legislative Yuan more broadly.
This article first presents the existing literature on coattail voting and mixed member systems, connecting this to the Taiwan case. A brief summary of the Taiwanese electoral system and the 2016 election follows. District level analysis finds a clear coattail for all three presidential candidates, with stronger effects regarding Tsai and the DPP. Individual level survey data reaffirms this pattern, with a clear association between voting for Tsai and voting for the DPP in district and party list competition, with a less pronounced effect regarding Eric Chu and KMT support or James Soong and PFP support. Lastly, the article suggests additional means to tackle coattail voting.
LITERATURE REVIEW
Coattail voting at its most basic expects that the popularity of a candidate at one level influences the vote choices made for lower level offices. Heuristics are commonly employed to simplify decision-making (e.g. Tversky and Kahneman Reference Tversky and Kahneman1974), and coattail voting is often seen in this light (e.g. Mondak Reference Mondak1990; Golder Reference Golder2006). Coattail voting as a form of heuristic should arise particularly if voters have little information about the lower level candidates, for example in open seat elections (Mondak Reference Mondak1993; Flemming Reference Flemming1995), or if they dislike acknowledging conflicted beliefs (Mondak and McCurley Reference Mondak and McCurley1994).
The effects of higher office coattails would be expected to be more prominent in concurrent elections (e.g. Key Reference Key1964; Campbell and Sumners Reference Campbell and Sumners1990; Hogan Reference Hogan2005; Meredith Reference Meredith2013), especially if higher offices assist in lower office campaigns. Although often conceived as an interaction between two election races, coattails of upper level offices should also increase the likelihood of casting a straight party ticket as well (e.g. Calvert and Ferejohn Reference Calvert and Ferejohn1983; Broockman Reference Broockman2009). In the American context, the presumed effect of presidential races on congressional races helps explain why a president's party traditionally loses seats in off-year elections (see Piereson Reference Piereson1975; Erikson Reference Erikson1988; Campbell Reference Campbell1991), although others caution that the electorate fundamentally differs in presidential midterm years (e.g. Campbell Reference Campbell1960; Mattei and Glasgow Reference Mattei and Glasgow2005). Similarly, the presumed effect of presidential races on gubernatorial races in part explains why many states have moved state races to off-years (e.g. Tompkins Reference Tompkins1988). However, despite its intuitiveness, several studies find little such effect or that any effect played only a marginal role in election outcomes (e.g. Ferejohn and Calvert Reference Ferejohn and Calvert1984; Campbell Reference Campbell1991; Thorson and Stambough Reference Thorson and Stambough1995).
The literature on coattail effects outside of the United States remains comparatively underdeveloped (e.g. Samuels Reference Samuels2000, Reference Samuels2003; Golder Reference Golder2006; Gelineau and Remmer Reference Gelineau and Remmer2006; Ade and Freier Reference Ade and Freier2011; Magar Reference Magar2012), although a growing literature focuses on Taiwan. For example, Tan and Yu (Reference Tan and Yu2000) attribute the KMT's success in 1998 in part to a coattail effect based on the popularity of the party's Taipei mayoral candidate Ma Ying-jeou, with Huang and Wang (Reference Huang and Wang2014) empirically identifying a coattail in legislative district competition for the KMT in 2012 based on whether one voted for then incumbent president Ma. Cheng (Reference Cheng1997) suggests a minimal boost for the KMT in the 1996 National AssemblyFootnote 1 election due to President Lee Teng-hui's popularity. However, no analysis to date adequately captures how the concurrent presidential election influences the two-vote mixed system currently used in Taiwan's Legislative Yuan.
Whereas the coattail effect literature largely focuses on presidential–legislature interaction, in mixed systems the coattail effect, if present, must contend with a more complex institutional environment. Mixed systems allocate seats in candidate-centered single member districts (SMDs) and by proportional representation (PR) via party list at the national or regional level. Rare prior to 1990, these hybrids have proliferated globally in democracies young and old. Furthermore, most mixed systems provide for two separate ballots, one for the district and one for the party list, allowing for ticket-splitting. The contamination thesis literature on mixed systems assumes, rather than seeing these two seat types as separate elections, that an inherent interaction between the two exists (e.g. Herron and Nishikawa Reference Herron and Nishikawa2001; Ferrara, Herron, and Nishikawa Reference Ferrara, Herron and Nishikawa2005; Gschwend, Johnston, and Pattie Reference Gschwend, Johnston and Pattie2003). This interaction usually takes the form of the party list encouraging additional entrants into district competition, distorting competition away from the Duvergerian expectations of two-party competition (Duverger Reference Duverger1954). If an interaction occurs across the two votes for the legislature and presidential elections are held concurrently with legislative races, it stands to reason that the latter would influence the former. Furthermore, a growing literature finds that the number of presidential candidates frequently corresponds to the number of legislative parties (e.g. Shugart and Carey Reference Shugart and Carey1992; Golder Reference Golder2006; Hicken and Stoll Reference Hicken and Stoll2013).
More broadly, the extent to which co-called coattail effects are the result of the popularity of higher office candidates requires consideration of other factors. The most obvious is partisanship, which remains a powerful heuristic for voters (e.g. Mondak and McCurley Reference Mondak and McCurley1994). For example, in the case of presidential coattails, the magnitude of the interaction is expected greatest where legislative elections incentivize pursuing a party vote rather than a personal vote (e.g. Campbell and Sumners Reference Campbell and Sumners1990; Shugart Reference Shugart1995). Just as research finds that source cues are dependent on predispositions to the cue (e.g. Chaiken Reference Chaiken1979), whether due to ideological similarities or a more basic partisan attachment, the expectation remains that sharing the partisan identity of a higher office candidate would correspond with voting for both levels of office. Coattails thus may be a sign of mobilizing those with only weak partisan identification (e.g. Campbell Reference Campbell1960). In addition, if a party fails to run a candidate in lower level offices, this complicates assessing coattail effects.
Candidate-specific and voter-specific demographic factors also require additional attention (see Huang and Wang Reference Huang and Wang2014). For example, an expansive literature on gender and politics identifies differences in how the public views male versus female candidates (e.g. Plutzer and Zipp Reference Plutzer and Zipp1996; McDermott Reference McDermott1997; Giger at al. Reference Giger, Holli, Lefkofridi and Wass2014), in terms of the candidates’ policies and ideological views (e.g. Koch Reference Koch2000) as well as competency and viability as candidates. Furthermore, media coverage tends to favor male candidates (e.g. Kahn Reference Kahn1992). In terms of voters, previous analyses find that women are more likely to support female candidates (Dolan Reference Dolan1998; Huddy and Terkildsen Reference Huddy and Terkildsen1993; Brians Reference Brians2005). Historically, liberal-progressive parties were more likely to nominate female candidates than their conservative opponents, suggesting a partisan effect, although this distinction is likely diminishing, especially as gender quotas become more commonplace. Thus if female candidates are running in higher level offices, such as Tsai in 2012 and 2016, disentangling partisanship and gender influences from broader coattail effects would be prudent.
In line with the broader literature, the assumption remains that the popularity of Tsai Ing-wen would create a coattail effect both among those that identify with her party but also, and perhaps more importantly, among those that do not share the same partisan identification. I expect that this goes beyond simply support for DPP district candidates in the Legislative Yuan to influence party list voting and straight ticket voting more broadly. Likewise, I expect a similar interaction between voting for Eric Chu or James Soong and voting in the legislature for their respective parties. However, as the expected winner well before the election and in conjunction with anti-KMT sentiment, the expectation remains that Tsai's electoral coattails will be substantially larger than her opponents.
BASICS OF THE 2016 ELECTION
Taiwan passed electoral reforms in 2005 to discard the single non-transferable vote (SNTV) system for the Legislative Yuan, in favor of a mixed electoral system to be used starting with the 2008 election. The new system heavily weights towards single-member districts (73) compared to the national party list seats (34). An additional six seats are reserved for aborigines. This reform as expected promoted progression towards a two-party system and increased disproportionality (e.g. Stockton Reference Stockton2010).
In 2008 and 2012, the KMT maintained clear majorities in the legislature, aided with additional seats held by “pan-blue” coalition partners, namely the People First Party. The KMT also held the presidency, with Ma Ying-jeou's election in 2008 and re-election in 2012 (the first election held concurrently with legislative elections). Although Ma's public approval rates declined after his first term, broader disapproval of Ma and the KMT emerged in the middle of 2014 in part due to the party's passage of a controversial trade agreement with China without broader review as demanded by the opposition. The resulting Sunflower Movement, including the occupation of the Legislative Yuan, coincided with a sharp decline in KMT support. Local off-year elections in November of 2014 produced historic losses for the party at each level, with the KMT winning only one of the six special municipalities, attributable in large part to anti-Ma and anti KMT sentiment (e.g. Yeh Reference Yeh2014; Wang and Cheng Reference Wang and Cheng2015).
Building on the success of the 2014 elections, the DPP's Tsai Ing-wen ran unopposed for the party's presidential nomination in 2015. Meanwhile, despite earlier expectations that Xinbei Mayor and KMT chair Eric Chu would run in the party's primary, Chu stated his intent to fulfill his mayoral term instead. On July 19, the party nominated deputy speaker of the Legislative Yuan Hung Hsiu-Chu, considered by many within her party to be more pro-unification than the median KMT supporter. This marked the first time both major parties slated female candidates for president. With early public opinion polls showing Tsai with a clear lead and expectations that disillusionment among traditional KMT supporters would leave room for a third party, perennial candidate James Soong of the PFP announced his bid on August 6. Over the next two months, public opinion polls consistently showed Tsai leading a three-candidate race, leading to some comparisons with the 2000 election which resulted in the DPP's first presidential victory. In 2000, a split within the KMT resulted in James Soong running as an independent, leading to the victory of the DPP's Chen Shui-bian, the first transfer of power since the KMT arrived in Taiwan. Even worse, the KMT candidate and sitting vice-president Lien Chan finished third.Footnote 2 Facing internal dissent within the party and the possibility, although remote, of a third place finish, the KMT took the unprecedented move of holding a special party convention to remove Hung and replace her with Eric Chu.
Despite hopes that the replacing of Hung would reinvigorate the party, Chu continued to poll in second place. In addition, anti-KMT sentiment spread to legislative races beyond traditionally “green” pro-DPP areas in the south. Whereas malapportionment was seen as benefiting the KMT in 2008 and 2012, the party now faced close races nearly countrywide. The rising popularity of the Sunflower Movement-based New Power Party (NPP) further challenged the KMT.
On January 16, Tsai Ing-wen captured a clear majority of the presidential vote (56.1%), while the DPP captured an outright majority of seats in 2016 (60.2%), their first legislative majority. In district races, the DPP managed an average vote share increase from 2012 of 7.48%, while the KMT averaged an 8.09% loss. In addition, the newly formed NPP, in which the DPP coordinated in several districts, captured three district and two party list seats.Footnote 3 The success of both Tsai and her party suggests a turning point in Taiwanese politics; however, it remains unclear whether anti-KMT sentiment benefited both Tsai and her party more broadly or the popularity of Tsai in effect pulled the party up to a legislative majority.
Results of the 2016 Election

Note: (1) Invalid presidential election votes totalled 163,322 (1.3% of ballots).
(2) In addition, six aboriginal legislative seats were filled in two three-seat districts.
EMPIRICAL ANALYSIS
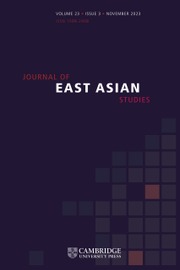
District-level election data suggests the extent of presidential coattail effects. Figure 1 presents the vote share in district races for a DPP candidate by Tsai's percentage of the vote, with the same done for the KMT and Eric Chu. Since the PFP only ran six district candidates, an analysis of Soong's coattails is omitted. In both cases, although outliers remain, a general positive correlation emerges between the presidential and district vote shares as expected.
District Vote Share for District and Presidential Candidates for the DPP and KMT
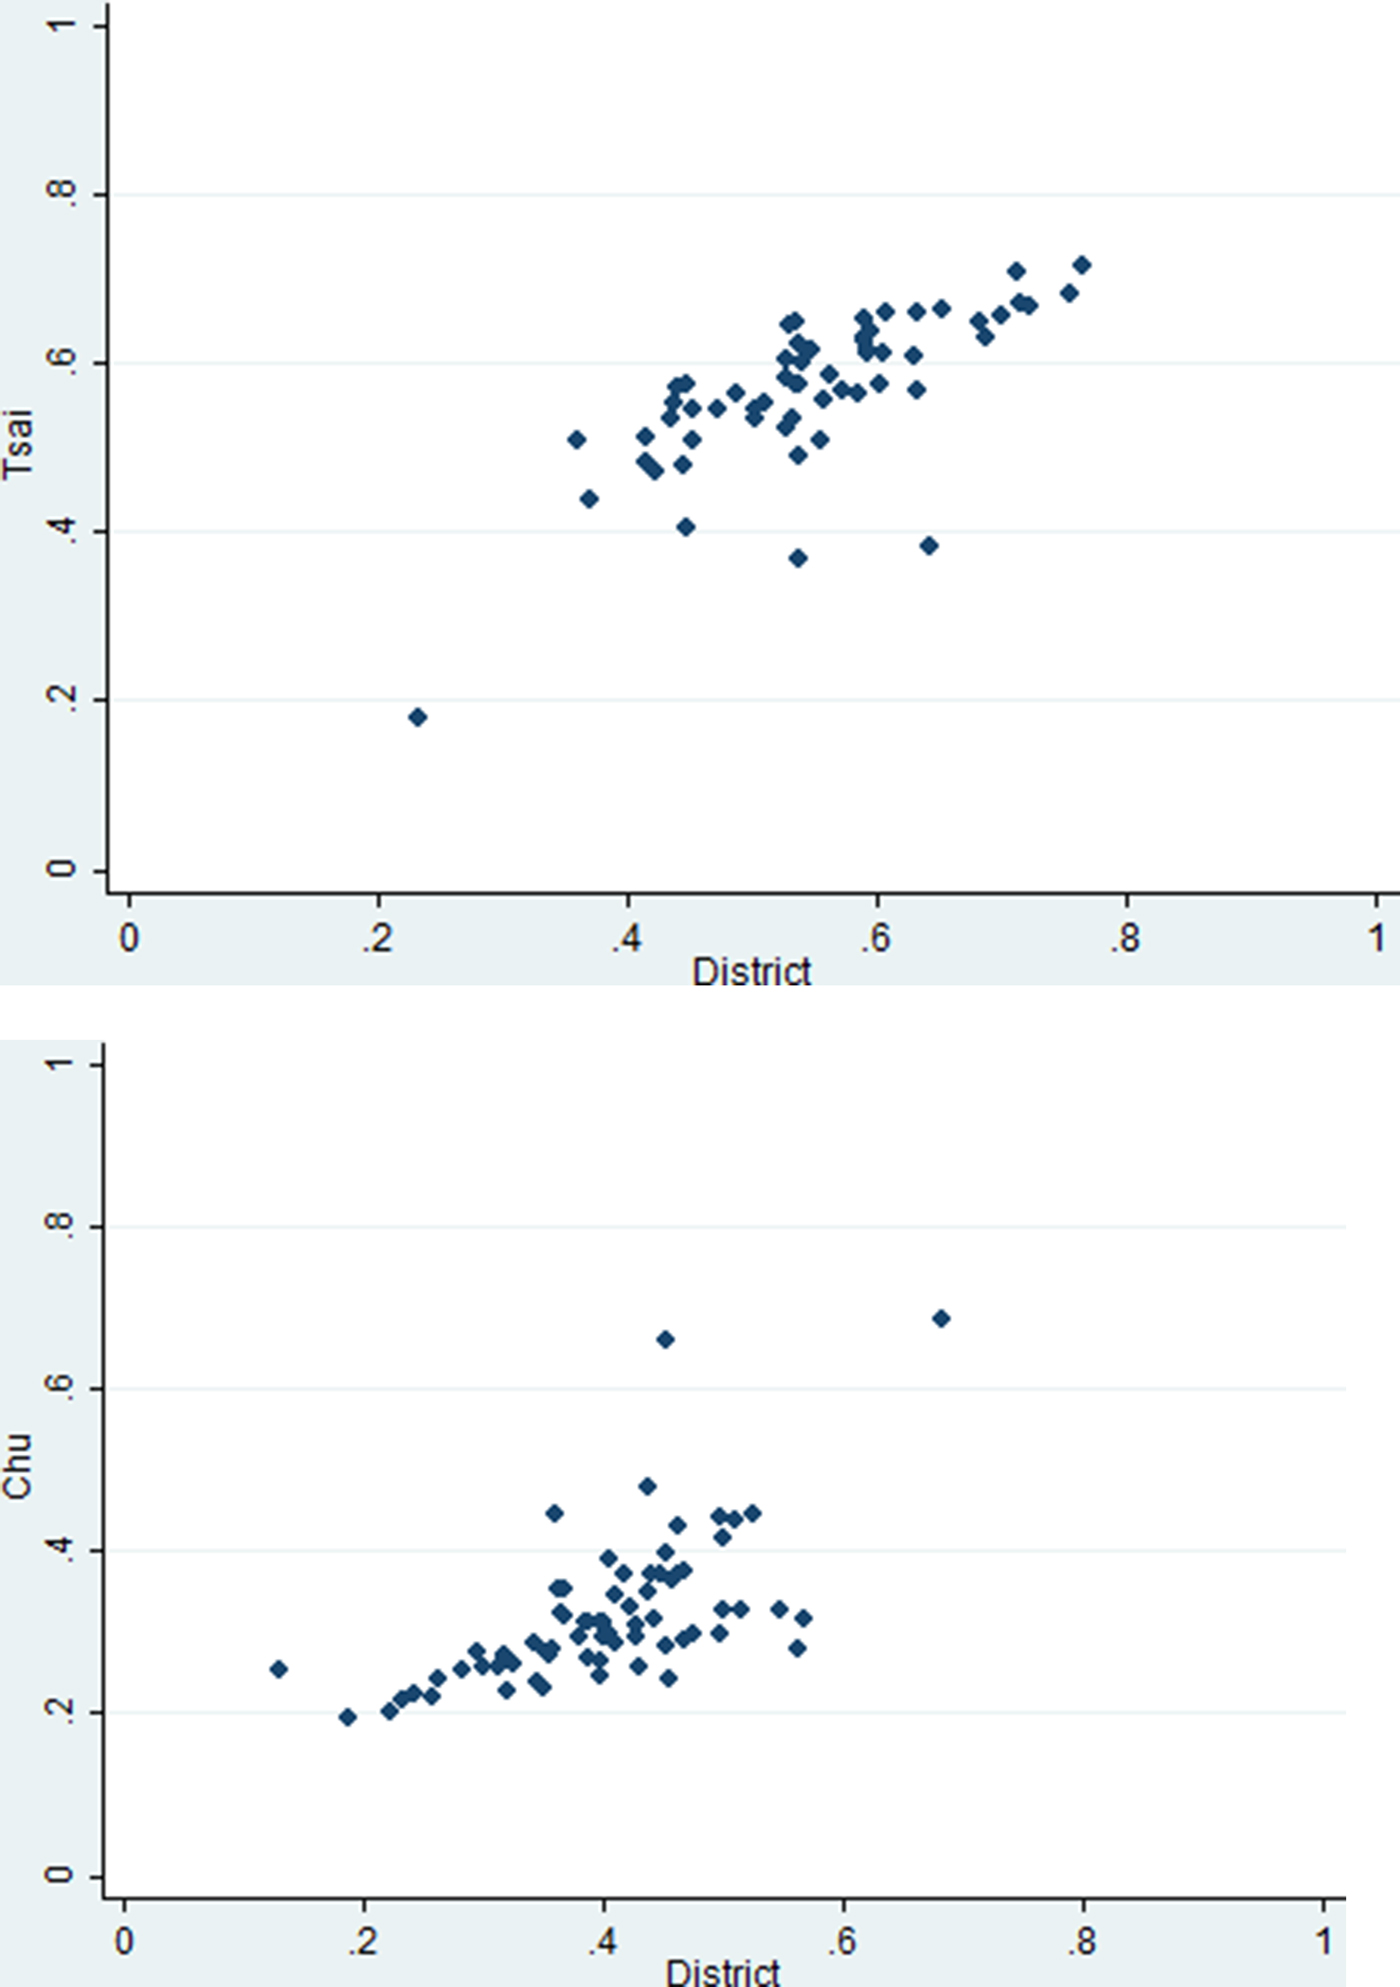
Table 2 presents a series of bivariate regressions of presidential vote share on the party's district vote and party list votes at the district level.Footnote 4 Districts without a party candidate are excluded and due to the limited number of PFP district candidates, an analysis of the PFP is limited to the party list vote. Across each model, as the vote share increases for the party's presidential candidate, so does support for the party in the legislature. Furthermore, the coefficients and the r-squared were noticeably larger in the DPP models, suggestive of the strength of Tsai's coattails. Of particular interest, of the most competitive races for the DPP—the three the DPP won by 5 percent or less and the four lost by 5 percent or less—all had lower DPP vote shares than those predicted by the model. Admittedly inferring individual level behavior from district-level data presents an ecological fallacy, but provides preliminary evidence that coattail effects are not limited to Tsai.Footnote 5
Coattail Effect on Legislative Vote Shares at the District Level

*p < .05, **p < .01, ***p < .001
A clearer evaluation of a coattail effect must show that, net the normal vote for the district, the presidential and legislative votes were positively correlated. As an additional attempt to parse out coattail voting in this regard, I subtract the 2012 party's presidential vote percent at the district level in 2012 from the 2016 district results for my independent variable. For example, if Tsai captured 55 percent of the vote in 2016 and 42 percent in 2012, this would be coded as 0.13. I repeat this process to generate dependent variables for legislative district votes (leaving out cases in which the party did not run candidates) and the party list. This is to isolate any coattail effect from partisan makeup of a district and not overestimate potential coattail effects. As 2012 saw Taiwan's first concurrent presidential and legislative election, this unfortunately limits the ability to estimate the normal district vote. Table 3 presents the results. Here we find coefficients all in the expected direction, but only two models reach statistical significance: the DPP party list variable and the KMT party list variable. In sum, aggregate data provides preliminary data of a coattail effect in one if not both legislative votes.
Coattail Effect on Legislative Vote Shares at the District Level

*p < .05, **p < .01, ***p < .001
For individual level analysis, I use post-election survey data from the 2016 Taiwan Election and Democratization Study (TEDS 2016-T), implemented by the Election Study Center at National Chengchi University (NCCU), as this provides voting behavior data as well as demographic variables.Footnote 6 This data was supplemented with additional information from Taiwan's Central Election Commission regarding whether individual parties ran district candidates.
Among valid responses, Tsai received noticeably more support among men (62.50% versus 55.85% of women). The vast majority of those identifying with the DPP, KMT, or PFP voted for their party's presidential candidate, with rates highest among DPP identifiers, consistent with competition among pan-blue voters (see Table 4). Similarly, legislative ticket splitting rates remained similar between DPP and KMT identifiers with over three-quarters of PFP identifiers splitting their vote, although these rates are partially conditioned by each party's strategic decision to run district candidates. Consistent with the conventional wisdom, majorities of partisans voted for their party's list, while in the presence of a district candidate majorities of DPP and KMT identifiers voted for their party's candidate but only half of PFP identifiers followed suit.Footnote 7 More importantly, voting for the party's presidential candidate appears to encourage straight-ticket voting among fellow partisans. Limiting the analysis to districts with a party district candidate, majorities of DPP, KMT and PFP identifiers split their legislative tickets if they did not vote for the party candidate,Footnote 8 while less than a third did so if they voted for the presidential candidate.Footnote 9
Summary Statistics From Post-Election Survey

To address coattail voting for Tsai directly, I employ logit models on three dependent variables. The first is a dummy variable for whether the respondent voted for the DPP district candidate, the second a dummy for whether the respondent voted for the DPP party list, and the last whether the respondent casted a DPP straight ticket for the Legislative Yuan election. The DPP only ran candidates in 60 of the 73 single member districts. Since in the other 13 districts one could not vote for a DPP candidate, the district models exclude these districts. The main independent variable is a dummy variable for whether one voted for Tsai Ing-wen, with controls for age (a continuous measure), education (a seven-point scale), gender (female), and dummy variables for those identifying with the DPP and with the pan-green coalitionFootnote 10 more broadly. I then repeat the same models adjusted for the KMT voting and Eric Chu and PFP voting and James Soong.Footnote 11
Across all three models, voting for Tsai strongly corresponds with voting for the DPP in the Legislative Yuan, with larger coefficients than shared partisan and coalitional identification (Table 5). Unsurprisingly DPP identity positively associated with all the voting measures, while the pan-green variable was only significant in the district. Controls for age positively associate with voting for the DPP's party list and straight ticketing for the Legislative Yuan. Table 6 presents the same models regarding KMT legislative voting. Voting for the KMT's presidential candidate exhibits the largest coefficient across models. In addition, education negatively corresponds with voting for the KMT party list or a straight legislative ticket. Identifying with the KMT corresponded with voting for the party list and straight-ticket voting, but not in the district vote. Table 7 repeats the models for PFP legislative voting. Again, voting for James Soong positively associates with voting for the PFP, although the level of significance is lower in the district and straight ticket models than the other party models. Furthermore, partisan and coalition identification only reached significance in the party list model. More broadly, models for each party correctly classified more than 80 percent of cases.
Logistic Regressions on Voting for the DPP in the Legislative Yuan

*p < .05, **p < .01, ***p < .001
Logistic Regressions on Voting for the KMT in the Legislative Yuan

*p < .05, **p < .01, ***p < .001
Logistic Regressions on Voting for the PFP in the Legislative Yuan

*p < .05, **p < .01, ***p < .001
As logit models are not linear, interpreting coefficients are less straightforward than OLS models. Predicted probabilities further illustrate a coattail effect at each level. Table 8 presents the predicted probabilities of legislative voting based on whether or not one supported the presidential candidate, holding age and education at their mean and gender at 0 (maleFootnote 12 ). As expected, voting for Tsai Ing-wen led to a higher probability of voting in the legislature for the DPP district candidate, the DPP party list, and casting a straight-ticket legislative vote. A coattail effect is also clearly present on each measure of legislative voting in regards to support for the KMT and for the PFP respectively. However, the raw change in predicted probabilities across the board is largest in regards to Tsai. For example, voting for Tsai increased the predicted probability for voting for the party's district candidate by 0.52–0.60, compared to 0.49–0.53 for Eric Chu and 0.16–0.37 for James Soong.
Predicted Probabilities of Voting for the DPP, KMT and PFP in the Legislative Yuan Elections

Furthermore, predicted probabilities show clear differences in the strength of coattails in terms of the fold increase when voting for the party candidate. In district competition, voting for Tsai produces a 2.19-fold increase in the predicted probability of voting for the DPP candidate among DPP identifiers, with larger changes among those identifying with other parties. Relatively similar increases are seen for the PFP among those who voted for Soong, while a vote for Chu produced the smallest fold increase among fellow partisan and coalition identifiers (1.71- and 1.61-fold respectively). The effects on the party list vote and on casting a straight legislative ticket are more pronounced. In both cases, voting for Tsai had a larger-fold effect on the probability for voting for the DPP in the Legislative Yuan than comparable measures for Chu and Soong. Perhaps most surprising, among those that did not identify with the respective coalition, voting for Tsai corresponded with a 32-fold increase in the probability of casting a straight-party legislative vote, compared to only a 9.5-fold increase regarding Eric Chu and 6.5 for James Soong.
Additional models were tested for robustness (omitted for brevity). Concerned that the control variables influence short-term decision in partisanship, simple bivariate models were tested and produced consistent findings the presented models. Two factors consistently underpin Taiwanese party politics: political identity (Taiwanese, Chinese or both) and Taiwan's future status (unification, independence, or the status quo).Footnote 13 Additional models tested for both factors, leaving Taiwanese and the status quo as the baselines, but did not change the core findings. With consideration to the economic voting literature (e.g. Fiorina Reference Fiorina1981; Pacek and Radcliff Reference Pacek and Radcliff1995; Lewis-Beck and Stegmaier Reference Lewis-Beck and Stegmaier2000), models including retrospective and prospective economic evaluations failed to alter the basic findings of the original model, with prospective evaluations positive and significant only in the DPP district and straight ticket models. Assuming that incumbency influences coattails (e.g. Mondak Reference Mondak1993; Mattei and Glasgow Reference Mattei and Glasgow2005), the presence of the co-partisan district candidate was tested, which positively corresponded with voting for the DPP district candidate and straight ticketing and with voting for the KMT district candidate, all significant at p = .001. Additionally, including a dummy variable for open seat districts failed to reach significance in any model. Moreover, neither addition fundamentally altered the substantive or statistical significance of the presidential coattail.
Since understanding the electoral rules of the two-vote system could affect party list and straight ticket voting and thus coattails as well, a control for knowledge of the electoral threshold for the party list seats was tested as well. This was measured with a dummy variable for those that correctly identified the threshold as five percent. Less than half (43.50 percent) correctly identified the threshold. The addition negatively corresponded with KMT party list and straight ticket voting at p = .001 and positively associated with DPP district voting at p = .001, but the core findings of the initial models remained. Concerned about the high correlation between the party and coalition dummy variables, models were tested including each separately, producing largely consistent results. Lastly, to further distinguish potential coattail effects in the district, models were rerun, including whether the respondent voted for the party in the party list. Again, voting for the presidential candidate exhibited the largest coefficients.
Finally, test an alternative measure of vote choice. Individual level data unfortunately does not allow for a direct test of the partisanship of district dynamics similar to the aggregate analysis in Table 3. However, the post-election survey data does include additional data about the strength of partisan identification and if one strongly, somewhat, or relatively leans towards a political party. Taking these measures, as well as those that did not identify leaning towards any of the three parties here, I could identify the percentage of voters at each partisan strength that voted for the party's presidential and district candidates as well as the party list ballot. I then constructed new variables combined the actual vote choice minus the percentage of the voters at that partisan level who voted the same way. This allows for a measure indicating to what degree the 2016 vote was a surprise based on partisan leaning and provides an indirect measure of coattail voting. For example, a DPP identifier that identifies strongly with the party and casts a ballot for Tsai Ing-wen would be expected (1–0.96 = 0.04), whereas Tsai vote among those that did not identify with the DPP at all is less expected (1–0.28 = 0.72). Table 9 presents the percentage of voters by partisan breakdown.
Rates of Voting Based on Strength of Partisan Identification

Table 10 presents a series of ordinary least squares (OLS) regressions using the new presidential vote as the independent variable and the new district and party list votes as the dependent. Across the board we find that the presidential vote corresponds with also supporting the party's district and party list, with the largest coefficients and highest r-squared on the DPP models. Additional models to test for straight-ticket legislative voting (omitted for space) produce similar results. Testing separate models for those that identify with the respective political party and those that did not, as well as additional models including the previous demographic controls, produced largely consistent findings. In sum, across multiple specifications, the findings clearly indicate a coattail effect on legislative voting with the strongest results found among those who voted for Tsai.
OLS Regression on District and Party List Voting

*p < .05, **p < .01, *** p < .001
The findings suggest that the popularity of Tsai Ing-wen, or at least a coalescing of anti-KMT sentiment around Tsai, and the related interaction between presidential and legislative votes in part explains the historic DPP majority in the Legislative Yuan. Although growing anti-KMT sentiment may have encouraged more Taiwanese to consider the DPP as an acceptable alternative to the KMT in general, the findings here suggest that the popularity of Tsai in effect pulled legislative votes toward the party independently of other factors. The findings further suggest that even in an election in which the incumbent party was expected to perform poorly, modest coattail effects remain. Admittedly, the presence of James Soong and the PFP likely created greater tension within “blue” voters to ticket split, especially among those disgruntled with the KMT's recent performances. Thus the ability for Chu to pull votes to the KMT likely would have been higher without Soong's entry into the race, but to what extent remains unclear. Finally, although limited considerably by the number of district candidates slated by the PFP, the results suggest that James Soong's appeal does influence legislative voting, despite another unsuccessful presidential campaign. However, the showing further illustrates concerns that the PFP's viability rests largely on the appeal of the leader, who, now aged 74, is unlikely to run for political office again.
CONCLUSION
Taiwan's historic 2016 election resulted not only in the country's first female president, but the first legislative majority for the perennial opposition DPP. Although the appeal of Tsai Ing-wen would be expected to influence legislative races, this analysis helps to elucidate the magnitude of this coattail effect. While her opponents Eric Chu and James Soong also pulled votes towards the party in legislative races, results here show they paled in comparison to that of Tsai. In addition, these effects are evident not only at the legislative district, but the party list and in straight ticket legislative voting. Thus, while coattail effects are commonly defined as applying only to lower level co-partisans in district races, this analysis finds a clear effect within the institutionally more complex environment of mixed member electoral systems.
Future work should aid in further disaggregating coattail effects. In the Taiwan case, identifying the potential coattail effect of mayoral races on lower level races during the concurrent local elections remains poorly analyzed. With Taiwan's small geographic size, mayoral races, especially for Taipei, are often viewed through a similar lens as national offices. Furthermore, mayoral candidates frequently later run for president. How many levels down such coattail effects reach remains unclear. More broadly, whether coattail effects in mixed systems are influenced by weighting of districts versus the party list or the number of candidates has not been analyzed. In addition, more complex interactions such as “two-sided” or “reverse” coattail effects between the president and legislator (e.g. Broockman Reference Broockman2009; Zudenkova Reference Zudenkova2011; Madariaga and Ozen Reference Madariaga and Ozen2015) remain poorly understood, especially if factoring in incumbency influences. More broadly, assessing coattail effects over time outside of the American context would greatly aid in the identification of general trends, by being able to more effectively parse out the influences of incumbency at both levels as well as perhaps country-specific patterns in competition.


