


Introduction
Within the internationally established clinical high risk for psychosis (CHR-P) approach for early risk detection and indicated prevention of first-episode psychosis, risk criteria are primarily identified by presence, time, and severity of CHR-P-symptoms [Reference Fusar-Poli1]. To define a CHR-P state, two sets of criteria are mainly used: ultra-high risk (UHR) and basic symptoms criteria [Reference Fusar-Poli, Borgwardt, Bechdolf, Addington, Riecher-Rössler and Schultze-Lutter2, Reference Schultze-Lutter, Michel, Schmidt, Schimmelmann, Maric and Salokangas3]. Basic symptoms are self-experienced subclinical disturbances in thinking, speech, and perception that patients immediately recognize as disturbances of their own mental processes and are therefore distinct from both UHR-relevant symptoms (i.e., attenuated or brief intermittent psychotic symptoms) and more persistent frank psychotic symptoms [Reference Schultze-Lutter, Debbané, Theodoridou, Wood, Raballo and Michel4]. Further highlighting the complexity of these manifestations, perceptive (per; e.g., perceptual basic symptoms, hallucinations) and non-perceptive (nonper; e.g., cognitive basic symptoms, delusions) CHR-P-symptoms exhibit meaningful differences in prevalence, expression, outcome, and clinical significance [Reference Schultze-Lutter, Schimmelmann, Flückiger and Michel5–Reference Zhang, Xu, Tang, Cui, Wei and Tang8]. Specifically, per-CHR-P-symptoms are more common, but less clinically relevant, in children and adolescents, with related psychological and functional burden increasing as they stabilize by age 18 [Reference Michel, Lerch, Büetiger, Flückiger, Cavelti and Koenig6, Reference Schimmelmann, Michel, Martz-Irngartinger, Linder and Schultze-Lutter9]. In contrast, prevalence of nonper-CHR-P-symptoms is more consistent across age groups, and they show earlier clinical significance, particularly in late adolescence, due to their stronger link to functional impairments and psychiatric comorbidities [Reference Michel, Lerch, Büetiger, Flückiger, Cavelti and Koenig6, Reference Schultze-Lutter, Ruhrmann, Michel, Kindler, Schimmelmann and Schmidt10]. These differences suggest that per-CHR-P-symptoms reflect earlier-stage maturation, while nonper-CHR-P-symptoms align with later-stage processes [Reference Schultze-Lutter, Ruhrmann, Michel, Kindler, Schimmelmann and Schmidt10]. While the CHR-P state remains associated with an increased risk of psychotic disorders, recent declines in conversion rates to psychosis, alongside high rates of comorbidity with non-psychotic psychopathology, have raised questions regarding its specificity [Reference Fusar-Poli, Nelson, Valmaggia, Yung and McGuire11–Reference Hartmann, McGorry, Destree, Amminger, Chanen and Davey14]. Simultaneously, this evidence, coupled with associations between CHR-P-symptoms and impairments in neurocognitive and psychosocial functioning, underscores the burden associated with the CHR-P state, criteria, and symptoms, independently of conversion to manifest psychosis [Reference Schmidt, Schultze-Lutter, Schimmelmann, Maric, Salokangas and Riecher-Rössler15–Reference McGorry19]. As psychotic disorders are increasingly conceptualized as existing along a continuum, from normativity to more severe psychopathology (DSM-5; [20]), and this hypothesis is gaining empirical support [Reference Shi, Wang, Yao, Su, Zhan and Mao16], focus is shifting toward the role of the CHR-P state, criteria, and symptoms in broader mental health contexts, and their mapping onto dimensional, symptom-driven models of psychopathology [Reference Shi, Wang, Yao, Su, Zhan and Mao16, Reference van Os and Linscott21, Reference Raballo, Poletti and Preti22–Reference van Os and Guloksuz25]. These efforts include investigation of the associations between CHR-P-symptoms and other severe mental disorders or symptom dimensions and may ultimately contribute to a better understanding of the full spectrum of mental health, with potential applications in both clinical and community settings [Reference Schultze-Lutter, Ruhrmann, Michel, Kindler, Schimmelmann and Schmidt10, Reference Cowan and Mittal24, Reference McGorry26, Reference Rinaldi, Osman, Kaess, Schimmelmann, Kindler and Schultze-Lutter27]. Specifically, understanding CHR-P-symptoms within the community can provide valuable insights into the psychosis continuum, where UHR- and basic symptoms occur at varying frequencies and levels of severity [Reference Schultze-Lutter, Ruhrmann, Michel, Kindler, Schimmelmann and Schmidt10, Reference Cowan, Williams, Schiffman, Ellman and Mittal28]. In this context, personality pathology emerges as a factor of particular interest, as evidence has consistently linked it to psychosis development and the psychosis continuum [Reference Andersen and Bienvenu29–Reference Sevilla-Llewellyn-Jones, Camino, Russo, Painter, Montejo and Ochoa31]. Both clinically significant personality traits (e.g., borderline, schizoid, schizotypal, avoidant) [Reference Sevilla-Llewellyn-Jones, Camino, Russo, Painter, Montejo and Ochoa31, Reference Boldrini, Tanzilli, Di Cicilia, Gualco, Lingiardi and Salcuni32] and expression patterns of personality domains [Reference Andersen and Bienvenu29] have been associated with psychotic disorders and CHR-P. Among several models of personality structure, research predominantly features the Big Five Model [Reference Andersen and Bienvenu29, Reference Franquillo, Guccione, Angelini, Carpentieri, Ducci and Caretti30, Reference Costa and McCrae33]. Studies have found that high neuroticism and low extraversion predict schizophrenia onset [Reference Andersen and Bienvenu29, Reference Van Os and Jones34, Reference Krabbendam, Janssen, Bak, Bijl, de Graaf and van Os35], and patients with first-episode psychosis additionally show higher openness and agreeableness, but lower extraversion and conscientiousness than controls [Reference Beauchamp, Lecomte, Lecomte, Leclerc and Corbière36]. Further, openness has been associated particularly with subclinical psychotic symptoms and psychotic proneness [Reference Franquillo, Guccione, Angelini, Carpentieri, Ducci and Caretti30, Reference Chmielewski, Bagby, Markon, Ring and Ryder37]. Moreover, in patients with psychosis, frequent comorbidity with avoidant, schizoid, paranoid and schizotypal personality disorders has been reported [Reference Franquillo, Guccione, Angelini, Carpentieri, Ducci and Caretti30], and studies involving CHR-P samples have consistently found a high prevalence (on average 39.4%) of personality disorders, most frequently schizotypal and borderline [Reference Boldrini, Tanzilli, Pontillo, Chirumbolo, Vicari and Lingiardi38]. Yet, despite growing evidence of associations between psychosis (risk) and personality pathology, the direction of any causal associations remains unclear, and evidence on the role of specific personality disorders and traits in CHR-P and conversion to psychosis is inconclusive [Reference Boldrini, Tanzilli, Pontillo, Chirumbolo, Vicari and Lingiardi38–Reference Caretti, Franquillo, Guccione, Cuzzocrea, Pecora and Trani40]. Therefore, recent literature suggests that, rather than specific traits or personality disorders, the essential and most impairing features of personality pathology – that is, disturbances in the self and interpersonal domains [Reference Beauchamp, Lecomte, Lecomte, Leclerc and Corbière36] – might underpin its association with psychosis and the CHR-P state [Reference Drvaric, Bagby, Kiang and Mizrahi39, Reference Caretti, Franquillo, Guccione, Cuzzocrea, Pecora and Trani40]. This proposition aligns with the Alternative Model of Personality Disorders in DSM-5 (AMPD; [20]), where moderate or greater (≥Level 2 on a 0–4 scale) impairments along two dimensions of overarching personality functioning, that is, self- and interpersonal functioning, constitute the essential diagnostic feature (Criterion A), complemented by maladaptive personality traits (Criterion B). Self-functioning captures identity and self-direction, encompassing a stable, coherent experience of the self as well as effective emotional regulation, self-reflection, and directed behavior [20]. In contrast, interpersonal functioning refers to interactive aspects of personality functioning, including empathy toward others as well as desire and capacity for intimacy [20]. These features are central to AMPD-personality pathology as they effectively distinguish personality disorders from both normative personality and other psychopathology (e.g., [Reference Morey, Benson, Busch and Skodol41]). Further highlighting their relevance, research indicated that personality functioning impairment predicts important negative outcomes such as impaired psychosocial functioning, for example, more accurately than categorial personality disorder (PD) diagnoses, and might address some well-known shortcomings of categorial conceptualizations, including accounting for comorbidity among personality disorders [Reference Morey, Benson, Busch and Skodol41, Reference Clark, Nuzum and Ro42]. Thus, in recognition of their clinical utility, dimensional approaches are being embraced more broadly [Reference Thomson, Cavelti, Lerch, Koenig, Reichl and Mürner-Lavanchy43], as further exemplified by the new ICD-11, also prioritizing personality functioning impairments in personality disorder diagnoses [44].
This conceptualization is relevant to the associations between personality pathology and psychosis risk because disruptions affecting the self and interpersonal relationships have also been observed along the psychosis continuum [Reference Caretti, Franquillo, Guccione, Cuzzocrea, Pecora and Trani40, Reference Cowan, Mittal and McAdams45–Reference Pionke-Ubych, Frydecka, Cechnicki, Krężołek, Nelson and Gawęda47]: moving on from its milder end toward manifest psychosis, progressively permeable self-other boundaries, self-disturbances, and gradual disruptions of narrative identity emerge, as well as impairment in interpersonal functioning [Reference Caretti, Franquillo, Guccione, Cuzzocrea, Pecora and Trani40, Reference Cowan, Mittal and McAdams45, Reference Damiani, Fusar-Poli, Brondino, Provenzani, Baldwin and Fusar-Poli46, Reference Raballo, Pappagallo, Dell’ Erba, Lo Cascio, Patane’ and Gebhardt48, Reference Ebisch and Gallese49]. However, research on personality functioning, especially within CHR-P, is still limited [Reference Franquillo, Guccione, Angelini, Carpentieri, Ducci and Caretti30, Reference Caretti, Franquillo, Guccione, Cuzzocrea, Pecora and Trani40].
Among factors proposed in literature as potentially underlying the association between psychotic/CHR-P-symptoms and personality pathology, cognitive biases often associated with psychosis emerge as an interesting candidate [Reference Pionke-Ubych, Frydecka, Cechnicki, Krężołek, Nelson and Gawęda47, Reference Menon, Quilty, Zawadzki, Woodward, Sokolowski and Boon50–Reference Gawęda, Prochwicz and Cella52]. Indeed, these particular cognitive biases, that is, stable and pervasive systematic distortions in information processing which were initially conceptualized as psychosis-specific, were later also associated with borderline personality disorder, independently from psychiatric comorbidity or a history of psychotic symptoms [Reference Moritz, Schilling, Wingenfeld, Köther, Wittekind and Terfehr51, Reference Alford, Beck and Jones53–Reference Moritz, Pfuhl, Lüdtke, Menon, Balzan and Andreou55]. Moreover, cognitive biases originally linked to psychosis were associated with greater frequency and severity of CHR-P-symptoms in community samples, as well as personality traits and disorders implicated in CHR-P-symptom development [Reference Menon, Quilty, Zawadzki, Woodward, Sokolowski and Boon50, Reference Gawęda, Prochwicz and Cella52, Reference Livet, Navarri, Potvin and Conrod56]. One possible explanation for these associations is that cognitive biases function as the operational component of personality features, actively shaping and sustaining maladaptive beliefs which predispose individuals to psychopathology and psychosis risk [Reference Gawęda, Prochwicz and Cella52]. Yet, despite growing evidence suggesting an association of cognitive biases with both personality pathology and CHR-P, existing research has not yet, to our knowledge, explored them together with either CHR-P or a specific focus on personality functioning [Reference Pionke-Ubych, Frydecka, Cechnicki, Krężołek, Nelson and Gawęda47, Reference Menon, Quilty, Zawadzki, Woodward, Sokolowski and Boon50]. Therefore, we explored the associations of personality functioning impairment and cognitive biases with the presence and expression of CHR-P-symptoms in the community. More precisely, our primary research question investigated whether overall personality functioning impairment and cognitive biases were associated with the occurrence and severity of CHR-P-symptoms, controlling for associations with current psychopathology and socio-occupational functioning, as these factors are known to relate to CHR-P-symptom presentation [Reference Michel, Ruhrmann, Schimmelmann, Klosterkötter and Schultze-Lutter17, Reference Michel, Schmidt, Schnyder, Flückiger, Käufeler and Schimmelmann57]. In a second step, consistent with the AMPD framework (Supplementary Materials, eTable 2), whenever personality functioning impairment (i.e., Criterion A) was significantly associated with CHR-P-symptom occurrence or severity, we further examined maladaptive personality traits (i.e., Criterion B) for associations with CHR-P-symptom occurrence and severity. Finally, to address possible differences between CHR-P-symptom subtypes, we additionally tested these associations on per-CHR-P- and nonper-CHR-P-symptoms separately, drawing on the evidence of differences in their manifestation, trajectory, and underlying mechanisms [Reference Schultze-Lutter, Schimmelmann, Flückiger and Michel5, Reference Michel, Lerch, Büetiger, Flückiger, Cavelti and Koenig6, Reference Zhang, Xu, Tang, Cui, Wei and Tang8].
Methods
Recruitment and procedures
Our analyses involved cross-sectional data from an initial sample of 450 participants (age 17–60 years) who had completed the add-on questionnaires to the second follow-up (ethics ID: 2020–02856) of the “Bern Epidemiological At-Risk” (N = 418) and the “Bi-national Evaluation of At-Risk Symptoms in Children and Adolescents” (N = 32) community studies by November 2023 (see Supplementary Materials, eFigure 1 for details on the current sample; [Reference Schultze-Lutter, Schimmelmann, Flückiger and Michel5, Reference Schultze-Lutter, Michel, Ruhrmann and Schimmelmann58, Reference Schultze-Lutter, Schimmelmann and Michel59]). Requirements for participation in the add-on study were provision of ad hoc informed consent, fluency in German, and no history of psychosis. Data were collected via a main clinical interview conducted via telephone (duration: 45–90 minutes) and add-on self-report questionnaires, filled out online (unless participants expressly requested a paper copy, which they sent back via mail after completion). All data were recorded on REDCap electronic data capture tools (https://projectredcap.org) hosted at the University of Bern [Reference Harris, Taylor, Minor, Elliott, Fernandez and O’Neal60]. Results of a previous feasibility study supported the reliability of the telephone assessment, showing 78–100% concordance rates with face-to-face interviews [Reference Michel, Schimmelmann, Kupferschmid, Siegwart and Schultze-Lutter61]. Further information on study procedures and recruitment can be found in eText 1.
Assessments
CHR-P-symptoms
Presence of CHR-P-symptoms was evaluated during the telephone assessment with (i) the Structured Interview for Psychosis-Risk Syndromes (SIPS; [Reference McGlashan, Walsh and Woods62]), assessing positive UHR-symptoms, and (ii) the Schizophrenia Proneness Instrument, in its Adult (SPI-A; [Reference Schultze-Lutter, Addington, Ruhrmann and Klosterkötter63]) and Child and Youth (SPI-CY; [Reference Marshall, Schultze-Lutter, Marshall and Koch64]) versions, assessing basic symptoms. Evidence indicated excellent median inter-rater reliability (k = 0.89), as well as strong predictive, convergent, and discriminant validity for the SIPS [Reference Woods, Walsh, Powers, McGlashan, Li, Shapiro and Seidman65], good inter-rater reliability and discriminant validity for SPI-A [Reference Schultze-Lutter, Ruhrmann, Fusar-Poli, Bechdolf, Schimmelmann and Klosterkotter66] and SPI-CY [Reference Fux, Walger, Schimmelmann and Schultze-Lutter67].
SIPS-positive scales and SPI-A/CY-items are rated on a 0–6 scale according to their severity and frequency, respectively. We did not consider CHR-P criteria (Supplementary Materials, eTable 1), both because conversion was not our focus, and to increase power, as, consistently with data from earlier assessment times (e.g., [Reference Schultze-Lutter, Michel and Schimmelmann68]), an absolute minority of our sample met the criteria (0.22% for UHR, 2.67% for COPER, and 0.67% for COGDIS).
Next, we created three composite sum-scores by summing individual item scores (range: 0–6). First, we calculated: (i) a per-CHR-P-sum-score (0–18), by adding scores from the SIPS-P4 item and the two SPI-A/-CY items assessing perceptual abnormalities/hallucinations; and (ii) a nonper-CHR-P-sum-score (0–96), by summing scores from all remaining items (Supplementary Materials, eTable 1). These two scores were then added to obtain (iii) an overall CHR-P-sum-score (0–114).
Personality pathology
We evaluated severity of personality functioning impairment (Criterion A, AMPD) on the Level of Personality Functioning Scale-Brief Form 2.0 (LPFS-BF 2.0; [Reference Weekers, Hutsebaut and Kamphuis69]), which showed good reliability and construct validity [Reference Bach and Hutsebaut70]. Each item measures impaired functioning (0–3) in one of 12 facets, capturing impairments in identity, self-direction, empathy, and intimacy (i.e., personality functioning-elements), and providing an overall sum-score.
Further, we assessed maladaptive personality traits (Criterion B, AMPD) with the Personality Inventory DSM-5 (PID-5-BF; [Reference Krueger, Derringer, Markon, Watson and Skodol71]), wherein scores (0–3) in 25 items are clustered in five higher-order personality trait domains (i.e., negative affect, detachment, antagonism, disinhibition, and psychoticism), and used to calculate an average total score. Evidence on this instrument showed medium to good convergence and discriminant validity [Reference Barchi-Ferreira Bel and Osório72].
Both instruments were filled out online.
Cognitive biases
Cognitive biases were evaluated with the Cognitive Biases Questionnaire for psychosis (CBQp; [Reference Peters, Moritz, Schwannauer, Wiseman, Greenwood and Scott73]), also administered online. The questionnaire assesses five cognitive distortions (i.e., jumping to conclusions, intentionalizing, catastrophizing, emotional reasoning, dichotomous thinking) of clinical relevance and high frequency in psychosis, using five subscales. For each of 30 vignettes describing everyday events, respondents choose the most likely between three alternative cognitive responses, illustrating absence (scored 1), possible (2), or likely presence (3) of interpretation bias. Then, summing item-scores resulted in an overall sum-score (30–90). The CBQp showed good internal consistency and excellent test–retest reliability, with its use of indirect questioning of cognitive biases, rather than their direct assessment and labeling, effectively countering the risk of report bias [Reference Peters, Moritz, Schwannauer, Wiseman, Greenwood and Scott73].
Psychopathology
We assessed current Axis I-psychopathology during the telephone interview with the Mini-International Neuropsychiatric Interview [Reference Sheehan, Lecrubier, Sheehan, Amorim, Janavs and Weiller74], based on DSM-IV psychiatric diagnoses and demonstrating acceptable to high accuracy as well as overall good psychometric properties [75–Reference Pettersson, Boström, Gustavsson and Ekselius77]. A score of 1 on the scale assessing each disorder indicated its presence and contributed to the psychopathology sum-score (0–22) reflecting the number of current psychiatric diagnoses.
Socio-occupational functioning and sociodemographic variables
Functioning was assessed with the Social and Occupational Functioning Assessment Scale (SOFAS; 0–100; [75]), a widespread measure of functioning often chosen for its simplicity [Reference Cowman, Godfrey, Walsh, Frawley, Fowler and Alvarez-Jimenez78]. Further, we included sex, age, and education level (International Standard Classification of Education or ISCED [Reference Hoffmeyer-Zlotnik and Wolf79]) as covariates in our models. This data was obtained during the main telephone assessment.
Statistical analyses
Data analysis was conducted in RStudio version 4.3.2., using the stats and pscl packages.
After listwise deletion of six observations with missing values, we z-standardized the sum-scores evaluating personality functioning impairment, cognitive biases, PID-5, current psychopathology, and socio-occupational functioning, as well as each subscale of the first three. Next, in order to account for overrepresentation of zeros in our outcome variables (i.e., CHR-P, per-CHR-P, and nonper-CHR-P-symptoms), we built three zero-inflated Poisson (ZIP) models [Reference Lambert80–Reference Green82]. ZIP models are particularly well-suited to modeling outcomes that are infrequent yet potentially of substantial relevance, making them appropriate for exploring factors contributing to CHR-P symptomatology in the community [Reference Atkins and Gallop81]. While traditional count models (e.g., Poisson regression) would likely lead to biased interpretation of this highly skewed data, ZIP models account for the existence of two distinct underlying processes suggested by the skewed distribution: one determining the likelihood of zero instances of the outcome and the other modeling the count of non-zero instances [Reference Atkins and Gallop81]. In our study, each ZIP model comprised (i) a zero-inflation model, describing how predictors and covariates influenced the likelihood of the outcome variable being zero on a binary distribution, (ii) a count model, describing how predictors and covariates influenced the actual value of the outcome variable on a Poisson distribution. Moreover, each model included: (i) the sum-scores for the two main predictors – personality functioning impairment and cognitive biases – and the control variables including current psychopathology and socio-occupational functioning; (ii) the covariates age, sex, and education level; (iii) the per-CHR-P-, nonper-CHR-P-, and CHR-P-sum-scores as the respective outcome. Then, in the final sample (N = 444), we tested each ZIP model against an equivalent Poisson model, wherein a lower Akaike Information Criterion indicated better data fit [Reference Akaike, Petrov and Csaki83]. In models where personality functioning was a significant predictor (p < .05), we included the PID-5-sum-score (maladaptive personality traits) as an additional predictor, and ran a Likelihood Ratio test with the lmtest R-package, wherein significance (p < .05) indicated improved model fit. In models where personality functioning or cognitive biases were significant predictors (p < .05), we reiteratively replaced them with each of their subscales to analyze their individual contribution, thus testing 19 additional models. Our choice of this procedure, and against simultaneous inclusion of all subscales in one model, was made to avoid multicollinearity, which can arise from high correlations between subscales of an instrument or between instruments measuring related constructs (e.g., LPFS and PID-5, both measuring features of personality). Results of this explorative analysis should be interpreted with caution.
We did not correct for multiple testing in light of (i) the limited number of statistical tests involving the two main predictors (personality functioning and cognitive biases) across three models (six in total), (ii) the correlation between our three outcomes (CHR-P-, per-, and nonper-CHR-P-symptoms), and (iii) the overall exploratory nature of our calculations, which did not involve exact hypotheses on associations between the main variables. All together, these factors determined a limited risk of Type I error, which should most critically be controlled for via multiple testing correction when conducting several comparisons between independent data or in confirmatory designs [Reference Bender and Lange84, Reference Feise85]. In our design, this was weighed against the greater risk of obtaining excessively conservative effect estimates by adjusting p-values [Reference Saville86, Reference Perneger87], and the procedure was considered inappropriate.
Results
Sample characteristics
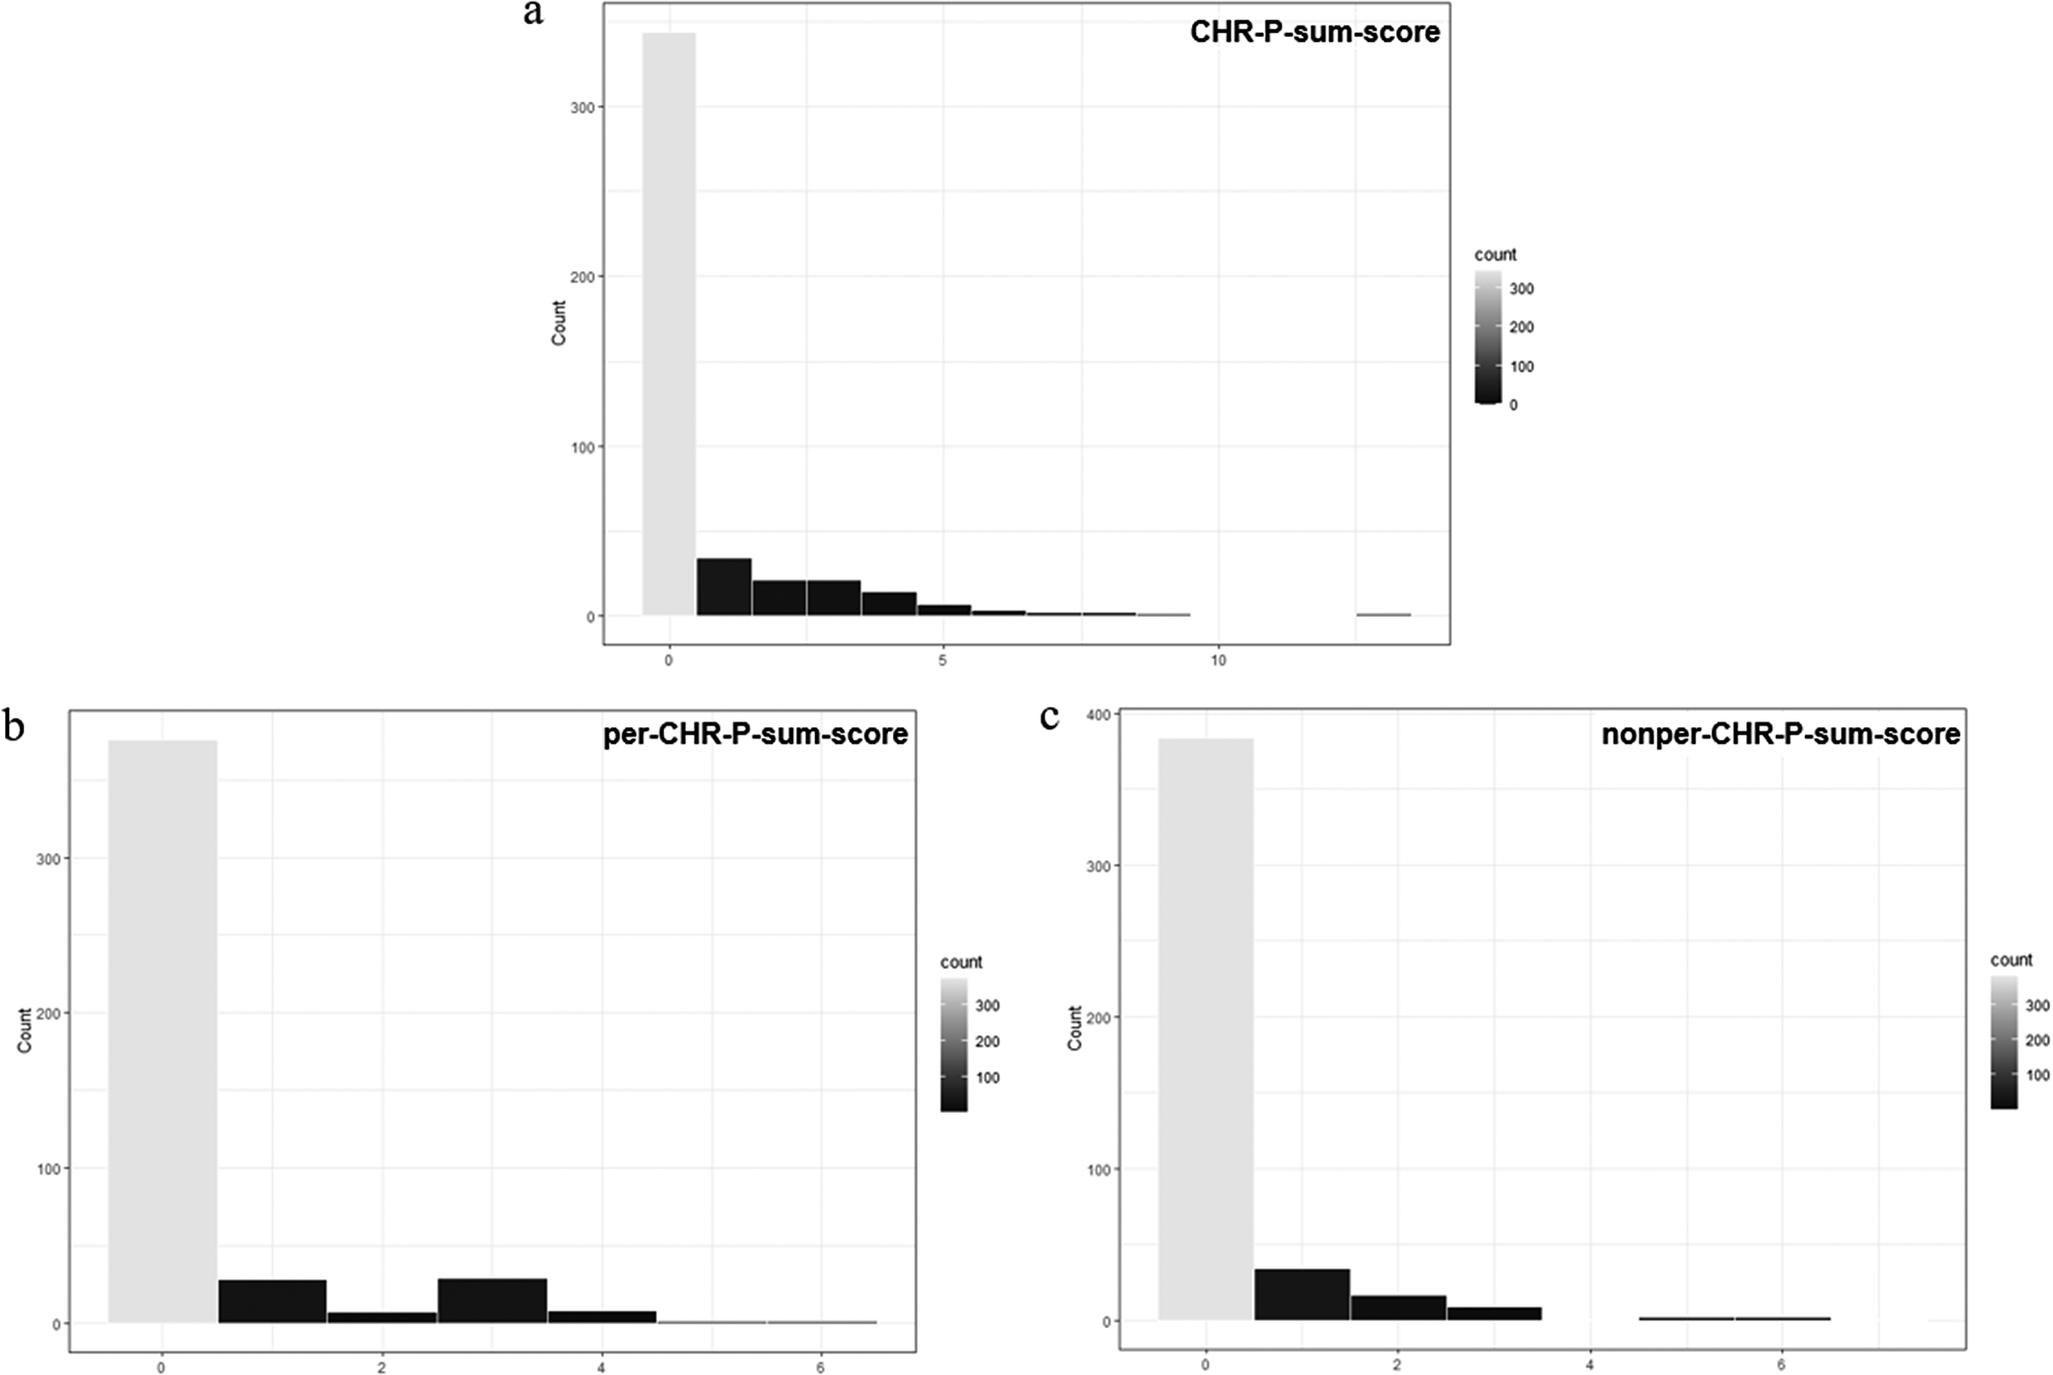
Our sample comprised a majority of adult (99.77%), female, highly educated, functionally unimpaired (SOFAS > 70; 94.4%) participants (Table 1). As expected in a community sample, most participants showed no current axis-I disorders, personality functioning impairment was below clinical levels, maladaptive personality traits were below reported elevation cut-offs (Table 1, Supplementary Materials, eTable 2; e.g., [Reference Miller, Bagby, Hopwood, Simms and Lynam88]), and for most participants the CHR-P- (76.44%), per-CHR-P- (83.56%), and nonper-CHR-P-sum-scores (85.33%) were zero (Figure 1).
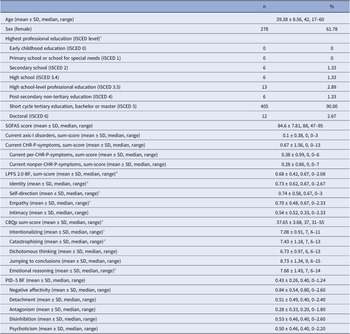
Sample characteristics (N = 450)
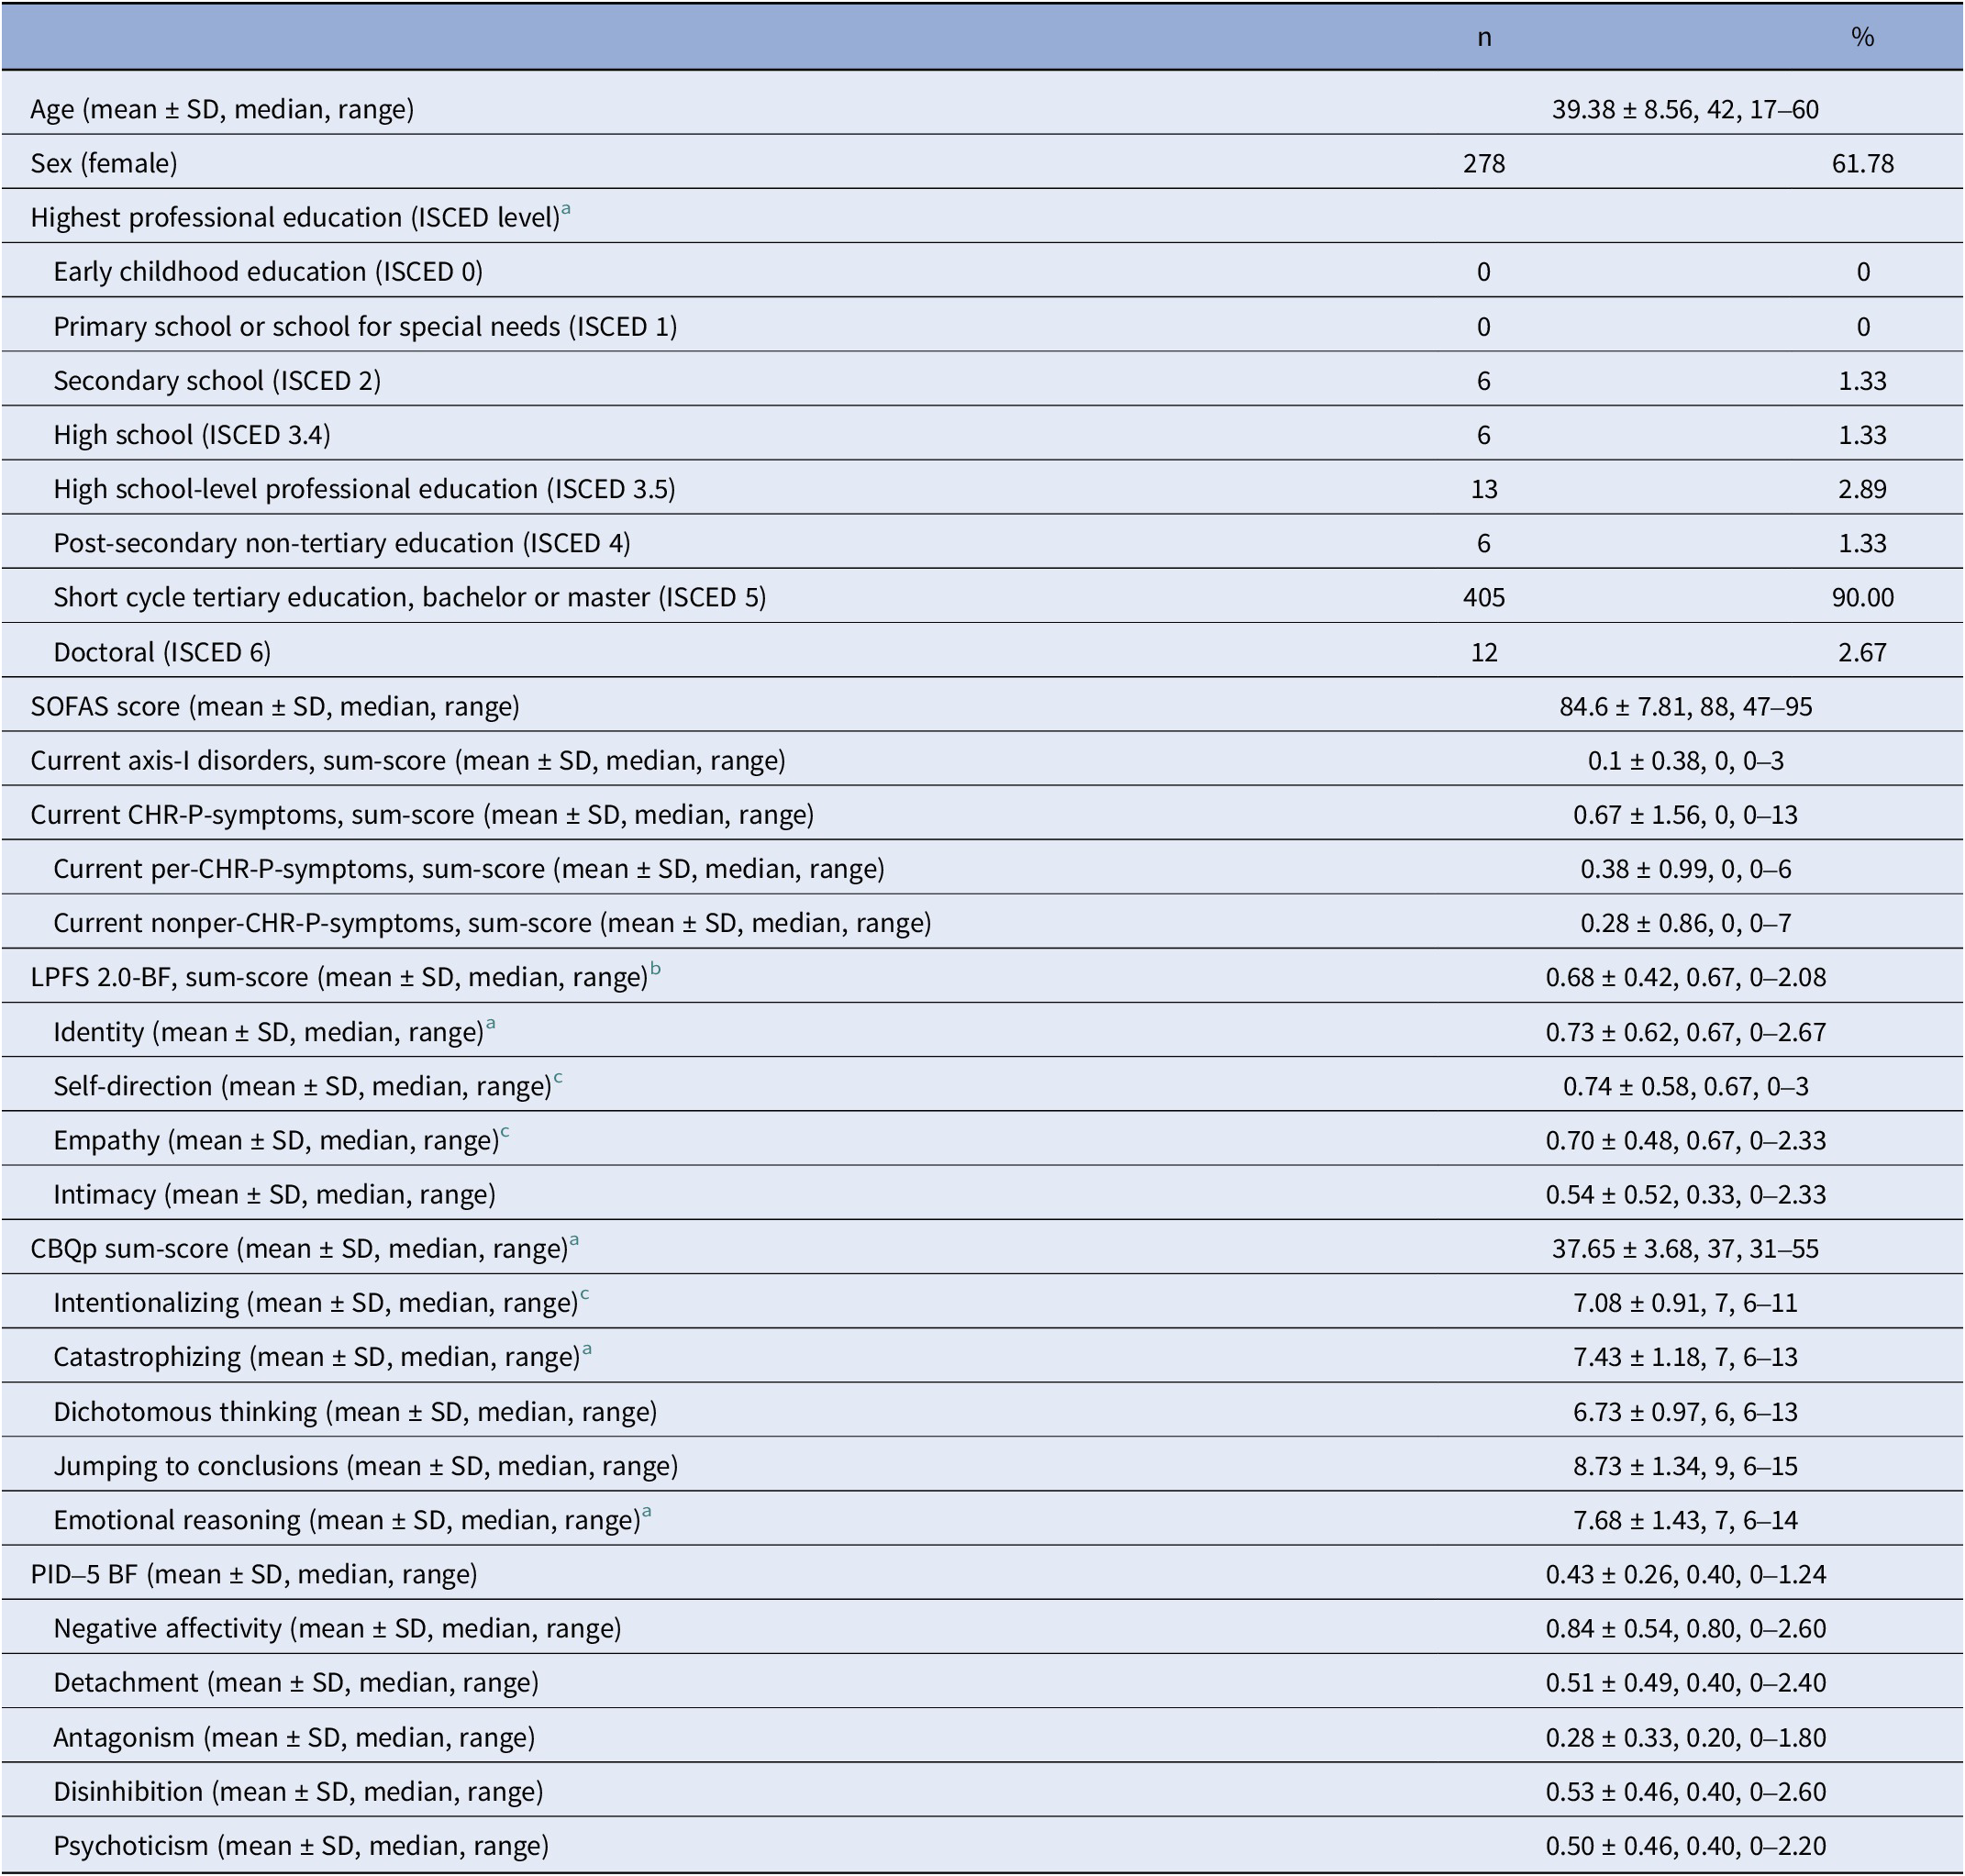
Abbreviations: SOFAS, Social and Occupational Functioning Assessment Scale; CHR-P, clinical high-risk of psychosis; per-CHR-P, perceptive CHR-P; nonper-CHR-P, non-perceptive CHR-P; LPFS-BF 2.0, Level of Personality Functioning Scale-Brief Form 2.0; CBQp, Cognitive Biases Questionnaire; PID-5-BF: Personality Inventory DSM-5 Brief Form.
a Data from two participants (0.44%) were missing.
b Data from three participants (0.67%) were missing.
c Data from one participant (0.22%) were missing.
ZIP models
When compared by data fit, each ZIP model outperformed its equivalent Poisson model (Supplementary Materials, eTable 3) and was therefore retained for further analyses.
CHR-P-symptoms
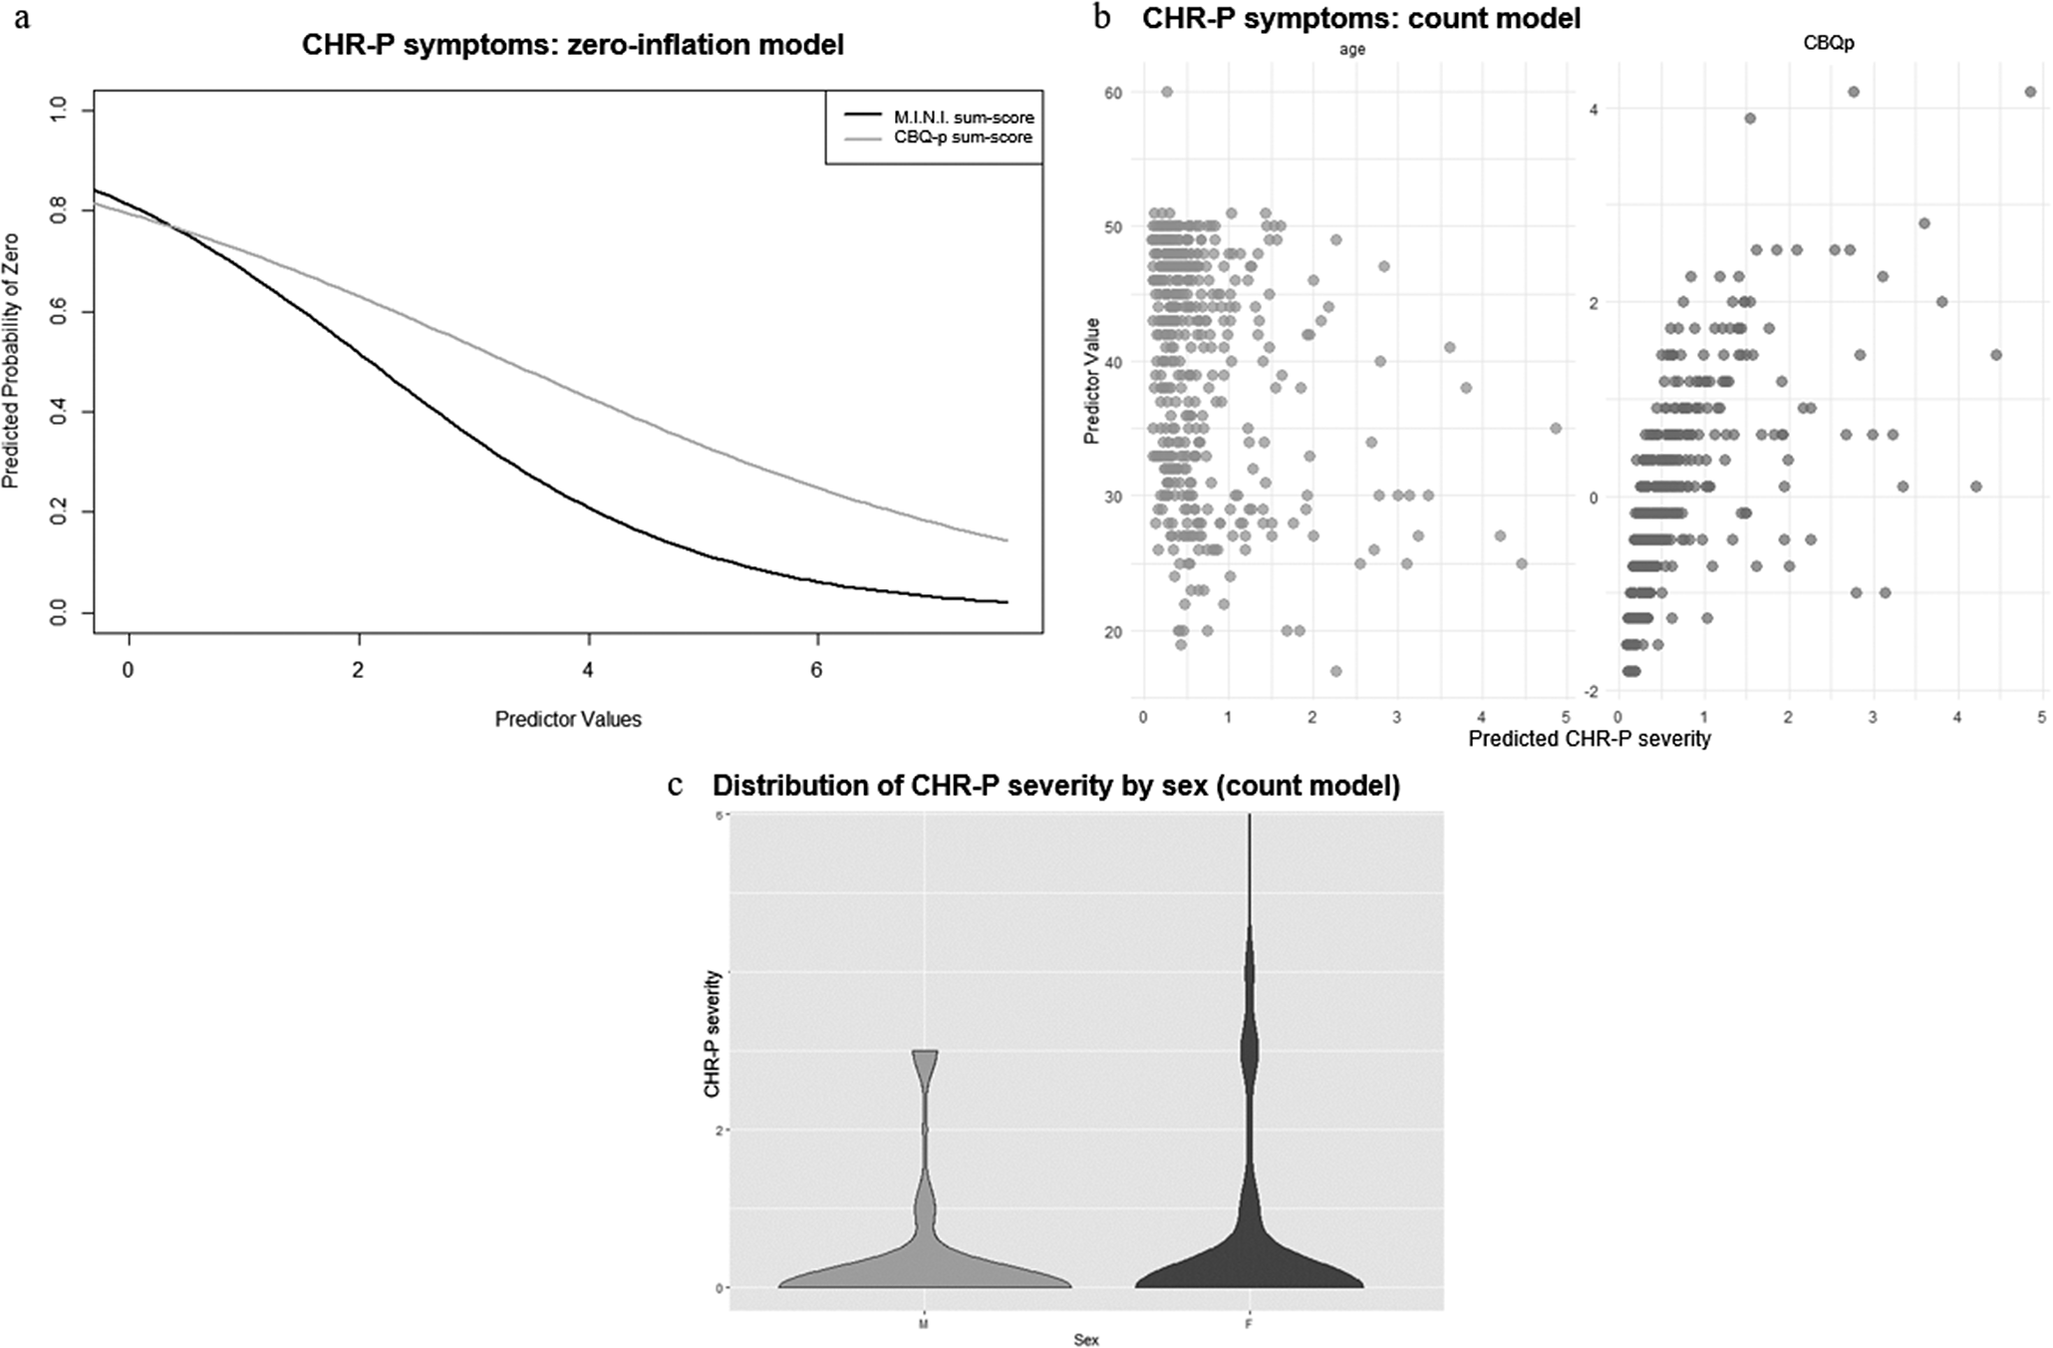
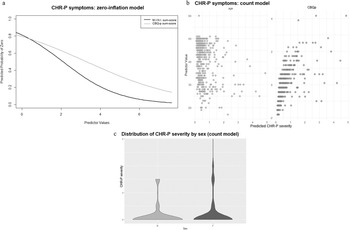
In the zero-inflation model, more current axis-I diagnoses (γ = −0.69 ± 0.19, p < .001) and more severe cognitive biases (γ = −0.41 ± 0.15, p = 0.006) were associated with a lower likelihood of the CHR-P-sum-score being 0 (Figure 2a). Additionally, younger age (β = −0.03 ± 0.01, p < .001), female sex (β = 0.32 ± 0.16, p = 0.045), and more severe cognitive biases (β = 0.20 ± 0.07, p = 0.005) were associated with higher CHR-P-sum-scores in the count model (Figure 2b and c). personality functioning was not a significant predictor of either CHR-P-symptom likelihood or severity (Supplementary Materials, eTable 4).
ZIP model results for CHR-P-symptoms. Figure 2a: Zero-inflation model. The x-axis shows values of the significant predictor, control variable, or covariate, while the y-axis shows the probability of CHR-P-symptoms being zero (e.g., the higher the CBQp-sum-score, indicating more severe cognitive biases, the lower the probability of CHR-P-symptoms being zero). Figure 2b: Count model. The x-axis shows predicted CHR-P-symptom severity, while the y-axis shows values of the significant predictor, control variable, or covariate (e.g., the younger the age, the higher the predicted CHR-P-symptom severity; the higher the CBQp-sum-score, indicating more severe cognitive biases, the higher the predicted CHR-P-symptom severity). Figure 2c: Count model. The x-axis organizes the data by the significant categorial covariate sex, while the y-axis shows predicted CHR-P-symptom severity. Females (F) tend to have a broader distribution of CHR-P-symptom severity, with higher participant density at both lower and higher CHR-P-symptom severity levels, compared to males (M).
In the exploratory analyses examining individual cognitive biases, more severe catastrophizing (γ = −0.37 ± 0.15, p = .01), dichotomous thinking (γ = −0.27 ± 0.13, p = .04), and emotional reasoning (γ = −0.30 ± 0.13, p = .02) were associated, in their respective zero-inflation models, with lower likelihood of CHR-P-sum-scores being 0. Additionally, in the corresponding count models, more severe dichotomous thinking (β = 0.11 ± 0.05, p = .03) and emotional reasoning (β = 0.21 ± 0.06, p < .001) were associated with higher CHR-P-sum-scores.
Perceptive CHR-P-symptoms
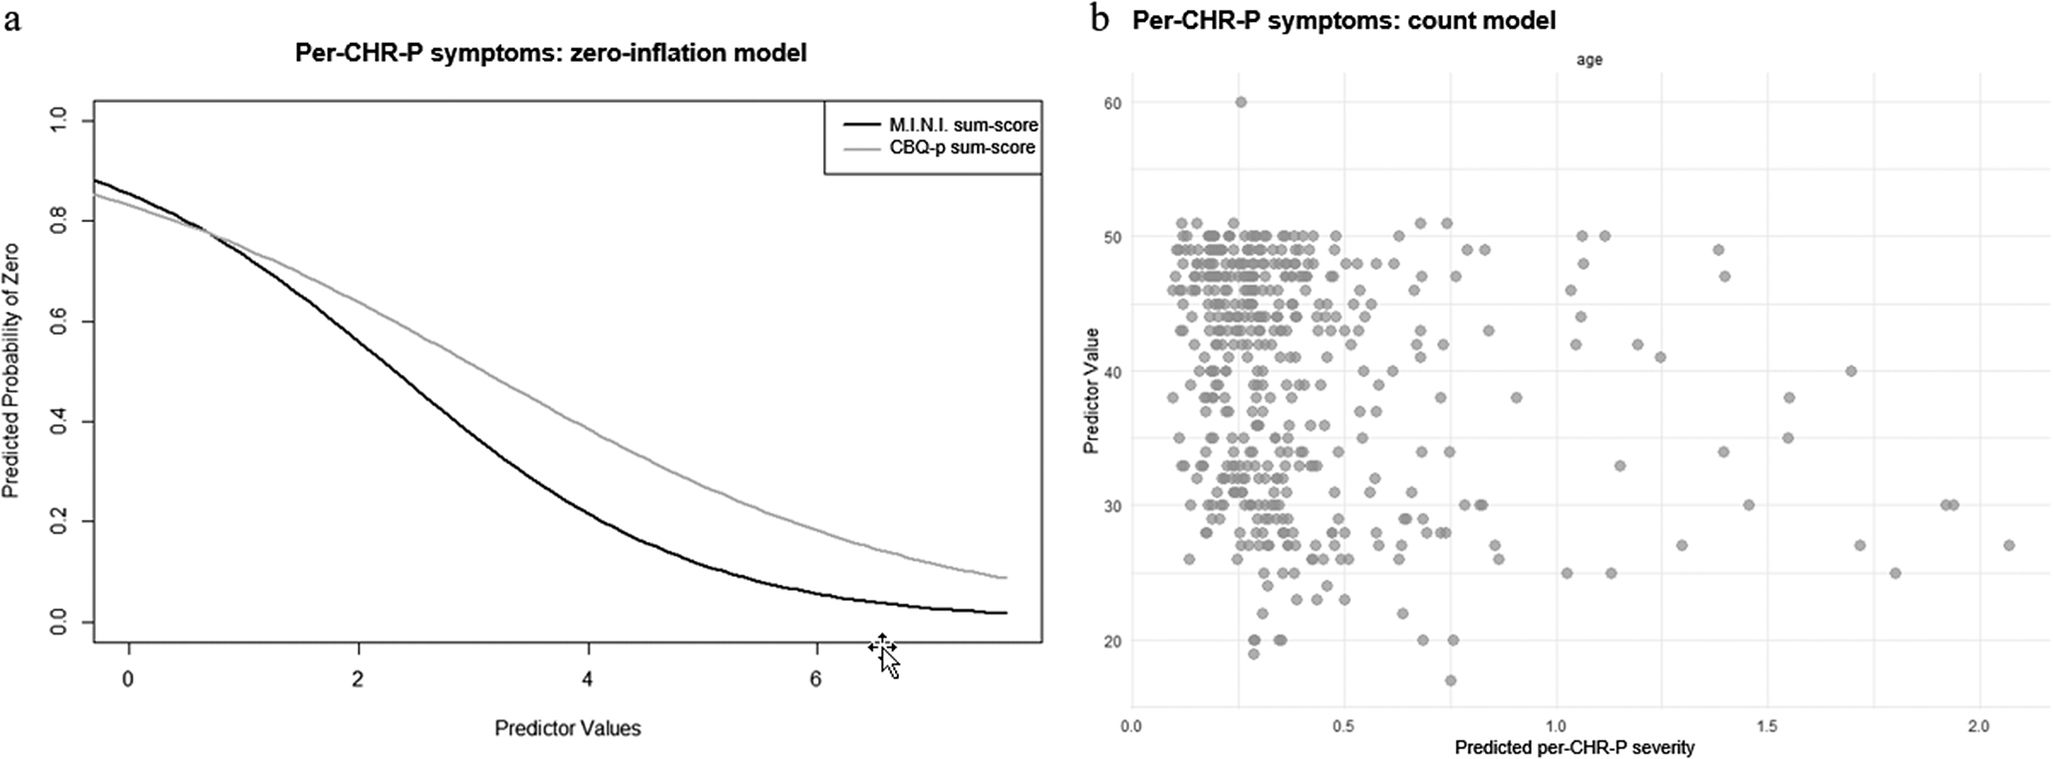
In the zero-inflation model considering only per-CHR-P-symptoms, more current axis-I diagnoses (γ = −0.76 ± 0.18, p < .001) and more severe cognitive biases (γ = −0.52 ± 0.18, p = .003) were associated with lower likelihood of the outcome value being 0 (Figure 3a). In the count model, only younger age was associated with higher per-CHR-P-sum-scores (β = −0.02 ± 0.01, p = .03) (Figure 3b). Personality functioning did not significantly predict either per-CHR-P-symptom likelihood or severity (Supplementary Materials, eTable 5).
ZIP model results for per-CHR-P-symptoms. Figure 3a: Zero-inflation model. The x-axis shows values of the significant predictor, control variable, or covariate, while the y-axis shows the probability of per-CHR-P-symptoms being zero (e.g., the higher the CBQp-sum-score, indicating more severe cognitive biases, the lower the probability of CHR-P-symptoms being zero). Figure 3b: Count model. The x-axis shows predicted per-CHR-P-symptom severity, while the y-axis shows values of the significant predictor, control variable, or covariate (e.g., the younger the age, the higher the predicted CHR-P-symptom severity).
As for individual cognitive biases, more severe dichotomous thinking (γ = −0.31 ± 0.14, p = .03) and emotional reasoning (γ = −0.40 ± 0.15, p = .008) were associated – in their respective zero-inflation models – with lower likelihood of per-CHR-P-sum-scores being 0. In the count model, intentionalizing and per-CHR-P-sum-scores were negatively correlated (β = −0.20 ± 0.10, p < .04).
Non-perceptive, delusional, or cognitive CHR-P-symptoms
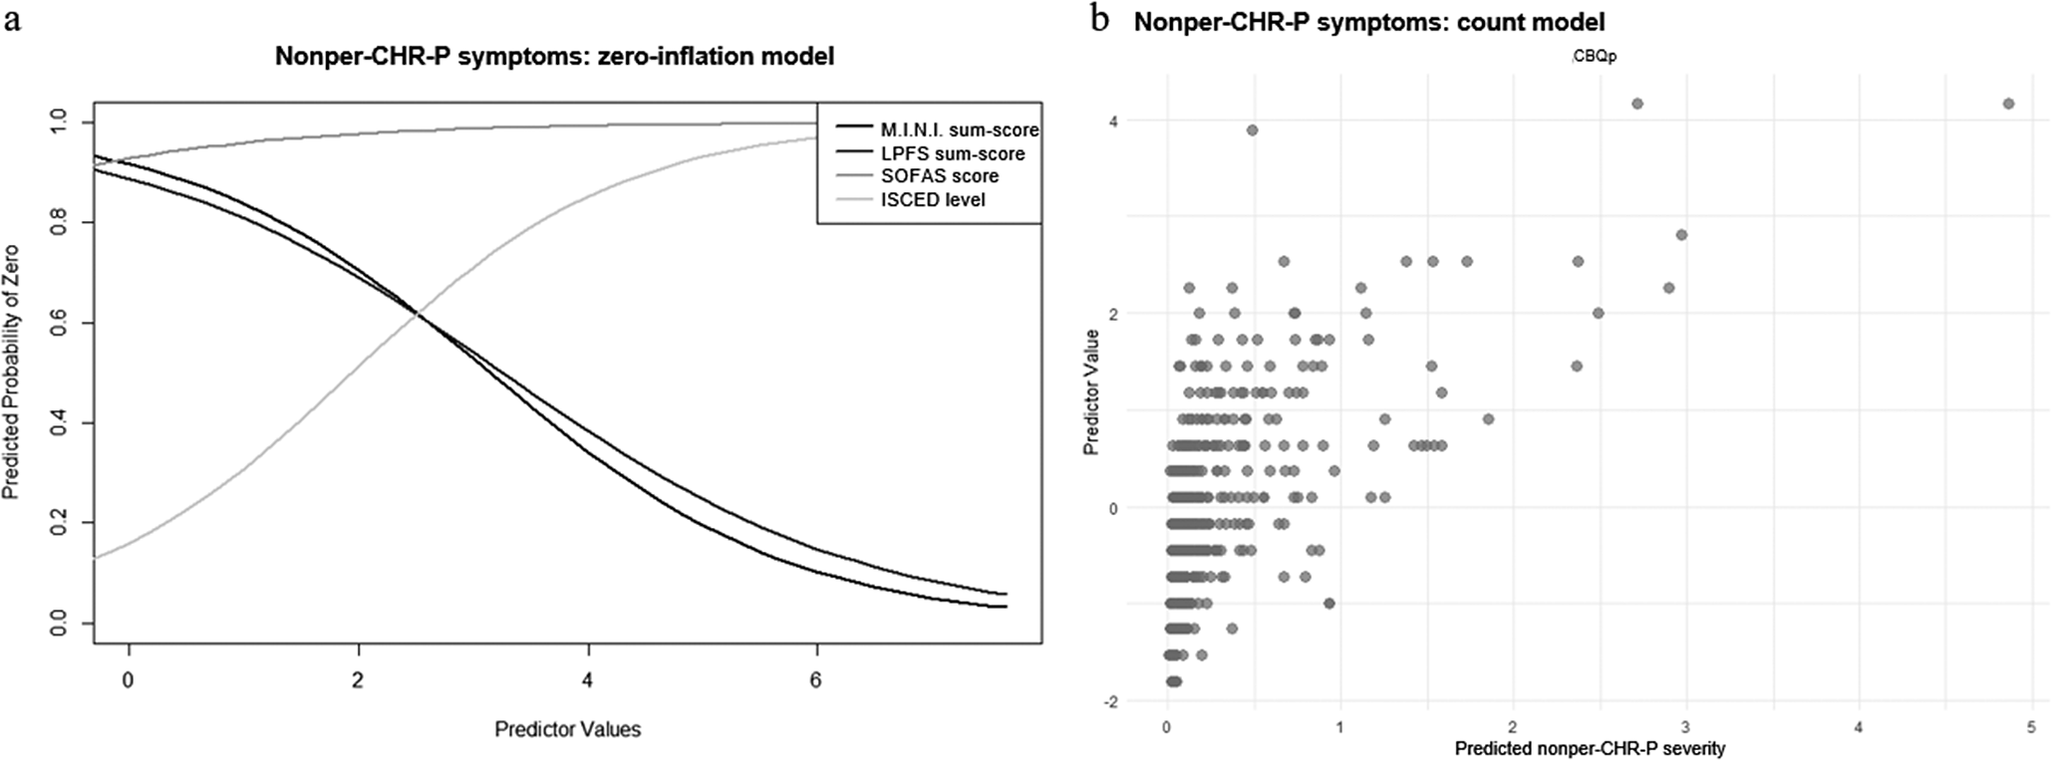
In the zero-inflation model of nonper-CHR-P-symptoms, more impaired personality functioning (γ = −0.64 ± 0.26, p = .02) and more current axis-I diagnoses (γ = −0.76 ± 0.28, p = .007) were associated with lower, while higher socio-occupational functioning (γ = 0.61 ± 0.31, p = .48) and education level (γ = 0.85 ± 0.40, p = .03) with higher likelihood of having an outcome score of 0 (Figure 4a). Moreover, in the count model, more severe cognitive biases were associated with higher nonper-CHR-P-sum-scores (β = 0.43 ± 0.11, p < .001) (Figure 4b; see Supplementary Materials, eTable 6 for results including non-significant predictors).
ZIP model results for nonper-CHR-P-symptoms. Figure 4a: Zero-inflation model. The x-axis shows values of the significant predictor, control variable, or covariate, while the y-axis shows the probability of nonper-CHR-P-symptoms being zero (e.g., the higher the SOFAS-sum-score, indicating higher socio-occupational functioning, the higher the probability of nonper-CHR-P-symptoms being zero; the higher the LPFS-sum-score, indicating higher personality functioning impairment, the lower the probability of nonper-CHR-P-symptoms being zero). Figure 4b: Count model. The x-axis shows predicted nonper-CHR-P-symptom severity, while the y-axis shows values of the significant predictor, control variable, or covariate (e.g., the higher the CBQp-sum-score, indicating more severe cognitive biases, the higher the predicted nonper-CHR-P-symptom severity).
Since personality functioning impairment was a significant predictor in this model, we included maladaptive personality traits as an additional predictor and compared the two models via a Likelihood Ratio test, which was non-significant (p = .13; Supplementary Materials, eTable 7), indicating that the new model did not improve fit to our data. Thus, it was discarded.
Finally, examining the impact of individual cognitive biases and personality functioning elements, we found that more pronounced catastrophizing (γ = −0.48 ± 0.21, p = .02), identity impairments (γ = −0.76 ± 0.26, p = .003), and self-direction impairments (γ = −0.56 ± 0.22, p = .009) were associated with lower likelihood of nonper-CHR-P-sum-scores being 0 in the relevant zero-inflation models. In the corresponding count models, more severe intentionalizing (β = 0.34 ± 0.10, p < .001), dichotomous thinking (β = 0.36 ± 0.09, p < .001), and emotional reasoning (β = 0.30 ± 0.09, p < .001) were linked to higher nonper-CHR-sum-scores, while higher impairments in identity (β = −0.26 ± 0.11, p = .03) were associated with lower nonper-CHR-P-sum-scores.
Discussion
In this community study, we investigated the association of personality pathology and cognitive biases with CHR-P-symptom (i.e., UHR- and basic symptom) expression. In our findings, personality functioning was specifically associated with the presence of nonper-CHR-P-symptoms, with maladaptive personality traits not substantially contributing to the respective model. In contrast, cognitive biases significantly correlated with both the presence and severity of CHR-P-symptoms, showing a differential relationship to per- and nonper-CHR-P-symptoms.
Further, exploring the association between psychopathology and socio-occupational functioning with CHR-P-symptom expression, we found a positive association across models between more axis-I diagnoses and the likelihood of CHR-P-symptoms, while socio-occupational functioning was negatively associated with nonper-CHR-P-symptom likelihood only. The implications of our findings and our exploratory analyses involving personality functioning elements and individual cognitive biases will be discussed below.
Personality functioning: Connections with nonper-CHR-P-symptoms
Overall, our results suggest a specific association between personality functioning impairment and a greater likelihood of nonper-CHR-P-symptoms, providing preliminary indications that the reported robust link between nonper-CHR-P- (especially UHR-) symptoms and impairment in psychosocial functioning [Reference Schimmelmann, Michel, Martz-Irngartinger, Linder and Schultze-Lutter9] might extend to include personality functioning impairment. Conversely, we found no significant association between personality functioning impairment and either overall CHR-P-symptoms or per-CHR-P-symptoms. These findings highlight the need to further investigate the differential associations between personality functioning impairment and different categories of CHR-P-symptoms, for example, using data where rates of per- and nonper-CHR-P-symptoms allow for direct group comparison (see [Reference Schimmelmann, Michel, Martz-Irngartinger, Linder and Schultze-Lutter9]). Considering (i) the established hypothesis linking nonper-CHR-P-symptoms to later-stage brain/cognitive maturation processes involving frontal regions [Reference Schultze-Lutter, Ruhrmann, Michel, Kindler, Schimmelmann and Schmidt10] and (ii) existing evidence on frontal region activation in self- and other-referential processing relevant to personality functioning [Reference Herpertz, Bertsch and Jeung89], future research should explore developmental and neurobiological correlates that might underlie the connection between nonper-CHR-P-symptoms and personality functioning in our study. Moreover, as negative CHR-P-symptoms were not assessed in the BEAR and BEARS-Kid studies, they were not considered in the current analysis. However, previous research has highlighted differential associations between personality pathology and positive versus negative subclinical psychotic symptoms [Reference Gawęda, Prochwicz and Cella52], suggesting that some aspects of the relationship between personality functioning and nonper-, or even per- and overall CHR-P-symptoms, might have been masked in our analysis.
Additionally, our exploratory analysis indicated that the association between higher personality functioning impairment and greater likelihood of nonper-CHR-P-symptoms might particularly concern impairments in identity and self-direction (i.e., self-functioning). In our analysis, the nonper-CHR-P-sum-score predominantly consists of cognitive basic symptoms, which then likely weighed more on the statistical analyses than their UHR-symptom counterparts. Since basic symptoms are subjective disturbances, involving changes in mental processes that are immediately perceived to be distinct from those familiar to the self, they are by definition related to the self [Reference Caretti, Franquillo, Guccione, Cuzzocrea, Pecora and Trani40, Reference Park, Bang, Kim, Lee and An90, Reference Schultze-Lutter, Michel, Flückiger and Theodoridou91]. In turn, this close association with the self might then help explain the link between nonper-CHR-P-symptoms and personality functioning in our results. Moreover, this finding aligns with research connecting deficits in the corresponding personality functioning facets (e.g., self-others boundaries, emotional regulation abilities, self-esteem, productive self-reflection) to CHR-P-symptom expression and course [Reference Rinaldi, Osman, Kaess, Schimmelmann, Kindler and Schultze-Lutter27, Reference Caretti, Franquillo, Guccione, Cuzzocrea, Pecora and Trani40, Reference Cowan, Mittal and McAdams45, Reference Damiani, Fusar-Poli, Brondino, Provenzani, Baldwin and Fusar-Poli46], although specific evidence on nonper-CHR-P-symptoms is lacking. In contrast, our finding of an association between higher impairments in identity and lower severity of nonper-CHR-P-symptoms seems incoherent with this reasoning. Possibly indicating a more complex relationship between identity and nonper-CHR-P-symptom expression, this warrants investigation beyond the scope of our cross-sectional study, under consideration of potential intervening factors, such as identity formation processes or positive resources buffering against nonper-CHR-P-symptom severity [Reference Schultze-Lutter, Schimmelmann, Flückiger and Michel5, Reference Sharp, Vanwoerden, Schmeck, Birkhölzer and Goth92, Reference Oliveros, Agulló-Tomás and Márquez-Álvarez93]. Speculatively, identity impairment might serve as a vulnerability factor for nonper-CHR-P-symptoms in their “trait-like,” “as-usual” manifestation, reflecting long-standing patterns less directly related to burden and psychosis risk [Reference Schultze-Lutter, Michel, Schmidt, Schimmelmann, Maric and Salokangas3,Reference Schultze-Lutter, Addington, Ruhrmann and Klosterkötter63]. Several other explanations for this finding, including Type I error, are also possible and should be rigorously tested in future studies. Finally, including maladaptive personality traits as a predictor of nonper-CHR-P-symptom expression did not improve this model. As our study design was guided by the AMPD, we only considered maladaptive personality traits when personality functioning showed a significant association to CHR-P-symptom expression, that is, only for nonper-CHR-P-symptoms. Therefore, while our work provides some support to the hypothesis that overarching features of personality, such as personality functioning, might be more closely associated with CHR-P expression than maladaptive traits [Reference Drvaric, Bagby, Kiang and Mizrahi39], a better comprehension of their role should be pursued in future research, including all categories of CHR-P-symptoms as well as clinical samples.
Cognitive biases: Unpacking complex associations
As a whole, more severe cognitive biases showed an association with both higher likelihood and severity of CHR-P-symptoms. Previous research has described a longitudinal link between cognitive biases and CHR-P-symptoms, proposing that cognitive biases might become a stable cognitive functioning feature, predisposing individuals to developing CHR-P-symptoms [Reference Prochwicz, Kłosowska and Karpowska94–Reference Lavigne, Deng, Raucher-Chéné, Hotte-Meunier, Voyer and Sarraf96]. Furthermore, literature indicates that cognitive biases impact on multiple levels of perception, information processing, and related emotional reactions (e.g., worry), potentially interacting with stress responses that influence CHR-P-symptom severity [Reference Corral, Labad, Ochoa, Cabezas, Muntané and Valero95, Reference Livesley and Larstone97, Reference Songco, Hudson and Fox98]. While this reasoning aligns with our findings, we cannot disentangle whether (more severe) cognitive biases might be a consequence or a vulnerability/exacerbating factor of CHR-P-symptoms using our cross-sectional data [Reference Corral, Labad, Ochoa, Cabezas, Muntané and Valero95, Reference Chaumette, Kebir, Mam Lam Fook, Bourgin, Godsil and Gaillard99]. Addressing this question in longitudinal research might both expand our understanding of CHR-P-symptom expression and inform preventive interventions. Moreover, in our exploratory analysis, more severe dichotomous thinking, emotional reasoning, and catastrophizing were associated with higher likelihood of CHR-P-symptoms, with the first two also correlating with higher CHR-P-symptom severity. Consistent with existing data linking these cognitive biases to the presence and severity of subclinical positive symptoms in healthy individuals [Reference Daalman, Sommer, Derks and Peters100–Reference Ahuir, Crosas, Estrada, Zabala, Pérez-Muñoz and González-Fernández102], these findings suggest that future research should explore their specific relevance to CHR-P-symptom expression in the community.
Furthermore, more severe cognitive biases were associated with higher likelihood of per- and severity of nonper-CHR-P-symptoms. Although our cross-sectional design precludes testing for directionality, the differential associations in our findings might reflect distinct underlying mechanisms and should be explored in future longitudinal studies. Based on our results, we might speculate that the predisposing function of cognitive biases for the development of CHR-P-symptoms is more closely related to per-CHR-P-symptoms and the connected earlier-stage maturation processes, while the impact of cognitive biases on CHR-P-symptoms rather concerns nonper-CHR-P-symptoms and the relative later-stage development processes [Reference Schultze-Lutter, Schimmelmann, Flückiger and Michel5, Reference Michel, Lerch, Büetiger, Flückiger, Cavelti and Koenig6, Reference Lavigne, Deng, Raucher-Chéné, Hotte-Meunier, Voyer and Sarraf96, Reference Ahuir, Crosas, Estrada, Zabala, Pérez-Muñoz and González-Fernández102]. However, we wish to reiterate that this interpretation exceeds the scope of our study, and should only exemplify how our preliminary findings might help structuring hypotheses on the relationship between cognitive biases and per- versus nonper-CHR-P-symptoms, to then be tested elsewhere. Further, considering individual cognitive biases, the severity of dichotomous thinking and emotional reasoning was associated with increased likelihood of per-CHR-P-symptoms, consistent with previous findings in individuals with subclinical auditory hallucinations [Reference Daalman, Sommer, Derks and Peters100]. Similarly, we found an association of more severe dichotomous thinking and emotional reasoning with higher severity of nonper-CHR-P-symptoms, aligning with existing evidence on delusions [Reference Gawęda and Prochwicz101]. Additionally, higher catastrophizing was associated with higher likelihood of nonper-CHR-P-symptoms, and higher intentionalizing with higher severity of nonper-CHR-P-symptoms. This reflected existing evidence on a link between catastrophizing and a higher likelihood of delusion presence and between intentionalizing and greater delusion severity [Reference Gawęda and Prochwicz101]. Interestingly, higher intentionalizing correlated with less severe per-CHR-P-symptoms, suggesting a more complex relationship. This association might be influenced by the fact that, while evidence linked intentionalizing to perceptive symptoms via (the emotional component of) hallucinations [Reference Gawęda, Staszkiewicz and Balzan103], our per-CHR-P-sum-score predominantly consisted of basic symptoms. As this is true for all sum-scores, and evidence regarding the relationship between cognitive biases and basic symptoms is currently lacking, our results should overall be interpreted with caution and further investigated, especially considering our cross-sectional, explorative design. Offering an additional explanation for their correlation in our analyses, cognitive biases and (cognitive) basic symptoms both refer to aspects of cognitive functioning and thus, might have a reciprocal influence. Nonetheless, the two concepts are clearly distinct, with cognitive biases operating on the higher-level cognitive process of interpretation, which becomes systematically negatively distorted [Reference Gawęda, Prochwicz and Cella52], whereas basic symptoms represent qualitative distortions in lower-level cognitive processes, like attention or concentration [Reference Schultze-Lutter, Debbané, Theodoridou, Wood, Raballo and Michel4]. Finally, jumping to conclusions was the only cognitive bias for which severity was not associated with CHR-P-symptom expression. This aligns with indications that its influence might be specific to schizophrenia and active psychotic symptoms [Reference Livet, Navarri, Potvin and Conrod56, Reference Ahuir, Crosas, Estrada, Zabala, Pérez-Muñoz and González-Fernández102, Reference McLean, Mattiske and Balzan104, Reference Moritz, Scheunemann, Lüdtke, Westermann, Pfuhl and Balzan105]. Additionally, self-reporting on cognitive biases, and specifically on jumping to conclusions, might be skewed by factors like metacognitive awareness, which might lead community samples to report lower rates of jumping to conclusions (e.g., for reasons of social desirability) when compared to individuals with psychosis, whose metacognitive awareness might already be impaired. Overall, putting our results into perspective, previous research proposed that a general distorted thinking style (CBQp-sum-score) might be more clinically relevant than individual cognitive biases, for which evidence of distinct underlying distorted cognitive processes is inconsistent [Reference Livet, Navarri, Potvin and Conrod56, Reference Peters, Moritz, Schwannauer, Wiseman, Greenwood and Scott73, Reference Prochwicz, Kłosowska and Karpowska94, Reference Corral, Labad, Ochoa, Cabezas, Muntané and Valero95].
Psychopathology, functioning, and socio-demographics
In our analyses, current presence of more axis-I-diagnoses was associated with greater likelihood of CHR-P, per-CHR-P and nonper-CHR-P-symptoms, aligning with copious evidence of high comorbidity rates in CHR-P samples [Reference Fusar-Poli, Salazar de Pablo, Correll, Meyer-Lindenberg, Millan and Borgwardt18]. Further, lower socio-occupational functioning was associated with higher likelihood of nonper-CHR-P-symptoms, consistent with data on the close connection of especially non-perceptive UHR-symptoms with impaired functioning [Reference Schimmelmann, Michel, Martz-Irngartinger, Linder and Schultze-Lutter9, Reference Schultze-Lutter, Ruhrmann, Michel, Kindler, Schimmelmann and Schmidt10, Reference Michel, Ruhrmann, Schimmelmann, Klosterkötter and Schultze-Lutter17]. Moreover, findings of a significant link between age and overall CHR-P−/per-CHR-P-, but not nonper-CHR-P-, symptom severity are consistent with literature, but developmental implications cannot be drawn from our cross-sectional analyses [Reference Schimmelmann, Michel, Martz-Irngartinger, Linder and Schultze-Lutter9, Reference Schultze-Lutter, Ruhrmann, Michel, Kindler, Schimmelmann and Schmidt10]. Finally, the link between female sex and higher CHR-P-symptom severity joins inconclusive evidence about sex effects on CHR-P expression [Reference Schultze-Lutter, Schimmelmann, Flückiger and Michel5]. Thus, findings involving age and sex require further investigation in future studies.
Strengths and limitations
Next to the clear strengths of our study including the innovative focus on personality functioning in relation to CHR-P-symptoms and cognitive biases, and the large community sample, some limitations should be considered. As mentioned, no directionality can be inferred from our cross-sectional data, although, given the predominantly trait-like nature of cognitive biases and personality characteristics [Reference Andersen and Bienvenu29, Reference Cowan, Mittal and McAdams45], it seems plausible that they precede the state-like CHR-P-symptoms [Reference Michel, Flückiger, Kindler, Hubl, Kaess and Schultze-Lutter106]. Further, in our exploratory analysis, we included individual cognitive biases and personality functioning elements separately in the relevant models to avoid multicollinearity, favored by high correlations between the subscales; this, however, also prevented examination of their interplay. Moreover, while we partially corrected for this in the outcomes variables by choosing to employ ZIP models, the low levels of impairment and pathology in our sample may restrict generalizability to other populations, as statistical power to detect associations within these limited ranges may be reduced. Additionally, data on negative, general, and disorganization SIPS-symptom scales, which might add more context to our findings [Reference Gawęda, Prochwicz and Cella52], were not available to us, as assessments in the BEAR and BEARS-Kid studies focused on criteria-relevant UHR- and basic symptoms. Finally, as our sum-scores combine both basic symptoms and UHR-symptoms, the contributions of procedural versus content-related thought disorders are not discernible in our findings.
Conclusion and future directions
The present study offers initial evidence on the intricate associations between personality functioning, cognitive biases, and CHR-P-symptomatology. First, nuanced associations of personality functioning, particularly identity and self-direction, with nonper-CHR-P manifestations emerged, alongside first indications of their relevance beyond maladaptive traits or personality disorders. Second, consistent with previous clinical studies [Reference Livet, Navarri, Potvin and Conrod56], cognitive biases, and especially dichotomous thinking, emotional reasoning, and catastrophizing, arise as promising targets for future research on prevention through their association with CHR-P-symptoms likelihood and severity. Finally, our results support previous evidence on connections between nonper-CHR-P-symptoms and functioning impairment, as well as overall CHR-P expression and psychopathology [Reference Fusar-Poli, Salazar de Pablo, Correll, Meyer-Lindenberg, Millan and Borgwardt18]. Future longitudinal studies should test the associations in our findings and further investigate the complex interactions of personality pathology, psychosis risk, their related burden, and possible developmental implications, to extend our understanding of CHR-P-symptomatology.
Supplementary material
The supplementary material for this article can be found at http://doi.org/10.1192/j.eurpsy.2024.1812.
Data availability statement
Data can be made available on request via the corresponding author (C.M.).
Acknowledgments
We thank our colleague Ms. Madelyn Thomson (MSc) for the detailed and careful English language editing.
Financial support
The 10-year follow up of the BEAR and BEARS-Kid studies was supported by a project-funding grant from the Swiss National Science Foundation (C.M., grant number 32003B_197714).
Competing interest
Drs Lerch, Schultze-Lutter, Schmidt, Cavelti, Kaess and Michel, and Ms Rinaldi (MSc) have declared that they have no conflicts of interest in relation to the subject of this study.


 Open access
Comments
No Comments have been published for this article.