





1. Introduction
Humans often organise and classify information and objects into categories in a logical and structured way based on some shared characteristics or properties. This organisation simplifies the processes of understanding, retrieving and communicating ideas. Categorisation research is significant because it is a fundamental cognitive process that enables humans to perceive, organise and process information, ultimately making sense of the world. Moreover, categories are closely linked to concepts, especially in how we structure knowledge, comprehend the world and convey ideas. In general, categories can be viewed as concrete examples and expressions of concepts. Concepts tend to be more abstract, whereas categories represent a specific way of organising items according to those concepts. In other words, categories provide structure to concepts by offering concrete examples and subgroups, while concepts supply the criteria or attributes that determine how items are grouped into categories. Without concepts, categories would lack meaning or coherence; without categories, concepts would lack instantiation. Categories and concepts complement and reinforce each other. Thus, research on categorisation also sheds insights into human conceptualisation.
Categories have an internal structure. As suggested by Rosch and Mervis (Reference Rosch and Mervis1975), Rosch et al. (Reference Rosch, Mervis, Gray, Johnson and Boyes-Braem1976) and other researchers, categories can be organised into various hierarchical levels: superordinate, basic and subordinate. For example, ‘animal’ represents a superordinate category, ‘dog’ is a basic level category and ‘Labrador’ falls under the subordinate category. Each level varies in terms of abstraction and inclusiveness. Typically, the more inclusive a category is, the more abstract it becomes. Therefore, superordinate categories are the most abstract, while subordinate categories are the most concrete, with basic categories situated in between. Superordinate categories are highly abstract because they share only a few common attributes among their members and have a limited number of members that can be named. Basic level categories, on the other hand, represent tangible objects in the world and encompass an almost infinite number of instances. They convey the most information, have the highest category cue validity, and are the most distinct from one another. Consequently, the basic level serves as the primary level at which people categorise their environment, and it is the most general and inclusive in terms of capturing real-world relational structures. Categories below the basic level are subordinates, which are also collections of predictable attributes and functions, but add only a small amount of additional information compared to the basic level object they belong to.
In a different perspective, according to Rosch (Reference Rosch1975): 193–194), categories are not defined by rigid criterial features with sharp boundaries. Instead, items within a category can vary in how well they represent the category’s meaning. In other words, not all items within a category are equal in that some are better representatives, known as ‘good examples’, while others are less representative, or ‘bad examples’. In terms of prototypicality, those items that can best represent a category are the clearest cases, the best examples, such as apples or pears for the category of fruit. According to the Family Resemblance Hypothesis (Wittgenstein, Reference Wittgenstein1953), the most prototypical members of categories are those that share the most attributes with other members of the same category and have the fewest attributes in common with members of other categories. Conversely, items that do not have clear-cut boundaries between categories are the least representative examples or the worst examples. For example, a cherry tomato might be considered a fruit by some people but a vegetable by others. There are also items that fall between the best and worst examples, creating a continuum or gradient. Some of these items are closer to the prototypical members, while others are closer to the non-prototypical members. In terms of frequency, the best examples tend to occur most often, although the worst examples are not necessarily the least frequent.
Aphasia is a language disorder that is typically acquired as a result of brain damage, such as stroke, head tumours, injuries or infections that disrupt blood flow to certain areas of the brain (Cunningham & Haley, Reference Cunningham and Haley2020; Holland, Reference Holland2006; MacWhinney, Reference MacWhinney2019; Silkes et al., Reference Silkes, Fergadiotis, Hunting Pompon, Torrence and Kendall2019). Individuals with aphasia will experience difficulties in formulating, retrieving, or decoding the arbitrary symbols of language, which usually mature in adulthood. People with aphasia often struggle to perform tasks that involve categorisation (Vignolo, Reference Vignolo, Denes and Pizzamiglio1999). As a result, it is understandable that categorisation tasks have long been of great significance in the research of aphasia. One important question is whether the internal structure of categories is preserved for aphasia patients. To address this question, this study will examine the internal structure of categories in Chinese-speaking individuals with aphasia and compare it with that of healthy Chinese-speaking individuals.
2. Previous studies
So far, research on the internal structure of categories in people with aphasia has mainly focused on Western languages, especially English. For example, Goodglass and Baker (Reference Goodglass and Baker1976) found that English-speaking aphasic patients with naming disorders could still effectively perform superordinate classification tasks, which were relatively resistant to damage. In picture naming tasks, Zingeser and Berndt (Reference Zingeser and Berndt1988) found that aphasia patients exhibited significantly higher accuracy in naming basic-level objects compared with subordinate objects. When they failed to name subordinate objects, they often resorted to basic level names (e.g., saying ‘dog’ or ‘animal’ instead of ‘Labrador’). Crutch and Warrington (Reference Crutch and Warrington2008) conducted a series of spoken-word-picture matching tasks with four English-speaking patients who had left middle cerebral artery strokes. They found that these patients performed worse on superordinate categories compared to basic categories, and in turn worse on basic categories compared to subordinate categories. That is to say, stroke patients had the best performance on subordinate categories and the worst on superordinate categories, with basic categories in the middle. This indicates that the more abstract the category is, the poorer the performance of stroke patients tends to be. In contrast, healthy individuals showed a reliable superiority effect for basic level categories over either more general superordinate categories or more specific subordinate categories, with no significant difference between superordinate and subordinate categories. Raposo et al. (Reference Raposo, Mendes and Marques2012), however, found that aphasia patients, like healthy individuals, performed better on basic level concepts than on superordinate concepts, because they believed that basic level concepts are more concrete, while superordinate concepts are abstract.
Alternatively, some studies reveal that aphasia types play an important role in categorisation. For instance, Whitehouse et al. (Reference Whitehouse, Caramazza and Zurif1978) found that while English-speaking Broca aphasia patients had no difficulty with a categorisation task, those with anomic aphasia were substantially impaired. Other studies show that age, education and gender have a significant effect on categorisation. For example, Brucki and Rocha (Reference Brucki and Rocha2004) found that education had the greatest effect on the category fluency test for healthy Brazilian Portuguese-speaking adults; age also had an effect, but gender did not. Abdel Aziz et al. (Reference Abdel Aziz, Khater, Emara, Tawfik, Rasheedy, Mohammedin, Tolba, El-Gabry and Qassem2017) also revealed the effects of age and education on category fluency in healthy adult Arabic speakers in Egypt. Shirdel et al. (Reference Shirdel, Esmaeeli, Alavi, Ghaemmaghami and Shariat2022) found that in a semantic verbal fluency task among Iranian adults, age was negatively but education was positively correlated with the number of generated words, and females generated more words.
As to the underlying mechanism of the differences or failure in category production for aphasia patients, some studies (e.g., Caramazza & Shelton, Reference Caramazza and Shelton1998; Pham et al., Reference Pham, Castro and Lee2025; Warrington & Shallice, Reference Warrington and Shallice1984) argue for the damage to the stored conceptual knowledge itself. That is, the deficit lies in the conceptual system. Other studies (e.g., Crutch & Warrington, Reference Crutch and Warrington2008; Humphreys & Forde, Reference Humphreys and Forde2005; Jefferies et al., Reference Jefferies, Patterson and Ralph2008; Jefferies & Lambon Ralph, Reference Jefferies and Lambon Ralph2006; Thompson-Schill et al., Reference Thompson-Schill, Swick, Farah, D’Esposito, Kan and Knight1998) claim that category production fails not because knowledge is lost, but because patients cannot efficiently access, select, or inhibit semantic information under task demands. That is, the deficit does not lie in the conceptual system, but in the lexical access.
Based on the previous studies, this study aims to investigate the category internal structure in Chinese-speaking aphasia patients so as to add diversity and strength to the current research since Chinese is typologically distant from Western languages. In addition, this study may provide evidence for the underlying mechanism of the differences or failure in category production for aphasia patients from the perspective of Chinese speakers. Specifically, this study will address the following questions:
-
(1) What are the hierarchical features of the category production by Chinese-speaking people with aphasia?
-
(2) What are the prototypical features of the category production by Chinese-speaking people with aphasia?
-
(3) What are the roles of aphasia types, severity, education, age, gender, cognitive functions and working memory in the category production by Chinese-speaking people with aphasia?
3. Method
3.1. Participants
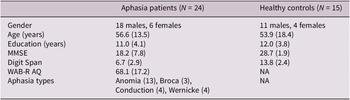
A total of 24 Chinese-speaking people with aphasia due to stroke or brain injury, thus the experimental group, and 15 healthy Chinese, thus the control group, participated in this study. The aphasia types, severity, years of education, age, gender, working memory and cognitive functions of the patients as well as the years of education, age, gender, working memory and cognitive functions of the control group are presented in Table 1.
Demographic and neuropsychological characteristics of the participants

Table 1. Long description
Starting from the top row, the table compares aphasia patients (N equals 24) and healthy controls (N equals 15). Gender: aphasia patients have 18 males and 6 females, healthy controls have 11 males and 4 females. Age in years: aphasia patients average 56.6 with S D 13.5, healthy controls average 53.9 with S D 18.4. Education in years: aphasia patients average 11.0 with S D 4.1, healthy controls average 12.0 with S D 3.8. MMSE: aphasia patients average 18.2 with S D 7.8, healthy controls average 28.7 with S D 1.9. Digit Span: aphasia patients average 6.7 with S D 2.9, healthy controls average 13.8 with S D 2.4. W A B dash R A Q: aphasia patients average 68.1 with S D 17.2, healthy controls are marked N A. Aphasia types for patients: Anomia (13), Broca (3), Conduction (4), Wernicke (4); healthy controls are marked N A. Numbers in brackets represent standard deviation.
Note: the numbers in the brackets for age, education, MMSE, Digit Span and WAB-R AQ are SD.
As shown in Table 1, the aphasia patients in this study include 18 males and 6 females; the healthy controls include 11 males and 4 females. The average age is 56.5 with a range between 29 and 78 for the patients, 53.9 with a range between 26 and 78 for the healthy controls. The average years of education are 11, with a range between 3 and 17 for the patients, and 12, with a range between 5 and 18 for the healthy controls. Independent T-test shows no significant difference in age (t = .531, p = .599) and education (t = .839, p = .407) between these two groups. As for the cognitive functions, the average score of MMSE is 21.1 for patients with a range between 14 and 30, and 28.7 for controls with a range between 28 and 30. As for the working memory, the average score of the Digit Span test is 6.7 for patients with a range between 3 and 13, and 13.8 for controls with a range between 12 and 17. Independent T-tests show significant differences between these two groups (MMSE, t = 5.107, p < .001; Digit Span, t = 7.997, p < .001). The average score of the Chinese version of WAB-R is 68.1 for patients with a range between 40.6 and 90.6. Finally, 24 aphasia patients include 13 anomia, 4 conduction, 4 Wernicke and 3 Broca.
3.2. Instruments
The present study adopted the semantic verbal fluency task as the main task in which participants were given 1 minute to produce as many relevant words as possible for each of the five categories (fruit, vegetable, animal, furniture and vehicle). This task aims to examine the participants’ category fluency (also called semantic fluency), which involves lexical retrieval, working memory, production, cognitive flexibility (Diamond, Reference Diamond2013), speed of processing (Bryan et al., Reference Bryan, Luszcz and Crawford1997) and needs sustained attention and inhibition and so forth According to Shao et al. (Reference Shao, Janse, Visser and Meyer2014, p. 2), to perform the semantic verbal fluency task, participants must keep the instructions and the earlier responses in working memory, suppress irrelevant responses and repetition. Moreover, participants often produce sets of related words in succession, which involves the ability to create clusters based on a systematic memory search and the ability to alter the search criteria and switch from one category to the next. The semantic verbal fluency task is also called the category listing task, which resembles everyday production tasks like making a shopping list, so that participants may exploit existing links between related concepts to retrieve responses.
Except for the semantic verbal fluency task, the Chinese version WAB-R (Kertesz, Reference Kertesz2006) was used to evaluate patients’ aphasia types and severity, the Chinese version of MMSE (Folstein et al., Reference Folstein, Folstein and McHugh1975) was used to examine the cognitive functions of both the patients and the healthy controls, and the Digit Span forward and backward task was used to examine the working memory of both the patients and the healthy controls.
3.3. Procedure
All participants in this study first signed a written informed consent that was approved by the School’s ethics committee. Then, basic demographic and clinical information was obtained from the participants through a structured interview. Digit Span, MMSE and the semantic verbal fluency task were carried out subsequently. To complete all these tasks, it took about 20 minutes for the healthy controls and about 30 minutes for the patients. The participants were allowed to have a break after completing a task if they needed. The Chinese version of WAB-R was taken only by aphasia patients on another day. It took them 35–50 minutes to complete the first four sectionsFootnote 1. The whole process was recorded.
3.4. Coding and data analysis
All the responses of the category production task were transcribed from the recordings first. Among the responses, repetitions, illegible responses or self-corrections were excluded. If the responses do not fall within the category, they were regarded as incorrect responses. For the correct responses, frequencies of the type and token, as well as hierarchical levels, were calculated. Variations of the same thing were regarded as the same type, such as fanqie and xihongshi, both referring to tomato.
All coding and scoring were performed by the first author, and the second author performed the reliability checks for all the data. The point-by-point interrater agreement was 98.3%, and disagreements were resolved by discussing the scoring definitions between them.
T-tests, ANOVA and correlation analyses were run based on the number of correct responses in the category fluency task so as to provide reliable conclusions.
4. Results
First of all, correct and incorrect responses of the semantic verbal fluency task are presented in Table 2, so as to see whether the participants correctly understand the five superordinate concepts.
Correct and incorrect responses of category fluency
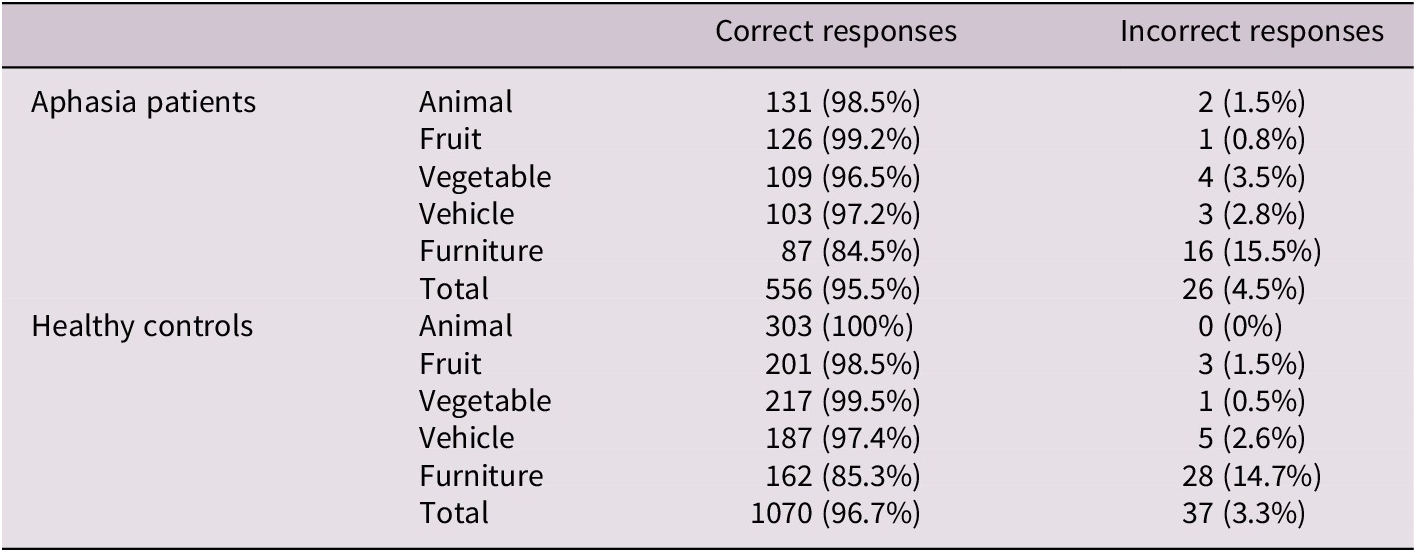
Table 2. Long description
From top to bottom, the table is divided into two main groups: aphasia patients and healthy controls. Each group contains six rows for semantic categories: animal, fruit, vegetable, vehicle, furniture, and total. For aphasia patients, correct responses are: animal 131 (98.5 percent), fruit 126 (99.2 percent), vegetable 109 (96.5 percent), vehicle 103 (97.2 percent), furniture 87 (84.5 percent), total 556 (95.5 percent). Incorrect responses are: animal 2 (1.5 percent), fruit 1 (0.8 percent), vegetable 4 (3.5 percent), vehicle 3 (2.8 percent), furniture 16 (15.5 percent), total 26 (4.5 percent). For healthy controls, correct responses are: animal 303 (100 percent), fruit 201 (98.5 percent), vegetable 217 (99.5 percent), vehicle 187 (97.4 percent), furniture 162 (85.3 percent), total 1070 (96.7 percent). Incorrect responses are: animal 0 (0 percent), fruit 3 (1.5 percent), vegetable 1 (0.5 percent), vehicle 5 (2.6 percent), furniture 28 (14.7 percent), total 37 (3.3 percent). Correct response rates are highest for animal and lowest for furniture in both groups. Incorrect responses are most frequent in the furniture category.
As shown in Table 2, the total correct responses account for 96.7% for the healthy controls and 95.5% for the patients. While quite a few of the participants gave incorrect responses for the categories of animal, fruit, vegetable and vehicle, some participants gave incorrect responses for the category of furniture. To be specific, both the patients and the healthy controls produced a few responses to household electrical appliances or door, window, which suggests that furniture is not a very clear concept for Chinese people. The results above show a very similar pattern of category production for the patients and healthy controls. Individual analysis further shows that all the healthy controls made responses for all five categories, while six patients did not make responses for furniture, four patients did not for vegetable, three patients did not for animal and three patients did not for vehicle. Among them, only two patients did not make any responses for three categories and two patients did not make any responses for two categories. This suggests that not only the healthy controls but also the patients in this study understood almost all the categories, although they may make mistakes in responses or did not make responses for some categories.
As for frequency, healthy controls produced many more correct responses than the patients in the same time limit. The total number of the correct responses is 1070 with an average of 71.3 for healthy controls, and 556 with an average of 23.2 for the patients. Such a big difference reveals the impact of the patients’ language impairment on the category production. Among the five categories, both the patients and the healthy controls produced the most correct responses for animal, then for fruit and vegetable, the fewest for vehicle and furniture, again showing a similar pattern of category production.
Then, the hierarchical responses for the five categories are presented in Table 3 to answer the first research question.
Hierarchical features of category production
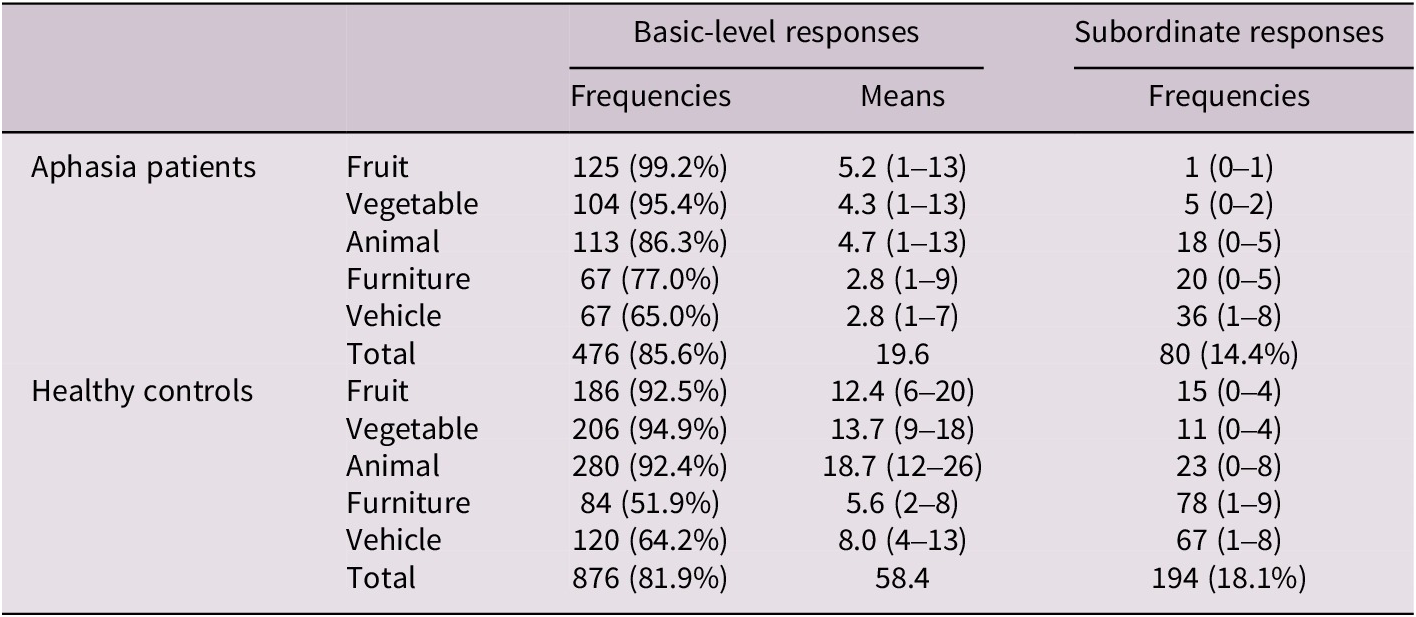
Table 3. Long description
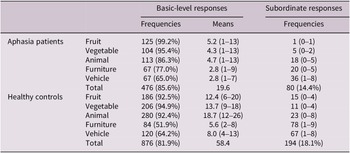
The table is divided into two main groups: aphasia patients and healthy controls. For aphasia patients, fruit has 125 basic-level responses (99.2 percent), mean 5.2 (range 1–13), and 1 subordinate response (range 0–1). Vegetable has 104 basic-level responses (95.4 percent), mean 4.3 (range 1–13), and 5 subordinate responses (range 0–2). Animal has 113 basic-level responses (86.3 percent), mean 4.7 (range 1–13), and 18 subordinate responses (range 0–5). Furniture has 67 basic-level responses (77.0 percent), mean 2.8 (range 1–9), and 20 subordinate responses (range 0–5). Vehicle has 67 basic-level responses (65.0 percent), mean 2.8 (range 1–7), and 36 subordinate responses (range 1–8). The total for aphasia patients is 476 basic-level responses (85.6 percent), mean 19.6, and 80 subordinate responses (14.4 percent). For healthy controls, fruit has 186 basic-level responses (92.5 percent), mean 12.4 (range 6–20), and 15 subordinate responses (range 0–4). Vegetable has 206 basic-level responses (94.9 percent), mean 13.7 (range 9–18), and 11 subordinate responses (range 0–4). Animal has 280 basic-level responses (92.4 percent), mean 18.7 (range 12–26), and 23 subordinate responses (range 0–8). Furniture has 84 basic-level responses (51.9 percent), mean 5.6 (range 2–8), and 78 subordinate responses (range 1–9). Vehicle has 120 basic-level responses (64.2 percent), mean 8.0 (range 4–13), and 67 subordinate responses (range 1–8). The total for healthy controls is 876 basic-level responses (81.9 percent), mean 58.4, and 194 subordinate responses (18.1 percent). Brackets in basic-level response frequencies indicate percentages, brackets in basic-level response means indicate ranges, and brackets in subordinate response frequencies indicate ranges.
Note: The brackets in the column of basic level response frequencies list their percentages of the total responses; the brackets in the column of basic level response means list their ranges and the brackets in the column of subordinate response frequencies list their ranges.
As shown in Table 3, the basic level responses account for 85.6% for the patients and 81.9% for the healthy controls, suggesting that the internal structure of categories is similar for the patients and healthy people, and basic level as well as subordinate concepts are preserved well for the patients. In terms of response number, the patients could produce only about half of the responses compared with the healthy controls, showing lower and impaired category listing ability for the patients.
Table 3 also reveals that the patients and the healthy controls generally produced basic level responses at much higher rates than subordinate responses, showing a striking asymmetry between basic level and subordinate responses. Differences among categories can also be found in that participants made basic level responses for fruit, vegetable and animal at much higher rates than subordinate responses, but the rates of basic level responses decreased significantly for furniture and vehicle. Repeated measures ANOVA shows significant differences in the production of basic level responses among the five categories (F = 9.257, p < .001). Pair-wise comparisons show significant differences between furniture and fruit, vegetable, animal as well as between vehicle and fruit, vegetable, animal (p < .05), no significant difference between furniture and vehicle (p > .05). This indicates that, for one thing, categories possess their own properties, and for another, patients still preserve similar categorisation ability to healthy people despite their slower and fewer responses.
In addition, individual analysis shows three striking features of the participants’ responses. One is that initial responses were mostly basic-level and subordinate responses emerged generally at the later stage. Another is that clusters of basic-level or subordinate responses often appeared, such as huoche (train), qiche (oil automobile), dianche (electric automobile) and motuoche (motorcycle). The third is that some participants produced a few subordinate responses immediately after their basic level responses. For instance, xiaoqiche (car), gongjiaoche (bus), jipuche (jeep) and SUV were produced immediately after qiche (oil automobile). These features show that categories have their internal structure and aphasia patients still preserve the hierarchical internal structure of categories.
Subsequently, the frequencies of the top 10Footnote 2 correct responses for each category are presented in Table 4 to examine the prototypicality features of the category production and to answer the second research question.
Prototypicality features of category production

Table 4. Long description
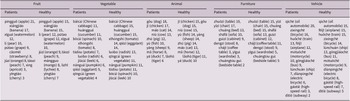
From left to right, the table columns are Fruit, Vegetable, Animal, Furniture, and Vehicle. Each category is divided into Patients and Healthy subcolumns. For Fruit, Patients: apple 21, banana 17, watermelon 12, pear 10, grape 9, strawberry 8, orange 8, peach 7, apricot 3, cherry 3. Healthy: apple 15, banana 15, pear 12, grape 12, watermelon 10, orange 9, peach 9, mango 8, lychee 8, cherry 7. For Vegetable, Patients: Chinese cabbage 11, cucumber 11, spinach 10, tomato 8, potato 7, radish 6, leek 6, pumpkin 6, eggplant 5, green vegetable 4. Healthy: Chinese cabbage 15, cucumber 15, tomato 14, eggplant 14, radish 13, green vegetable 11, pumpkin 11, potato 11, spinach 10, leek 10. For Animal, Patients: dog 18, chicken 17, cat 14, cow 13, pig 12, fish 10, sheep 9, horse 8, duck 7, tiger 6. Healthy: chicken 15, dog 15, cow 15, fish 14, sheep 14, pig 14, cat 13, horse 12, tiger 11, duck 10. For Furniture, Patients: table 19, chair 17, bed 13, sofa 10, cabinet 9, stool 8, coffee table 3, wardrobe 3, bedside table 2. Healthy: table 15, chair 15, bed 15, sofa 13, cabinet 12, coffee table 11, stool 9, wardrobe 5, bedside table 5. For Vehicle, Patients: oil automobile 20, bicycle 16, train 13, airplane 12, motorcycle 10, bus 9, ship 7, electric bicycle 6, high-speed rail 3, subway 2. Healthy: oil automobile 15, airplane 15, train 15, bicycle 14, ship 13, bus 11, motorcycle 9, electric bicycle 8, high-speed rail 7, subway 5. Each cell lists the top ten items per group and category, with frequencies in descending order.
Table 4 shows that the top 10 correct responses made by the patients and healthy controls are almost the same, although some of their frequency orders may be different. For the categories of vegetable, animal, furniture and vehicle, the top 10 correct responses are exactly the same. Only for the category of fruit, two of the top 10 correct responses are different between the patients and healthy controls. This indicates that the patients demonstrated similar prototypicality features of category production to the healthy controls. The difference mainly lies in the lower frequencies of the second half of the top correct responses for the patients compared with the healthy controls, in that the patients could produce as many correct responses as the controls for the first several correct responses, but produced fewer correct responses for the last several correct responses. For instance, the patients produced 18 gǒu (dog), 17 jī (chicken) and 14 māo (cat) for the category of Animal, while the controls produced 15 gǒu, 15 jī and 13 māo. However, the patients produced only 8 mǎ (horse), 7 yā (duck) and 6 lǎohǔ (tiger), the controls produced 12 mǎ (horse), 10 yā (duck) and 11 lǎohǔ (tiger).
Finally, correlation analyses were calculated between education, age, gender, cognitive functions, working memory and category production for all the participants to answer the third research question. Correlation analyses were also calculated between aphasia types, severity and category production for the patients.
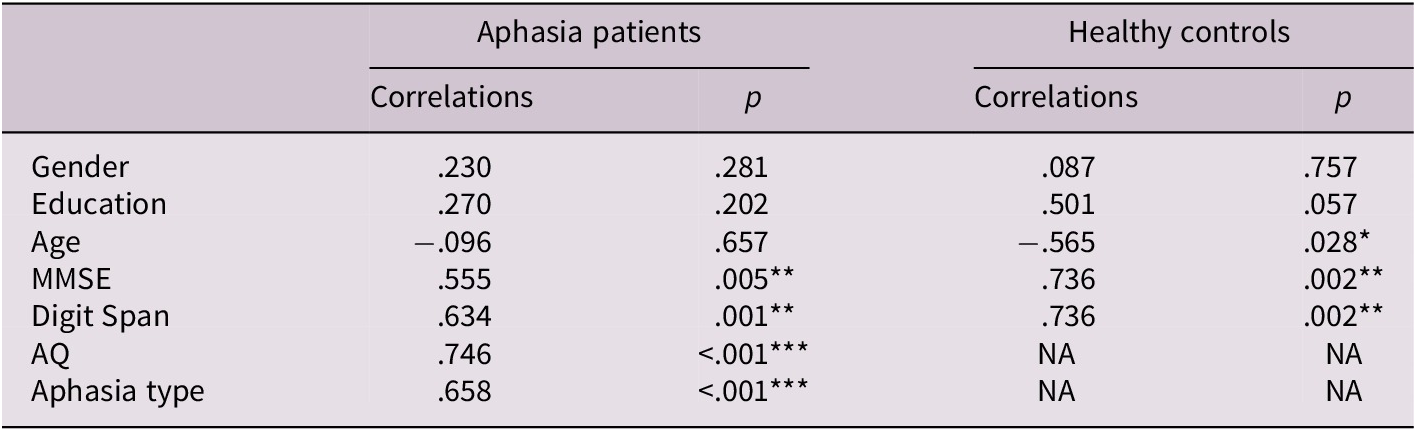
As shown in Table 5, gender and education did not significantly affect category production for both the patients and the healthy controls, but cognitive functions and working memory significantly affected category production for both the patients and the healthy controls. That is, the participants with better cognitive functions and working memory produced more correct responses. Age significantly affected category production for the healthy controls, with younger people producing more correct responses, but not for the patients. AQ and aphasia type significantly affected category production for the patients as well. Patients with higher AQ produced more correct responses. Detailed analysis shows that different types of aphasia patients performed very differently in the semantic verbal fluency task. To be specific, anomia patients performed the best with an average of 30.5 correct responses, Wernicke patients performed the worst with an average of 6.8 correct responses only and did not produce any response for at least two categories, while Broca and conduction patients performed in between with an average of 24.3 and 15.8 correct responses respectively. One-way ANOVA shows a significant difference in the number of correct responses among four aphasia types (F = 4.272, p = .017). Pair-wise comparisons show a significant difference only between anomia and Wernicke patients (p = .003), but no significant differences between any other two groups (p > .05).
Correlations between demographic, clinical factors and category production

Table 5. Long description
The table has seven rows for factors: Gender, Education, Age, M M S E, Digit Span, A Q, and Aphasia type. For each, values are given for aphasia patients and healthy controls, with columns for correlation and p value. For Gender, aphasia patients show correlation point two three zero and p point two eight one; healthy controls, point zero eight seven and p point seven five seven. For Education, aphasia patients: correlation point two seven zero, p point two zero two; healthy controls: point five zero one, p point zero five seven. For Age, aphasia patients: negative point zero nine six, p point six five seven; healthy controls: negative point five six five, p point zero two eight with a single asterisk. For M M S E, aphasia patients: point five five five, p point zero zero five with two asterisks; healthy controls: point seven three six, p point zero zero two with two asterisks. For Digit Span, aphasia patients: point six three four, p point zero zero one with two asterisks; healthy controls: point seven three six, p point zero zero two with two asterisks. For A Q, aphasia patients: point seven four six, p less than point zero zero one with three asterisks; healthy controls: N A for both columns. For Aphasia type, aphasia patients: point six five eight, p less than point zero zero one with three asterisks; healthy controls: N A for both columns. Asterisks indicate significance levels.
5. Discussion
The present study reveals that aphasia patients showed a very similar pattern in category production to healthy controls, and that the patients rarely made incorrect responses, just like healthy controls. This suggests that the patients’ conceptual system is not impaired and they still preserve the internal structure of the categories. But results also show that the healthy controls produced many more correct responses than the patients, revealing the patients’ impairment in category production. In this section, we compare this study with previous ones and discuss the implications of the findings in this study.
5.1. Hierarchical features of the category production
The present study shows that the basic level responses accounted for 85.6% for the patients and 81.9% for the healthy controls. Such results suggest that, for one thing, the patients possess a similar internal structure of categories to the healthy people, and for another, the patients performed better on basic-level concepts than subordinate concepts, just like the healthy controls. Such a finding is consistent with Zingeser and Berndt (Reference Zingeser and Berndt1988), but partly consistent with Crutch and Warrington (Reference Crutch and Warrington2008), who found that healthy individuals performed better on basic level categories over more specific subordinate categories, but aphasia patients performed better on subordinate concepts than on basic level concepts.
Then, why did aphasia patients and healthy individuals produce many more basic-level responses than subordinate responses? First, basic level objects are the most common to people, convey the most information and have higher frequency, while subordinate concepts are not so common, even strange to some people. For instance, everybody is familiar with dogs, a basic level concept, but it is hard to know different kinds of dogs, subordinate concepts, if he does not learn about dogs. As a result, basic level objects have high category cue validity, their activation threshold is lower, and they are easier to activate when retrieved from memory (Levelt, Reference Levelt1989). Second, subordinate objects have additional information compared to basic level objects, and more information retrieval is required for successful production. Consequently, the correct responses of subordinate objects are more difficult and require more cognitive resources than basic-level objects. Third, basic-level categories represent tangible objects in the world and serve as the primary level at which people categorise their environment. Consequently, the basic level objects have higher imageability than the subordinate objects, and are easier to be activated and retrieved. And finally, basic-level objects are generally acquired earlier than subordinate objects (Rosch et al., Reference Rosch, Mervis, Gray, Johnson and Boyes-Braem1976), and thus more likely to be spared according to the Regression Hypothesis proposed by Jakobson (Jakobson, Reference Jakobson1968, p. 78) that aphasic losses reproduce the sequence of acquisition in child language in inverse order.
5.2. Prototypicality features of the category production
Surprisingly, the top 10 correct responses made for each category by the patients and healthy controls in this study are almost the same, although their frequency orders are not always the same. Thus, the aphasia patients demonstrated a similar pattern to the healthy controls in category production in terms of the best examples of categories or the prototypicality features. Such a finding suggests that, for one thing, aphasia patients’ conceptual system is not impaired, and that, for another, aphasia patients have a similar internal structure of categories to healthy people.
Another important feature for prototypicality in the category production in this study is that the frequencies for the second half of the top 10 responses are lower for the aphasia patients. This shows that aphasia patients’ production ability is impaired, although they demonstrated a similar pattern and category internal structure to healthy people. It is likely that aphasia patients have problems with lexical access to their conceptual system since they all could produce correct responses, just as Humphreys and Forde (Reference Humphreys and Forde2005), Jefferies and Lambon Ralph (Reference Jefferies and Lambon Ralph2006), Crutch and Warrington (Reference Crutch and Warrington2008) and Jefferies et al. (Reference Jefferies, Patterson and Ralph2008) found. That is, the patients’ problems mainly lie in a disruption to processes mediating conceptual knowledge rather than a loss of conceptual knowledge per se.
5.3. Contributing factors in the category production
The effects of the sociodemographic factors (i.e., age, education and gender) in this study are similar to previous studies for healthy people. First, like in Brucki and Rocha (Reference Brucki and Rocha2004), Lozano and Ostrosky-Solis (Reference Lozano and Ostrosky-Solis2006), Peña-Casanova et al. (Reference Peña-Casanova, Quiñones-Úbeda, Gramunt-Fombuena, Quintana-Aparicio, Aguilar, Badenes, Cerulla, Molinuevo, Ruiz, Robles, Barquero, Antúnez, Martínez-Parra, Frank-García, Fernández, Alfonso, Sol and Blesa2009), Contador et al. (Reference Contador, Almondes, Fernández-Calvo, Boycheva, Puertas-Martín, Benito-León and Bermejo-Pareja2016), Abdel Aziz et al. (Reference Abdel Aziz, Khater, Emara, Tawfik, Rasheedy, Mohammedin, Tolba, El-Gabry and Qassem2017) and Shirdel et al. (Reference Shirdel, Esmaeeli, Alavi, Ghaemmaghami and Shariat2022), older adults made fewer correct responses in the category production in this study. Second, education played a marginal role in category production in this study, and most of the previous studies (e.g., Abdel Aziz et al., Reference Abdel Aziz, Khater, Emara, Tawfik, Rasheedy, Mohammedin, Tolba, El-Gabry and Qassem2017; Benito-Cuadrado et al., Reference Benito-Cuadrado, Esteba-Castillo, Böhm, Cejudo-Bolívar and Peña-Casanova2002; Brucki & Rocha, Reference Brucki and Rocha2004; Olabarrieta-Landa et al., Reference Olabarrieta-Landa, Rivera, Galarza-del-Angel, Garza, Saracho, Rodríguez, Chávez-Oliveros, Rábago, Leibach, Schebela, Martínez, Luna, Longoni, Ocampo-Barba, Rodríguez, Aliaga, Esenarro, García de la Cadena, Perrin and Arango-Lasprilla2015; Ostrosky-Solis et al., Reference Ostrosky-Solis, Gutierrez, Flores and Ardila2007; Shirdel et al., Reference Shirdel, Esmaeeli, Alavi, Ghaemmaghami and Shariat2022) revealed that more years of education performed better on semantic verbal fluency tasks. The difference could be due to the small sample of the healthy controls in this study. Finally, there was no difference in the category production in this study between males and females in general, as in Brucki and Rocha (Reference Brucki and Rocha2004), Laws (Reference Laws2004), Sokołowski et al. (Reference Sokołowski, Tyburski, Sołtys and Karabanowicz2020), Lubrini et al. (Reference Lubrini, Periáñez, Laseca-Zaballa, Bernabéu-Brotons and Ríos-Lago2022) and Hirnstein et al. (Reference Hirnstein, Stuebs, Moè and Hausmann2023). Scrutiny of the data shows that healthy females made a few more correct responses only for fruit and vegetables than males in this study; no significant differences were found for the other three categories. Likely, Shirdel et al. (Reference Shirdel, Esmaeeli, Alavi, Ghaemmaghami and Shariat2022) found that Iranian adult females generated more words in the semantic verbal fluency task. Such a finding shows that there is no overall female advantage in semantic fluency and that gender differences are category-dependent (e.g., Laws, Reference Laws2004; Sokołowski et al., Reference Sokołowski, Tyburski, Sołtys and Karabanowicz2020).
Different from the healthy controls, the sociodemographic factors did not play a significant role in the category production for aphasia patients in this study. Instead, aphasia severity and type significantly affected their performance on the semantic verbal fluency task. The more severe an aphasia patient was, the fewer correct responses he or she would produce. As for the aphasia type, anomia patients produced more correct responses, conduction and Broca patients followed and Wernicke patients produced the least correct responses. In fact, in this study, most of the anomia patients were mild, most of the Wernicke patients were severe and most of the conduction and Broca patients were moderate. That is to say, the effect of aphasia type is likely to be realised via aphasia severity. In addition, cognitive functions and working memory both had a strong effect on the category production for the patients and healthy controls. This is predictable since the semantic verbal fluency task relies on many kinds of cognitive abilities and working memory (Diamond, Reference Diamond2013; Shao et al., Reference Shao, Janse, Visser and Meyer2014).
5.4. Clinical implications
The category fluency task is often adopted clinically to detect cognitive impairment in post-stroke and neurodegenerative diseases (Henry & Crawford, Reference Henry and Crawford2004), for it is quick and easy to administer and rate. For one thing, the quantity of correct responses in the category fluency task may reflect patients’ semantic impairment, which can be used to differentiate different types of aphasia. For example, in this study, anomia patients produced the most correct responses, while Wernicke patients produced the least correct responses. For another, the quantity of correct responses in the category fluency task may reflect patients’ executive function since the number of correct responses is highly correlated with the scores of Digit Span and MMSE for the patients. We may also analyse other indicators like reaction time of first response, correct responses every 15 or 20 seconds, clusters or switches in future research. These indicators may further reflect the patients’ lexical and executive impairments.
6. Conclusion
Based on a semantic verbal fluency task, this study investigated the category internal structure in Chinese-speaking people with aphasia. It was found that the aphasia patients had a similar category internal structure to the healthy controls. To be specific, the patients produced basic-level and subordinate concepts at a similar rate to healthy controls and the top 10 correct responses made by the patients and healthy controls were almost the same. In addition, the sociodemographic factors like age, education and gender did not play a significant role in the category production for the patients, but aphasia severity, type, cognitive functions and working memory strongly affected their category production. On the other hand, this study shows that the patients’ conceptual system was intact since they produced correct responses at a very high rate, like healthy controls, and their differences mainly lay in quantity. This suggests that aphasia patients may have problems with lexical access to their conceptual system.
In this study, we only examined the participants’ linguistic behaviours and their contributing factors; it is necessary to investigate the connections between the patients’ category production and cerebral lesion in future research. It has been found that semantic verbal fluency tasks are mediated predominantly by the temporal lobes (Baldo et al., Reference Baldo, Schwartz, Wilkins and Dronkers2006; Birn et al., Reference Birn, Kenworthy, Case, Caravella, Jones, Bandettini and Martin2010; Gourovitch et al., Reference Gourovitch, Kirkby, Goldberg, Weinberger, Gold, Esposito, Van Horn and Berman2000; Grogan et al., Reference Grogan, Green, Ali, Crinion and Price2009; Henry & Crawford, Reference Henry and Crawford2004). The role of the hippocampus in semantic verbal fluency tasks has also been well established (Maguire & Frith, Reference Maguire and Frith2004; Ryan et al., Reference Ryan, Lin, Ketcham and Nadel2010). Likewise, semantic verbal fluency tasks are routinely used as a potential diagnosis of mild cognitive impairment in clinical practice (Albert et al., Reference Albert, DeKosky, Dickson, Dubois, Feldman, Fox, Gamst, Holtzman, Jagust, Petersen, Snyder, Carrillo, Thies and Phelps2011; Litvan et al., Reference Litvan, Goldman, Tröster, Schmand, Weintraub, Petersen, Mollenhauer, Adler, Marder, Williams-Gray, Aarsland, Kulisevsky, Rodriguez-Oroz, Burn, Barker and Emre2012). It is also necessary to investigate the differences in category production between Chinese people with mild cognitive impairment and healthy Chinese people in future research, so as to find out the markers to distinguish people with mild cognitive impairment.
Author contribution
H.C. developed the study idea, supervised the research design, paid the participants, checked the data and revised the manuscript. M.H. designed and carried out the study, conducted the data analysis, and wrote and revised the manuscript.
Funding statement
This study was supported by the key project of the 2025 annual plan under the 14th Five-Year Plan for National Language and Character Research established by the Ministry of Education and the National Language Committee. The title of the project is Conceptual System Impairment in Chinese Aphasic Patients and Development of Intelligent Assessment Tools (No. ZDI145-160). This study was also supported by the Shanghai Jiao Tong University 2026 Liberal Arts Young Talents Cultivation Program Project (2026QN024).
Competing interests
We have no conflicts of interest to report.

 Open access

