


CVD in the UK account for approximately 170 000 deaths per year(1). CVD prevalence is higher in males when compared with pre-menopausal women(Reference Mendelsohn and Karas2). However, it has been observed that in post-menopausal women (45–54 years), CVD prevalence is higher than men(3). Differential patterns have been observed for CVD risk factors between men and women. Evidence suggests that the type 2 diabetic phenotype is associated with a 50 % higher relative risk of CVD amongst women compared with men(Reference Huxley, Barzi and Woodward4). Prospective cohort studies have suggested that non-fasting blood TAG is a significant CVD risk factor with an approximately 2-fold greater predictive ability in women v. men(Reference Bansal, Buring and Rifai5,Reference Nordestgaard, Benn and Schnohr6) . A recent review highlighted these sex disparities and recommended the need for a targeted approach in understanding the biological differences in CVD risk in women(Reference Sharma and Wood7).
Modifying exposure to lifestyle factors reduces CVD risk factors and represents the primary route to prevent CVD outcomes. Diet is a key modifiable lifestyle factor in the aetiology of CVD(Reference Iqbal, Anand and Ounpuu8). Traditionally, research in this area has focused on individual macronutrients, such as fats and carbohydrates. However, we consume a mixture of foods rather than single nutrients. In recent years, nutritional science has shifted from reductionist approach of single nutrients towards investigation of combinations of foods and nutrients(Reference Hu9). The combinations of foods consumed may, in part, be responsible for health effects through nutrient–nutrient interactions.
Combinations of foods defined a priori (referred as dietary ‘patterns’) are increasingly reported in nutritional epidemiological literature in relation to CVD outcomes(Reference Aljuraiban, Gibson and Oude Griep10). Dietary patterns such as the Mediterranean and the Dietary Approaches to Stop Hypertension (DASH) diet have been adopted into public health recommendations in the USA(11). It has been suggested that basing nutrition guidelines around dietary patterns may be more readily translatable by the public(Reference Cespedes and Hu12). To date, UK public health dietary guidelines do not include any dietary pattern recommendations.
Although improved eating patterns may have important effects on reducing population-wide markers of CVD risk, the evidence supporting the population-wide efficacy of applying dietary pattern guidelines is limited. A recent review found thirty-one different scores applied in nutritional epidemiological studies testing associations between diet patterns and CVD-related outcomes(Reference Aljuraiban, Gibson and Oude Griep10). From the nine most commonly applied scores, four had been applied in UK population groups and most studies testing associations of one or two scores against a limited range of CVD health outcomes(Reference Waijers, Feskens and Ocke13). Simultaneously testing a set of dietary patterns against a standard set of CVD risk markers will inform candidate dietary patterns to be taken forward for testing in clinical trials.
The main aim of this study is to investigate the relationship between nine main dietary indices(Reference Aljuraiban, Gibson and Oude Griep10) and a comprehensive range of CVD risk factors including: estimated atherosclerotic CVD (ASCVD) risk, anthropometric (BMI and visceral fat (VF)), lipid profile (TAG, LDL, HDL, total cholesterol), vascular function (pulse wave velocity, blood pressure) and glucose metabolism (insulin, glucose and homoeostasis model assessment of insulin resistance (HOMA2-IR)). From our primary analyses, we identified the most favourable dietary pattern to take forward for post hoc analyses to investigate dose–response associations and to investigate if any observed associations between dietary patterns and health outcomes are independent of any individual food group included within the dietary pattern.
Methods
Study population
All individuals included in this study are part of the UK Adult Twin Register (TwinsUK). TwinsUK is a large cohort of twins historically developed to study the heritability and genetics of diseases with a higher prevalence among women(Reference Verdi, Abbasian and Bowyer14). In this study, we included a total of 2590 female individuals, with an average age of 58·1 (sd 10·2) years. All participants had complete food frequency data and at least one cardiometabolic measurement of interest collected between 2004 and 2010. Although dietary patterns, in particular in woman, are mostly consistent from childhood to adulthood(Reference Movassagh, Baxter-Jones and Kontulainen15), clinical and biochemical measures included in the analysis were selected to be on average within 2·65 (sd 1·52) years from the diet assessment. A detailed flow chart is described in online Supplementary Fig. S1. TwinsUK is approved by NRES Committee London–Westminster (REC ref: EC04/015), and all participants provided informed written consent.
Dietary assessment and dietary score generation
All participants completed a 131-item FFQ that has been previously validated against pre-nutrient biomarkers in the European Prospective Investigation into Diet and Cancer Norfolk(Reference Bingham, Gill and Welch16,Reference Bingham, Welch and McTaggart17) . The questionnaire captures average intakes in the past year. Nutrient and energy intakes were determined by FETA (Food Frequency Questionnaire European Prospective Investigation into Cancer and Nutrition Tool for Analysis) software(Reference Mulligan, Luben and Bhaniani18). Subjects were excluded from the analysis if more than ten food items were left unanswered in their FFQ or if the total energy intake was more than two sd outside the estimated BMR(Reference Pallister, Haller and Thorand19) (determined by the Harris-Benedict equation(Reference Frankenfield, Muth and Rowe20)).
The full list of FFQ items included to define food group categories for dietary score calculation is reported in online Supplementary Table S1.
The selection of diet indices included in this study is based on Aljuraiban et al.(Reference Aljuraiban, Gibson and Oude Griep10) (Table 1 and online Supplementary Tables S2–S10) and reflects the nine most frequently reported diet indices reported against CVD risk. We selected nine dietary indices: Alternative Healthy Eating Index (HEI)(Reference Chiuve, Fung and Rimm21), Amended Mediterranean Score (A-Med)(Reference Fung, McCullough and Newby22), Dietary Approaches to Stop Hypertension (DASH)(Reference Fung, Chiuve and McCullough23), Diet Quality Index International(Reference Huijbregts, Feskens and Räsänen24), Dietary Reference Values (DRV)(Reference Eriksen, Gibson and Lamb25), Healthy Diet Indicator (HDI)(Reference Berentzen, Beulens and Hoevenaar-Blom26), Healthy Eating Index 2010 (HEI)(Reference Guenther, Casavale and Reedy27), Nordic Diet Score(Reference Galbete, Kröger and Jannasch28) and the Original Mediterranean Score (O-Med)(Reference Trichopoulou, Costacou and Bamia29). All indices were calculated in R (version 3.6.2)(Reference Rizzo30).
Summary of the food groups/dietary groups of the dietary indices included in the study

O-Med, Original Mediterranean Score; A-Med, Amended Mediterranean Score; A-HEI, Alternative Healthy Eating Index; DASH, Dietary Approaches to Stop Hypertension; DQI-I, Diet Quality Index International; DRV, Dietary Reference Values; HDI, Healthy Diet Indicator; HEI, Healthy Eating Index 2010; NDS, Nordic Diet Score.
Measures of cardiovascular health
For this study we analysed: BMI, VF (g), systolic and diastolic blood pressure (mmHg), pulse wave velocity (m/s), fasting lipid measures (mmol/l) including HDL, LDL, total cholesterol and TAG, fasting plasma insulin (pmol/l) and glucose (mmol/l), insulin resistance (HOMA2-IR) and ASCVD risk score. A detailed description of every clinical and biochemical measure utilised in this study has been previously reported in detail(Reference Jennings, MacGregor and Welch31–Reference Menni, Migaud and Glastonbury33). In brief, BMI was determined from weight and height measurements (weight (kg)/height (m2)). VF was measured via dual-energy X-ray absorptiometry scans (Hologic QDR; Hologic, Inc.)(Reference Menni, Migaud and Glastonbury33). Peripheral systolic and diastolic BP were measured by a trained nurse who used an automated cuff sphygmomanometer (OMRON HEM713C) with the participant in the seated position for at least 3 min before taking three measurements. Hypertension status was defined as systolic blood pressure ≥ 140 mmHg and/or diastolic blood pressure ≥ 90 mmHg and/or treatment with antihypertensive medication. For participants taking antihypertensive drugs, we added 15 mmHg to systolic and 10 mmHg to diastolic blood pressure to correct for the effect of the treatment(Reference Ehret, Munroe and Rice34). Arterial stiffness pulse wave velocity was calculated from sequential recordings of electrocardiogram-referenced carotid and femoral pressure waveforms(Reference Jennings, MacGregor and Welch31). All biochemical assessment (lipid profiles, insulin and glucose levels) levels were measured after a 10-h overnight fasting period. HOMA2-IR was calculated by the HOMA2 online application (https://www.dtu.ox.ac.uk/homacalculator/). Fasting insulin (pmol/l) and glucose (mmol/l) were measured using an enzymatic assays previously described(Reference Menni, Migaud and Glastonbury33,Reference Jamshidi, Snieder and Wang35) . Individuals on lipid- or blood glucose-lowering medications were excluded from the study. The individual CVD risk was estimated using the 10-year ASCVD risk score(36). The ASCVD risk score is an algorithm used to estimate the 10-year cardiovascular risk of an individual using the individual’s sex, ethnicity, age, smoking status, cholesterol levels, blood pressure and diabetes mellitus status. The ASCVD risk score was calculated using the online ASCVD risk estimator (http://tools.acc.org/ASCVD-Risk-Estimator-Plus/)(Reference Menni, Gudelj and Macdonald-Dunlop32).
Assessment of covariates
All analyses were adjusted for five major confounders: Age, smoking status, physical activity, menopause status and the index of multiple deprivation (IMD). Furthermore, alcohol and energy intakes were included in the analysis models as appropriate. Both alcohol and energy intakes were estimated from the FFQ (mean g/d and kJ for alcohol and energy, respectively)(Reference Verdi, Abbasian and Bowyer14). Age, physical activity smoking and menopause status were recorded as part of the self-report lifestyle questionnaire(Reference Verdi, Abbasian and Bowyer14). The IMD is a composite decile score measuring the area-level deprivation (lower deciles represent the most deprived areas). IMD was generated combining the data repositories of the four UK’s administrative countries: England (IMD version 2015), Scotland (IMD version 2016), Wales (IMD version 2014) and Northern Ireland (IMD version 2017). The IMD includes seven different domains representing income, employment, education, skills and training, health deprivation and disability, crime, barriers to housing and services and living environment deprivation. The IMD was based on the postcode reported by the participant at the time of sample collection(Reference Verdi, Abbasian and Bowyer14).
Statistics
Data distribution for both dietary indices and CVD risk factors was graphically explored in order to assess normality. Since both diet indices and cardiovascular risk factors are reported in different units, in order to compare the results, they were both normalised using a rank-based inverse normal transformation approach(Reference Pain, Dudbridge and Ronald37). All association tests included in this study were performed using linear mixed effects models in R version 3.6.2 (‘lmer’ function as part of ‘lme4’ package)(Reference Bates, Mächler and Bolker38).
We performed a full linear mixed model where standardised CVD risk factors were the response variables and the standardised dietary indices were fixed effects predictors. We included age, smoking, physical activity, IMD, menopause, energy intake (fixed effect) as main covariates. The majority of the data set (94·7 %) was composed by related individuals (both co-twin from each family). Therefore, ‘family unit’ was also included as covariate (random effect) in the models to account for the twin structure and relatedness. The fit of the full linear regression model was compared with the fit of a null model (which excluded the CVD risk factors as a predictor variable) using the ANOVA function returning the overall P value representing the significance of the difference between the nested models.
Alcohol consumption was included as covariate (fixed effect) in the analyses for those dietary indices that do not take alcohol into account (DASH, Nordic, HDI and DRV) following the recommended methodology (online Supplementary Tables S2–S10)(Reference Chiuve, Fung and Rimm21–Reference Trichopoulou, Costacou and Bamia29,Reference Kim, Haines and Siega-Riz39) .
From these analyses, we identified DASH as the most favourable dietary pattern to take forward for post hoc analyses to test dose response and independence of association against score components.
Similarly, both the quintile analysis and the nutrient analysis were performed using a linear mixed model including CVD risk factors as response variables and DASH quintiles (categorical) and DASH food group or nutrient (g/d) as fixed effect predictors. Age, smoking, physical activity, IMD, menopause, energy intake, alcohol consumption (fixed effect) and family structure (random effects) were added as covariates. In the quintile analysis, the 5th quintile (representing the ‘healthiest’ category) was set as baseline.
To test if observed associations between DASH were independent of individual score components, we repeated the analyses with a modified DASH score(Reference Miller, Cross and Subar40). The food group or nutrient analysis was adjusted for a modified diet score that did not include the respective component along with the included covariates (age, smoking status, physical activity, IMD, energy intake, alcohol consumption and family structure)(Reference Saneei, Salehi-Abargouei and Esmaillzadeh41).
To correct for multiple testing, P values were adjusted using the Benjamini and Hochberg method(Reference Benjamini and Hochberg42). Association tests with P FDR < 0·01 were considered statistically significant, while P FDR < 0·05 and ≥ 0·01 were considered ‘suggestive’.
Results
Here, we included 2590 female individuals from TwinsUK. The full descriptive characteristics of the study population are presented in Table 2. The participants had an average age of 58·1 (sd 10·2) years with 55·7 % of the subjects classified as overweight/obese (BMI > 25 kg/m2). The majority of the participants were post-menopausal (85 %), non-smokers (57 %), not engaged in high physical activity (89 %) and had a good socio-economic status (66 % of the participant at the time of sample collection lived in an area with IMD ≥ 7). Measurement of agreement (Pearson’s correlation) between the scores is reported in online Supplementary Fig. S2. Correlation coefficients ranged from −0·09 to 0·85. We observed the strongest correlations between O-Med and A-Med (r 0·85), whereas weakest correlation was between HEI and DRV (r −0·09).
Demographic, CVD risk factors and dietary indices characteristics of the participants (n 2590)
(Mean values and standard deviations; numbers and percentages)
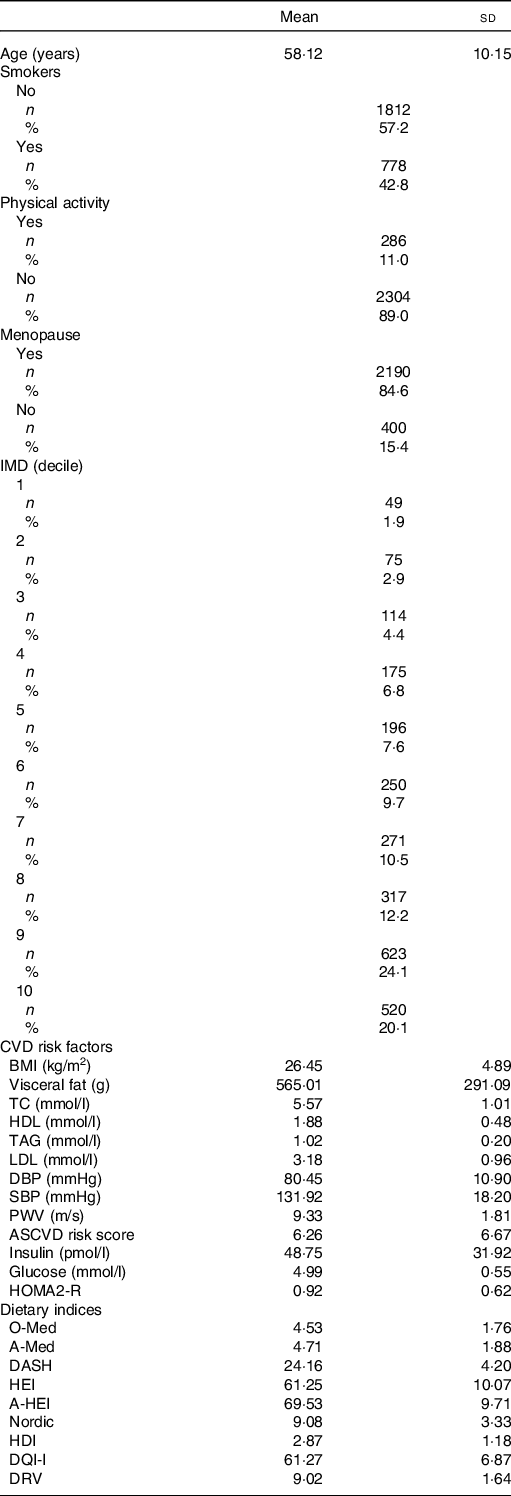
IMD, index of multiple deprivation; TC, total cholesterol; DBP, diastolic blood pressure; SBP, systolic blood pressure; PWV, pulse wave velocity; ASCVD, atherosclerotic CVD; HOMA2-IR, homoeostasis model assessment of insulin resistance; O-Med, Original Mediterranean Score; A-Med, Amended Mediterranean Score; DASH, Dietary Approaches to Stop Hypertension; HEI, Healthy Eating Index; A-HEI, Alternative Healthy Eating Index; HDI, Healthy Diet Indicator; DQI-I, Diet Quality Index International; DRV, Dietary Reference Values.
Dietary scores and CVD measures
All association results between the dietary indices and CVD risk are presented in Fig. 1 and online Supplementary Table S11.
Heatmap representing the results of the association test between nine main dietary indices and thirteen CVD risk factors. The colour scale illustrates the effect (β) of each dietary index on the relative CVD risk factor. Red and blue indicate positive and negative effects, respectively. Colour intensity represents the degree of positive/negative effect. The asterisks indicate suggestive (* P FDR < 0·05) and significant (** P FDR < 0·01) Benjamini and Hochberg-adjusted P values. To compare the effect of the indices across the CVD risk factors, both indices and risk factors were standardised (z-score) before the analysis. Age, smoking, physical activity, index of multiple deprivation, menopause, energy intake and family relatedness were included as covariates in all the analyses. DASH, Dietary Approaches to Stop Hypertension; A-Med, Amended Mediterranean Score; DQI-I, Diet Quality Index International; HEI, Healthy Eating Index; A-HEI, Alternative Healthy Eating Index; O-Med, Original Mediterranean Score; DRV, Dietary Reference Values; HDI, Healthy Diet Indicator; ASCVD, atherosclerotic CVD; SBP, systolic blood pressure; DBP, diastolic blood pressure; PWV, pulse wave velocity; HOMA2-IR, homoeostasis model assessment of insulin resistance; TC, total cholesterol.

After adjusting for multiple testing using Benjamini and Hochberg false discovery rate (FDR), we found that the DASH score was correlated with lower BMI, as well as lower VF, TAG, insulin, HOMA2-IR values and decreased ASCVD risk with effects ranging from β = −0·04 (95 % CI 0·95, 0·98) to −0·12 (95 % CI 0·85, 0·92) for ASCVD risk and insulin/HOMA2-IR, respectively (Fig. 1 and online Supplementary Table S11). A similar pattern of association was detected across all dietary indices as shown in Fig. 1 and online Supplementary Table S11.
We also observed a positive correlation between HDL levels, DASH, A-Med, DQI-I and O-Med with β ranging from 0·08 (95 % CI 1·04, 1·12) for DASH, DQI-I and O-Med to 0·11 (95 % CI 1·07, 1·16) for A-Med (Fig. 1 and online Supplementary Table S11).
Finally, no association (either statistically significant or suggestive) was observed between DRV and CVD risk factors and (Fig. 1 and online Supplementary Table S11).
We then focused our attention on DASH to investigate if the observed associations with BMI, VF, TAG, HDL, insulin, HOMA2-IR and ASCVD risk were driven by one specific: (a) set of individuals (quintile analysis) and (b) dietary component.
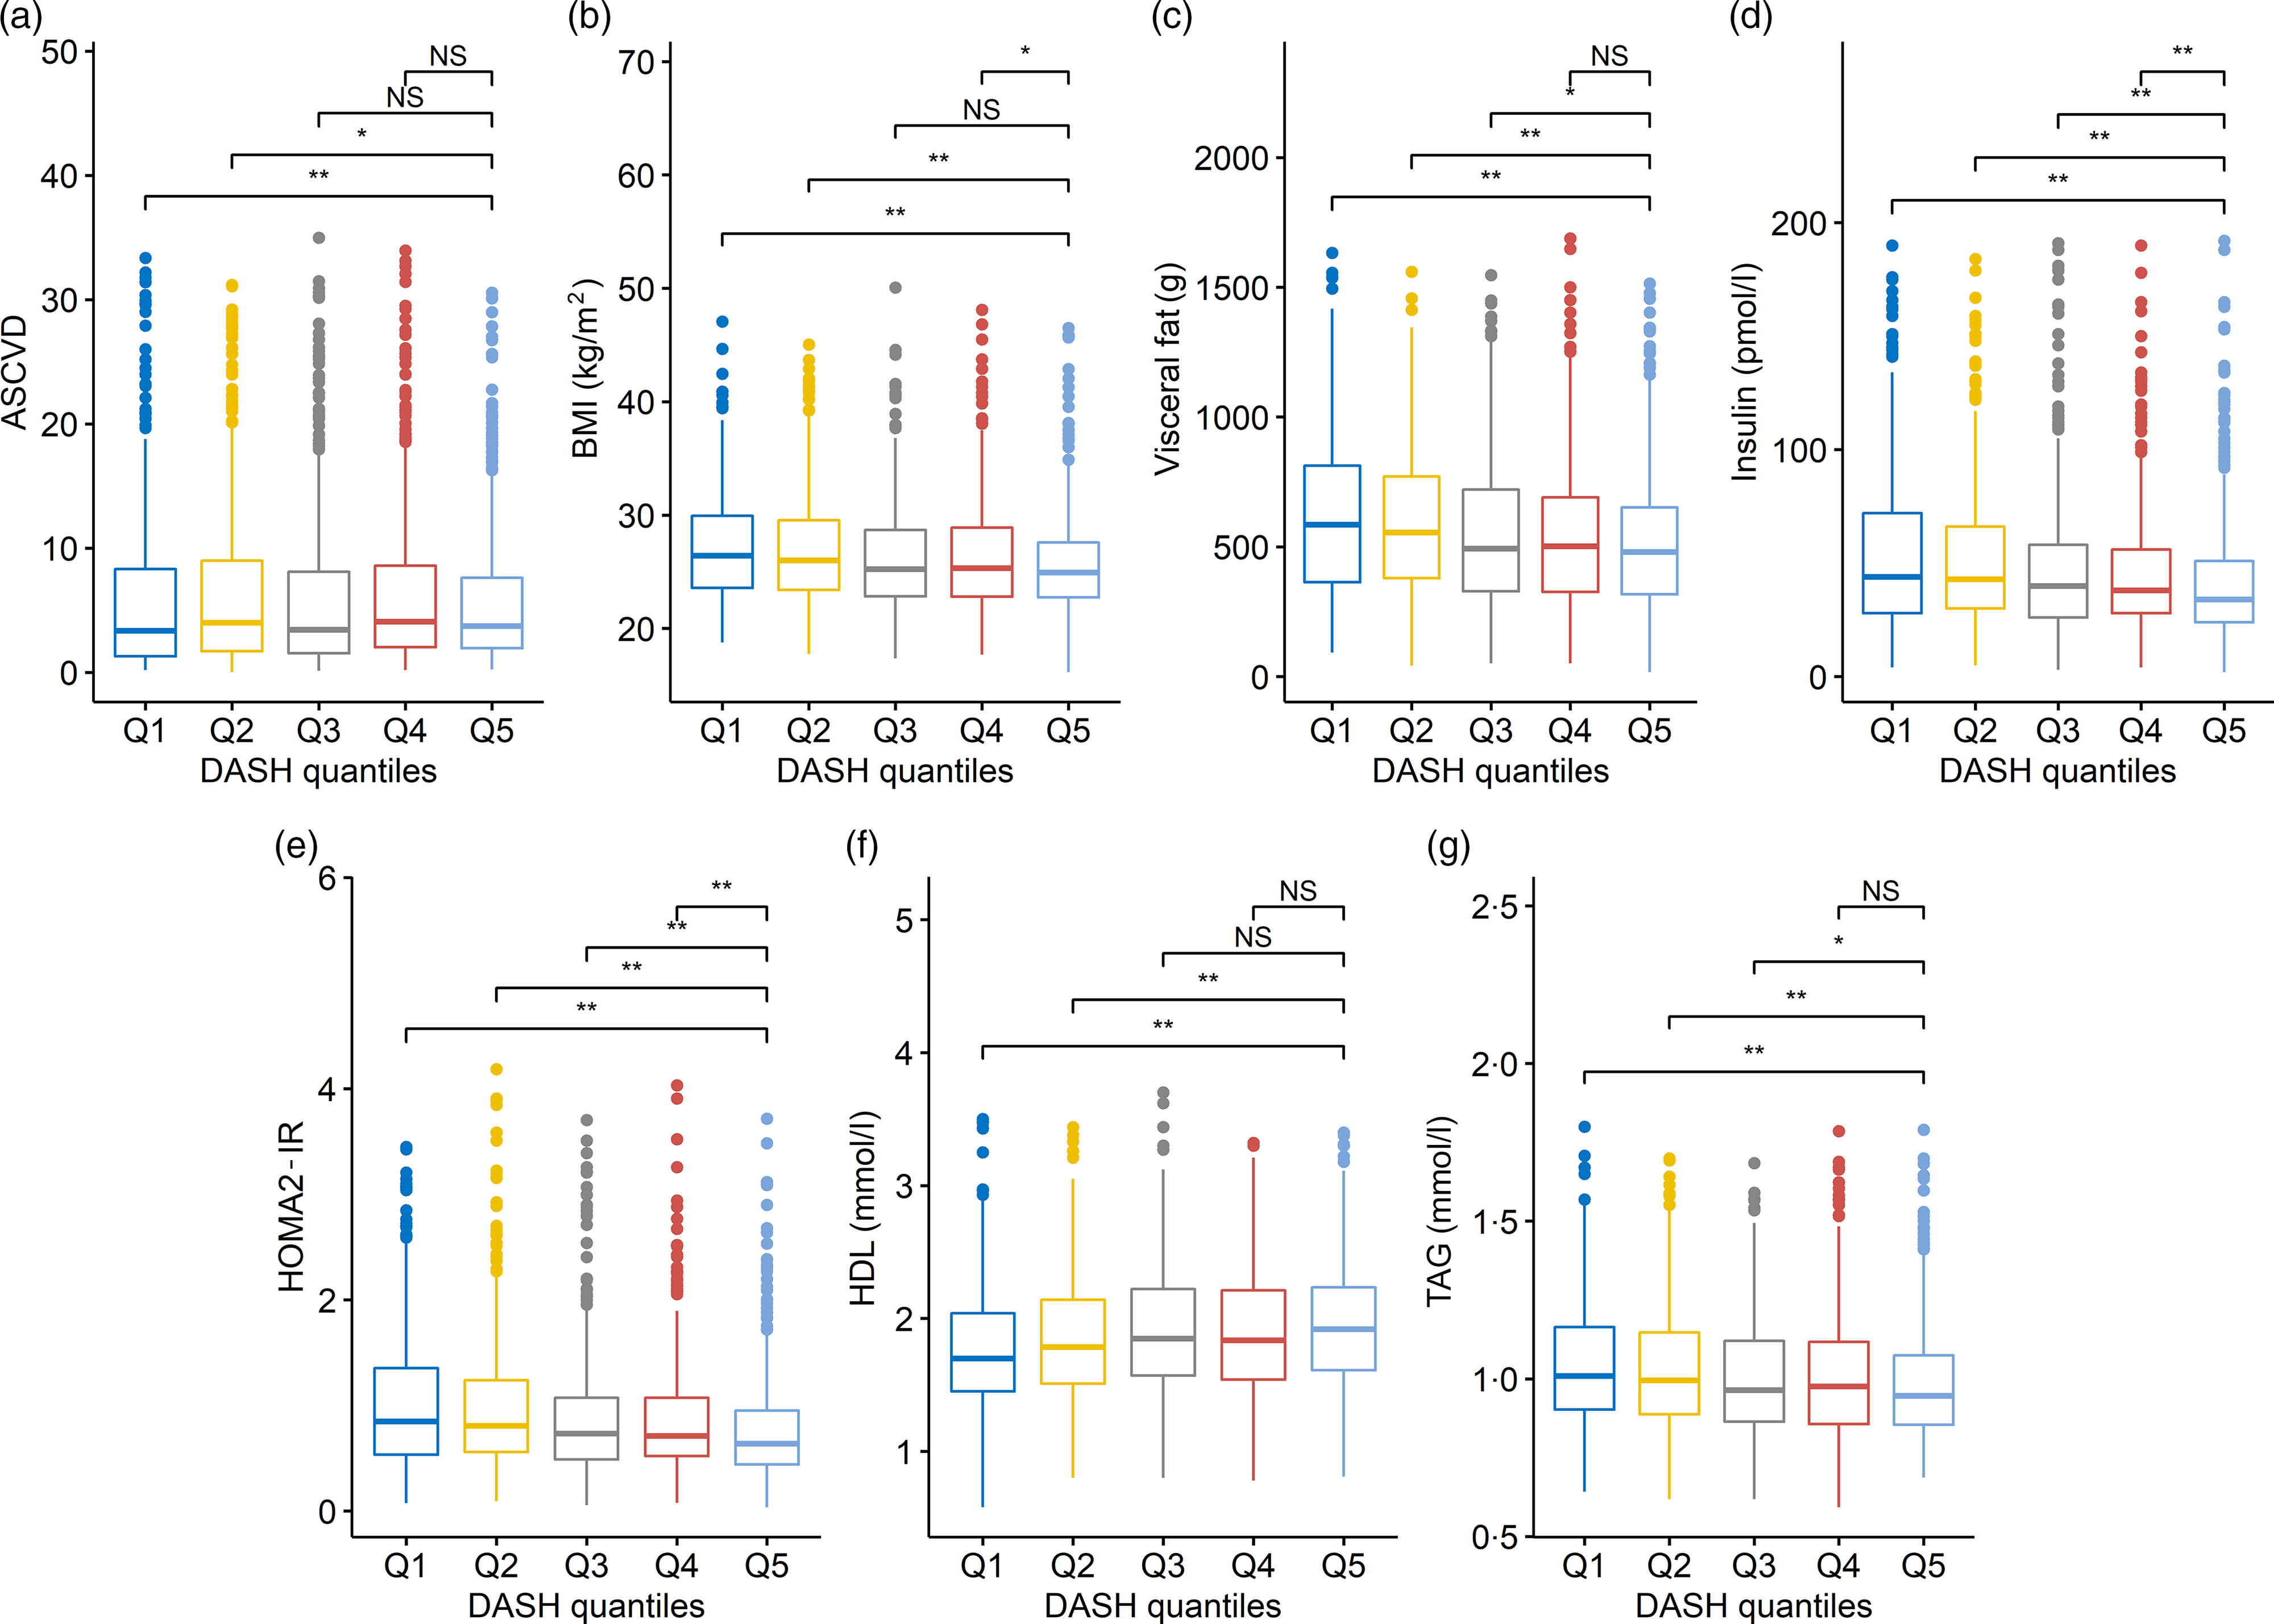
After dividing DASH in quintiles, the analysis showed that the subjects with the less healthy diet style (1st and 2nd quintiles) are driving the association between DASH and BMI, VF, HDL, TAG and ASCVD risk score (Fig. 2 and online Supplementary Table S12). However, HOMA2-IR and insulin levels were consistently different across all quintiles (1st to 4th) when compared with the reference (5th quintile, representing the healthiest individuals) (Fig. 2 and online Supplementary Table S12). Therefore, the associations between DASH and HOMA2-IR and insulin levels were not determined by any specific class of individual.
Each box plot represents the distribution of values for the CVD risk factors across the Dietary Approaches to Stop Hypertension (DASH) quintiles. Boxes represent the median, 25th and 75th percentiles of the distribution of CVD risk factors; whiskers represent the 5th and 95th percentiles of the distribution of CVD risk factors. Linear mixed model including family structure has been used to test a difference of distribution across DASH quintiles. For this analysis, the 5th DASH quintile (representing the healthiest individuals; n 417) was used as baseline and compared with Q1 (n 691), Q2 (n 444), Q3 (n 469) and Q4 (n 569). Suggestive and significant Benjamini and Hochberg-adjusted P values are marked with asterisks (* P FDR < 0·05 and ** P FDR < 0·01). NS indicates non-significant differences.
Two nutrients (red/processed meat and whole-grain cereal) were mostly responsible for the association observed between DASH and CVD risk factors. Our results show that increased red meat consumption was associated with increased BMI (P FDR = 6·03 × 10−6), VF (P FDR = 4·65 × 10−9), HOMA2-IR (P FDR = 3·69 × 10−3), ASCVD risk (P FDR = 4·76 × 10−4), insulin (P FDR = 7·98 × 10−3) and TAG (P FDR = 3·39 × 10−4) levels. Interestingly, there is a suggestive evidence (0·05 < P FDR ≤ 0·01) that increased read meat consumption is associated with lower HDL levels (P FDR = 2·77 × 10−2) (Fig. 3 and online Supplementary Table S13).
Box plots representing the effects (β) of Dietary Approaches to Stop Hypertension (DASH) food groups/nutrients on the associated CVD risk factors. The colour indicates a positive (blue) or negative (red) impact on the CVD risk factors. Standard errors are depicted in orange. To compare the effect of DASH food groups/nutrients, CVD risk factors were standardised (z-score) before the analysis. Linear mixed models Benjamini and Hochberg-adjusted P values are marked with asterisks (* P FDR < 0·05; ** P FDR < 0·01). ASCVD, atherosclerotic CVD; HOMA2-IR, homoeostasis model assessment of insulin resistance.
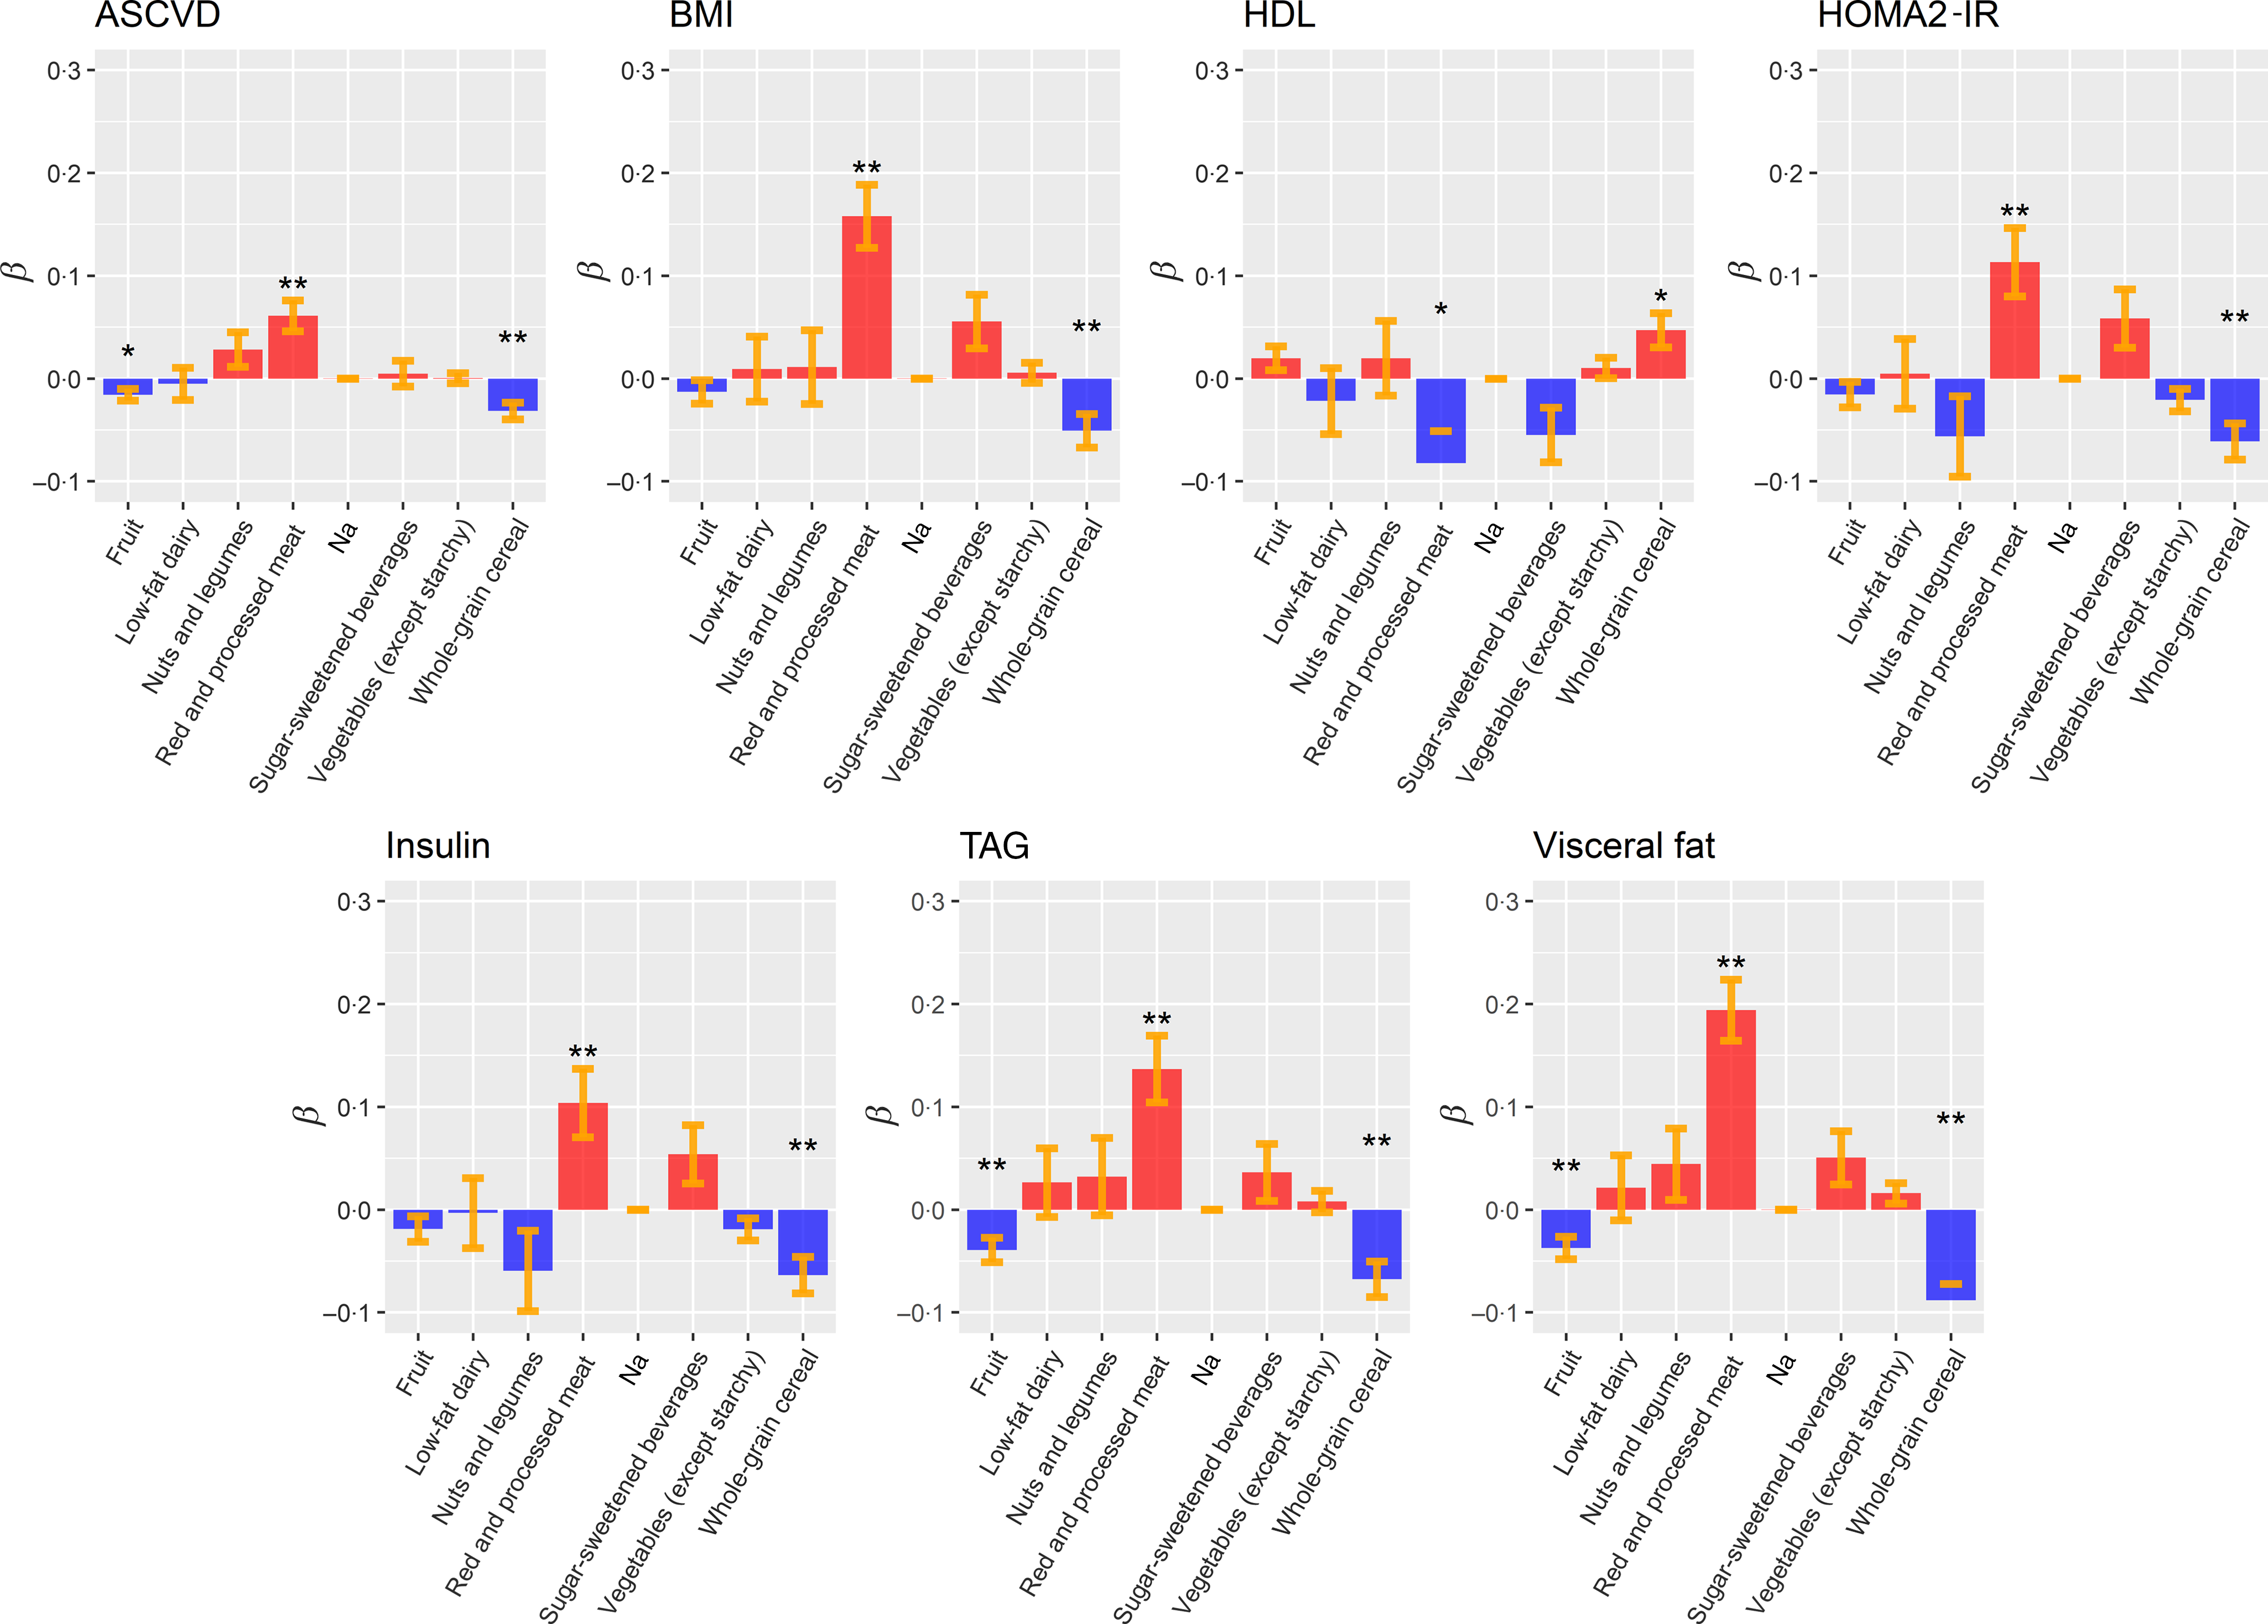
Our results also highlighted that an increased consumption of whole-grain cereal is associated with lower BMI (adj-P value = 8·28 × 10−3), ASCVD risk (P FDR = 8·72 × 10−4), VF (P FDR = 1·26 × 10−6), HOMA2-IR (P FDR = 3·35 × 10−3), insulin (P FDR = 2·30 × 10−3) and TAG’s levels (P FDR = 8·72 × 10−4). Our results also present a suggestive association between increased HDL levels and whole-grain cereal intake (P FDR = 1·75 × 10−2) (Fig. 3 and online Supplementary Table S13).
Finally, we also observed a significant reduction of VF (P FDR = 3·96 × 10−3) and TAG levels (P FDR = 5·25 × 10−3) associated with increased fruit intake (Fig. 3 and online Supplementary Table S13).
Discussion
To our knowledge, this is the first study to investigate the associations between the main a priori dietary indices with multiple objective markers of cardiovascular health in a UK female population sample. Of the nine scores we tested, seven demonstrated benefit against markers of glucose metabolism (insulin and HOMA2-IR) and TAG. These CVD risk markers are considered particularly important to the development of CVD in women(Reference Lee and Foody43–Reference Tohidi, Baghbani-Oskouei and Ahanchi45). Therefore, our findings suggest the potential application of a variety of dietary patterns to modify this female-specific risk phenotype. DASH, in particular, showed the greatest number of beneficial associations with CVD risk factors, including measures of adiposity, independent of age, smoking status, daily energy intake and alcohol consumption.
The differential associations we have observed highlight how the components of the various dietary scores – nutrients v. foods, and types of foods can influence associations with CVD risk. The majority of the scores we tested (DASH, HEI, Alternative HEI, DQI-I and A-Med) were developed using American dietary guidelines and/or derived from American population samples(Reference Aljuraiban, Gibson and Oude Griep10). As reported in the Dietary Patterns Methods Project, we found moderate to strong correlations between DASH, Alternative HEI, HEI and A-Med(Reference Liese, Krebs-Smith and Subar46). The Dietary Patterns Methods Project observed associations between higher DASH, Alternative HEI and A-Med scores with reduced CVD mortality in female only cohorts(Reference Liese, Krebs-Smith and Subar46). These findings may represent the common elements of all the scores – whole-grain, fruit and vegetable intake being established as protective against CVD(Reference Aune, Giovannucci and Boffetta47,Reference Mellen, Walsh and Herrington48) . Through testing the diet scores against a range of established CVD risk marker, we observed DASH to have significant benefit against the most markers. These findings are consistent with previous research showing health benefits of following the DASH diet on insulin(Reference Salehi-Abargouei, Maghsoudi and Shirani49), TAG(Reference Chiu, Bergeron and Williams50) visceral obesity(Reference Kucharska, Gajewska and Kiedrowski51), HOMA2-IR(Reference Ehrampoush, Nazari and Homayounfar52) and ASCVD(Reference Siervo, Lara and Chowdhury53). The DASH diet is characterised by high consumption of vegetables, fruit, low-fat dairy products, whole grains, legumes, nuts, and low consumption of red and processed meat, Na, and sugar-sweetened beverages. In the present study, DASH was the only score that showed potential beneficial association with blood pressure, a finding in agreement with the DASH feeding trial(Reference Saneei, Salehi-Abargouei and Esmaillzadeh41). Potential benefits of the diet have been hypothesised to be due to the diets nutrient profile with high levels of fibre(Reference Barrett, Batterham and Ray54), Ca(Reference Asemi, Saneei and Sabihi55), Mg(Reference Houston56), K, low Na(Reference Newberry, Chung and Anderson57) and sugar(Reference Bergwall, Ramne and Sonestedt58). The potential mechanisms of action between the individual components of the DASH diet pattern and cardiometabolic health have been extensively described in a recent review(Reference Akhlaghi59). However, ‘food synergy’ is the basis of dietary pattern research. ‘Food synergy’ is the theory that the interaction between chemical compounds within the diet may have additive effects on physiology(Reference Jacobs, Gross and Tapsell60). The potential nutrient–nutrient interactions and synergistic impact of DASH dietary components on CVD are potentially important and requires further investigation.
Four scores, Nordic, O-Med, DRV and HDI were found to have lower levels and numbers of associations with CVD risk markers compared with the American-derived scores. The Nordic and O-Med scores were developed based on dietary patterns specific to geographically defined population groups, suggesting that the American scores more adequately capture the foods consumed in the UK compared with traditional Nordic and South Mediterranean dietary intake. The O-Med was modified to A-Med for application to an American population sample; total cereals were replaced with whole grains, potato was removed from the vegetable category and dairy was excluded(Reference Fung, McCullough and Newby22). The only score we tested that was developed for the UK population was the DRV score. In contrast to a previous study, we did not observe associations between a higher DRV score with central adiposity, total cholesterol or markers of glucose metabolism(Reference Eriksen, Gibson and Lamb25). These differences may reflect the demographic of our cohort, female compared with a younger predominately male cohort and the different outcome measures for these risk factors (waist circumference and HbA1c). It has been previously suggested that dietary scores should be developed and applied based on the target study population(Reference Waijers, Feskens and Ocke13); therefore, the lack of associations between the UK DRV score and CVD risk markers is contrary to what we expected. The DRV and HDI (developed from WHO dietary guidelines) had a low number of associations with markers of CVD risk and low-moderate correlation coefficients with other scores. Both of these scores are primarily derived from nutrient intakes rather than foods(Reference Eriksen, Gibson and Lamb25,Reference Berentzen, Beulens and Hoevenaar-Blom26) . Unlike the scores that are based on food group intake, they are not able to capture the complexity of overall diet intake(Reference Arvaniti and Panagiotakos61); these scores also apply an absolute, rather than relative, scoring system. For example, the DRV score does not separate fruit from vegetables with >420 g of fruit and vegetables per d (approximately five servings) obtaining the maximum score, whereas <380 would get a score of 0 (approximately four servings)(Reference Eriksen, Gibson and Lamb25). Similarly, the HDI awards a score of 0 for fruit and vegetables if the consumption is below 400 g/d, not allowing the differentiation between individuals.
In our post hoc investigation, to determine if any specific food groups were driving associations between the DASH score and markers of cardiometabolic risk, we found that higher intakes of wholegrains were beneficially associated with all CVD markers. Additionally, higher fruit intake was associated lower with TAG and VF mass, while red/processed meat associated with higher insulin, HOMA2-IR, VAT, BMI, TAG and ASCVD. The observed determinantal effect of red meat on glucose metabolism is in agreement with pooled analyses from the Health Professionals and Nurses’ Health Study that observed about 20 and about 50 % increase in type 2 diabetes risk per 100 g/red meat and processed meat intake per d(Reference Pan, Sun and Bernstein62). Although a causal relationship needs to be established, suggested physiological mechanisms linking red meat and type 2 diabetes focus around inflammatory pathways induced by Fe, nitrosamines and advanced glycation end products that are associated with red and processed meat intake(Reference Tong, Neusner and Longato63). Higher whole-grain intake has previously been associated with lower VAT(Reference McKeown, Troy and Jacques64). Whole grains and fruit are an important contributor to dietary fibre in the UK population, fibre from these food groups has been previously associated with lower adiposity(Reference Gibson, Eriksen and Chambers65). Potential mechanisms include the non-nutrient components, for example, polyphenol intake linked to these food groups(Reference Guo, Tresserra-Rimbau and Estruch66) and bacterial fermentation in the colon of SCFA impacting on various metabolic pathways related to cardiometabolic health(Reference Vetrani, Costabile and Luongo67).
The main strength of the study is the breadth of objectively measured CVD-related risk markers on a large UK population sample. This combined with the dietary data obtained from a validated FFQ has allowed us to test associations from the main dietary scores with these markers. We focused on a female population sample as there is a need for a targeted approach in understanding the differential CVD risk in women, of which diet may be an important modifiable factor. The generalisability of our observations is therefore, limited to women. Due to the application of scoring systems that are based on population sample distribution of intakes, our results may also not be applicable to women with different demographics to the TwinsUK cohort. In UK cohorts, the DASH dietary pattern has been associated with lower odds of the metabolic syndrome in the Airwave Health Monitoring study, a predominately male cohort of police force employees(Reference Gibson, Eriksen and Singh68) and A-HEI-2010 applied to the Whitehall II cohort reported positive associations with CVD-free life expectancy(Reference Lagström, Stenholm and Akbaraly69). However, these are occupational-specific cohorts testing single scores; therefore, further research is needed to compare associations between sexes to establish the likely importance of sex-stratified dietary recommendations for CVD prevention in the UK. Additional limitation to this study may be the gap (on average 2·6 years) between the clinical assessment and the FFQ. However, longitudinal studies showed that patterns of dietary intake are established during childhood and maintained into adulthood(Reference Movassagh, Baxter-Jones and Kontulainen15,Reference Lien, Lytle and Klepp70,Reference Mikkilä, Räsänen and Raitakari71) . Therefore, it is unlikely that the small difference between the time FFQ and the collection of the clinical phenotypes would substantially affect the results reported in this study. Finally, our study includes the inherent limitations of all self-report retrospective dietary assessment methods of recall bias and misreporting of dietary intake. However, the FFQ used in the TwinsUK study to estimate habitual diet is based on the validated FFQ developed for the European Prospective Investigation into Diet and Cancer study(Reference Bingham, Welch and McTaggart17) and has been shown to detect associations between diet exposure and cardiometabolic health outcomes in UK population samples(Reference Lagström, Stenholm and Akbaraly69,Reference Brunner, Stallone and Juneja72) . High Na intake is established risk factor for elevated blood pressure(Reference Mozaffarian, Fahimi and Singh73). FFQ do not capture discretionary salt which is likely to contribute to the poor agreement between FFQ estimated intake with 24-h urine (‘gold standard’ measurement)(Reference McLean, Farmer and Nettleton74). Therefore, Na intake is likely to be systematically underestimated in the scores that include Na or salt, leading to potential attenuation of observed associations. Last, the cross-sectional design of our study can only inform associations for further testing.
In conclusion, the present study suggests that in the female UK population, the DASH diet is associated with a more favourable CVD risk profile. Increasing whole-grain cereal and reducing red meat intake may confer specific benefit as part of this dietary pattern. Currently, specified dietary patterns are not part of UK dietary guidelines. Although our observations require replication and testing, the DASH dietary pattern could be a candidate dietary pattern to supplement current UK dietary recommendations for CVD prevention.
Acknowledgements
We are grateful to the twins who took part in TwinsUK and the whole TwinsUK team, which includes academic researchers, clinical staff, laboratory technicians, administrative staff and research managers.
TwinsUK receives funding from the Wellcome Trust (212904/Z/18/Z), Medical Research Council (AIMHY; MR/M016560/1) and European Union (H2020 contract no. 733100). TwinsUK and M. M. are supported by the National Institute for Health Research (NIHR)-funded BioResource, Clinical Research Facility and Biomedical Research Centre based at Guy’s and St Thomas’ NHS Foundation Trust in partnership with King’s College London. O. M. is supported by Chronic Disease Research Foundation (CDRF). C. M. is funded by the Chronic Disease Research Foundation and by the Medical Research Council (MRC)/British Heart Foundation Ancestry and Biological Informative Markers for Stratification of Hypertension (AIMHY; MR/M016560/1).
O. M., S. E. B., M. M. and R. G. designed the research; O. M. and M. M. performed the main analysis; C. M. contributed to the analysis; O. M., M. M. and R. G. wrote the manuscript; O. M., S. E. B., C. M., M. M., R. G. and T. D. S. edited the manuscript. All authors read and approved the final manuscript.
T. D. S. is the co-founder of Zoe Global Ltd. S. E. B. is a consultant for Zoe Global Ltd. All other authors declare no competing financial interests.
Supplementary material
For supplementary materials referred to in this article, please visit https://doi.org/10.1017/S000711452000495X


 Open access