


1 Introduction
Future tokamak-based power plants will operate with much lower tolerances for plasma instabilities and disruptions than present research devices. The acceptable frequency of these events will be quantified by the economic impact they have on power production and on machine maintenance and downtime. The SPARC tokamak (Creely et al. Reference Creely, Greenwald, Ballinger, Brunner, Canik, Doody, Garnier, Granetz, Holland and Howard2020) presents an opportunity to explore the high-field solution to this problem, setting the stage for the ARC power plant (Sorbom et al. Reference Sorbom, Ball, Palmer, Mangiarotti, Sierchio, Bonoli, Kasten, Sutherland, Barnard and Haakonsen2015; Kuang et al. Reference Kuang, Cao, Creely, Dennett, Hecla, LaBombard, Tinguely, Tolman, Hoffman and Major2018). This work demonstrates some of the benefits of the high-field approach with respect to plasma stability. The disruption loads are found to be comparable to, or factors of a few higher than, those of the low-field path; however, the reduced frequency of disruptions is expected to outweigh the increased loading.
Magnetohydrodynamic (MHD) instabilities place both hard and soft limits on the achievable plasma pressure normalized by the magnetic field pressure, resulting from the onset of ideal external kinks and resistive tearing modes, respectively. Empirical scaling laws as well as integrated modelling suggest that SPARC could operate with a fusion gain of  $Q\sim 11-9$ (Creely et al. Reference Creely, Greenwald, Ballinger, Brunner, Canik, Doody, Garnier, Granetz, Holland and Howard2020; Rodriguez-Fernandez et al. Reference Rodriguez-Fernandez, Howard, Greenwald, Creely, Hughes, Wright, Holland, Lin and Sciortino2020), giving significant margin on the mission of $Q\ge 2$, in a plasma with a relatively low normalized pressure of $\beta _N=\beta a B_T/I_p = 1.0$, where $\beta =\langle p \rangle 2 \mu _0 / B^2$ is the plasma beta, $B_T$ is the toroidal field, $I_p$ is the plasma current and $B\sim B_T$ is the total field. Achieving a high absolute pressure at low $\beta _N$ is made possible by high-temperature superconductors that remain superconducting at high fields, allowing a toroidal field of $B_T=12.2$ T at the plasma magnetic axis. A subset of SPARC parameters used for stability calculations are shown in table 1 (for a full list, see Creely et al. Reference Creely, Greenwald, Ballinger, Brunner, Canik, Doody, Garnier, Granetz, Holland and Howard2020).
Table of SPARC V2 parameters used throughout this work (Creely et al. Reference Creely, Greenwald, Ballinger, Brunner, Canik, Doody, Garnier, Granetz, Holland and Howard2020).

When plasma stability is lost, the stored thermal and magnetic energies are dissipated on a time scale of the order of hundreds of microseconds and milliseconds, respectively, in a device with SPARC dimensions. Although the high-field approach is expected to reduce the frequency of disruptions through increased plasma stability, the consequences of disruptions are comparable to or higher than those of low-field approaches such as ITER (Hender et al. Reference Hender, Wesley, Bialek, Bondeson, Boozer, Buttery, Garofalo, Goodman, Granetz and Gribov2007). The symmetric disruption forces scale like  $R I_p B_T$ (Noll et al. Reference Noll, Sonnerup, Froger, Huguet and Last1989), which for fixed aspect ratio and edge $q$ scales approximately as $R^2 B_T^2$, and therefore the pressures scale as $B_T^2$, scaling unfavourably towards higher-field machines. The expected heat fluxes are high, but comparable to those of ITER as they can be shown to scale like $\sqrt {a}B_T^2 \beta _T$ (Sorbom et al. Reference Sorbom, Ball, Palmer, Mangiarotti, Sierchio, Bonoli, Kasten, Sutherland, Barnard and Haakonsen2015). The efficiency of generating relativistic ‘runaway electrons’ (REs) during the disruption increases exponentially with the plasma current due to avalanching, but decreases with the size due to seed losses in the stochastic field generated during the thermal quench (Izzo et al. Reference Izzo, Hollmann, James, Yu, Humphreys, Lao, Parks, Sieck, Wesley and Granetz2011).
Despite these challenges, the SPARC device is being designed with a remarkable level of passive disruption resilience. A passive runaway electron mitigation coil (REMC) is under consideration and preliminary modelling results are encouraging. The vacuum vessel and all internal components are being designed to withstand the highest expected halo and eddy current forces. Where viable passive solutions have not been identified, such as for the thermal quench divertor heat flux (Kuang et al. Reference Kuang, Ballinger, Brunner, Canik, Creely, Gray, Greenwald, Hughes, Irby and LaBombard2020), active disruption mitigation is planned. Disruption prediction is required to trigger active mitigation and a machine learning approach that can be trained on both existing devices and simulation data is under investigation.
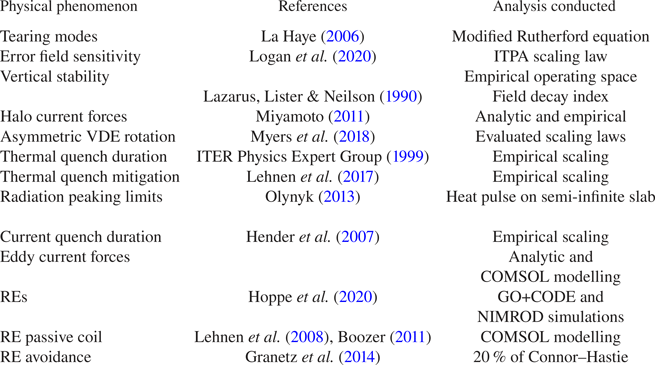
The present work reports on the MHD stability and disruption assessments completed to date in concert with the SPARC device engineering design. Table 2 provides a summary of the physical phenomena studied and a selection of relevant references and analyses used. The MHD stability of SPARC is discussed in § 2, including vertical stability (§ 2.1), tearing modes (§ 2.2), error-field-driven locked modes (§ 2.3) and a proposed error field correction coil set (§ 2.4). The natural (unmitigated) disruption dynamics and loading are presented in § 3. Here we investigate the thermal quench (§ 3.1), current quench (§ 3.2), eddy current forces in first-wall components and the vessel (§ 3.3), vertical displacement events and halo currents (§ 3.4) and RE generation and MHD-driven seed loss during the thermal quench (§ 3.5). Disruption statistics, mitigation and prediction are discussed in § 4 including disruptivity estimates (§ 4.1), thermal quench mitigation (§ 4.2.1), current quench mitigation (§ 4.2.2), RE avoidance (§ 4.2.3), potential mitigation actuators (§ 4.2.4) and the challenges and requirements of data-driven disruption prediction (§ 4.3).
A summary of the physical phenomena studied, relevant references and analyses used in this work.
2 Magnetohydrodynamic stability
Fusion power plants must operate with high reliability, requiring robust plasma operating scenarios without sudden, potentially destructive ‘disruptions’ to the fusion energy production, which will be discussed in § 3. As the economics of fusion require maximizing the volume-averaged fusion power, scaling as  $\beta ^2 B_{0}^4$ (Wesson Reference Wesson2005), low-field paths to fusion energy require operating near the beta limit. In contrast, the strong toroidal field in SPARC allows full performance $Q\geq 2$ operation with relatively low values of the normalized pressures ( $\beta _N=1$ and $\beta _p = \langle p \rangle 2\mu _0 / B_p^2 =0.79$, where $B_p$ is the poloidal field) for driving ideal and resistive instabilities, and thereby allows a path towards fusion gain that is more robust to MHD instabilities. Further, the high plasma current (8.7 MA) raises the disruption density limit (Greenwald et al. Reference Greenwald, Terry, Wolfe, Ejima, Bell, Kaye and Neilson1988) far above the constraint on density imposed by the total fusion yield (i.e. total fusion power $\le$140 MW; see Creely et al. Reference Creely, Greenwald, Ballinger, Brunner, Canik, Doody, Garnier, Granetz, Holland and Howard2020), resulting in a normalized operating density of $n_G=n_e/(I_p/{\rm \pi} a^2) = 0.37$, where the electron density $n_e$ has units of $10^{20}$ m $^{-3}$, $I_p$ has units of MA and the plasma minor radius $a$ has units of metres. Despite these advantages, the high field does not significantly affect the plasma vertical stability or the current-driven resistive instabilities, and therefore these will receive careful consideration throughout the SPARC design process.
2.1 Vertical stability
Elongation raises the safety factor  $q_{95}$ but causes plasmas to be inherently vertically unstable, and when stability is lost, the plasma moves vertically into the wall; this process is referred to as a vertical displacement event (VDE). A VDE can be characterized as cold or hot, depending on whether the thermal energy is quenched before or after the loss of vertical control. Currents shared between the plasma and the vessel wall, referred to as halo currents (Strait et al. Reference Strait, Lao, Luxon and Reis1991), develop as the plasma makes contact with the wall, causing stresses on the conducting structures.
Scaling laws and the ITER H-mode database have been investigated to provide guidance on achievable plasma elongations. Although scaling laws for the maximum elongation as a function of the inverse aspect ratio are reported in the literature, they are found to give quite different maxima, even for very standard aspect ratio tokamaks (Wong et al. Reference Wong, Wesley, Stambaugh and Cheng2002; Zohm et al. Reference Zohm, Angioni, Fable, Federici, Gantenbein, Hartmann, Lackner, Poli, Porte and Sauter2013; Menard et al. Reference Menard, Brown, El-Guebaly, Boyer, Canik, Colling, Raman, Wang, Zhai and Buxton2016). Given this ambiguity, these scaling laws did not considerably influence the SPARC elongation design point, and instead the operating space of the ITER H-mode database is used. The ITER database is shown in the space of the areal elongation  $\kappa _a=S/{\rm \pi} a^2$ and inverse aspect ratio $\epsilon =a/R$ in figure 1, where $S$ is the plasma cross-sectional area and $a$ and $R$ are the plasma minor and major radii.
Areal elongation and inverse aspect ratio from JET, ASDEX Upgrade, Alcator C-Mod, DIII-D, JT60-U and TCV discharges in the ITER H-mode database along with the ITER and SPARC design points.

Theoretical works on vertical stability provide metrics for passive stability (Lazarus et al. Reference Lazarus, Lister and Neilson1990; Humphreys & Hutchinson Reference Humphreys and Hutchinson1993; Portone Reference Portone2005) and for active stability (Freidberg, Cerfon & Lee Reference Freidberg, Cerfon and Lee2015) that can be used to assess SPARC. Here we investigate the vertical field decay index  $n$ normalized by the critical index $n_c$ across a database of stable and vertically unstable C-Mod discharges to validate the analytic theory and to relate a particular value of $n/n_{\mathrm {crit}}$ to an expected disruptivity. The field decay index is defined as follows:
 \begin{equation} n = -\frac{R_0}{B_z} \frac{\partial B_z}{\partial R}, \end{equation}
where  $R_0$ is the major radius of the magnetic axis and $B_z$ is the vertical field at the axis (Lazarus et al. Reference Lazarus, Lister and Neilson1990). The critical index is given by
 \begin{equation} n_c = 2\left(\frac{\partial M_{vp}}{\partial z}\right)^2 \frac{R_0}{\mu_0 \varGamma L_v}, \end{equation}
where  $M_{vp}$ is the mutual inductance between the plasma and the vacuum vessel, $\varGamma =L_{\mathrm {ext}}/\mu _0 R_0 + l_i/2 + \beta _p + 1/2$, $L_{\mathrm {ext}}$ and $l_i$ are the external and internal plasma inductances, $\beta _p$ is the plasma pressure normalized by the poloidal magnetic pressure and $L_v$ is the self-inductance of the vacuum vessel. The ratio $n/n_{\mathrm {crit}}$ determines whether the plasma is passively stable assuming a zero-resistivity wall. When $|n|/n_{\mathrm {crit}} <1$, the plasma is stable for time scales shorter than the resistive wall time, and can be stabilized for longer time scales using feedback control. When $|n|/n_{\mathrm {crit}} >1$, the vertical motion approaches the Alfvén velocity.
The  $n/n_{\mathrm {crit}}$ formalism is applied to C-Mod discharges to validate this approach. Disruptive discharges that go vertically unstable prior to the thermal quench are counted and binned according to the value of $n/n_{\mathrm {crit}}$ at ${\sim }50$ ms prior to the disruption. Next, the total time that C-Mod operated at each value of $n/n_{\mathrm {crit}}$ is found. Taking the ratio of the VDE counts to the duration for each bin, the disruptivity as a function of
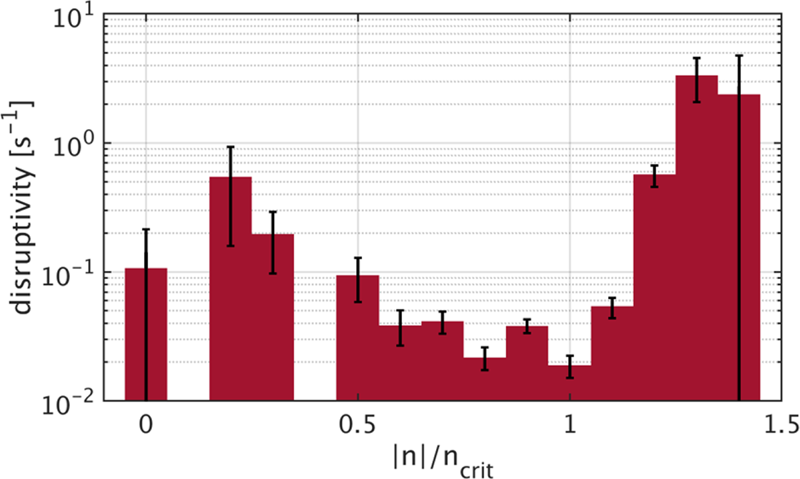
  $|n|/n_{\mathrm {crit}}$ is derived and shown in figure 2. A transition from relatively low disruptivity (i.e. ${\sim }0.03$ s $^{-1}$) to high disruptivity is observed around $|n|/n_{\mathrm {crit}}=1.2$, in qualitative agreement with the theory. The transition to instability occurs at a value ${\sim }20\,\%$ higher than predicted by theory, which might be attributable to errors in the calculations of $n$ and $n_{\textrm {crit}}$, or alternatively to the single-wall-mode assumption inherent in this formalism. Despite the 20 % discrepancy in the threshold, the $n/n_{\mathrm {crit}}$ parameter well separates the low and high VDE disruptivity discharges. The disruptivity feature located at $0.2\le n/n_{\mathrm {crit}}\le 0.4$ is not understood, but the statistics in these bins are poor, and therefore it is not considered significant. The evaluation of $n/n_{\mathrm {crit}}$ for the SPARC plasma, vacuum vessel and vertical stability plate system is underway, and a value less than one will be targeted.
Histogram of the disruptivity attributable to VDEs in C-Mod as a function of the stability metric  $|n|/n_{\mathrm {crit}}$. Error bars show the Poisson counting statistics. The bins at the extremes of the plot have errors of 100 %, and thus the bars exceed the lower limit of the logarithmic axis.
With an inverse aspect ratio of  $\epsilon =0.31$, SPARC V2 is designed with $\kappa _a = 1.75$. This region of phase space has been explored for ASDEX Upgrade and JET, and it appears that this elongation would be achievable in high-performance discharges. Nevertheless, as high elongation values are chosen for the V2 design, it is recognized that these might lie in a marginally stable operational space. A passive stability plate that is positioned between the vacuum vessel and the plasma should improve vertical control and allow operations at high elongation. The full plasma-conductor system including the vertical stability coils, the stability plates, the vacuum vessel and the poloidal field coils has been simulated using the Tokamak Simulation Code and was found to be stable (Jardin, Pomphrey & Delucia Reference Jardin, Pomphrey and Delucia1986), although further perturbative studies similar to Humphreys et al. (Reference Humphreys, Casper, Eidietis, Ferrara, Gates, Hutchinson, Jackson, Kolemen, Leuer and Lister2009) and analysis based on a linear simulation code are planned.
2.2 Tearing modes
The tearing mode is a resistive MHD instability driven by free energy in the current profile (referred to as a ‘classical tearing mode’) or in the pressure profile (referred to as a ‘neoclassical tearing mode’). These tearing modes differ in their onset as classical tearing modes are linearly unstable, requiring only an infinitessimal perturbation to initiate mode growth, whereas neoclassical tearing modes are linearly stable and nonlinearly unstable, requiring a perturbation or ‘seed island’ of a minimum amplitude. Tearing modes are deleterious, leading to a reduction in energy confinement (Chang & Callen Reference Chang and Callen1990) and a drag on the plasma due to resistive wall eddy currents that can brake the plasma and potentially cause locking (Nave & Wesson Reference Nave and Wesson1990) and disruptions (De Vries et al. Reference De Vries, Johnson, Alper, Buratti, Hender, Koslowski and Riccardo2011; Sweeney et al. Reference Sweeney, Choi, La Haye, Mao, Olofsson and Volpe2017). The dynamics of macroscopic classical and neoclassical tearing modes are described by the modified Rutherford equation (La Haye Reference La Haye2006):
 \begin{equation} \frac{\tau_r}{r}\frac{\mathrm{d}w}{\mathrm{d} t} = {\rm \Delta}'r + \epsilon^{1/2}(L_q/L_p) \beta_p(r/w) \left[ \frac{w^2}{w^2 + w_d^2} - \frac{w_{\mathrm{pol}}^2}{w^2} \right] + 2m \left( \frac{w_v}{w} \right)^2 \cos({\rm \Delta} \phi), \end{equation}
where  $\tau _r = 1.22^{-1}\mu _0 r^2/\eta$ is the local resistive time, $r$ is the minor radius, $w$ is the island width, ${\rm \Delta} 'r$ is the normalized classical stability index, $\epsilon$ is the local inverse aspect ratio, $L_q=q/(\mathrm {d}q/\mathrm {d}r)$ is the length scale of the safety factor profile, $L_p = -p/(\mathrm {d}p/\mathrm {d}r)$ is the length scale of the pressure profile (note the minus sign), $\beta _p$ is the local beta poloidal, $w_d$ and $w_\textrm {pol}$ are small island thresholds, $m$ is the poloidal harmonic, $w_v$ is the vacuum island width (due to externally imposed usually static resonant ‘error fields’) and ${\rm \Delta} \phi$ is the phase difference between O-points on the outboard midplane of the vacuum island and driven island. The Glasser, Greene and Johnson term sometimes included in the modified Rutherford equation accounts for the stabilizing effect of field line bending but is $(\epsilon /q)^2$ smaller than the neoclassical term and omitted here.
Figure 3 shows the boundary between island growth and decay as a function of the island width and the stability index in the SPARC V2 equilibrium. As the threshold physics is uncertain, the two threshold physics mechanisms are investigated separately by scanning the threshold island size within expected limits. The curves in figure 3(a) correspond to  $w_\textrm {pol}$ spanning from 1 to 11 times the trapped ion banana width $w_{ib}=\epsilon ^{1/2} (2 m_i k_B T_i/ e^2 B_\theta ^2)^{1/2}$. The curves in figure 3(b) correspond to values of $w_d$ spanning from 1 to 11 times the ion gyroradius, the upper value twice that expected in present low-field machines (left to right, respectively).
Boundaries between tearing growth ( $\dot {w}>0$) and decay ( $\dot {w}<0$) as a function of the island width $w$ and the stability index $r{\rm \Delta} '$ for the $m/n=2/1$ tearing mode in the SPARC V2 equilibrium. (a) Tearing growth regions according to the polarization current model. Solid and dotted curves show the cases where the polarization current is stabilizing and destabilizing, respectively. The polarization threshold island width is scanned from left to right with values $w_{\mathrm {pol}} = [0.3, 0.6, 0.9,\ldots 3.3]$ cm (red dashed line at $w_{\mathrm {pol}} =0.6$ cm). (b) Tearing growth regions according to the transport threshold model. Curves from left to right result from transport island widths with values $w_d=[0.15, 0.35, 0.55,\ldots 2.15]$ cm (red dashed line at $w_d = 0.36$ cm). (c) The theoretical (red dashed) prediction of the stability boundary including both thresholds; the components of the theoretical prediction are shown as red dashed curves in (a,b). Parameters evaluated at the $q=2$ surface: $\epsilon = 0.23$, $\beta _p=0.19$, $r=0.44$ m, $l_q = 0.17$ m, $l_p=0.18$ m, $w_{ib}=3$ mm, $w_v=0$.

The seed island threshold physics is of particular importance for the design of robustly tearing-stable discharges. The polarization threshold results from a rotation of the island relative to the plasma fluid outside of the island and becomes relevant when the seed island width exceeds the trapped ion banana width. This typically stabilizing polarization current provides the greatest tearing resilience as it increases the critical seed island width and suppresses the linear instability when  $r{\rm \Delta} '>0$, as shown by the solid curves in figure 3(a). Empirical evidence is consistent with the polarization current having a stabilizing effect and with a threshold $w_\textrm {pol}=2-3 w_{ib}$ (La Haye & Sauter Reference La Haye and Sauter1998); however, theory suggests the polarization current can be stabilizing or destabilizing (Wilson et al. Reference Wilson, Connor, Hastie and Hegna1996). The transport threshold island width $w_d = (L_s/k_\theta )^{1/2}(\chi _\perp /\chi _\parallel )^{1/4}$ is set by the size at which perpendicular density transport across the island $\chi _\perp$ is greater than the parallel transport $\chi _\parallel$, allowing the plasma to diffuse across the island interior thereby reducing the non-axisymmetric pressure flattening. The transport threshold is evaluated at the $q=2$ surface using the ion perpendicular transport $\chi _{\perp ,i}$ predicted by TRANSP (Rodriguez-Fernandez et al. Reference Rodriguez-Fernandez, Howard, Greenwald, Creely, Hughes, Wright, Holland, Lin and Sciortino2020) giving $w_d=3.6$ mm, smaller than the $1\text {--}2$ cm estimated in present-day experiments. The prediction for the tearing stability of the SPARC V2 flattop phase is shown in figure 3(c) including both theoretically predicted thresholds. The prediction is quite sensitive to seed island perturbations when $r{\rm \Delta} '$ is positive, leading to instability when the seed island width exceeds ${\sim }0.5$ cm.
Based on the curve in figure 3(c), two modes of tearing free operation are possible. The most robust tearing-free mode of operation (mode 1) requires a sufficiently stable classical stability index ( $r{\rm \Delta} ' \leq -3$) such that seed islands of any size will decay. The other mode of tearing-free operation (mode 2) allows for a moderately stable ( $-3 \leq r{\rm \Delta} ' \leq 0$) or even unstable ( $r{\rm \Delta} ' >0$) equilibrium and requires reducing the amplitude of seed island events, namely sawtooth and edge-localized modes, below the critical level. As megawatt-scale gyrotrons at frequencies above 300 GHz are not commercially available, the high field in SPARC precludes the use of electron cyclotron current drive for mode suppression, should a tearing mode appear. For robustness and simplicity, SPARC will aim to operate in tearing-free operation mode 1, requiring attention to the design of the equilibrium current profile. The current profile can be modified by early ion cyclotron range of frequency heating, adjusting the time of the L-H transition, varying the evolution of the plasma shape during ramp-up and adjusting the central solenoid ramp rate. Simulations will be used to find a recipe that maximizes classical tearing stability, similar to the empirical work done to stabilize the ITER Baseline Scenario at DIII-D (Turco et al. Reference Turco, Luce, Solomon, Jackson, Navratil and Hanson2018). Although the SPARC current profile is observed to relax to a steady state in simulation, aided in part by the sawtooth oscillations, the analytic resistive diffusion time of the equilibrium is much longer than the planned flattop duration, and thus it is expected that modifications to the outer regions of the current profile prior to H-mode access might be frozen-in for the duration of the discharge.
In addition to designing for tearing-free operation mode 1, future work will focus on sawtooth and edge-localized mode control techniques similar to those planned for the ITER tokamak (Hender et al. Reference Hender, Wesley, Bialek, Bondeson, Boozer, Buttery, Garofalo, Goodman, Granetz and Gribov2007).
2.3 Error field penetration locked modes
Error-field-driven locked modes are a type of tearing mode caused by ‘error fields’ resulting from as-designed errors and as-built errors including coil shifts, tilts, shape imperfections and uncompensated coil leads. These locked modes typically limit the low-density operation of a tokamak as they can lead to disruptions (Buttery et al. Reference Buttery, De Benedetti, Gates, Gribov, Hender, La Haye, Leahy, Leuer, Morris and Santagiustina1999; Wolfe et al. Reference Wolfe, Hutchinson, Granetz, Rice, Hubbard, Lynn, Phillips, Hender, Howell and La Haye2005). Error field penetration occurs when the braking torque induced by a resonant field overcomes the momentum input from viscous coupling with the bulk plasma, arresting the plasma flow in the vicinity of a rational surface. Theory predicts that this happens when the plasma rotation within the linear layer, a thin region about each rational surface where resistivity and inertia cannot be neglected, reduces to half of the ‘natural’ rotation frequency (Fitzpatrick Reference Fitzpatrick1998). Including the neoclassical toroidal viscosity caused by the non-resonant components of the error field increases the mass coupled with the mode and makes the plasma more resilient, with the critical field scaling linearly with  $n_e$ in agreement with experiment (Cole, Hegna & Callen Reference Cole, Hegna and Callen2007).
Alongside the error field penetration theory, many experimental studies have sought an empirical scaling law for the critical field based on the applied vacuum  $m/n=2/1$ field and the toroidally coupled 1/1 and 3/1 vacuum fields (Buttery et al. Reference Buttery, De Benedetti, Gates, Gribov, Hender, La Haye, Leahy, Leuer, Morris and Santagiustina1999; Wolfe et al. Reference Wolfe, Hutchinson, Granetz, Rice, Hubbard, Lynn, Phillips, Hender, Howell and La Haye2005). However, modelling the plasma sensitivity to error fields using the ideal perturbed equilibrium code shows that the plasma response dominates over the applied vacuum fields, and thus it is more important to reduce the error field component that is resonant with the most unstable plasma kink ( $q_{99} < m < 2q_{99}$) than the 1/1, 2/1 or 3/1 components (Park et al. Reference Park, Schaffer, Menard and Boozer2007). This kink-resonant field at the plasma surface that maximally drives resonant fields for error field penetration is referred to as the ‘dominant external field’, and the danger of any error field is assessed by its ‘overlap’ with the dominant external field. A large database of empirically optimized error field correction currents at DIII-D are shown in good agreement with the overlap criterion (Paz-Soldan et al. Reference Paz-Soldan, Buttery, Garofalo, Hanson, La Haye, Lanctot, Park, Solomon and Strait2014). Despite the successes of the first principles single dominant external field formalism, a notable experiment on the JET tokamak in Buttery et al. (Reference Buttery, Boozer, Liu, Park, Ferraro, Amoskov, Gribov, La Haye, Lamzin and Menard2012) was unable to appreciably correct an intrinsic error with a set of midplane correction coils that were expected to couple well to the dominant external field. In addition to the dominant external field, recent studies suggest that the ideal plasma response in some cases can be multi-modal (Paz-Soldan et al. Reference Paz-Soldan, Nazikian, Haskey, Logan, Strait, Ferraro, Hanson, King, Lanctot and Moyer2015; Logan et al. Reference Logan, Cui, Wang, Sun, Gu, Li, Nazikian and Paz-Soldan2018; Wang et al. Reference Wang, Logan, Munaretto, Liu, Sun, Gu, Park, Hanson, Hu and Strait2019) and plasmas also exhibit sensitivity to $n=2$ errors (Lanctot et al. Reference Lanctot, Park, Piovesan, Sun, Buttery, Frassinetti, Grierson, Hanson, Haskey and In2017; Logan et al. Reference Logan, Park, Hu, Paz-Soldan, Markovic, Wang, In, Piron, Piovesan and Myers2020).
The guidance for the critical error field above which locked modes are expected in SPARC is taken from the ITPA empirical scalings based on the overlap criterion (Logan et al. Reference Logan, Park, Hu, Paz-Soldan, Markovic, Wang, In, Piron, Piovesan and Myers2020), which gives the following critical overlap criterion:
 \begin{equation} \delta_{n=1} \leq 10^{-3.65 \pm0.03} n_e^{0.58\pm0.06}B_T^{-1.13\pm0.07}R_0^{0.10\pm0.07} \left( \frac{\beta_N}{l_i} \right)^{-0.20\pm0.05}. \end{equation}
 Using the equilibrium parameters for SPARC V2 (see table 1), the full-field L-mode scenario is found to be the most sensitive, with a penetration threshold of  $\delta _{n=1}=0.74\times 10^{-4}$, corresponding to a critical $n=1$ overlap field of ${\tilde {B}}_{n1o} = 9.0$ G. This field sensitivity is more than 40 % larger than the most sensitive plasma scenario planned for ITER (Gribov et al. Reference Gribov, Amoskov, Lamzin, Maximenkova, Menard, Park, Belyakov, Knaster and Sytchevsky2008). Note that the 9.0 G prediction is the amplitude of the field resonant with the most unstable kink ( $q_{99} < m < 2 q_{99}$), and is thus a conservative estimate for the amplitude of the total error field. Monte Carlo simulations will follow to assess the engineering tolerances implied by the 9.0 G field on the poloidal and toroidal field coils and their leads.
2.4 Error field correction coils
The ITPA scaling for  $n=1$ error field penetration in Ohmic plasmas predicts locked mode onset for overlap fields greater than $\delta _{\textrm {pen},n1} B_T = 9.0$ G when operating in the full-field L-mode scenario. Note that this corresponds to the amplitude of the dominant external field which has a poloidal spectrum concentrated between $q_{99} \leq m \leq 2 q_{99}$ at the normalized flux surface $\psi _N=0.99$. It is unlikely that the intrinsic error field will have identically this poloidal spectrum, and thus a higher total $n=1$ error field is likely acceptable. To prevent error field penetration, the component of the error field that overlaps with the dominant external field must be reduced well below 9.0 G. Further reductions will also be beneficial due to the reduced braking effect on the toroidal flow profile, with positive side effects for confinement and stability.
At this point we can make a reasonable estimate of the maximum allowable intrinsic error field. Correction of the intrinsic error will require real-time algorithms that respond to the changing currents in the control coils contributing most strongly to the error. It seems prudent that we assume these algorithms can predict the intrinsic error to no better than 50 % at all times, giving a real-time prediction error of  $\delta _\textrm {RT}=0.5$. This implies that 50 % of the intrinsic error field cannot be larger than 9.0 G, or equivalently, the intrinsic error must be less than 18 G. Note that this 18 G corresponds to the amplitude of the dominant external field, but for the sake of conservatism, we will assume that this is the amplitude of the total $n=1$ intrinsic error. Normalizing this intrinsic error by the toroidal field we find $1.8 \times 10^{-3} \ \mathrm {T}/12.2\ \mathrm {T} = 1.5 \times 10^{-4}$.
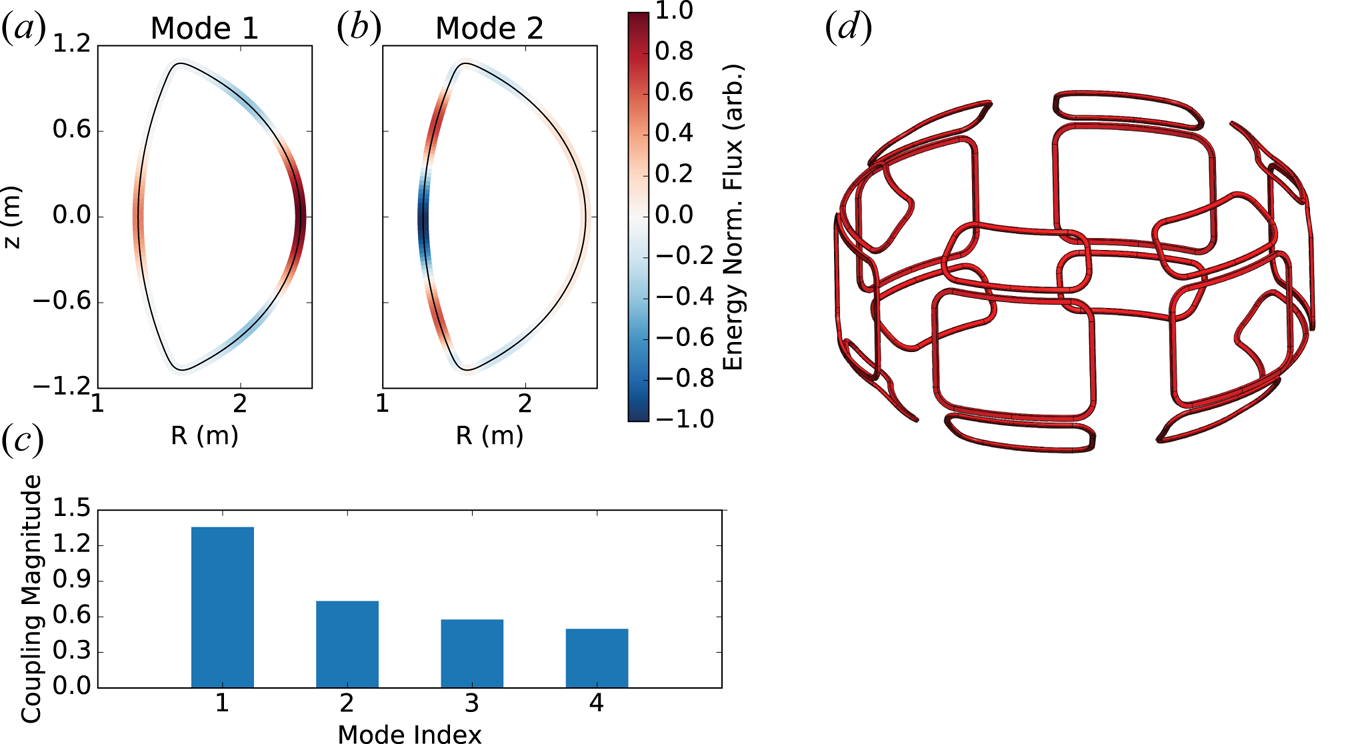
The dominant external field is assessed in the full-field H-mode using the general perturbed equilibrium code (GPEC) (Park et al. Reference Park, Boozer, Menard, Garofalo, Schaffer, Hawryluk, Kaye, Gerhardt and Sabbagh2009; Park & Logan Reference Park and Logan2017) and shown by the shaded boundary in figure 4(a). This mode structure concentrated about the outboard midplane (Park et al. Reference Park, Boozer, Menard and Schaffer2008) is a result of the beta-driven ideal plasma response (Paz-Soldan et al. Reference Paz-Soldan, Logan, Haskey, Nazikian, Strait, Chen, Ferraro, King, Lyons and Park2016) and is common to many devices, consistent with the success of the standard toroidal array of picture frame correction coils situated at the midplane. However, unlike present low-field machines, SPARC will access high plasma pressures at low  $\beta _N$, reducing the ballooning nature of the ideal kink response that localizes it to the low-field side, and thereby reduces the dominance of this single mode. The coupling of the second least-stable ideal kink response (figure 4b) to the core rational surfaces is only 50 % smaller than the first, as shown in figure 4(c), indicating that multi-mode error field correction might be important in SPARC. Also, the second mode is sensitive to inboard side errors, shown by the red and blue shaded regions in figure 4(b), and thus attention will paid to inboard side sources of errors in addition to the outboard errors. The plasma sensitivity to $n=2$ field errors is also assessed (see table 3) and $n=2$ error field correction is under consideration.
(a,b) The two dominant external field distributions at  $\phi =0$ as predicted by GPEC for the full-field H-mode scenario. (c) The coupling magnitude of these fields to the plasma, measuring the propensity for error field penetration by these field distributions. The mode index numbers the singular vector in the order of decreasing singular value. (d) A proposed error field correction coil set designed to couple to the two dominant external fields shown in (a).
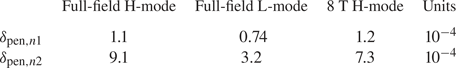
The toroidal field normalized penetration thresholds predicted by the ITPA scaling law (Logan et al. Reference Logan, Park, Hu, Paz-Soldan, Markovic, Wang, In, Piron, Piovesan and Myers2020) for  $n=1$ and $n=2$ fields during the flattop phase of the three main SPARC operating scenarios.
We target a coil design that can apply the dominant external field with an amplitude of at least 18 G, and that has the flexibility to continuously vary the toroidal phase of  $n=1$ and $n=2$ fields. A midplane row of picture frame coils is planned to couple to the dominant field. Second-order effects arising from the non-resonant neoclassical toroidal viscosity torque (Shaing & Callen Reference Shaing and Callen1983) can be addressed by adjusting the ratio of coil currents from the midplane and off-midplane correction coils. A first design of the SPARC error field correction coil set expected to address this physics and consistent with engineering constraints is shown in figure 4(c).
The required correction currents in the proposed error field correction coil set are estimated by assessing the coupling to the dominant field. This is performed by a spectral analysis of the correction fields and by computing the inner product with the dominant field. The mid-plane coil array is found to have a coupling efficiency of  $\mathcal {E}_c=25$ G kA $^{-1}\!\kern0.5pt\cdot$turns. To produce a correcting field $B_\textrm {cor}$ with an amplitude of 18 G using the midplane array only would require $I_c=B_\textrm {cor}/\mathcal {E}_c = 14$ kA $\cdot$turns. Providing a safety margin $\gamma _\textrm {mgn}=5$, the midplane coil array will be designed to carry $I_{c,\textrm {max}} \gamma _\textrm {mgn} = 70$ kA $\cdot$turns. This design process to determine $I_{c,\textrm {max}}$ for a given coil design is summarized by the following equation:
 \begin{equation} I_{c,\textrm{max}} = \frac{ \delta_\textrm{pen} B_T}{\delta_\textrm{RT} \mathcal{E}_c} \gamma_\textrm{mgn}.\end{equation}
As discussed above, and shown in (2.5), the maximum field (or current) that can be produced by the error field correction coil set is governed by the plasma sensitivity to the field, and not by the expected machine intrinsic error field. Instead, the sensitivity of the plasma to the intrinsic error, as predicted by the ITPA scaling, will be used to provide guidance on the allowable intrinsic error, and thereby the manufacturing and assembly tolerances. Monte Carlo simulations of many superpositions of coil tilts, shifts and shape errors will be performed to provide this engineering guidance, similar to the study performed for ITER (Gribov et al. Reference Gribov, Amoskov, Lamzin, Maximenkova, Menard, Park, Belyakov, Knaster and Sytchevsky2008).
3 Disruption dynamics and loading
Despite the complexity of disruption physics, many important characteristics pertaining to time scales, forces and heat fluxes can be approximated by empirical and physical scalings. This section investigates the natural disruption physics expected in SPARC. The state of the analysis herein reflects the SPARC design process, addressing those aspects that have affected design decisions taken to date. An exception to this is the topic of REs which has received considerable attention due to the potential threat they pose to the machine, and due to the uncertainty regarding how present-day RE avoidance and mitigation measures on existing machines will scale to SPARC.
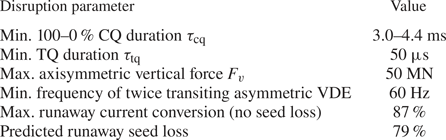
A summary of the zero-dimensional parameters describing the nature of disruptions in SPARC is presented in table 4. The analysis leading to these numbers is explained in detail in the following subsections.
A summary of extreme values for an unmitigated TQ and CQ in SPARC.
3.1 Thermal quench dynamics
In an unmitigated, or natural, disruption, the core plasma thermal energy is conducted and convected or radiated to the first wall on a time scale much shorter than the equilibrium energy confinement time. The thermal quench (TQ) generally results from a cooling of the edge plasma and a resulting contraction of the current profile that drives tearing modes unstable which overlap and produce stochastic fields, thereby destroying confinement. The initial edge cooling can result from pre-existing locked islands (Sweeney et al. Reference Sweeney, Austin, Brookman and Choi2018; Du et al. Reference Du, Shafer, Hu, Evans, Strait, Ohdachi and Suzuki2019), or from enhanced scrape off layer cross-field transport caused by reaching the density limit (Greenwald Reference Greenwald2002), or by an influx of high- $Z$ impurities that radiate the thermal energy through line emission (Izzo Reference Izzo2006; Sertoli et al. Reference Sertoli, Flannegan, Cackett, Hodille, De Vries, Coffey, Sieglin, Marsen, Brezinsek and Matthews2014). The loss of thermal energy leaves behind a cold, often impurity-rich plasma that still carries the equilibrium current; the current then begins decaying as the heightened resistivity converts magnetic to thermal energy. This stage is referred to as the current quench (CQ) which will be discussed in the following subsection.
Often a discharge will exhibit a pre-TQ where the plasma temperature begins to degrade from the edge inwards. This type of pre-TQ is characteristic of density limit disruptions, impurity injections and locked mode disruptions. The duration of this stage is of the order of a few to tens of milliseconds, during which time as much as 50 % of the thermal energy is lost. The TQ can occur either in two distinct stages or in one fast collapse. The two-part TQ collapses first in the core, followed later by an edge collapse (Wesson, Gill & Hugon Reference Wesson, Gill and Hugon1989; Schuller Reference Schuller1995). An empirical scaling for the TQ duration is depicted in figure 5, showing that the duration of the fast quench scales approximately with the plasma minor radius  $a$. With a minor radius of $a=0.57$ m, the fast TQ duration in SPARC might be as short as 50 $\mathrm {\mu }$s. It is notable that significantly faster TQs are observed in discharges with internal transport barriers in JET (Riccardo, Loarte & JET EFDA Contributors Reference Riccardo and Loarte2005), but internal transport barriers are not expected in the SPARC H-mode. Interestingly, figure 5 shows that Alcator C-Mod (labelled in the original plot as Alcator-C, though the minor radius indicates this is in fact Alcator C-Mod) is an outlier, possibly related to TQ physics that depends on the toroidal field, suggesting the TQ in SPARC might be as long as 1 ms.
Thermal quench times  $\tau _{1\text {--}2}$ (delay between initial and final quench) and $\tau _2$ (fast quench) for various tokamaks, plotted as a function of minor radius. Note that the points labelled Alcator-C are actually Alcator C-Mod as evidenced by the minor radius. Reproduced with IAEA permission © IAEA [1999] from ITER Physics Expert Group (1999).

Although the single fast TQ may not be the most common disruption evolution in SPARC, at least a limited number of these high-heat-flux events will be assumed in the design of the plasma-facing components.
3.2 Current quench dynamics
In the post-TQ plasma the electron temperature is of the order of a few to tens of eV, making the plasma relatively resistive. The loop voltage that was previously sufficient to sustain the plasma current can no longer balance the power lost through Ohmic heating and thus the current begins to decay. The loop voltage increases due to the changing poloidal flux, thus facilitating the transfer of poloidal magnetic energy to thermal energy of the plasma. In rare cases, the plasma can reheat and the CQ can be avoided (Sweeney et al. Reference Sweeney, Austin, Brookman and Choi2018; Reinke et al. Reference Reinke, Scott, Granetz, Hughes and Baek2019), indicating the reemergence of confining flux surfaces and the absence of a high impurity density. In the majority of cases, the plasma remains cold due to a impurity radiation sink and/or the persistence of stochastic fields that provide a conduction and convection energy sink.
Analogous to a circuit with an inductor and a resistor, the plasma current decay time  $\tau _\mathrm {cq}$ is well approximated by the $L/R$ time. Assuming an approximately constant CQ temperature across devices, it can be shown that the $L/R$ time scales like $\kappa _a a^2$ for machines with comparable aspect ratio (ITER Physics Expert Group 1999). In the 2007 ITER Physics Basis (IPB) (Hender et al. Reference Hender, Wesley, Bialek, Bondeson, Boozer, Buttery, Garofalo, Goodman, Granetz and Gribov2007), the CQ duration normalized by the cross-sectional area for conventional aspect ratio machines is plotted and shown here in figure 6. A lower bound on the normalized CQ duration is found at 1.8 ms m $^{-2}$ and used to extrapolate to ITER. Since the 2007 IPB, the data analysis has been improved, ensuring a consistent definition of the CQ duration, and a new lower limit of 1.67 ms m $^{-2}$ is found (Eidietis et al. Reference Eidietis, Izzo, Commaux, Hollmann, Shiraki, Eidietis, Izzo, Commaux, Hollmann and Shiraki2017). The scaling is now given by
 \begin{equation} \frac{\tau_\mathrm{cq}}{S} = \frac{t_{\textrm{cq},20} - t_{\textrm{cq},80}}{0.6 ({\rm \pi} \kappa_a a^2)} = 1.67~\textrm{ms m}^{-2}, \end{equation}
where  $t_{\textrm {cq},80}$ and $t_{\textrm {cq},20}$ are the times when the current reaches 80 % and 20 % of the flattop value (Eidietis et al. Reference Eidietis, Izzo, Commaux, Hollmann, Shiraki, Eidietis, Izzo, Commaux, Hollmann and Shiraki2017). This expression gives the full 100 %–0 % extrapolated linear current decay time. For SPARC V2 we have $\tau _\mathrm {cq}>1.67 {\rm \pi}\kappa _a a^2$ ms = 3.0 ms. The C-Mod data in figure 6 do not quite approach the same threshold, but rather remain above 2.5 ms m $^{-2}$. The higher current density in C-Mod relative to the other machines, scaling like $B_T/R$, might explain the longer CQ duration as a hotter CQ plasma is less resistive; this might also be expected in SPARC. Using the higher threshold of 2.5 ms m $^{-2}$, the decay time increases to $\tau _\mathrm {cq}=4.4$ ms. For conservatism, the CQ duration of 3.0 ms is used as input to the engineering design.
Current quench time scaled to poloidal cross-sectional area over many machines of different sizes. Data are calculated using the 80 %–20 % averaged decay rate and extrapolated to the 100 %–0 % linear decay of the plasma current. A simple lower limit is shown matching most tokamaks, though C-Mod does not reach this limit, suggesting that high-field and high-current-density machines including SPARC might expect longer CQs (i.e. 2.5 ms m $^{-2}$ as compared to 2 ms m $^{-2}$). Reproduced with IAEA permission © IAEA [2004] from Sugihara et al. (Reference Sugihara, Lukash, Kawano, Khayrutdinov, Miki, Mineev, Ohmori, Ohwaki, Humphreys and Hyatt2004).

3.3 Eddy currents
Eddy currents result when the magnetic flux through a conducting structure changes on a time scale comparable to, or shorter than, the resistive diffusion time of the structure. Simple analytic formulae of the forces due to eddy currents are derived here to guide the general feasibility and design of components, whereas detailed finite element simulations allow the high-fidelity validation of already designed components.
The principal concern among the eddy current forces predicted for ITER is a circulating current in the first-wall blanket modules (Sugihara et al. Reference Sugihara, Shimada, Fujieda, Gribov, Ioki, Kawano, Khayrutdinov, Lukash and Ohmori2007) resulting in a torque that can approach engineering limits. This torque is not specific to the design of the ITER blanket modules but is rather a general phenomenon for any first-wall component that is discontinuous in both the toroidal and poloidal directions. In appendix A we derive a simple approximation of this torque to characterize its dependencies and to inform first-wall component design in SPARC, and here we quote the result.
A circulating current in a discrete component has inward and outward radial components that cross with the toroidal field, giving the following force:
 \begin{equation} F_{\theta} = I_p B_T w \frac{{\rm \Delta} \theta}{2 {\rm \pi}} \end{equation}
and torque
 \begin{equation} \tau = F_{\theta} {\rm \Delta} \phi R_c, \end{equation}
where  $w$ is the dimension of the component normal to the wall, ${\rm \Delta} \theta$ and ${\rm \Delta} \phi$ are the poloidal and toroidal angles subtended by the component and $R_c$ is the major radius where the component is fixed. These equations are applicable to sets of components that are closely spaced and form poloidal arrays like first-wall tiles, or the ITER blanket modules. Taking ITER values (see table 5) we find $F_\theta = 1.3$ MN which is ${\sim }50\,\%$ larger than the force found for inboard side blanket modules in DINA simulations coupled to a finite element solver (see Sugihara et al. Reference Sugihara, Shimada, Fujieda, Gribov, Ioki, Kawano, Khayrutdinov, Lukash and Ohmori2007, figure 8). Equations (3.2) and (3.3) are considered sufficient for order-of-magnitude estimates.
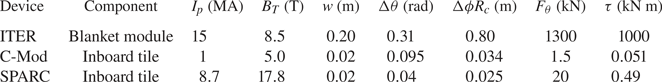
The expected torque on an inboard side first-wall tile in SPARC is calculated and shown in table 5, together with the same calculation for the inboard side tiles in Alcator C-Mod. The strong dependence on the volume of the component is demonstrated by comparing the torque on the ITER blanket module with an inboard tile in SPARC. Despite the product of  $I_p$ and $B_T$ in SPARC exceeding the same product in ITER by 20 %, the order-of-magnitude difference in each dimension of the components leads to torques that differ by more than three orders of magnitude. The SPARC tiles benefit from small dimensions; however, larger components like the ion-cyclotron-range-of-frequencies antennas may be subject to a large eddy current torque, and will be engineered to withstand this loading.
These equations show that the torque on a component that comprises a poloidal array, like a first-wall tile, is minimized by reducing the linear dimensions normal to the wall and in the toroidal direction, and by minimizing the subtended poloidal angle of the component. Generally, small components or toroidally continuous components are desirable for reducing this force resulting from circulating eddy currents. Note that the analysis above assumes the resistive diffusion time of the component is much longer than the CQ duration (i.e.  $\tau _c \gg \tau _\mathrm {cq}$). Another method to reduce these forces is to reduce the resistive diffusion time such that $\tau _c \ll \tau _\mathrm {cq}$, as the force goes to zero in this limit.
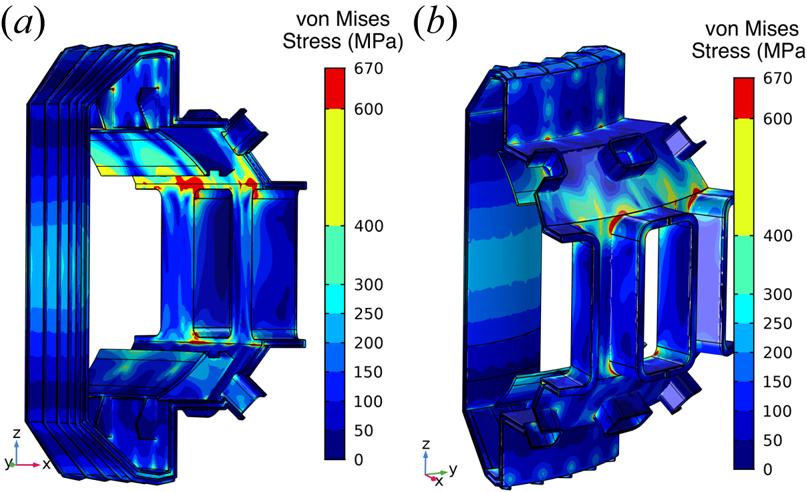
In addition to the strong eddy current forces resulting from modular components, continuous components like the vacuum vessel can also experience strong eddy current forcing when toroidal current paths are interrupted and forced to flow poloidally. As access to the plasma is required for radio frequency heating and diagnostics, ports in the vessel cause toroidal eddy currents to deviate in the poloidal direction which greatly increases the forcing. Eddy current forcing analysis was performed for an early version of the vacuum vessel. The analysis was done on a 1/9 $\mathrm {th}$ (two-port) model to capture the inter-port current structure, and a full current on-axis disruption at flattop with a 3 ms linear ramp down was simulated. Following preliminary simulations, it was clear that external gussets were required to support the eddy current loading of the outer wall and ports. The results of the von Mises stress analysis of the vessel following addition of the gussets is shown in figure 7. Some localized high-stress areas exist, but these will be addressable with modest changes. The majority of the von Mises stresses are below 250 MPa which is within the allowable loading of vessel materials being considered. With continued attention to the impact of eddy current forces on the design of the vessel and the design of first-wall components, the SPARC device is expected to withstand the highest predicted eddy current loading.
Snapshot of electromechanical COMSOL time-dependent simulation of an on-axis CQ and associated eddy current stresses driven in an early version of the SPARC vacuum vessel. Snapshot is at the end of a 3 ms linear current ramp down. Shown is a 1/9 $\textrm {th}$ model of vacuum vessel with the von Mises stresses which are below the maximum of 800 MPa. The engineering design has progressed, using these simulations, to a vacuum vessel with acceptable stresses.
3.4 Vertical displacement events and halo currents
When vertical stability is lost, the plasma drifts vertically on the resistive diffusion time of the vessel or of nearby conductors such as ‘vertical stability plates’ which are designed to slow the motion of the plasma. When the plasma contacts the first wall and forms a ‘wetted area’, some plasma current completes part of its path in the wall and this current is referred to as a halo current (Strait et al. Reference Strait, Lao, Luxon and Reis1991). The conducting electrons in the first-wall material are not magnetized and therefore take the path of least resistance between the in-flowing and out-flowing regions of the wetted area (Granetz et al. Reference Granetz, Hutchinson, Sorci, Irby, LaBombard and Gwinn1996; Tinguely et al. Reference Tinguely, Granetz, Berg, Kuang, Brunner and Labombard2018). This current path often flows in the poloidal direction such that it interacts with the toroidal field and generates strong forces. Halo current resistive heating can also be a melt concern for first-wall components.
Peak halo currents can reach 60 % of the flattop current in the toroidally symmetric case, as shown in figure 8, and these higher halo currents are usually observed in plasmas with lower  $q_{95}$ (Granetz et al. Reference Granetz, Hutchinson, Sorci, Irby, LaBombard and Gwinn1996). Toroidal peaking factors (TPFs), defined as the maximum halo current density over the toroidal average, up to 5 are possible. However, the fraction of plasma current going into the halo current is reduced so that the maximum halo current density is constant, i.e. $\text {TPF} \times I_{\textrm {halo}}/I_{\textrm {plasma}} \approx \text {constant}$. For SPARC V2 we have a maximum symmetric halo current of $I_{\textrm {halo}} = 0.6 (8.7 \textrm { MA}) = 5.2$ MA. A simple approximation for the pressure from the halo current is
 \begin{equation} P(R) = \frac{I_\textrm{halo}B_0 R_0}{2{\rm \pi} R^2}, \end{equation}
which is 5.5 MPa at the major radius of the plasma magnetic axis.
(a) The TPF as a function of fraction of halo to plasma current, produced based on the same database and in likeness to figure 6 of Eidietis et al. (Reference Eidietis, Gerhardt, Granetz, Kawano, Lehnen, Lister, Pautasso, Riccardo, Tanna and Thornton2015). (b) Probability density function based on the data in (a).

The axisymmetric net vertical force on the vessel is bounded by the destabilizing vertical force on the plasma in the quadrupolar field (Miyamoto Reference Miyamoto2011). The radial field produced by the poloidal field coil system during the plasma flattop is calculated and the maximum vertical excursion of a full current plasma with a flat  $q=1$ profile is estimated to be $|{\rm \Delta} Z|\approx 0.5$ m. The radial field averaged over the displaced plasma is $B_R\approx 0.5$ T, giving an axisymmetric vertical force of $F_{pc}^\textrm {max}=2{\rm \pi} R I_p B_T = 50$ MN ( $F_{pc}^\textrm {max}$ is the maximum force between the plasma and poloidal field coils, following the notation in Miyamoto (Reference Miyamoto2011)). Note that this maximum force is only attained during a VDE in the limit when $\tau _{L/R} \ll \tau _{\textrm {cq}}$, or when $\tau _{L/R} \ll \tau _\textrm {VDE}$, where $\tau _{L/R}$ is the resistive diffusion time of the vessel and $\tau _\textrm {VDE}$ is the VDE time scale (note that here the CQ time scale begins at the end of the VDE phase, such that the full disruption time is $\tau _\textrm {VDE} + \tau _{\textrm {cq}}$). Neither of these limits are commonly attained in disruptions, and therefore a further attenuation of the 50 MN vertical force like that observed in M3D-C1 simulations of ITER VDEs (Clauser, Jardin & Ferraro Reference Clauser, Jardin and Ferraro2019) is expected. These halo current force estimates are being used to engineer the vacuum vessel. Nonlinear MHD simulations are planned using a realistic first wall to resolve this axisymmetric force, and to identify contact points and halo current paths.
Halo currents can develop toroidal asymmetries that generate strong lateral impulses in large tokamaks. The location of the asymmetry often rotates toroidally during the disruption, which can lead to dynamically amplified forces if the halo currents complete 2–3 full rotations at a frequency that resonates with critical machine components (usually of the order of 10 Hz). Following the analysis in Myers et al. (Reference Myers, Eidietis, Gerasimov, Gerhardt, Granetz, Hender and Pautasso2018), the expected number of full toroidal rotations of a halo current asymmetry can be calculated using multi-machine scalings of the rotation frequency and the halo current rotation duration. The rotation scaling from Myers et al. (Reference Myers, Eidietis, Gerasimov, Gerhardt, Granetz, Hender and Pautasso2018) is used to predict the intrinsic rotation using the SPARC V2 design variables. Figure 9, which is analogous to figure 14 of Myers et al. (Reference Myers, Eidietis, Gerasimov, Gerhardt, Granetz, Hender and Pautasso2018), shows that halo current rotation may be damaging if SPARC has any critical machine or system resonances above 60 Hz. Analysis similar to those for JET (Riccardo, Walker & Noll Reference Riccardo, Walker and Noll2000) or ITER (Schioler et al. Reference Schioler, Bachmann, Mazzone and Sannazzaro2011) will be conducted to verify that all machine resonances are below 60 Hz.
Projected non-axisymmetric halo current behaviour in terms of rotation duration versus rotation count, as scaled from the tokamak database in Myers et al. (Reference Myers, Eidietis, Gerasimov, Gerhardt, Granetz, Hender and Pautasso2018). The plot is presented in a way that facilitates direct comparison with the ITER projection in that reference, where the shaded parallelogram and its unshaded extension represent the projected rotation ranges for the lower and upper bounds of the minimum CQ time, respectively.

As the details of the electromechanical loading on the vacuum vessel and attached components depend on the actual design, it will be necessary to perform multi-physics analysis of the effects of disruption eddy and halo currents. Such analyses were previously done for the Alcator C-Mod hot divertor (Doody et al. Reference Doody, Lipschultz, Granetz, Beck and Zhou2014) and for EAST (Doody et al. Reference Doody, Granetz, Yao, Beck, Zhou, Zhou, Cao, Xia, Vieira and Wukitch2015).
3.5 Runaway electrons
Runaway electron generation could be significant during disruptions of SPARC plasmas. In particular, high plasma temperatures ( $\langle T_{e} \rangle \sim 10\ \textrm {keV}$) can lead to significant ‘hot-tail’ generation, as energetic electrons remain hot during the TQ and accelerate to relativistic speeds. In addition, high plasma currents ( $I_{p} = {8.7}\ \textrm {MA}$) can lead to significant avalanching through knock-on collisions of REs with bulk electrons. In this section, we first model the evolution of the RE current $I_{r}$ for a range of TQ scenarios with the coupled fluid-kinetic solver GO+CODE (Hoppe et al. Reference Hoppe, Hesslow, Embreus, Unnerfelt, Papp, Pusztai, Fülöp, Lexell, Lunt and Macusova2020). Because these simulations include the full hot-tail generation, but do not include particle transport or losses, they are conservative. In the second part of this section, we investigate the loss of the RE seed during a TQ with NIMROD. Because the REs are only test particles in these simulations, they are optimistic. Future work will integrate the two approaches.
Within GO+CODE, the fluid solver GO (Smith et al. Reference Smith, Helander, Eriksson, Anderson, Lisak and Andersson2006; Fülöp et al. Reference Fülöp, Helander, Vallhagen, Embreus, Hesslow, Svensson, Creely, Howard and Rodriguez-Fernandez2020) self-consistently evolves the one-dimensional RE current density  $j_{r}$ and electric field diffusion, while the kinetic solver CODE (Landreman, Stahl & Fülöp Reference Landreman, Stahl and Fülöp2014; Stahl et al. Reference Stahl, Embréus, Papp, Landreman and Fülöp2016) evolves the two-dimensional RE momentum-space distribution function $f(v_{\parallel },v_{\perp })$. Inputs include profiles of the pre-TQ electron density and temperature, elongation and current density as shown in Rodriguez-Fernandez et al. (Reference Rodriguez-Fernandez, Howard, Greenwald, Creely, Hughes, Wright, Holland, Lin and Sciortino2020). The TQ is modelled as an exponential decay, with time constant $\tau _\mathrm {tq}$, from initial to final temperature profiles; the latter is taken to be spatially uniform in these simulations, i.e. $T_f(r) = T_f$. Due to SPARC's high current density, we expect the post-TQ temperature to remain relatively hot, e.g. $T_f \approx {10\text {--}20}\ \textrm {eV}$. The density profile also remains constant throughout the simulation, $n_{e}(r,t) = n_{e}(r)$, to approximate an influx of impurities.
Results from GO+CODE simulations of SPARC V2 disruptions are shown in figure 10. As expected, plasma-to-runaway (or pre- to post-disruption) current conversion  $I_{r}/I_{p}$ decreases as $\tau _\mathrm {tq}$ increases (figure 10a) and when power losses, e.g. bremsstrahlung and synchrotron radiation, are included (figure 10b). Although not shown here, $I_{r}/I_{p}$ also decreases as $T_f$ increases. Here, the worst-case scenario occurs when $\tau _\mathrm {tq} = {0.1}\ \textrm {ms}$ and $T_f = {20}\ \textrm {eV}$: almost 90 % of the pre-disruption current is converted into RE current ( $I_{r} \approx {8}\ \textrm {MA}$). A more hopeful scenario is illustrated in figure 10(a); when $\tau _\mathrm {tq} = {1}\ \textrm {ms}$ and $T_f = {20}\ \textrm {eV}$, the current conversion is $\sim$40 % ( $I_{r} \approx {4}\ \textrm {MA}$). However, note again that these GO+CODE simulations did not include particle transport via drifts, disruption MHD, etc., which are explored next. Due to the high level of magnetic fluctuations during the TQ, a large part of the hot-tail seed is expected to be deconfined, and this effect has been neglected here. Simulations with GO+CODE show that taking into account all the hot-tail electrons overestimates the final runaway current by a factor of approximately four in ASDEX Upgrade (Hoppe et al. Reference Hoppe, Hesslow, Embreus, Unnerfelt, Papp, Pusztai, Fülöp, Lexell, Lunt and Macusova2020). Therefore we expect that the runaway conversion will be much lower than what was presented above.
Evolution of the total (solid) and runaway (dotted) currents during disruptions of a SPARC V2 plasma simulated with GO+CODE. (a) For a final temperature  $T_f = {20}\ \textrm {eV}$, the plasma-to-runaway current conversion ( $I_{r}/I_{p}$) percentage decreases as the TQ time $\tau _\mathrm {tq}$ increases. (b) For $\tau _\mathrm {tq} = {0.1}\ \textrm {ms}$ and $T_f = {20}\ \textrm {eV}$, $I_{r}/I_{p}$ decreases when power losses are included; however, particle losses have not yet been included.

NIMROD simulations with two SPARC V0 equilibria ( $R_0=1.65$ m, $B_T=12$ T, $I_p=7.5$ MA), comparable to those for Alcator C-Mod, DIII-D and ITER in Izzo et al. (Reference Izzo, Hollmann, James, Yu, Humphreys, Lao, Parks, Sieck, Wesley and Granetz2011), were also carried out. A major finding of that study was a strong $R^3$ dependence of RE confinement on major radius, with ITER retaining all test REs, DIII-D losing a fraction of REs and C-Mod confining no REs during the TQ-induced MHD. We would expect SPARC therefore to be most comparable to DIII-D, and in fact a simulation with a SPARC double null divertor equilibrium shows many similarities to the DIII-D cases in Izzo et al. (Reference Izzo, Hollmann, James, Yu, Humphreys, Lao, Parks, Sieck, Wesley and Granetz2011), retaining only 21 % of the seed RE population (figure 11). A second simulation used a SPARC equilibrium with a very strong pressure peak near the axis, and a corresponding large current density gradient near the centre. This simulation produced unusually large TQ MHD, with $\delta B/B>10^{-2}$. The result was 100 % loss of seed REs in this simulation. Whether this current and pressure profile is realistic, the results of the simulation show that MHD fluctuations of this magnitude can successfully deconfine the entire runaway population. Note that these initial seed REs were randomly distributed uniformly over the closed flux region.
NIMROD simulation of RE confinement during a TQ ( $\tau _\mathrm {tq} \approx {0.5}\ \textrm {ms}$) of a double null divertor SPARC V0 equilibrium: (a) total number of confined REs versus time (launched at $t = {0.43}\ \textrm {ms}$), (b) average energy of confined REs, (c) Poincaré field line plot at ${0.7}\ \textrm {ms}$ and (d) magnetic field amplitudes of $n = 1$–5 toroidal modes normalized by $n = 0$ versus time.
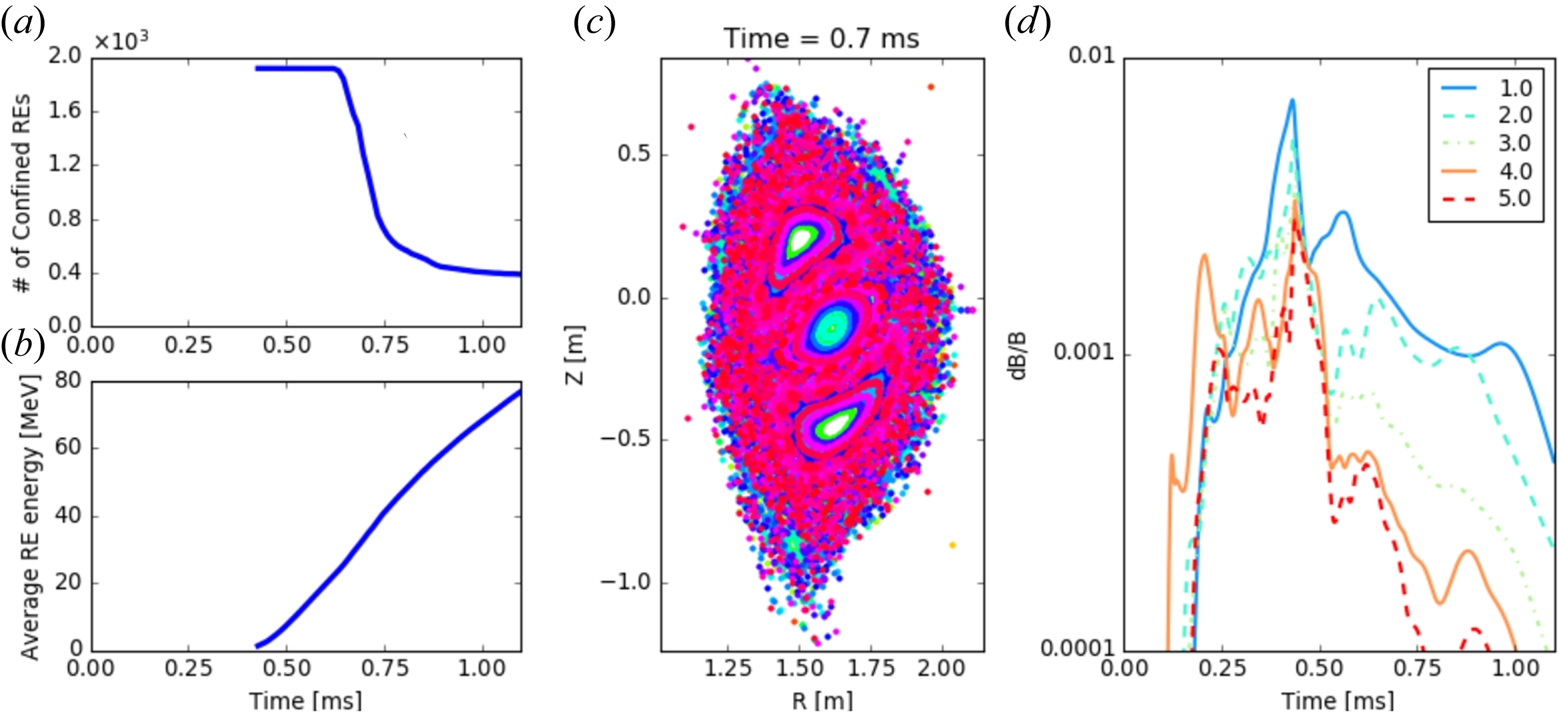
4 Disruption statistics, mitigation and prediction
4.1 Disruption statistics
A global view of the expected disruptivity in SPARC is provided by a disruption statistical analysis by De Vries, Johnson & Segui (Reference De Vries, Johnson and Segui2009) of the JET tokamak. JET has a similar aspect ratio to SPARC and has a broad operating space that well encompasses in a dimensionless sense the SPARC operating space. A summary of the predicted disruptivity, defined as the number of disruptions per second, for four disruption-relevant parameters is shown in table 6. The disruptivities are evaluated using two-dimensional analyses, and thus two disruptivities are reported for the four normalized parameters. The highest disruptivity with a value between 0.01 and 0.1  $\textrm {s}^{-1}$ results from a stability boundary on $\epsilon l_i/q_\textrm {cyl}$, where $\epsilon =a/R$ is the inverse aspect ratio, $a$ and $R$ are the plasma minor and major radii, $l_i$ is the internal inductance, $q_\textrm {cyl} = 2{\rm \pi} \epsilon a B_T/\mu _0 I_p$, $B_T$ is the toroidal field at the magnetic axis and $I_p$ is the plasma current. This parameter is closely related to $l_i/q_{95}$ ( $q_{95}$ is the safety factor at the 95 % poloidal flux surface) that numerical and experimental works have related to the tearing mode classical stability index ${\rm \Delta} '$ (Cheng, Furth & Boozer Reference Cheng, Furth and Boozer1987; Sweeney et al. Reference Sweeney, Choi, La Haye, Mao, Olofsson and Volpe2017). Additional margin to this boundary can be afforded by reducing the plasma current or broadening the current profile to reduce $l_i$. Assuming the low end of this disruptivity range can be achieved by attention to the plasma current profile, as discussed in § 2.2, the predicted disruptivity based on dimensionless matching is 0.01 s $^{-1}$, or one disruption in every ten 10 s discharges. It is notable that the disruption rate, defined as the fraction of discharges that disrupt, is lower when JET operates with DT fuel owing to ‘careful operations using well tested or standard scenarios’ (De Vries et al. Reference De Vries, Johnson and Segui2009). Therefore, lower disruptivities than those reported in table 6, which are based on many diverse experimental campaigns, might be expected in SPARC. Nevertheless, SPARC is conservatively engineered assuming a 10 % disruption rate during the full-field H-mode operation, consistent with the above predictions. Further, the machine will be designed to withstand disruptions without mitigation in 10 % of disruptive discharges.
Normalized parameters relevant to disruption boundaries together with the reported disruptivities (i.e. disruptions per second) in JET (De Vries et al. Reference De Vries, Johnson and Segui2009). See the text for definitions of the normalized parameters.
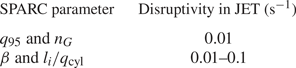
4.2 Disruption mitigation
In this section, mitigation of each aspect of the disruption is discussed. A summary of parameters relevant to disruption mitigation is given in table 7.
Parameters relevant to mitigation of the highest thermal and magnetic energy discharges in SPARC.
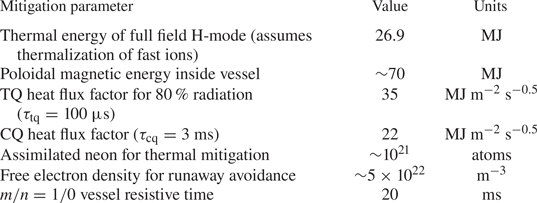
4.2.1 Thermal quench mitigation
Thermal quench mitigation is intended to reduce the heat flux on the divertor by radiating the energy across the first wall. Even when the thermal energy is fully radiated, melt limits can still be exceeded if the radiation is too localized, and this localization is quantified by the peak heat flux over the average, both evaluated at the wall, and referred to as the peaking factor (PF). Since the TQ time in SPARC is expected to be much shorter than the heat conduction time into the first-wall tiles, the heat equation can be solved in a semi-infinite slab of the first-wall material subject to a surface heat pulse. The resulting condition on the PF is given by (Olynyk Reference Olynyk2013)
 \begin{equation} \mathrm{PF} \leq (T_{\mathrm{lim}} - T_{0,\mathrm{fw}}) \sqrt{{\rm \pi} \kappa \rho C_p} \sqrt{\tau_\mathrm{tq}} \frac{A_{\mathrm{fw}}}{f_{\mathrm{tq}} W_{\mathrm{th}}}, \end{equation}
where  $T_{\mathrm {lim}}$ is the melting or sublimation temperature of the first-wall material, $T_{0,\mathrm {fw}}$ is the pre-disruption temperature of the wall, $\kappa$ is the heat conductivity, $\rho$ is the mass density, $C_p$ is the heat capacity per unit mass, $\tau _\mathrm {tq}$ is the TQ duration, $A_{\mathrm {fw}}$ is the area of the first wall, $W_{\mathrm {th}}$ is the pre-disruption plasma thermal energy and $f_{\mathrm {tq}}$ is the fraction of the thermal energy dissipated during the TQ.
For 80 % radiated power (i.e.  $f_\mathrm {tq}=0.8$), the heat flux factor for an isotropically radiated TQ is 35 MJ m $^{-2}$ s $^{-1/2}$ assuming the area of the first wall is $4 {\rm \pi}^2 R_0 a \sqrt {(1 + \kappa _a^2)/2} = 62$ m $^2$, the total thermal energy from TRANSP V2 simulations assuming thermalization of the fast ion energy (Rodriguez-Fernandez et al. Reference Rodriguez-Fernandez, Howard, Greenwald, Creely, Hughes, Wright, Holland, Lin and Sciortino2020) is $W_{\mathrm {th}}=26.9$ MJ and the TQ duration $\tau _\mathrm {tq}=0.1$ ms. Taking the initial temperature of the component to be 600 K and made of tungsten, a radiation PF greater than 2.5 will cause melting, according to the semi-infinite slab model. The tolerable PFs for common materials that might be found inside the vessel and subject to these same conditions are summarized in table 8. Note that tiles in SPARC will likely be made of tungsten or graphite, while the other metals are included for comparison or because they may be used for other in-vessel structures that may see a disruptive radiation heat load (e.g. the vacuum vessel wall or RF antenna).
Estimations of the maximum allowable PF to avoid melting with a TQ duration of  $\tau _\mathrm {tq}=100\ \mathrm {\mu }$s, a thermal energy of $W_{\mathrm {th}}=26.9$ MJ, a first-wall area of $A_{\mathrm {fw}}=62$ m $^2$ an initial first-wall temperature of $T_{0,\mathrm {fw}}=600$ K, and room temperature thermal properties for all materials. A PF less than one, as is the case for steel 316, indicates melting even for isotropic radiation.
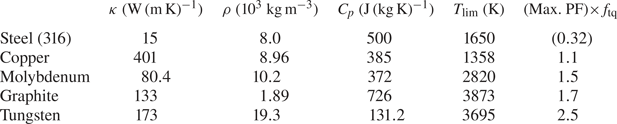
The radiation peaking in the toroidal direction, or TPF, following massive gas injection (MGI) of various high- $Z$ noble gases is reported in Alcator C-Mod (Olynyk Reference Olynyk2013), DIII-D (Shiraki et al. Reference Shiraki, Commaux, Baylor, Eidietis, Hollmann, Izzo, Moyer and Paz-Soldan2015), JET (Lehnen et al. Reference Lehnen, Gerasimov, Jachmich, Koslowski, Kruezi, Matthews, Mlynar, Reux and De Vries2015b) and ASDEX-U (Pautasso et al. Reference Pautasso, Bernert, Dibon, Duval, Dux, Fable, Fuchs, Conway, Giannone and Gude2017), and in all cases the TPF is around 2 or less. The full PF is the product of the TPF and the poloidal peaking factor (PPF), PF=TPF $\times$PPF. While there are many studies of the TPF following MGI, the authors are aware of only one study where the PPF is quantified (Eidietis et al. Reference Eidietis, Izzo, Commaux, Hollmann, Shiraki, Eidietis, Izzo, Commaux, Hollmann and Shiraki2017), and it is found to lie in the range $\textrm {PPF}=1.6$–2.2. Therefore, a total PF in the vicinity of 4 might be expected following MGI in SPARC. It should be noted that lower PFs are generally observed at higher thermal energies, which might reduce the predicted PF.
Mitigation of the TQ and CQ, and avoidance and mitigation of REs all put constraints on the type, quantity and possibly the method of material injection. A simple, physically motivated zero-dimensional scaling law suggests that the required number of neon atoms for full TQ mitigation  $n_\textrm {Ne,crit}$ scales like $n_\textrm {Ne,crit} \propto \sqrt {W_{\mathrm {th}} V_p/R}$ ( $W_{\mathrm {th}}$ is the pre-disruption thermal energy, $V_p$ is the plasma volume and $R$ is the major radius) and predicts that the order of $10^{21}$ assimilated neon atoms are required for full TQ mitigation in SPARC (Lehnen et al. Reference Lehnen2017). This number is expected to be reduced for higher- $Z$ noble gases; however, higher- $Z$ gases might raise the CQ electric field and provide more electrons for avalanche multiplication (Vallhagen et al. Reference Vallhagen, Embreus, Pusztai, Hesslow and Fülöp2020). Until further analysis can be done, we assume that the mitigation gases will be neon and a low- $Z$ gas such as hydrogen, deuterium or helium. Estimates of the assimilation following MGI range from 5 % to 50 % (Commaux et al. Reference Commaux, Baylor, Combs, Eidietis, Evans, Foust, Hollmann, Humphreys, Izzo and James2011; Pautasso et al. Reference Pautasso, Mlynek, Bernert, Mank, Herrmann, Dux, Müller, Scarabosio and Sertoli2015). Therefore, we prepare to inject of the order of $10^{22}$ neon atoms via MGI or shattered pellet injection (SPI) for TQ mitigation, which are fairly routine injection quantities for present-day machines.
Finally, burning plasmas introduce a new consideration for thermal mitigation relative to present-day machines, due to the energy that is stored in the fusion alpha particles and the ICRF generated fast ions that require a slowing down time before their energy can be radiated by impurities. In the SPARC H-mode, this population carries  $\sim$2 MJ and has a slowing down time of $\sim$100–200 ms. Without material injection, the fusion alphas are not expected to slow down during a sub-millisecond TQ, and therefore they might convect to the wall along stochastic field lines during the TQ. Assimilating approximately ten times the particle inventory in deuterium would increase the electron density and decrease the electron temperature, both by approximately ten, with the net effect of reducing the slow down time to a sub-millisecond value. The time duration between the assimilation of the deuterium and the onset of the TQ is expected to be of the order of milliseconds, providing time for the fast ions to slow down and thermalize before the TQ. The effects of unmitigated fast-ion impacts on the wall during a TQ have not been assessed.
4.2.2 Current quench mitigation
A vertically stable CQ generally requires fewer impurities for full mitigation due to the longer time scale and the slower heat conduction in the cold plasma, and therefore the quantities injected for the TQ are expected to be sufficient. In MGI and SPI shutdowns, the CQ radiation is typically found to be nearly axisymmetric due to the MHD mixing during the preceding TQ that distributes the impurity across the plasma (Hu et al. Reference Hu, Nardon, Lehnen and Huijsmans2018). Although the SPARC heat flux factor for the CQ is only reduced by a factor of two from the TQ heat flux factor (see table 7), the symmetry is expected to reduce the likelihood of melting during this phase. However, vertical stability during the CQ is often lost and halo currents are driven. Halo currents dissipate a considerable fraction of the magnetic energy in the cold halo region of the plasma which can conduct to the first wall causing melting in the absence of mitigation. For comparison, during an unmitigated 15 MA VDE in ITER, kilograms of beryllium are expected to be melted and hundreds of grams evaporated (Lehnen et al. Reference Lehnen, Aleynikova, Aleynikov, Campbell, Drewelow, Eidietis, Gasparyan, Granetz, Gribov and Hartmann2015a); however, note that SPARC will not have tiles made of beryllium. Vertical displacements or the CQ onset that often leads to vertical instability are easily detectable providing a reliable trigger for disruption mitigation. While the vertical displacement evolves on the wall time, thus providing tens of milliseconds for actuation in SPARC, the CQ evolves an order of magnitude faster and will present a challenge for present mitigation technologies that deliver noble gases at the speed of sound.
4.2.3 Runaway electron avoidance and mitigation
A passive REMC and massive material injection scheme are under consideration for mitigation of REs in SPARC. Material injection is targeted to increase the free electron density to  $\sim$20 % or more of that required to maintain the Connor–Hastie electric field above the inductive electric field throughout the CQ (Granetz et al. Reference Granetz, Esposito, Kim, Koslowski, Lehnen, Martin-Solis, Paz-Soldan, Rhee, Wesley and Zeng2014). A preliminary estimate of the required free electron density assuming a 5 ms CQ suggests $5\times 10^{22}$ m $^{-3}$, and thus an injection of low- $Z$ material of the order of $10^{24}$ atoms. The material injection method has not yet been finalized, with options discussed in § 4.2.1.
It is known from experiment (Yoshino et al. Reference Yoshino, Kondoh, Neyatani, Itami, Kawano and Isei1997; Lehnen et al. Reference Lehnen, Bozhenkov, Abdullaev and Jakubowski2008) and modelling (Helander, Eriksson & Andersson Reference Helander, Eriksson and Andersson2000; Boozer Reference Boozer2011; Smith, Boozer & Helander Reference Smith, Boozer and Helander2013) that large applied non-axisymmetric error fields cause flux surfaces to break up into stochastic regions, resulting in deconfinement of REs. The non-axisymmetric fields can be induced by having a non-axisymmetric passive conducting structure mounted on or near the first wall that is driven by the voltage induced during the disruption. Preliminary estimates using COMSOL show that it is possible to induce of the order of hundreds of kiloamps in such a coil during the expected CQ of a SPARC disruption. Whether this breaks up flux surfaces sufficiently to suppress the runaway seed requires detailed MHD calculations. This problem can be broken into three parts: (1) propose a variety of geometric coil shapes to be modelled in COMSOL with a prescribed  $\mathrm {d}I_p/\mathrm {d}t$ to calculate the induced current and the resulting $B$-field components on a three-dimensional grid of spatial locations, (2) run NIMROD with those three-dimensional fields to determine flux surface breakup and loss of seed REs using a trace particle approach like that of Izzo et al. (Reference Izzo, Hollmann, James, Yu, Humphreys, Lao, Parks, Sieck, Wesley and Granetz2011) and (3) run GO+CODE simulations with a prescribed particle loss rate to assess the full evolution of the RE beam. This workflow is in progress and step (1) is now described.
Three REMC variants are modelled using COMSOL with a double-walled vacuum vessel and are shown in figure 12. Each REMC variant is located in close proximity to the upper and lower vertical stability coils, though no mutual inductance exists between them provided the vertical stability coils are wired in anti-series. Three REMCs with  $n=1$, 2 and 3 are under investigation and pictured in figure 12. The coil geometries are highly constrained by the requirement that they avoid ports in the vacuum vessel, resulting in the square wave structure in the toroidal direction (note that sharp corners will be avoided in the final design). These coil structures are expected to produce broad toroidal and poloidal spectra, which is desirable to drive forced reconnection at numerous rational surfaces across the plasma cross-section. Passive and active switch technologies are under consideration to keep the circuit open during current ramp-up and flattop and allow closing of the circuit during the CQ.
(a–c) Concepts for the REMC with dominant toroidal harmonics  $n=1$, 2 and 3, respectively. (d) Contours of the field magnitude produced at $t=0.5$ ms into a 3 ms CQ generated by the $n=3$ coil at a toroidal location between vertical legs.

Simulation of a rapid 3 ms (linear) CQ leads to induced eddy currents in the vacuum vessel wall and REMC. As a function of time, one sees an approximately linear induced current in the mitigation coil reaching 600 kA during the quench, resulting in non-axisymmetric fields approaching 1 kG at the plasma mid-radius region at 1 ms into the plasma disruption. It should be noted that this coil was analysed as a room temperature copper coil and no attempt was made to account for nuclear or Ohmic heating during the current rise; however, the increased resistance is expected to make only a small correction to the total induced current.
A complex mirror current pattern in the vacuum vessel partially shields the field produced by the coil. The currents in the coil and vessel are predicted by the full COMSOL model, and then a reduced model is run where the REMC current is prescribed from the full model and the vessel is calculated self-consistently. The time-dependent fields from the latter case are then provided for the NIMROD modelling. The first NIMROD simulations using the REMC fields are in progress. From the NIMROD simulations of a high- $Z$ injection shown in § 3.5, we see that an $n=1$ perturbation of order 1 kG leads to a complete loss of the seed RE particles, so a similar perturbation from the REMC during the CQ might generate a particle loss rate that rivals the avalanche growth rate. Should the dedicated NIMROD modelling demonstrate that the REMC is effective, further studies will follow to assess the impact on CQ heat deposition and on VDEs. Also, the engineering issues of mechanically supporting the large ${I} \times {B}$ forces on the REMC must be considered.
4.2.4 Disruption mitigation actuator
Choosing between MGI and SPI, or both, requires consideration of system reliability, system response time, material delivery characteristics and mitigation performance metrics. The SPI systems form a large (relative to cryogenic fueling pellets), frozen pellet, pneumatically launch it at hundreds of metres per second and then shatter it near the entrance to the vacuum vessel (Baylor et al. Reference Baylor, Meitner, Gebhart, Caughman, Herfindal, Shiraki and Youchison2019). Similar solid material injection systems are under development that use an electromagnetic ‘rail gun’ to accelerate a sabot carrying cryogenic or non-cryogenic high- $Z$ materials (Raman et al. Reference Raman, Lay, Jarboe, Menard and Ono2019). Massive gas injection is a simpler approach, consisting of a pressurized plenum with a fast valve that releases a pulse of gas down a pipe directed at the plasma. Although MGI systems benefit from simplicity, constraints on the duration from the first injected particle to the last injected particle relative to the disruption time scales might preclude their use, as is the case for ITER. Better characterization of eddy current and halo current forces and RE generation in SPARC will help to make the decision regarding the necessary disruption mitigation hardware.
4.3 Disruption prediction
The lack of comprehensive first-principle models has led researchers to develop data-driven solutions to predict the occurrence of disruptions in existing tokamaks: current efforts cover most if not all experiments (still in operation or shut down); for a comprehensive list of references on disruption prediction literature, the reader is directed to references 3–28 in Tinguely et al. (Reference Tinguely, Montes, Rea, Sweeney and Granetz2019). Nevertheless, very little work has been done to extrapolate predictions to yet-to-be-built devices. A promising approach could be to investigate transfer learning techniques to integrate models developed using existing experimental data with simulation data from non-existing reactors or to exploit multi-machine databases to develop numerical experiments that test such data-driven solutions across different devices.
A high-energy-density device like SPARC will require robust prediction of thermal collapses, and not only predictive algorithms focused on the CQ phase. Studies of DIII-D (Sweeney et al. Reference Sweeney, Austin, Brookman and Choi2018) have shown how partial and full TQs can occur without a CQ and with a consequently large heat flux on the divertor components. Unmitigated energy release can be potentially deleterious for a device like SPARC and more work needs to be done to assess necessary diagnostics and algorithms that can be adopted to develop predictive solutions.
Most predictive data-driven algorithms focus on the discrimination of stable versus unstable operational spaces, even though identifying the transition time through such boundaries is in itself a challenge (Berkery et al. Reference Berkery, Sabbagh, Bell, Gerhardt and LeBlanc2017; Alessi et al. Reference Alessi, Capano, Pau and Sozzi2019). Often the classification of unstable phases collapses onto predictions anticipating the CQ phase, and to date the best performing models are capable of true positive rates higher than 90 % with false positive rate below 5 %–10 % (Kates-Harbeck, Svyatkovskiy & Tang Reference Kates-Harbeck, Svyatkovskiy and Tang2019; Montes et al. Reference Montes, Rea, Granetz, Tinguely, Eidietis, Meneghini, Chen, Shen, Xiao and Erickson2019). Disruption prediction on Alcator C-Mod has proven challenging (Rea et al. Reference Rea, Granetz, Montes, Tinguely, Eidietis, Hanson and Sammuli2018; Montes et al. Reference Montes, Rea, Granetz, Tinguely, Eidietis, Meneghini, Chen, Shen, Xiao and Erickson2019) due to the high fraction of disruptions caused by molybdenum flecks; an event with an inherent time scale of the order of milliseconds. Continuous monitoring of the plasma-facing components to detect hot spots that might lead to material injection, for example via infrared camera coverage, is envisioned as critical for SPARC operations.
A portable machine learning algorithm capable of being trained on existing devices and provided with non-disruptive simulation data of SPARC is anticipated. Machine learning work that provides insight into the underlying physics through measures of the ‘feature’ importance (Rea et al. Reference Rea, Montes, Erickson, Granetz and Tinguely2019) is informing the development of portable deep learning architectures that will be reported in a separate work.
Work continues towards the development of a real-time disruption prediction algorithm capable of providing accurate warnings prior to the TQ that can be used to trigger disruption mitigation actuators. The exact requirements of this system have not been determined for SPARC but are expected to be comparable to the ITER performance requirements.
5 Conclusion
The SPARC tokamak offers an opportunity to explore robustly MHD stable burning plasmas in preparation for ARC where the economic impact of MHD instabilities and disruptions on power production must be considered. SPARC will operate with ample margins to the density limit and the pressure-driven ideal kink limit, and with a moderate safety factor of  $q_{95}=3.4$. The SPARC plasma elongation is near the upper bound of the empirically stable operating regime so passive stability plates and close-fitting feedback coils are being designed. By optimizing the plasma ramp-up and early heating scheme to maximize classical tearing stability, together with the low plasma beta, theory predicts that a robustly tearing stable equilibrium exists. The high field and low beta partially cancel with respect to scaling the error field sensitivity giving a maximum allowable normalized overlap field of $7.4\times 10^{-5}$. Two external fields are found with comparable propensity for driving error field penetration and therefore an error field correction coil set capable of multi-mode correction is under design.
Though disruptions are expected to be relatively infrequent as a result of the inherent stability margins, disruption loads are comparable to or higher than those predicted for ITER. Being a medium-sized device, the TQ and CQ durations in SPARC are expected to be comparable to those of devices like DIII-D and ASDEX-U. Eddy current forces and torques are large, but the machine and first-wall components are being designed to withstand them. Halo current forces are also high, though the oscillating forces from asymmetric VDEs are not expected at mechanical resonances. Conversion of the majority of the plasma current to runaway current is predicted in the absence of seed losses; however, significant seed loss during the TQ is also predicted, so assessment of the unmitigated conversion efficiency is ongoing.
The SPARC device is being designed with a high level of passive disruption resilience, and massive material injection is planned to reduce the loading. The high volume-averaged pressure in a medium-sized device results in a mitigated TQ radiation flash that requires the use of graphite or high- $Z$ first-wall materials to avoid sublimation and melting. The vertically stable CQ radiation is less intense than the TQ, but if disruption prediction should fail, detection and mitigation of a vertically unstable CQ will challenge the response time of present technologies. A REMC is under investigation for SPARC and preliminary modelling provides hope that this most damaging aspect of tokamak disruptions might be ameliorated. Mitigation of the TQ and the vertically unstable CQ require disruption prediction, and the requirements for a data-driven approach are under investigation.
Acknowledgements
We are grateful to Dr P. Rodriguez-Fernandez for providing TRANSP data for stability assessments. We would like to thank A. Odedra for producing CAD drawings of the error field correction coils shown in this work. We would like to acknowledge Dr N. Eidietis for curating the ITPA Disruption Database, and for validating the analysis performed with these data.
This material is based upon work supported by Commonwealth Fusion Systems under RPP005 and the US Department of Energy, Office of Science, Office of Fusion Energy Sciences, under Awards DE-SC0014264 and DE-AC02-09CH11466. C.P.-S. was supported by General Atomics Internal R&D funds.
Editor William Dorland thanks the referees for their advice in evaluating this article.
Declaration of interests
The authors report no conflict of interest.
Appendix A. Eddy current torque on discrete components
Here we derive the torque that arises during the CQ on in-vessel components that are discrete in the toroidal and poloidal directions, and form a near-complete surface like first-wall tiles or the ITER blanket modules. For simplicity we assume a circular cross-section, cylindrical plasma where the poloidal field  $B_p$ is independent of the poloidal coordinate $\theta$. For components that are discontinuous in both the toroidal and poloidal directions, a torque results from eddy currents circulating in the $r$–
$r$– $\phi$ plane of the component, where $r$ is the radial coordinate extending from the magnetic axis of the plasma and the effective toroidal coordinate is $\phi =z/R_0$, where $2 {\rm \pi}R_0$ is the periodicity of the system. We choose the resistive decay time of the circulating eddy currents to be long relative to the CQ time, i.e. $\tau _{\mathrm {eddy}} \gg \tau _\mathrm {cq}$. Finally, we consider the case where the first-wall components are wedge shaped in the poloidal plane filling the region from $r_b \leq r \leq r_c$ and forming a near-complete wall, but are electrically isolated and identical in shape. The symmetry of this system admits a simple solution for the time dependence of the eddy currents. Forming an Amperian loop in the poloidal plane at a fixed radius $r$ inside the wedged components (i.e. $r_b \leq r \leq r_c$), and noting that the ordering in time implies that the electric field is zero inside the components, it is clear that the $z$-directed (or toroidal) current must be conserved throughout the CQ at this radius. Therefore, the total toroidal current flowing in the region $r \leq r_b$ consists of the plasma current $I_p$ and one leg of the first-wall current $I_{fw}$ and is constant and equal to the initial plasma current $I_{p0}$. Using the symmetry of the $M$ components in the poloidal direction, the total current circulating in first-wall component $i$ at time $t$ is simply $I_{fw,i}(t) = (I_{p0} - I_p(t))/M$ for $t \ll \tau _{\mathrm {eddy}}$. Note that if we form an Amperian loop just on the laboratory side of the first-wall components (i.e. at $r=r_{c+}$), the loop encloses both the co- $I_p$ and counter- $I_p$ legs of the circulating current and thus the discrete components produce no net $z$-directed current.
This circulating current has inward and outward radial components that cross with the toroidal field, giving the following force:
 \begin{equation} F_{\theta} = \frac{I_p B_T w {\rm \Delta} \theta}{2 {\rm \pi}} \end{equation}
and torque
 \begin{equation} \tau = F_{\theta} {\rm \Delta} \phi R_c, \end{equation}
where  $w$ is the dimension of the component normal to the wall, ${\rm \Delta} \theta$ and ${\rm \Delta} \phi$ are the angles subtended by the component and $R_c$ is the major radius where the component is fixed. This equation is suitable for order-of-magnitude force and torque estimates. In § 3.3, it is shown to make predictions of the ITER blanket module torques to within 50 % of the simulated peak values.


 Open access