

Diet is one of the major modifiable risk factors for many chronic conditions, such as CVD and type 2 diabetes( Reference Alwan 1 ). Investigating the relationship between diet and disease is the focus of many epidemiological studies worldwide( Reference Chiuve, Sampson and Willett 2 , Reference Gonzalez 3 ). There are many methods to measure food and nutrient intakes including 24 h recalls, weighed or estimated food records and FFQ( Reference Thompson and Subar 4 , Reference Willett 5 ). FFQ are a widely used tool in large epidemiological studies, due to their low cost and the ease of administration compared with other more intensive dietary assessment methods( Reference Thompson and Subar 4 – Reference Gibson 6 ). As with any method of dietary assessment, there are also limitations associated with FFQ( Reference Thompson and Subar 4 – Reference Cade, Burley and Warm 7 ). Therefore, it is vital to use an FFQ in a target population of a specific age range, physiological status and cultural background for which it has been designed( Reference Cade, Burley and Warm 7 ). For example, an FFQ designed for use in adults from the UK or the USA may not be suitable for use in the New Zealand (NZ) population, due to differences in food availability, food choice and subsequent intake between populations( Reference Cade, Burley and Warm 7 , Reference Cade, Thompson and Burley 8 ). When an FFQ is designed for use in a particular population, or if a modified version of a previously available questionnaire is developed for use in another population, it is crucial that the reliability and validity of the tool are assessed in the target population prior to its use( Reference Cade, Burley and Warm 7 , Reference Cade, Thompson and Burley 8 ). It is also important to ensure that a validated FFQ is up to date, as using an FFQ that was developed many years ago may not accurately reflect current food availability or consumption patterns( Reference Willett 5 , Reference Cade, Thompson and Burley 8 ).
In NZ, relative validity has been investigated for only four FFQ designed for assessing multi-nutrient intakes in free-living adults( Reference Sharpe, Page and Gamble 9 – Reference Bell, Swinburn and Amosa 13 ). Of these FFQ, both validity and reliability have been assessed only once( Reference Metcalf, Swinburn and Scragg 12 ), and all FFQ were validated more than 10 years ago and have not been updated for current use. Therefore, the aim of the present study was to develop a multi-nutrient FFQ to rank participants by nutrient intake, and to investigate its reliability and relative validity. This FFQ is intended to be used in large cohort studies of NZ adults to investigate relationships between nutrient intake and chronic disease.
Methods
Participants and study design
A convenience sample of 151 participants aged between 30 and 59 years was recruited from the general population in Dunedin, NZ between September 2009 and May 2010, in order to recruit fifty participants (twenty-five males, twenty-five females) in each of the following age bands: 30–39 years, 40–49 years and 50–59 years.
Each participant attended four clinic visits over 12 months. During this 12-month period, participants would complete the FFQ on two occasions nine months apart, in order to assess repeatability of the FFQ. Participants were randomised so that half of them completed the FFQ at month 0 and month 9, and half at month 3 and month 12. At the first clinic visit (month 0), the purpose of the study and the procedures involved were explained to all participants and informed consent was given before participation. Height and weight were measured in duplicate, according to a standard operating procedure. Participants filled out a demographics questionnaire. Half of the participants completed the FFQ at month 0 as allocated. Participants were then given verbal instructions by a trained nutritionist on to how to complete weighed food records. Each participant was provided with a diet record package containing a 2 d weighed diet record (2dWDR) with further written instructions on weighing and recording foods, a set of scales and a pre-paid envelope for return of records; 2dWDR were to be completed within two weeks of the first clinic visit. The second clinic visit took place at month 3, where the remaining half of participants completed the FFQ. The rest of the visit followed the same protocol as month 0 and participants were provided with a second 2dWDR. At month 6, the third 2dWDR was sent to participants by post along with a pre-paid envelope. Participants attended the clinic again at months 9 and 12. All participants were given another 2dWDR and pre-paid envelope at month 9. Those participants who completed the FFQ at month 0 filled in the FFQ for a second time at the month 9 visit and those who completed it at month 3 did so again at month 12. At month 9, two 10 ml fasting blood samples were also obtained from each participant for analyses of selected nutrient biomarkers. The study was approved by the University of Otago Human Ethics Committee.
Development and administration of the FFQ
The FFQ was developed by modifying a 147-item, semi-quantitative FFQ used in the UK-EPIC (European Prospective Investigation into Cancer and Nutrition) project. Changes to the FFQ were made to ensure that all foods listed made a substantial contribution to nutrient intake and were commonly consumed by NZ adults. Commonly consumed foods were identified using data from the 1997 NZ National Nutrition Survey( Reference Russell, Parnell and Wilson 14 ), the most recent nationally representative data set available at the time. Two inspection tours of Dunedin supermarkets were carried out to identify other relevant foods for inclusion. Examples of changes made to the UK FFQ included removal of items not generally available in NZ (e.g. coffee whitener), addition of foods that were not included in the original EPIC FFQ but are commonly consumed in NZ (e.g. pumpkin and kumara), and naming changes to reflect the local context (e.g. ‘sweet peppers’ was changed to ‘capsicum’).
The modified FFQ was pre-tested in a total of twenty-one adults aged 30–59 years using focus group interviews and then modified according to feedback received. The finalised semi-quantitative FFQ captures the habitual intake of 154 food items, using seven frequency options ranging from ‘never or less than once per month’ to ‘two or more every day’. Most questions requested information on the average consumption of foods over the past 12 months, while the intake of seasonal fruits was expressed as ‘average intake when in season’. Supplementary multiple-choice questions were included to identify supplement use and cooking methods such as trimming of fat. A nutrient line for each food item, weighted by the proportion of New Zealanders who consume each food in a particular food item, was determined using data on food consumption patterns from the NZ 2008/09 Adult Nutrition Survey (ANS)( 15 ). For example, the nutrient lines for the FFQ item ‘beer’ were weighted to 70 % of the nutrient data for ‘standard draught and lager’ and 30 % ‘strong ale’ as the reported frequency of consumption of the former was 2·33 times that of the latter in ANS participants.
Validation reference – weighed diet record
Power calculations indicated that eight recording days were required to capture the habitual dietary intake of participants and to provide intra-class correlation coefficients (ICC) of at least 0·95 for all nutrients, including those with high day-to-day variation in intake (e.g. vitamin C and Se). The present study used weighed diet records, as these have been acknowledged as the most appropriate validation reference for FFQ( Reference Willett 5 , Reference Cade, Thompson and Burley 8 ). Each participant completed four 2dWDR for a total of 8 d of records (8dWDR). Each 2dWDR consisted of two non-consecutive day blocks (one block per season over 12 months). Participants were randomised so that equal numbers of participants started recording on each of the seven days in a week, with the remaining days of a week following a standard pattern. Participants who had not returned their 2dWDR within two weeks were followed up by email or telephone. All returned 2dWDR were checked for completion by trained nutritionists and a follow-up contact was made to gather more detailed information if needed. Nutrient intake was analysed using the NZ FOODfiles based Diet Cruncher software version 1·6·0 (Way Down South Software, Dunedin, New Zealand). Daily nutrient intake was computed to provide a ratio of 5:2 for weekdays to weekend days.
Validation reference – blood biomarkers
Blood concentrations of ascorbic acid, β-carotene and α-tocopherol were used as validation references for the respective dietary intakes of vitamin C, β-carotene and vitamin E, determined from the FFQ and the 8dWDR. Two 10 ml fasting blood samples were obtained from each participant at month 9. Blood samples were processed within 2 h of collection to minimise the degradation of ascorbic acid. Plasma for ascorbic acid determination and serum for β-carotene and α-tocopherol were obtained after centrifugation at 1500 g for 15 min at 4°C. Plasma and serum samples were stored at −80°C for up to 1 year before analysis. Plasma ascorbic acid concentration was determined using a fluorometric assay( Reference Vuilleumier and Keck 16 ). This method has an intra-assay CV at 2, 4 and 5 μg ascorbic acid/ml of 6·7 %, 3·2 % and 4·0 %, respectively. The inter-assay CV was 4·7 %. The concentrations of serum β-carotene and serum α-tocopherol were determined concurrently using a liquid-chromatographic assay adapted from the method of Thurnham et al.( Reference Thurnham, Smith and Flora 17 ). During analyses all samples and standard solutions were handled under natural lighting. A pooled serum sample was run after every ten samples and the intra-assay CV determined daily from the average mean value of each analyte. This method has a mean intra-assay CV of 10·4 % for β-carotene and 1·7 % for α-tocopherol. The inter-assay CV was 9·1 % for β-carotene and 3·5 % for α-tocopherol.
Statistical analyses
All analyses were performed using the statistical software package Stata 11·0. Reliability between the first FFQ administration (FFQtime1) and the second administration (FFQtime2) was assessed using ICC. Relative validity of FFQtime2 v. the 8dWDR and blood biomarkers was assessed using Spearman correlation coefficients (SCC). As the purpose of the FFQ is to rank individuals, cross-classification of results between FFQtime2 and the 8dWDR was undertaken. Agreement for cross-classification was presented as the percentage of participants classified into the same and adjacent quartiles, and the percentage grossly misclassified into extreme quartiles. In analyses using SCC and cross-classification, energy adjustment was undertaken using the residual method( Reference Willett, Howe and Kushi 18 ). Supplementary Bland–Altman analyses( Reference Bland and Altman 19 ) were performed to assess the strength of agreement between FFQtime2 and the 8dWDR in measuring absolute nutrient intakes. Natural logarithmic transformations were performed on the original scale of the FFQ and 8dWDR data to improve normality( Reference Bland and Altman 19 ). Mean differences and limits of agreement (LOA) were back-transformed and expressed as percentages. Thus, a mean percentage agreement of 100 with 95 % confidence intervals including 100 indicates a perfect agreement in assessing absolute mean intake at a population level. The width of the LOA represents the range in which 95 % of the differences between the two methods are expected to fall.
Results
A total of 132 participants (87 % of those enrolled at baseline) completed the fasting blood test, the 8dWDR and both administrations of the FFQ. No missing data were found, and thus data from all 132 participants were included in the current analysis. The mean age of participants was 44 years, 49 % were male and 81 % were of NZ European origin. Table 1 shows mean energy and nutrient intakes from the 8dWDR and both FFQ administrations. Nutrient intakes obtained from the 8dWDR were comparable to 24 h recall data from the NZ 2008/09 ANS( 15 ). Mean energy intake from the 8dWDR was 9·2 MJ/d, which was close to 9·0 MJ/d reported by ANS participants of a similar age( 15 ).
Mean (and standard deviation) daily intakes of energy and selected nutrients among study participants (males and females aged 30–59 years (n 132), Dunedin, New Zealand, 2009–2010)Footnote * and the 2008/09 Adult Nutrition Survey (ANS)Footnote †
8dWDR, 8 d weighed diet record; FFQtime1, first administration of the FFQ developed in the present study; FFQtime2, second FFQ administration.
* Supplement data not included.
† Mean dietary intakes among 2239 New Zealanders aged 31–70 years, as reported in the 2008/09 New Zealand Adult Nutrition Survey report using one 24 h recall( 15 ).
Using ICC, the reliability coefficients for the FFQ administrations spaced 9 months apart ranged from 0·47 for Ca to 0·83 for alcohol, as presented in Table 2. The majority of ICC were between 0·60 and 0·82, indicating good to excellent reliability. Table 2 also shows the relative validity of FFQtime2 v. the 8dWDR for crude and energy-adjusted nutrient intakes. Energy adjustment generally led to higher correlation coefficients. After energy adjustment, the lowest SCC were observed for Zn (0·24), Ca (0·28) and vitamin E (0·24), whereas the highest SCC were found for alcohol (0·74), cholesterol (0·65), β-carotene (0·58), carbohydrate (0·56) and vitamin C (0·56).
Intra-class correlation coefficients (ICC)Footnote * and Spearman correlation coefficients (SCC)Footnote † for crude and energy-adjusted nutrient intakes from the present study, compared with results from previous studies with similar study design
8dWDR, 8 d weighed diet record.
* ICC between administrations of the FFQ repeated nine months apart.
† SCC of the FFQ v. the 8dWDR. Supplement data not included.
‡ The range of correlation coefficients from previous reliability studies of self-administered, multi-nutrient FFQ that were administered twice at least 6 months apart. Study selection was based on the similarity of FFQ design and the mode of administration, as compared with the FOOD study( Reference Metcalf, Swinburn and Scragg 12 , Reference Willett, Sampson and Stampfer 29 , Reference Longnecker, Lissner and Holden 31 , Reference Ajani, Willett and Seddon 32 , Reference Willett, Sampson and Browne 34 – Reference Ibiebele, Parekh and Mallitt 38 ).
§ The range of correlation coefficients derived from relative validation studies of self-administered, multi-nutrient FFQ of similar design( Reference Sharpe, Page and Gamble 9 – Reference Bell, Swinburn and Amosa 13 , Reference Willett, Sampson and Stampfer 29 , Reference Longnecker, Lissner and Holden 31 , Reference Willett, Sampson and Browne 34 , Reference Rimm, Giovannucci and Stampfer 35 , Reference McKeown, Day and Welch 37 , Reference Willett, Reynolds and Cottrell-Hoehner 39 – Reference Itzhaki, Rennert and Rosen 45 ).
Table 3 shows the agreement in cross-classification between FFQtime2 and the 8dWDR in ranking individuals according to their nutrient intakes. The mean proportion of participants correctly classified to within one quartile for all nutrients was 75·3 %, which increased to 77·9 % after energy adjustment. High percentages of correct classification were observed for energy-adjusted intakes of alcohol (91·3 %), cholesterol (84·8 %), carbohydrate (82·6 %), vitamin C (82·6 %) and vitamin E (82·6 %). For all energy-adjusted data, a mean of 4·5 % of participants were misclassified into extreme quartiles.
Cross-classification of individuals by quartiles of nutrient intakes between the FFQ and the 8dWDR (males and females aged 30–59 years (n 132), Dunedin, New Zealand, 2009–2010)
8dWDR, 8 d weighed diet record.
*Percentage of participants classified into the same or adjacent quartiles of nutrient intake (supplement data not included).
†Percentage of participants grossly classified into extreme quartiles of nutrient intake (supplement data not included).
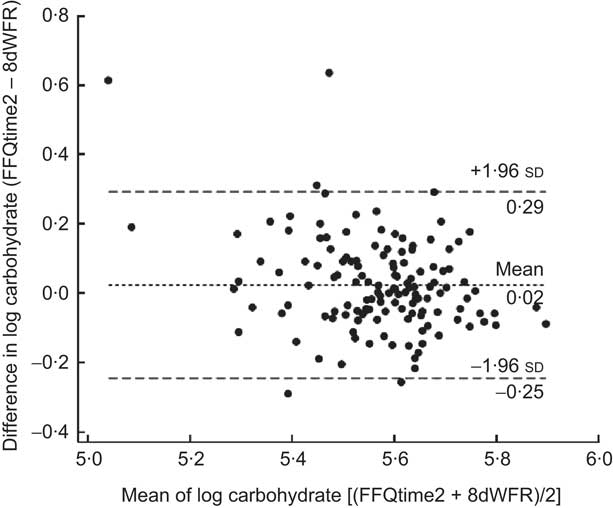
Strength of agreement between FFQtime2 and the 8dWDR is shown in Table 4. Almost perfect mean percentage agreement (i.e. close to 100 with 95 % confidence intervals including 100) was observed for energy and most macronutrients both before and after energy adjustment. After energy adjustment, no substantial differences in mean agreement were observed, but the range of LOA was narrower for all nutrients. For most macronutrients the FFQ estimates fell between half and two times the 8dWDR estimates, indicating good agreement between methods. Compared with macronutrients, the range of energy-adjusted LOA for micronutrients was generally wider. Figure 1 shows a Bland–Altman plot for energy-adjusted carbohydrate, where the mean percentage agreement between FFQtime2 and the 8dWDR was 103 %.
Strength of agreement using the Bland–Altman method between nutrient intakes derived from the FFQ and the 8dWDR (males and females aged 30–59 years (n 132), Dunedin, New Zealand, 2009–2010)
8dWDR, 8 d weighed diet record; LOA, limits of agreement.
*Mean % agreement = (nutrient intake of FFQ/nutrient intake of 8dWDR) × 100 %.
†The width of the LOA represents the range in which 95 % of the differences between the FFQ and the 8dWDR are expected to fall.
Bland–Altman plot showing the relative validity of energy-adjusted carbohydrate from the second FFQ administration (FFQtime2) v. the 8 d weighed diet record (8dWDR), based on log-transformed values (– – –, limits of agreement; - - -, mean difference)
Mean concentration of blood biomarkers was 68·7 (sd 22·0) μmol/l for plasma ascorbic acid, 0·59 (sd 0·44) μmol/l for serum β-carotene and 26·9 (sd 7·95) μmol/l for serum α-tocopherol. SCC for the relative validity of the FFQ and the 8dWDR compared with blood biomarkers are shown in Table 5. For energy-adjusted intake of β-carotene and vitamin C, these SCC were respectively 0·34 and 0·33 with the FFQ, 0·30 and 0·38 with the 8dWDR; but no correlation was observed for vitamin E.
Spearman correlation coefficients (SCC)Footnote * for relative validity of the FFQ and the 8dWDR compared with blood biomarkersFootnote † for β-carotene, vitamin C and vitamin E (males and females aged 30–59 years (n 132), Dunedin, New Zealand, 2009–2010)
8dWDR, 8 d weighed diet record.
* SCC for total nutrient intake including relevant supplement data.
† Biomarker of vitamin C is plasma ascorbic acid (μmol/l), of vitamin E is serum α-tocopherol (μmol/l) and of β-carotene is serum β-carotene (μmol/l), compared against dietary intake of vitamin C (mg), vitamin E (mg) and β-carotene (μg), respectively.
Discussion
In the present study we assessed the reliability and validity of a semi-quantitative FFQ in a sample of free-living NZ adults. The results show that the FFQ provides highly repeatable measurements and good relative validity for ranking individuals by nutrient intake.
Test–retest reliability
Reliability of the FFQ was generally good to excellent, with most reliability coefficients falling at the upper end of, or exceeding, the commonly reported range of 0·5–0·7( Reference Willett 5 , Reference Cade, Burley and Warm 7 ). Previous studies of FFQ designed to capture intake over the past 12 months have shown higher reliability coefficients when repeat administrations of the FFQ have been at intervals of 6 months or less apart, compared with FFQ which were repeat-administered over a longer time period( Reference Cade, Burley and Warm 7 ). This relatively high reliability at a short-term interval could be attributed to learning or memory effects( Reference Horwath 20 ). Due to time and budget constraints, the present study adopted a 9-month interval that was considered sufficient to dilute learning effects while still capturing a time period over which habitual dietary changes are unlikely to be made( Reference Cade, Thompson and Burley 8 ).
It is important to acknowledge that FFQ replicates obtained in different seasons, separated by a 9-month interval as in the current study, may yield less reproducible measures than FFQ collected in the same season one year apart. As documented in previous research, the present study found that energy intake from FFQ collected during winter was higher than that collected in other seasons (data not shown)( Reference Capita and Alonso-Calleja 21 – Reference de Castro 26 ). Seasonal price fluctuations in fruits, vegetables and dairy foods in NZ( Reference Bascand 27 ) might alter food choices and corresponding nutrient intakes (e.g. vitamins A, C and E)( Reference Contento 28 ). Despite potential seasonal changes in food intake, our FFQ showed comparable reliability for energy and nutrient intakes to previous FFQ that were designed to investigate intake over a year( Reference Willett, Sampson and Stampfer 29 – Reference Ajani, Willett and Seddon 32 ).
As the aim of the FFQ and the design of validation studies (e.g. time interval between administrations) have been shown to influence reliability( Reference Cade, Burley and Warm 7 , Reference Molag, de Vries and Ocké 33 ), it is appropriate to compare findings of the current study with those of previous studies using FFQ that are most similar in content, aim and administration. Compared with several versions of the Willett FFQ and the UK-EPIC FFQ that were repeat-administered at least 6 months apart in free-living adults, the current FFQ provided highly comparable reliability coefficients for most nutrients( Reference Metcalf, Swinburn and Scragg 12 , Reference Willett, Sampson and Stampfer 29 , Reference Longnecker, Lissner and Holden 31 , Reference Ajani, Willett and Seddon 32 , Reference Willett, Sampson and Browne 34 – Reference Ibiebele, Parekh and Mallitt 38 ). For vitamin C, our FFQ appeared to be more reliable than various forms of the Willett FFQ( Reference Willett, Sampson and Stampfer 29 , Reference Longnecker, Lissner and Holden 31 , Reference Ajani, Willett and Seddon 32 , Reference Willett, Sampson and Browne 34 – Reference Munger, Folsom and Kushi 36 , Reference Ibiebele, Parekh and Mallitt 38 ) and showed similar reliability to the UK-EPIC FFQ( Reference McKeown, Day and Welch 37 ). These results indicate that a single administration of the FFQ is sufficient to provide nutrient measures with a high level of reliability.
Relative validity
The present study is the first to use a weighed diet record and biomarkers to evaluate the validity of a multi-nutrient FFQ for use in NZ adults. Among FFQ designed to assess intake of multiple nutrients in NZ adults over a 12-month period, only three have been evaluated for validity( Reference Sharpe, Page and Gamble 9 , Reference Marshall 10 , Reference Metcalf, Swinburn and Scragg 12 ). All of these FFQ were validated against an estimated diet record that was collected on consecutive days over only 1 month. The coverage of a 1-month period and the use of consecutive days may not be sufficient to capture day-to-day and seasonal variations in dietary intake over a year, as measured by these FFQ. The use of estimated diet records also requires portion size estimation, which would result in correlated errors( Reference Willett 5 ). In contrast, weighed diet records have been credited as an ideal validation reference due to the advantages of direct weighing( Reference Willett 5 ). In the present study, the 8dWDR that covered all days in a week, over four seasons in a year, would capture as much dietary variation as possible. Thus, the 8dWDR is likely to represent habitual dietary intake and offers an optimal validity evaluation of the FFQ.
When compared with the 8dWDR, the FFQ showed acceptable to good validity with most SCC lying within the commonly observed range of 0·3–0·7( Reference Willett 5 , Reference Cade, Thompson and Burley 8 ). The validity coefficients were comparable to those found in previous studies using similar FFQ( Reference Sharpe, Page and Gamble 9 – Reference Bell, Swinburn and Amosa 13 , Reference Willett, Sampson and Stampfer 29 , Reference Longnecker, Lissner and Holden 31 , Reference Willett, Sampson and Browne 34 , Reference Rimm, Giovannucci and Stampfer 35 , Reference McKeown, Day and Welch 37 , Reference Willett, Reynolds and Cottrell-Hoehner 39 – Reference Itzhaki, Rennert and Rosen 45 ). After energy adjustment, our reported coefficients for cholesterol, β-carotene and vitamin E lay at the upper end of the range observed in various forms of the Willett FFQ and the UK-EPIC FFQ( Reference Willett, Sampson and Stampfer 29 , Reference Longnecker, Lissner and Holden 31 , Reference Willett, Sampson and Browne 34 , Reference Rimm, Giovannucci and Stampfer 35 , Reference Willett, Reynolds and Cottrell-Hoehner 39 – Reference Itzhaki, Rennert and Rosen 45 ). High validity coefficients were also observed for cholesterol, vitamin A, β-carotene, folate, vitamin C and vitamin E in comparison with previous NZ FFQ( Reference Sharpe, Page and Gamble 9 – Reference Bell, Swinburn and Amosa 13 ).
Our FFQ also showed a comparable level of validity to previous findings when compared against biomarkers. The validity coefficients for our FFQ fell within previously reported ranges for β-carotene( Reference Marshall 10 , Reference Katsouyanni, Rimm and Gnardellis 30 , Reference Brunner, Stallone and Juneja 41 , Reference McNaughton, Marks and Gaffney 42 , Reference Ascherio, Stampfer and Colditz 46 – Reference Dixon, Subar and Wideroff 51 ), vitamin C( Reference Bingham, Gill and Welch 47 , Reference Kobayashi, Sasaki and Tsugane 50 , Reference Dehghan, Akhtar-Danesh and McMillan 52 – Reference Knutsen, Fraser and Linsted 55 ) and vitamin E (correlation coefficient =–0·20–0·45)( Reference Brunner, Stallone and Juneja 41 , Reference Ascherio, Stampfer and Colditz 46 , Reference Ocke and Kaaks 48 , Reference Dixon, Subar and Wideroff 51 , Reference Knutsen, Fraser and Linsted 55 – Reference El-Sohemy, Baylin and Ascherio 67 ). The low validity coefficient for vitamin E reported in the present study could be explained by between-subject differences in metabolism of α-tocopherol( Reference Jenab, Slimani and Bictash 68 ). Adjustment for blood cholesterol concentration, which is correlated to serum α-tocopherol, has been shown to increase the validity coefficient between intake and blood concentration of vitamin E( Reference Ascherio, Stampfer and Colditz 46 , Reference Jacques, Sulsky and Sadowski 57 , Reference Willett, Stampfer and Underwood 63 ). Measures of blood cholesterol are currently not available in the present study, but as blood samples have been frozen this is a possibility for further analysis. We also collected only a single blood sample due to budget constraints. Although a single measure of blood biomarkers might be less likely to reflect year-round nutrient intake than multiple measurements, biomarkers can offer an objective measure of the corresponding nutrient intake( Reference Kaaks 69 ). This is why biomarkers have been credited as a superior complementary method for validation of FFQ( Reference Kaaks 69 ), even though they reflect intake and utilisation of nutrients, rather than intake per se ( Reference Jenab, Slimani and Bictash 68 ).
Since correlation coefficients measure association rather than absolute agreement between measurements using two methods, an international group of experts has advocated the use of the Bland–Altman method as a complementary aid in FFQ validation( Reference Cade, Burley and Warm 7 ). Results of our study showed an acceptable agreement between methods for most macronutrients, whereas wide LOA were observed for micronutrients such as β-carotene, thiamin and vitamin C. Similar findings have been consistently reported in studies using diet records to validate FFQ in free-living adults( Reference Marks, Hughes and Van Der Pols 44 , Reference Zhang and Ho 70 – Reference Ambrosini, Mackerras and De Klerk 74 ). Results of previous FFQ validation studies that have used the Bland–Altman method have produced LOA outside the range of 50–250 % for vitamin C( Reference Zhang and Ho 70 – Reference Bautista, Herrán and Pryer 72 , Reference Ambrosini, Mackerras and De Klerk 74 ). An Australian version of the Willett FFQ has produced β-carotene estimates ranging from 28 % lower to 790 % higher than that produced by a 12 d diet record( Reference Marks, Hughes and Van Der Pols 44 ). These consistent findings indicate that wide LOA between FFQ and diet records are not unusual, highlighting the difficulty in obtaining absolute measures of certain nutrients using an FFQ.
Nevertheless, as is the case with most FFQ, our FFQ was designed to rank individuals according to their nutrient intake. Study results demonstrated that the FFQ fulfilled its purpose, as shown by high agreement with the 8dWDR and a very low proportion of gross misclassification for all nutrient intakes. This allows us to distinguish between individuals with high and low intake of individual nutrients, the focus of many epidemiological studies.
One of the challenges in conducting a dietary validation study is the ability to recruit a representative sample of the target population. The mean intakes of energy and nutrients of the participants in our study were comparable to the nationally representative ANS data( 15 ), even though our participants might not be nationally representative with respect to ethnicity. Those of Maori or Pacific Island descent composed less than 5 % of our participants, which is lower than the 22 % documented in the latest NZ census report( 75 ). Maori and Pacific Islanders are more likely to have higher BMI( 15 ) and different dietary patterns compared with those of European and other ethnicity( 76 , 77 ). Therefore, future evaluation would be necessary prior to the use of the FFQ in studies focusing on Maori or Pacific Island populations.
Conclusion
The present study provides a thorough evaluation of both reliability and validity of the FFQ, and shows the ability of the FFQ in providing repeatable measures and in ranking individuals by their nutrient intake. The FFQ will be a useful tool to assess the nutrient intake of NZ adults in future research, particularly in studies investigating relationships between diet and disease.
Acknowledgements
Sources of funding: The study was funded by the University of Otago. Conflicts of interest: The authors have no conflicts of interest. Authors’ contributions: P.M.L.S. and S.S. were the principal investigators for the study and were responsible for the study conception, FFQ development and study design. C.H.Y.S. was responsible for management of data collection and processing, data analysis and writing the first draft of the manuscript. All authors critically revised the manuscript and have read and approved the final version. Acknowledgements: The authors thank Andrew Gray from the Department of Preventive and Social Medicine for his statistical advice and the Adult Nutrition Survey Team for its assistance with developing the nutrient database for the FFQ. They also thank all FOOD study participants and everyone involved in the collection and processing of data.


