


Co-occurrence of severe Zn deficiency and Fe-deficiency anaemia was first observed in Zn-deficient Iranian farmersReference Prasad, Halsted and Nadimi1 and confirmed in Egyptian farmersReference Prasad, Miale, Farid, Sandstead and Schulert2, Reference Prasad, Miale, Farid, Sandstead, Schulert and Darby3. Subsequently, it was noted that Zn and Fe nutriture are affected by many of the same dietary factorsReference Sandstead4–Reference Yokoi, Egger, Ramanujam, Alcock, Dayal, Penland and Sandstead6. Most recently, the co-occurrence of Zn and Fe deficiencies was described from ThailandReference Wasantwisut, Winichagoon, Chitchumroonchokchai, Yamborisut, Boonpraderm, Pongcharoen, Sranacharoenpong and Russameesopaphorn7, IndiaReference Pathak, Kapil, Kapoor, Saxena, Kumar, Gupta, Dwivedi, Singh and Singh8 and Sri LankaReference Hettiarachchi, Liyanage, Wickremasinghe, Hilmers and Abrahams9. The latter study, adolescents with ferritin < 30 μg/l had a statistically significant relative risk of 1·7 for serum Zn < 9·95 μmol/l.
Based on the above, we propose a commonality hypothesis that both indices of Zn nutriture (plasma Zn and Zn pool sizes) and Fe nutriture (serum Fe and serum ferritin) are correlated with frequencies of consumption of common foods containing bioavailable Zn and Fe or their absorption inhibitors and enhancers, and that both Zn indices and Fe indices are correlated in premenopausal women with normal Fe status or low Fe status without anaemia.
Circumstantial evidence favours the commonality hypothesis. Zn and Fe are most bioavailable from many of the same foods and their absorption is inhibited by many of the same dietary substancesReference Yokoi, Egger, Ramanujam, Alcock, Dayal, Penland and Sandstead6. Consistent with this relationship, a preliminary studyReference Yokoi, Alcock and Sandstead10 found accelerated Zn disappearance and increased Zn turnover rate in eighteen young women from Galveston, TX, USA with serum ferritin concentrations < 20 μg/l, a criterion to detect low Fe storesReference Thoradeniya, Wickremasinghe, Ramanayake and Atukorala11–Reference Pate, Miller, Davis, Slentz and Klingshirn13. More recently, inadequate dietary intakes of Zn and Fe that failed to meet the high physiological demands of adolescent girls in Australia and New Zealand were shown related to food choicesReference Gibson, Heath and Ferguson14. Relevant to these findings is the observation in fifty-two non-pregnant premenopausal women from Seattle, Washington, USA, whose diets provided similar amounts of Fe, that consumption of red meat five times/week was more efficacious for body Fe stores than consumption of lacto-ovo-vegetarian foods, or the flesh of chicken and fishReference Worthington-Roberts, Breskin and Monsen15. Mean serum ferritin concentrations associated with the three diets were 30·5, 19·1 and 15·6 μg/l, respectively.
The Fe intake and red meat consumption of the British population has decreased during the past three decades according to the National Food Survey. Groups at particular risk of low Fe stores are females aged 11–64 years (18–21 %) with serum ferritin < 15 μg/lReference Heath and Fairweather-Tait16. The continued high prevalence of Fe deficiency among premenopausal women in the USA is evident from findings of the United States National Health and Nutrition Examination Survey 2 (NHANES-II), which found a 25th percentile for serum ferritin of 14 μg/l in premenopausal womenReference Hallberg and Rossander-Hultén17, and NHANES-IV (1999–2000) which found a 19–22 % prevalence of Fe deficiency (measured by ‘two out of three’ abnormal indicators: serum ferritin, transferrin saturation, and free erythrocyte protoporphyrin) in non-Hispanic black and Mexican American women, a level about twice that in non-Hispanic white women18.
If, as suggested above, Fe and Zn nutriture are associated, then it is likely that Fe-deficient women in these surveys were also Zn deficient. While the worldwide prevalence of Fe deficiency with or without anaemia is uncertain, a conservative estimate is about 30 %Reference Stoltzfus19. Knowledge of the prevalence of Zn deficiency is more limited. A conservative estimate by the International Zinc Nutrition Consultative Group (IZiNCG), based on the food-balance sheets of the FAO and estimates of the average physiological requirements for absorbed Zn, suggests that about 20 % of the world's population is affectedReference Wuehler, Peerson and Brown20.
The above findings suggest that Fe-deficient premenopausal women without anaemia are likely to be Zn deficient. To test this hypothesis we used stable-isotope technology to measure Zn kineticsReference Yokoi, Egger, Ramanujam, Alcock, Dayal, Penland and Sandstead6, Reference Fairweather-Tait, Jackson, Fox, Wharf, Eagles and Croghan21, Reference Miller, Hambidge, Naake, Hong, Westcott and Fennessey22, and determined correlations between Zn nutriture (plasma Zn and Zn pool sizes) and Fe nutriture (serum Fe and serum ferritin), and of Zn and Fe indices with the frequencies of consumption of common foods.
Subjects and methods
Setting
The present study was accomplished in out-patient and in-patient settings. Initially respondents to advertisements were interviewed by telephone, then selected potential subjects were interviewed face to face in an office of the Division of Human Nutrition and laboratory specimens were collected using a treatment room in the Division of Human Nutrition, then the subjects were admitted to the General Clinical Research Center for about 48 h while Zn kinetics were measured. The Institutional Review Board of the University reviewed and approved the project. Each participant was informed verbally and using printed forms; each indicated her consent by signature, and each was given a copy of her signed consent form.
Participants
The participants were thirty-three apparently healthy premenopausal women, aged 19–39 years, from Galveston (TX, USA) and nearby communities. They were selected from 708 respondents of various ethnic backgrounds who responded to advertisements and were interviewed by telephone to exclude individuals with exclusion factors. This process identified 323 potential subjects who were screened in more detail. Inclusion criteria included: informed consent, a history consistent with good health, regular menses with a 24–34 d cycle, completion of twelve grades of school, income >2 × poverty, and normal physical examination and laboratory screening tests. Exclusion criteria included: anaemia (Hb < 110 g/l), chronic or recurrent illnesses, eating disorders, chronic medication, consumption of nutritional supplements that contained Fe and/or Zn within 60 d, skipped menstrual periods in the preceding month, alcohol consumption >2 ounces (57 g) daily, smoking > ten cigarettes daily, and use of controlled substances. After informed consent, a structured interview obtained socio-demographic and medical history data, and a food frequency history. A physical examination was done, and specimens of blood and urine were collected for a laboratory evaluation by the Hospital Clinical Pathology Laboratory.
Blood analytes included: serum concentrations of ferritin as a measure of Fe storesReference Jacob, Sandstead, Klevay and Johnson23, Reference Cook, Lipschitz, Miles and Finch24, Fe, electrolytes (Na, Cl, Ca, inorganic phosphate, bicarbonate and anion gap), liver enzymes, cholesterol, creatinine, and urea N. Haematological examination included Hb concentration, erythrocyte indices, leucocyte differential count and erythrocyte sedimentation rate. Urinalysis included specific gravity, protein, glucose, and microscopic examination of sediment.
Individuals (n 129) who met all selection criteria were enrolled in the randomised controlled trial of Zn treatment or Fe treatment in the context of adequate intakes of other micronutrients on neuropsychological performance. Results will be reported elsewhere; a preliminary evaluation suggested Zn was efficacious for several tasks and Fe was efficacious for one taskReference Penland, Egger, Ramanujam, Dayal and Sandstead25. The findings concerning Zn were consistent with previous observations on 740 Chinese children aged 6–9 years of ageReference Sandstead, Penland, Alcock, Dayal, Chen, Li, Zhao and Yang26.
Zn kinetics were measured in the first fifty subjects after they had been administered the oral micronutrient supplement without Zn or Fe for at least 7 d. The micronutrient supplement was given to replenish latent deficiencies that might suppress the efficacious effect of ZnReference Sandstead, Penland, Alcock, Dayal, Chen, Li, Zhao and Yang26–Reference Solomons, Ruz and Gibson28. The micronutrient supplement provided all micronutrients that in 1989 were designated an RDA or estimated safe and adequate daily dietary intake (ESADDI) by the Food and Nutrition Board, National Academy of Sciences, USA, in an amount that was 50 % of the RDA or ESADDI for women this age. Based on the self-reported questionnaire, the thirty-three subjects who were not taking oral contraceptives were selected from the fifty subjects for the present report.
Outcomes
The main baseline outcomes relevant to the present report were food frequency, menstrual history, and indices of Fe and Zn status. Of the latter, Zn kinetics were measured on days 8–12 of the menstrual cycle.
Zinc tracer
The procedures for Zn kinetics have been reportedReference Yokoi, Egger, Ramanujam, Alcock, Dayal, Penland and Sandstead6, Reference Yokoi, Alcock and Sandstead10, Reference Yokoi, Alcock and Sandstead29. Subjects were admitted to the University of Texas Medical Branch General Clinical Research Center (Galveston, TX, USA). Meals provided < 6 mg Zn/24 h. On the first night, subjects were fasted for at least 8 h. The next morning blood samples were collected, using trace metal-free syringes and tubes, for indices of Fe and Zn status, and the 67Zn chloride tracer was administered as follows.
The 67Zn chloride tracer was prepared from 67Zn oxide (67Zn natural abundance 4·11 %; enrichment, 93·11 %; Oak Ridge National Laboratories, Oak Ridge, TN, USA). The 67Zn chloride solution was tested for sterility (Department of Clinical Microbiology and Immunology, University of Texas Medical Branch) and pyrogenicity (Scientific Associates Inc., St Louis, MO, USA). Short Teflon catheters were placed in both antecubital veins. After a baseline blood sample was taken, 2 mg 67Zn as the chloride dissolved in normal saline was administered over 3 min through the catheter in one arm. Samples of at least 10 ml were taken from the other arm at 5, 15, 30, 40, 50, 60 and 90 min, and at 2, 6, 12 and 24 h after the administration of the 67Zn. Zn pool sizes were determined from the data over the 24 h observation period after intravenous administration of 67Zn.
Body composition measurement
The following morning, after an overnight 12 h fast, fat-free mass (FFM) was measured, with the bladder empty, by bioelectrical impedance analysis using a BIA-101A analyser (RJL Systems, Clinton Twp., MI, USA)Reference Kyle, Bosaeus and De Lorenzo30. Height (nearest cm) and weight (nearest 0·1 kg) were measured. Subjects were positioned supine with their arms and legs abducted. Signal-introducing electrodes were applied to the dorsal surface of the proximal phalanx of the right middle finger and just proximal to the middle toes of the dorsal surface of the right foot. Detecting electrodes were applied to the dorsal surface of the right wrist between the prominences of radius and ulna and on the dorsal side of the right ankle between the malleoli. FFM (nearest 0·1 kg) was calculated using the software (Weight Manager version 2.05a; RJL Systems) provided by the manufacturer.
Chemical analyses
The plasma samples were digested with H2O2 (30 %)Reference Alcock31 and dissolved in 1 % nitric acid. Plasma Zn was measured by flame atomic absorption spectrophotometryReference Alcock31. 67Zn:68Zn ratios in plasma were measured by inductively coupled plasma-mass spectrometer VG PlasmaQuad-1, upgraded to a PlasmaQuad-2 plus status (VG Instruments, Winsford, Cheshire, UK)Reference Ramanujam, Yokoi, Egger, Dayal, Alcock and Sandstead32. The CV of the isotope ratio measurement was 0·2 to 0·6 %. Each sample was analysed with ten replicate runs to obtain optimal precision.
Zinc kinetics
Zn kinetic parameters including Zn pool sizes (Fig. 1), i.e. central Zn pool (Q 1), lesser peripheral Zn pool (Q 2), greater peripheral Zn pool (Q 3) and rapidly exchangeable Zn pool (EZP) as a sum of Q 1, Q 2 and Q 3, were calculated based on a closed mammalian model as reportedReference Yokoi, Egger, Ramanujam, Alcock, Dayal, Penland and Sandstead6. Zn pools Q 1, Q 3 and EZP were divided by FFM to obtain Q 1/FFM, Q 3/FFM and EZP/FFM, because Zn pools except for Q 2 were almost proportional to FFM. The lesser peripheral Zn pool Q 2 that presumably represents a certain proportion of liver Zn did not correlate with FFMReference Yokoi, Egger, Ramanujam, Alcock, Dayal, Penland and Sandstead6. Therefore, Q 2 was not corrected by FFM.
Diagrammatic representation of the three-compartment mammillary model for human Zn kinetics. Q 3, size of the greater peripheral Zn pool (compartment 3); Q 2; size of the lesser peripheral Zn pool (compartment 2); Q 1, size of the central Zn pool (compartment 1); kij, fractional transfer rate into compartment i from compartment j; → , the point of Zn tracer administration.

Food-frequency questionnaire
Intake frequency of foods was assessed with a self-administered FFQ established by Willett et al. Reference Willett, Sampson, Stampfer, Rosner, Bain, Witschi, Hennekens and Speizer33. The study participants completed the questionnaire during their visits. The participants were instructed as follows: ‘Please indicate how often you usually eat certain foods. Think about your usual diet over the past month. How often do you usually eat these foods per day, per week, or per month? If you never ate them tick the never box and if you do not know how much you ate tick the DK (do not know) box.’ Participants reported therefore their average intake frequency only (not portion sizes) over the past month. To facilitate understanding by subjects, examples of dishes that contain the specified food item were shown.
Statistical tests
Simple and multiple regressions and non-linear regression with the broken-line equationReference Yokoi, Egger, Ramanujam, Alcock, Dayal, Penland and Sandstead6 were used to analyse the relationships between Fe and Zn indices and those between food frequencies and Fe and Zn indices. If non-linearity was observed by the inspection of plots, the data were fitted to the broken-line equation. In regression analyses, food frequencies (number of consumptions per week) were used as independent variables, as were biochemical and anthropometric parameters and the index of excessive menstrual blood loss. As an objective index of excessive menstrual blood loss, a history of ‘bleeding through menstrual pads’ was usedReference Yokoi, Alcock and Sandstead10. If the subjects answered ‘yes’ to the question ‘bleeding through menstrual pads’, 1 was given to the bivalent variable. When the subjects answered ‘no’, 0 was given.
The variables included in the initial independent variable set for stepwise multiple regression analysis of Zn indices and Fe parameters were body height, Hb, serum ferritin, serum Fe and bleeding through menstrual pads. For Q 2, FFM was also added to the initial set.
The variables included in the initial independent variable set for stepwise multiple regression analysis of the relationship between Fe and Zn indices (serum ferritin, serum Fe, plasma Zn, Zn pool sizes) and food frequencies were consumption (times/week) of beef, vitamin C-fortified drinks, orange juice, eggs, yoghurt, milk, coffee, tea, beans and bran breakfast cereals, and body height and bleeding through menstrual pads. FFM was also added to the initial variable set for the analysis of serum ferritin, serum Fe, plasma Zn and Q 2.
The independent variables were selected from the initial independent variable set by the backward variable selection with P ≤ 0·10 as an inclusion criterion and P>0·10 as an exclusion criterion. Outliers were serially detected when the P values for the Studentised residual were less than 0·05 with Bonferroni's correction in regression analyses. All statistical tests including simple linear regression, stepwise multiple linear regression, non-linear regression and Fisher's exact probability test were done using the SYSTAT software version 10·2 (Systat Software, Inc., San Jose, CA, USA). P values < 0·05 were considered significant.
Results
Characteristics of subjects
The characteristics of the thirty-three subjects are shown in Table 1. Ethnicity designated by the subjects included twenty-one non-Hispanic whites, four African-Americans, one Asian and seven with Spanish surnames. Since anaemia was an exclusion factor, Hb concentrations were >110 g/l. Twenty-one subjects had serum ferritin concentration < 20 μg/l, a criterion to detect low Fe storesReference Thoradeniya, Wickremasinghe, Ramanayake and Atukorala11–Reference Pate, Miller, Davis, Slentz and Klingshirn13. Three subjects had Fe-deficient erythropoiesis (erythrocyte protoporphyrin > 1000 μg/l)Reference Beard, Dawson, O'Dell and Sunde34. Consistently, a significant inverse relationship (P < 0·005) was found between serum ferritin and erythrocyte protoporphyrin (Fig. 2). When the data were limited within serum ferritin less than 20 μg/l, no correlation was observed (P = 0·897). Serum ferritin concentration of all subjects with Fe-deficient erythropoiesis was < 20 μg/l. Seventeen subjects had plasma Zn concentration < 10·7 μmol/l (700 μg/l). Food frequencies (times/week) of the subjects are shown in Table 2. Five subjects out of thirty-three reported a history of bleeding through menstrual pads.
(Mean values and standard deviations)

* n 32.
† Geometric mean.
‡ Antilog of standard deviation of the logarithmically transformed data.
Relationship between serum ferritin and erythrocyte protoporphyrin (EP). Linear regression between logarithmically transformed serum ferritin and logarithmically transformed EP was calculated. The regression line in the Cartesian coordinate system with the untransformed axes of serum ferritin and EP can be described by: EP (μg/l) = 1354 SF (μg/l)− 0·341, where SF denotes serum ferritin (n 33; R 2 0·234; P < 0·005; F test).

(Mean values and standard deviations)
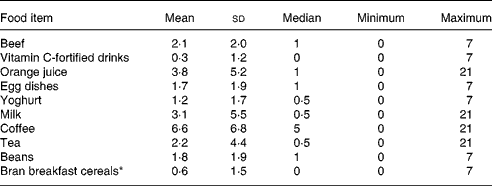
* n 32.
Relationship between iron parameters and zinc pool sizes
The correlation coefficients between Zn pool sizes and plasma Zn concentration, serum Fe concentration, and serum ferritin concentration are shown in Table 3. Plasma Zn positively and significantly correlated with Q 1/FFM and Q 2. Serum Fe positively and significantly correlated with plasma Zn and Q 2. Serum ferritin positively and significantly correlated with plasma Zn, Q 1/FFM, Q 2, Q 3/FFM and EZP/FFM.
(Correlation coefficients)

Q 1, size of the central Zn pool (compartment 1 in Fig. 1); FFM, fat-free mass; Q 2, size of the lesser peripheral Zn pool (compartment 2 in Fig. 1); Q 3, size of the greater peripheral Zn pool (compartment 3 in Fig. 1); EZP, rapidly exchangeable Zn pool size, a sum of Q 1, Q 2 and Q 3; TR, plasma Zn turnover rate.
* Correlation was significant (P < 0·05).
† P values were determined by F test.
‡ n 33.
§ n 32.
The relationship between Fe parameters and Zn pool sizes was further analysed by stepwise regression analysis as shown in Table 4. Simple and multiple regression analysis found serum ferritin positively correlated with Q 1/FFM. The effect of excessive menstrual bleeding exemplified by bleeding through menstrual pads on Q 1/FFM was marginal (0·05 < P < 0·10). Simple and multiple regression analysis also found serum ferritin and serum Fe as positively correlated with Q 2. Simple and multiple regression analysis found serum ferritin to be positively correlated with Q 3/FFM. Similar to Q 3/FFM, both simple and multiple regression analysis found serum ferritin positively correlated with EZP/FFM. For plasma Zn, only serum Fe was significantly associated by stepwise regression analysis.
(Simple and multiple regression coefficients)

Q 1, size of the central Zn pool (compartment 1 in Fig· 1); FFM, fat-free mass; BTMP, bleeding through menstrual pads (yes or no: 1 was given for ‘yes’; 0 was given for ‘no’); Q 2, size of the lesser peripheral Zn pool (compartment 2 in Fig. 1); Q 3, size of the greater peripheral Zn pool (compartment 3 in Fig. 1); EZP, rapidly exchangeable Zn pool size.
* The potential variables included in the initial variable set were body height, Hb, serum ferritin, serum Fe and BTMP for Q 1/FFM, Q 3/FFM and EZP/FFM. For Q 2, FFM was also included in the potential variables. P values were determined by F test.
Because non-linearity was found by inspection of the plot of serum ferritin v. Q 2, the relationship between serum ferritin and Q 2 was analysed by non-linear regression with the broken-line equation. After serial removal of outliers when the P values for the Studentised residual were < 0·05 with Bonferroni's correction in each step of non-linear regression, the final values of the coefficients of the broken-line equation were obtained. Fig. 3 indicates the plot of the included subjects, outliers and the regression line. The broken line fitted to the data was described by the following equation:

where SF denotes serum ferritin, α denotes a half value of the slope of the broken line above the breakpoint, β denotes serum ferritin at the breakpoint, and γ denotes the value of Q 2 at the horizontal section of the broken line. The estimate of serum ferritin at the breakpoint (β) was 21·0 (asymptotic se 2·9) μg/l. The estimate of Q 2 at the horizontal section of the broken line (γ) was 73·1 (asymptotic se 4·3) μmol. The estimate of the slope above the breakpoint (2 α) was 4·02 (asymptotic se 0·41) μmol/μg per l.
Non-linear relationship between serum ferritin and the lesser peripheral Zn pool size (Q 2). The broken line fitted to the data was described by the following equation: Q 2 (μmol) = 2·007 (SF (μg/l) − 21·0)+2·007 |SF (μg/l) − 21·0|+73·1, where SF denotes serum ferritin (n 28; R 2 0·891; P < 0·001; F test). (●), Data included in the broken-line model; (▲), outliers with a subject identification (ID) number. Outliers were classified into three groups. Group 1 includes subject nos. 156 and 312 who had a high frequency of consumption of vitamin C-rich foods (Zn absorption inhibitors and Fe absorption enhancers) consistent with a negative deviation of Q 2 compared with serum ferritin. Group 2 includes subject nos. 104 and 159 who had a low frequency of intake of vitamin C-rich foods (Zn absorption inhibitors and Fe absorption enhancers) consistent with a positive deviation of Q 2 compared with serum ferritin. Group 3 includes subject no. 114 who had a low urinary Zn loss consistent with a positive deviation of Q 2 compared with serum ferritin.

Outliers were serially detected when the P values for the Studentised residual in non-linear regression were < 0·05 with Bonferroni's correction. By this procedure, five outliers were detected. In subject nos. 104, 114 and 159, Q 2 was higher than the estimate from serum ferritin concentration. In subject nos. 156 and 312, Q 2 was lower than the estimate from serum ferritin concentration. No outlier reported bleeding through menstrual pads.
The outliers found were classified into three groups
Group 1 included subjects 156 and 312 and was characterised by a high frequency of intake of vitamin C-rich foods (Zn absorption inhibitors and Fe absorption enhancers) consistent with a negative deviation of Q 2 compared with serum ferritin. Subject no. 156 had a frequency of intake of orange juice of five times/week and a frequency of intake of vitamin C-fortified drinks of 0·5 times/week. Subject no. 312 had a frequency of intake of orange juice of seven times/week and a frequency of intake of vitamin C-fortified drinks of 0·5 times/week.
Group 2 included subjects 104 and 159 and was characterised by a low frequency of intake of vitamin C-rich foods (Zn absorption inhibitors and Fe absorption enhancers) consistent with a positive deviation of Q 2 compared with serum ferritin. Subject no. 104 had a frequency of intake of orange juice of 0·5 times/week and a frequency of intake of vitamin C-fortified drinks of zero. Subject no. 159 had a frequency of intake of orange juice of zero and a frequency of intake of vitamin C-fortified drinks of zero and had a higher frequency of intake of a possible Zn absorption enhancer (yoghurt seven times/week).
Group 3 included subject 114 and was characterised by a low Zn loss consistent with a positive deviation of Q 2 compared with serum ferritin. Subject no. 114 had an extremely low urinary Zn excretion rate constant (0·0645/d) compared with hypozincaemic subjects (average excretion rate constant, 0·175/d) and normozincaemic subjects (0·344/d)Reference Yokoi, Egger, Ramanujam, Alcock, Dayal, Penland and Sandstead6.
Because these outliers had conspicuous food frequencies as shown above, we tried to explain the association between Fe parameters and Zn pool sizes based on the common factors including food frequencies, anthropometric parameters and menstrual blood loss.
Association between subjects' food intake histories and serum ferritin and zinc pool sizes
The association of serum ferritin with food frequencies and bleeding through menstrual pads is shown in Table 5. The frequency of beef consumption correlated positively with serum ferritin. Bleeding through menstrual pads correlated negatively with serum ferritin. The negative association between bran breakfast cereal consumption and serum ferritin was marginal. For serum Fe, only the frequency of consumption of coffee was selected by stepwise regression. The constant was 9·6 (sd 1·3) and the regression coefficient was 0·435 (se 0·138) (n 31; R 2 0·254; se of estimate 5·2; P = 0·004). The association of plasma Zn with food frequencies is shown in Table 6. The frequency of consumption of coffee was found to be a positive predictor while the frequency of consumption of orange juice was a negative predictor for plasma Zn.
(Regression coefficients and partial correlation coefficients)

* The dependent variable entered was serum ferritin (μg/l). The independent variables included in the model explain 44 % of the variation in serum ferritin (R 2 0·443; se of estimate 8·20; P = 0·002; F test). The potential variables included in the initial variable set were consumption (times/week) of beef, vitamin C-fortified drinks, orange juice, eggs, yoghurt, milk, coffee, tea, beans and bran breakfast cereals, and body height, fat-free mass and BTMP.
† Yes or no: 1 was given for ‘yes’; 0 was given for ‘no’.
(Regression coefficients and partial correlation coefficients)

* The dependent variable entered was plasma Zn. The independent variables included in the model explain 25 % of the variation in plasma Zn (R 2 0·252; se of estimate 1·2; P = 0·017; F test). The potential variables included in the initial variable set were consumption (times/week) of beef, vitamin C-fortified drinks, orange juice, eggs, yoghurt, milk, coffee, tea, beans and bran breakfast cereals, and body height, fat-free mass and bleeding through menstrual pads.
The association of Zn pool sizes with food frequencies and bleeding through menstrual pads is shown in Table 7. Beef was found to be a positive determinant of Q 1/FFM. Bleeding through menstrual pads and the frequency of bran breakfast cereals consumption were negative predictors of Q 1/FFM. The frequencies of yoghurt, coffee and beef consumption were positive determinants of Q 2. The frequencies of bran breakfast cereal and orange juice consumptions as well as bleeding through menstrual pads were negatively correlated with Q 2. The negative association of egg consumption on Q 2 was marginal. The frequency of beef consumption was positively correlated with Q 3/FFM. Presence of bleeding through menstrual pads was a negative predictor of Q 3/FFM. The association of body height with Q 3/FFM was marginal. The frequencies of beef consumption and coffee consumption were positively correlated with EZP/FFM. Body height and bleeding through menstrual pads were negatively correlated with EZP/FFM.
(Regression coefficients and partial correlation coefficients)

Q 1, size of the central Zn pool (compartment 1 in Fig. 1); FFM, fat-free mass; BTMP, bleeding through menstrual pads (yes or no: 1 was given for ‘yes’; 0 was given for ‘no’); Q 2, size of the lesser peripheral Zn pool (compartment 2 in Fig. 1); Q 3, size of the greater peripheral Zn pool (compartment 3 in Fig. 1); EZP, rapidly exchangeable Zn pool size.
* The potential variables included in the initial variable set were consumption (times/week) of beef, vitamin C-fortified drinks, orange juice, eggs, yoghurt, milk, coffee, tea, beans and bran breakfast cereals, body height, and BTMP for Q 1/FFM, Q 3/FFM and EZP/FFM. For Q 2, FFM was also included in the potential variables. P values were determined by F test.
Discussion
Association between iron and zinc indices
Consistent with our hypothesis, simple and multiple regression analyses and non-linear regression found strong associations between Zn (plasma Zn and Zn pool sizes) and Fe parameters (serum Fe and serum ferritin). There were some outliers from the regression line of serum ferritin v. Zn pool size Q 2. The outliers were explainable based on their extreme characteristics for food frequencies and Zn kinetics, consistent with the following discussion obtained from the analysis of the relationship between dietary and host factors and indices of Zn and Fe.
Dietary and host factors that affect iron stores
The critical role of food choice in Fe nutriture was confirmed again. The positive correlation between frequency of beef consumption and serum ferritin was consistent with previous reportsReference Yokoi, Alcock and Sandstead10, Reference Worthington-Roberts, Breskin and Monsen15, Reference Hallberg35–Reference Ortega, Lopez-Sobaler, Requejo, Quintas, Gaspar, Andres and Navia38. The frequency of consumption of bran breakfast cereals was inversely but marginally associated with serum ferritin. This is consistent with the fact that phytate and fibres in bran are inhibitors of Fe absorptionReference McCance, Edgecombe and Widdowson39, Reference Brune, Rossander-Hultén, Hallberg, Gleerup and Sandberg40.
The inverse association between menstrual blood loss and Fe stores was confirmedReference Yokoi, Alcock and Sandstead10, Reference Fogelholm, Alopaeus, Silvennoinen and Teirila12, Reference Milman, Rosdahl, Lyhne, Jorgensen and Graudal41, Reference Kepczyk, Cremins, Long, Bachinski, Smith and McNally42. A history of ‘bleeding through menstrual pads’ corresponded to an average 12 μg/l decrease in serum ferritin concentration in the present study. In our previous studyReference Yokoi, Alcock and Sandstead10, a history of ‘bleeding through menstrual pads’ corresponded to an average 14 μg/l decrease in serum ferritin concentration. Thus a history of ‘bleeding through menstrual pads’ can be considered a probable indicator of Fe depletion.
Dietary and host factors that affect zinc pool sizes
Beef and other red meats are sources of highly bioavailable ZnReference Sandstead5, Reference O'Dell, Burpo and Savage43, Reference Gallaher, Johnson, Hunt, Lykken and Marchello44. Therefore it was not surprising that we found a significant positive association between the frequency of beef consumption and Zn pool sizes, which was consistent with our previous finding of a significant inverse correlation between frequency of red meat consumption and plasma Zn disappearanceReference Yokoi, Alcock and Sandstead10.
Bran cereals contain phytate, dietary fibres and products of non-enzymic Maillard browning that inhibit Zn absorptionReference Wisker, Nagel, Tanudjaja and Feldheim45–Reference Sandström, Almgren, Kivisto and Cederblad53. Therefore we were not surprised to find that the frequency of consumption of bran breakfast cereals correlated inversely with Q 1/FFM and Q 2.
Coffee also contains Zn-chelating polyphenolic substances, such as a melanoidin-like polymer, that potentially bind Zn and inhibit its absorptionReference Pécoud, Donzel and Schelling54–Reference Wen, Enokizo, Hattori, Kobayashi, Murata and Homma57. We were surprised to find frequency of coffee consumption directly correlated with Zn pool sizes. Perhaps this is consistent with the findings that discontinuation of coffee for 5 months did not change plasma Zn concentrations or haematological status of Fe-deficient Guatemalan toddlersReference Dewey, Romero-Abal, Quan de Serrano, Bulux, Peerson, Eagle and Solomons58, that coffee fed to rats did not affect tissue Zn concentrationReference Aldrian, Keen, Lonnerdal and Dewey59 and that caffeine has no apparent effect on the intestinal absorption of ZnReference Rossowska and Nakamoto60.
We found that the frequent consumption of orange juice, a rich source of vitamin C, was associated with lower plasma Zn concentrations and smaller Q 2. Subjects nos. 156 and 312, whose Q 2 was lower than the predicted values from their serum ferritin concentrations by the broken-line regression (Fig. 3), reported a higher frequency of consumption of vitamin C-rich foods. In contrast, subjects nos. 159 and 104 reported a lower frequency of consumption of vitamin C-rich foods and had higher Q 2 than expected from serum ferritin (Fig. 3). These findings are consistent with the findings of Kies et al. Reference Kies, Young, McEndree and Inglett61 from balance studies of lower Zn retention in subjects supplemented with vitamin C. On the other hand Solomon et al. Reference Solomons, Jacob, Pineda and Viteri62 and Sandström & CederbladReference Sandström and Cederblad63 did not find that vitamin C decreased Zn absorption. The higher frequency of yoghurt consumption was associated with larger Q 2. Subject no. 159, whose Q 2 was higher than the predicted value from her serum ferritin concentration by the broken-line regression (Fig. 3), reported extremely high frequency of consumption of yoghurt (seven times/week). Lactic acid in the yoghurt increased Zn solubility and thus enhanced intestinal Zn absorption.
Stepwise multiple regression analysis using food frequencies and menstrual bleeding selected excessive menstrual blood loss as a negative predictor of Zn pool sizes. This finding suggests that the loss of Zn in erythrocytes was sufficient to impair Zn nutriture.
Proposal for a screening test to detect low zinc status
Performance of plasma Zn and serum ferritin as a screening test for small Zn pool size can be evaluated when a Q 2 of 112 μmol (7·3 mg) is set as the critical value of a small Zn pool sizeReference Yokoi, Egger, Ramanujam, Alcock, Dayal, Penland and Sandstead6. We found low Q 2 ( < 112 μmol) present in twenty of twenty-three subjects with plasma Zn < 11·5 μmol/l (750 μg/l) and in three of ten subjects with plasma Zn ≥ 11·5 μmol/l (OR 15·6; P = 0·002; Fisher's exact probability test). The sensitivity was 74·1 % and specificity was 50·0 %. Low Q 2 ( < 112 μmol or 7·3 mg) was evident in nineteen of twenty-one subjects with serum ferritin < 20 μg/l and in four of twelve subjects with serum ferritin ≥ 20 μg /l (OR 19·0; P = 0·001; Fisher's exact probability test). The sensitivity was 70·4 % and specificity was 66·7 %. When co-occurrence of low plasma Zn ( < 11·5 μmol/l) and low serum ferritin ( < 20 μg/l) was used as a criterion for detecting low Q 2 ( < 112 μmol or 7·3 mg), low Q 2 was present in sixteen of seventeen subjects with both low plasma Zn and low serum ferritin, and in seven of sixteen subjects with normal plasma Zn or normal serum ferritin (OR 20·6; P = 0·002). The sensitivity was 64·0 % and specificity was 87·5 %. The combination of plasma Zn and serum ferritin improved specificity while sensitivity was slightly decreased. We propose that serum ferritin or the combination of serum ferritin and plasma Zn might be useful as a screening test for low Zn nutriture, and a basis for confirmatory studies.
In conclusion, we found high associations between indices of Zn nutriture (plasma Zn and Zn pool sizes) and Fe nutriture (serum Fe and serum ferritin) in premenopausal women with normal Fe status or low Fe status without anaemia. Both low Fe stores and low Zn pool sizes were likely to be derived from common dietary and host factors. For both Zn pool sizes and serum ferritin, beef was a positive predictor, and bran breakfast cereals and bleeding through menstrual pads were negative predictors. Premenopausal women who (a) infrequently consume sources of bioavailable Zn and Fe, or (b) infrequently consume rich sources of enhancers of Zn and Fe absorption and (c) frequently consume rich sources of inhibitors of Zn and Fe absorption and/or (d) have excessive menstrual bleeding are likely to be at risk of simultaneous deficiencies of Zn and Fe.
Acknowledgements
The present study was supported in part by US Department of Defense Army grant DAMD 17-95-C-5112, and grant M01 RR 00 073 from the National Center for Research Resources, National Institutes of Health, United States Public Health Service, that funded the General Clinical Research Center at the University of Texas Medical Branch at Galveston.



