

Pulses have been consumed for at least 10 000 years and are among the most extensively used foods in the world. Nutritionally, they are characterised by high protein content (about 20–30 %), a very high proportion of carbohydrate (about 50–65 %) and a very low fat content (about 1 %). They are a significant source of many nutrients, including fibre, protein and Fe, as well as many vitamins. However, their consumption in the Western world remains quite low at less than 3·5 kg/capita per year. In other parts of the world, annual pulse consumption can range from 10 kg/capita (South America and India) to 40 kg/capita (Burundi)(Reference Leterme and Munõz1, Reference Ofuya and Akhidue2).
Pulses are the edible seeds of members of the Fabaceae (Leguminosae) family. According to the FAO, pulse crops refer to crops harvested exclusively for their grain, including dry beans, peas and lentils. As defined further by the FAO, the definition excludes crops used for oil extraction, such as soyabeans and groundnuts or those harvested green for food, such as green beans and green peas(3–Reference Patterson, Maskus and Dupasquier6). For the purpose of the present study, the FAO definition is used and the term ‘pulses’ refers to the dry, edible variety of beans, peas and lentils, and excludes soyabeans, fresh beans and fresh peas.
Research supporting pulse consumption coupled with diets low in animal protein and high in grains and cereals has been substantial. Results from six clinical trials reported at the 2008 Pulse Crop Symposium held in Toronto showed that eating beans, peas, lentils and chickpeas can help combat chronic diseases such as heart disease, obesity and diabetes and contribute to overall good health. These clinical trials linked pulse consumption with a reduction in health problems such as obesity, diabetes and CVD(7–Reference Tosh and Yada9). Pulses contain a mixture of soluble and insoluble fibre, which lowers total serum and LDL-cholesterol and aids in gastrointestinal function, respectively(Reference Patterson, Maskus and Dupasquier6, Reference Tosh and Yada9). With respect to cancer, the US Food and Drug Administration, Canadian Cancer Society and the World Cancer Research Fund also recommend the consumption of pulses to reduce cancer risk(Reference Guenther, Dodd and Reedy10–Reference Venter and van Eyssen12). Nutritive components of pulses such as Se, Zn, fibre and folate, as well as phytochemicals such as saponins, protease inhibitors and phytic acid also may be associated with their anti-carcinogenic benefits(Reference Patterson, Maskus and Dupasquier6, Reference Messina13). A high consumption of pulses also is one of the eight components of the highly lauded Mediterranean diet(Reference Willet, Sacks and Trichopoulou14). Research has shown that their consumption leads to increased satiety, and high-fibre foods take longer to eat, increasing one's feeling of satiety(Reference Anderson, Smith and Gustafson15). While it remains inconclusive, studies have shown that pulse consumers had lower body weights and reduced waist circumferences compared with non-consumers(Reference Papanikolaou and Fulgoni16), making pulses ideal for individuals interested in weight loss(Reference Patterson, Maskus and Dupasquier6). In addition to being low in fat and Na, pulses have a low glycaemic index, which may be a factor in diabetes prevention and management(Reference Patterson, Maskus and Dupasquier6, Reference Jenkins, Axelsen and Kendall17, Reference Rizkalla, Bellisle and Slama18). They do not contain cholesterol or gluten, and research has also examined their protective effects as prebiotics(Reference Anderson, Smith and Washnock8).
Canada's Food Guide recommends the consumption of pulses as a good choice and considers a half-cup serving of pulses equal to one serving of vegetables, and a three-quarter-cup serving equal to one meat or alternative serving(19). The advisory committee on the Dietary Guidelines for Americans in 2010 suggested shifting food intake patterns to include cooked dry beans and peas, while the US Department of Agriculture recommends that Americans consume 2·5 to 3·5 cups of pulses per week(20, Reference Putnam, Kantor and Allshouse21). Data from the US National Health and Nutrition Examination Survey (NHANES) 1999–2000 showed that American adults consume one-third or less than the recommended serving of pulses. In our recent analysis of pulse consumption in the USA using the NHANES data we found that the average consumption of pulses was less than one cup per week. We also found that pulse consumption resulted in higher intakes of fibre, carbohydrate, protein, Ca, K, folate, Zn, Fe and Mg, with lower intakes of saturated as well as total fat(Reference Mitchell, Lawrence and Hartman22).
The purpose of the present study was to examine the demographics of the average Canadian pulse consumer using data from the Canadian Community Health Survey, Cycle 2·2 (CCHS 2·2). We report the prevalence of pulse intake in the Canadian population and assess the relationship between pulse consumption and nutrient intakes and diet quality.
Experimental methods
Data from the CCHS 2·2 conducted by Statistics Canada were used for this analysis(23). This cross-sectional survey targeted respondents from all age groups living in private occupied dwellings in the ten provinces (Indian reserve occupants, residents of the territories of Nunavut, Yukon and the Northwest Territories, individuals residing in institutions and members of the Canadian Forces were excluded). Data collection began in January 2004 and continued throughout the year to remove seasonal effects. The main objectives were to gather information on the nutritional status of Canadians, and estimate the distribution of usual dietary intake in terms of foods, food groups, dietary supplements, nutrients and eating patterns among a representative sample of Canadians at national and provincial levels using a 24 h dietary recall. A grand total of 35 107 adults and children completed the initial 24 h dietary recall. Following this, a subsample of 10 786 completed a secondary recall 3–10 d later. The 24 h dietary recalls were collected primarily by face-to-face interviews by trained interviewers(24, 25). Further details on the methods used in the CCHS 2·2 are available on the Statistics Canada Website(26). Data for the present analysis were limited to adults aged ≥ 19 years (n 20 156) and to 1 d dietary intakes only. Respondents who did not consume any food or whose recalls were considered to be unreliable according to Health Canada were removed. Pregnant and breast-feeding women were included in the present study and although vitamin and mineral supplementation was coded for in the CCHS 2·2, these intakes were not accounted for in the present study.
The CCHS 2·2 also gathered physical measurements of the participants, as well as data on selected health conditions and socio-economic and demographic characteristics of respondents. Key demographic variables were examined to observe the demographic of the average Canadian pulse consumer. Sex was examined as well as age, and a new variable was created, splitting the respondents into one of four age groups: 19–30 years, 31–50 years, 51–70 years and 70+years. The cultural background variable placed respondents into categories based on their cultural or racial origin and the education level placed respondents into one of four categories based on their highest level of education attained. Income also was examined, splitting the respondents into four groups based on their income adequacy. The classifications were as follows: ‘lowest income’ for one or two individuals with an income of ≤ $15 000, three or four individuals with an income of ≤ $20 000, or greater than five individuals with an income ≤ $30 000; ‘lower middle income’ for one or two individuals with an income between $15 000 and 29 999, three or four individuals with an income between $20 000 and 39 999 or greater than five individuals with an income between $30 000 and 59 999; ‘upper middle income’ for one or two individuals with an income between $30 000 and 59 999, three or four individuals with an income between $40 000 and 79 999, or greater than five individuals with an income between $60 000 and 79 999; and ‘highest income’ for one or two individuals with an income ≥ $60 000, or three or four individuals with an income ≥ $80 000(23).
To identify all foods and food sources that contained pulses, the following files were used: the food and ingredient details file, the food description file and the food recipe level file. Soyabeans and fresh beans were excluded from the analysis according to the FAO definition of pulses used in the present paper. Food sources included varieties of dry beans (Phaseolus vulgaris) such as the pinto bean, navy bean, kidney bean and black bean, as well as the mung bean (Vigna radiata) and peas which included yellow peas (Lathyrus aphaca), split green peas (Pisum sativum), chickpeas (Cicer arietinum), black-eyed peas (Vigna unguiculata) and lentils (Lens culinaris)(27). Pulse consumers were defined as respondents who consumed pulses or a pulse-containing product for the 1 d dietary intakes. Consumers were further divided into quartiles based on their level of consumption. Data for macro- and micronutrients were expressed as absolute values, percentage energy or quantity per 4184 kJ (1000 kcal). The percentage of consumers and non-consumers with nutrient intakes below the Institute of Medicine's Dietary Reference Intakes for nutrients that had an estimated average requirement (EAR) were calculated(Reference Otten, Pitzi Hellwig and Meyers28). To identify the amount of pulse product per 100 g of food the Canadian Nutrient File, version 2007b, recipe database and the US Department of Agriculture (USDA) Food and Nutrient Databases for Dietary Studies, version 1.0, were used to find ingredient proportions and process intake data for nutrient components. Food group intake data were obtained from the Canada Food Guide file(23). Further details on both the Canadian Nutrient File database and the USDA Food and Nutrient Database are available on their respective websites(26, 29).
General linear models were used to analyse macronutrient and micronutrient intakes and to compare nutrient intakes and other variables between non-consumers and consumers as well as between non-consumers and consumers at each of the four levels of consumption. In addition, similar analyses were conducted for each of the food groups using the data from the CCHS's Canada Food Guide file. Logistic regression was used to determine whether any demographic variables (sex, age, culture, province of residence, income adequacy and education level) increased the likelihood of being classified as a pulse consumer and OR were calculated. Cross-tabulations and χ2 tests were used to compare the proportions of consumers and non-consumers who had intakes of nutrients below their respective EAR values. The significance level was set at P < 0·05 for differences and 0·05 < P < 0·10 for trends. All analyses were performed using PASW SPSS Statistics (version 18; IBM) and SUDAAN Statistical Analysis Software Package (version 10.0.1; RTI International).
Because the CCHS 2·2 is a multi-stage survey design, it requires a more complex formula to calculate variance estimates. The approximation method used by the CCHS 2·2 is called ‘bootstrapping’. This method is used to estimate standard errors, coefficients of variation and CI. Bootstrapping is an approach used to estimate distribution from a sample's statistics. It also can be defined as ‘sampling within a sample’ and involves the selection of random samples known as replicates, and the calculation of the variation in the estimates from replicate to replicate(Reference Rao, Wu and Yu30–32). The bootstrapping method was used in all the data analyses for the present study via SUDAAN software.
Results
Food sources of pulse products
The main sources of pulses in the adult Canadian diet were mung beans, Mexican or Hispanic mixed dishes, kidney beans, baked beans, bean soups and chilli. These seven dishes made up two-thirds of the twenty-two dishes containing pulses in the Canadian diet mentioned in the 1 d recall data (Table 1).
Food sources of pulse products in the adult Canadian diet*
* According to 1 d 24 h dietary recall of the Canadian Community Health Survey, Cycle 2·2 (2004) of Canadian adults aged ≥ 19 years.
† Excluding chilli.
‡ Includes rice with beans, navy beans, falafel, unspecified beans, bean dip, adzuki beans, winged beans, and noodles with beans, which each represent less than 1 % of food sources reported.
Frequency of consumption and demographics
On any given day, 13·1 % of Canadian adults in 2004 consumed dry beans, peas or lentils (Table 2). Within pulse consumers, average pulse intake was highest in New Brunswick and lowest in Quebec, with the provinces of Ontario and British Columbia having the highest proportions of pulse consumers as residents. The highest proportion of consumers fell into the 51–70 years age bracket (Table 2). Pulse consumption in grams also differed between age groups, but not when expressed relative to energy intake (data not shown).
(Odds ratios and 95 % confidence intervals; mean values and standard errors)

*Mean value was marginally significantly different from that of the 70+years age group (0·05 < P < 0·10).
Mean value was (marginally) significantly different from that of consumers of the province of Quebec: † 0·05 < P < 0·10, †† P < 0·05.
Participants who identified themselves as Asian Canadian compared with Caucasian were 3·6 times more likely to be pulse consumers. As well, participants who identified themselves as being Arabic, Latin and African Canadian or of multiple cultural origins were 1·6 times more likely to be pulse consumers than Caucasians. Sex, income and education level were not significant determinants of pulse intake (Table 2).
Effects on nutrient intake
When examining differences in dietary intakes across quartiles of consumption and comparing them with non-consumers (Table 3), consumers in the third (99 g/d) and fourth quartile (294 g/d) of pulse consumption consumed 937 kJ (224 kcal) or 11 % and 1360 kJ (325 kcal) or 16 % more energy per d, respectively, than the average non-consumer. Pulse consumers in the third and fourth quartiles consumed 13 and 24 % more carbohydrate and 12 and 19 % more protein, respectively, than non-consumers, while fat intake was only higher in the third quartile of pulse consumers (by 12 % more than non-consumers). The higher fat intake in pulse consumers in the third quartile was consistent with the higher MUFA, PUFA, linolenic and linoleic fatty acid content in the diets of these individuals. In addition, α-linolenic acid intake was 44 % higher in the fourth quartile of pulse consumers compared with non-consumers. Fibre intake was increased the most by pulse consumption, being 34 and 85 % higher, respectively, in the third and fourth quartile of pulse intake. Cholesterol intake was 18 % higher in the second quartile of pulse intake, but not at the other levels of pulse intake. However, when expressed relative to energy intake, cholesterol levels were lowest in the highest quartile of pulse consumption. A number of micronutrients were higher in the highest pulse consumers compared with non-consumers (Table 3). These included folate (45 %), P (20 %), Mg (35 %), Fe (35 %) and Zn (28 %). As a result, the proportion of those consuming these nutrients below the EAR was lower in consumers compared with non-consumers, indicating a reduced level of deficiency in consumers (Table 4). K intake also was higher among pulse consumers, and, although it lacks an EAR, analysis using adequate intake levels showed no significant difference between consumers and non-consumers (data not shown). In contrast, the levels of two vitamins were lower in the fourth quartile of pulse consumers compared with non-consumers: vitamin D (20 %), and vitamin B12 (14 %). However, the proportion of those that were below the EAR for these two nutrients was similar for both consumers and non-consumers. Finally, Na intake was 31 % higher in pulse consumers v. non-consumers.
(Mean values with their standard errors)
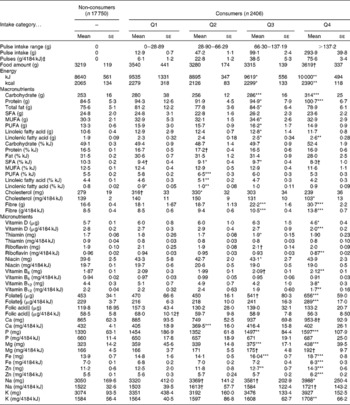
Mean value was significantly different from that of the non-consumer group: * P < 0·05, ** P < 0·01, *** P < 0·001.
† Mean value was marginally significantly different from that of the non-consumer group (0·05 < P < 0·10).
‡ 4184 kJ is equivalent to 1000 kcal.
§ Folate intake from food in dietary folate equivalency.
∥ Folic acid is the synthetic form of folate, found in fortified foods.
Prevalence of inadequacy for nutrients‡ with an estimated average requirement (EAR) in Canadian adults based on 1 d intakes from the Canadian Community Health Survey, Cycle 2·2 (2004)
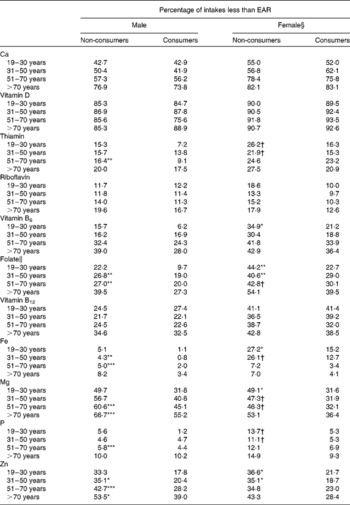
Mean value was significantly different from that of non-consumers in the same life-stage group: * P < 0·05, ** P < 0·01, *** P < 0·001.
† Mean value was marginally significantly different from that of non-consumers in the same life-stage group (0·05 < P < 0·10).
‡ Not including K (which lacks an EAR) and niacin (analysis showed no significant difference between groups).
§ Excluding pregnant or lactating women.
∥ Folate intake from food in dietary folate equivalency.
Fruit and vegetable consumption was higher in the higher quartiles of pulse consumption, when compared with non-consumers, resulting in approximately one more serving from this food group. There was no difference in the amount of total grain products or dairy products between pulse consumers and non-consumers. In the two highest quartiles of pulse consumers, intakes from the meat and alternatives food groups were 1–3·5 servings higher when compared with non-consumers, consistent with the inclusion of pulses in this food group by Health Canada in this database (Fig. 1).
Food group intakes among non-consumers (□) and by quartiles (![]() , quartile 1;
, quartile 1; ![]() , quartile 2;
, quartile 2; ![]() , quartile 3; ■, quartile 4) of pulse consumers based on 1 d intakes from the Canadian Community Health Survey Cycle 2·2 (2004). Food groups and serving sizes are from the Canada Food Guide(23). Pulses are included in the meat and alternatives group. Values are means, with standard errors represented by vertical bars. Mean value was significantly different from that of the non-consumer group: * P < 0·05, ** P < 0·01, *** P < 0·001. † Mean value was marginally significantly different from that of the non-consumer group (0·05 < P < 0·10).
, quartile 3; ■, quartile 4) of pulse consumers based on 1 d intakes from the Canadian Community Health Survey Cycle 2·2 (2004). Food groups and serving sizes are from the Canada Food Guide(23). Pulses are included in the meat and alternatives group. Values are means, with standard errors represented by vertical bars. Mean value was significantly different from that of the non-consumer group: * P < 0·05, ** P < 0·01, *** P < 0·001. † Mean value was marginally significantly different from that of the non-consumer group (0·05 < P < 0·10).
Discussion
The proportion of pulse consumers in Canadian adults appears to be similar to that of the US population, despite important differences in cultural makeup. We previously reported that 7·9 % of the US populations are pulse consumers, but the NHANES analysis did not include mung beans or other sprouted forms of beans (such as navy bean sprouts) as a source of pulse consumption(Reference Mitchell, Lawrence and Hartman22). When these were removed from our pulse database, the proportion of the Canadian adult population classified as pulse consumers dropped from 13·1 % to 10·7 %. In the Continuing Survey of Food Intakes by Individuals 1994–1996, 14 % of US residents consumed at least one pulse-containing food over a 2 d period(Reference Lucier, Lin and Allhouse33). Similarly in our analysis, when the smaller subset of 10 786 respondents with both day 1 and day 2 recalls were combined, 14·7 % were pulse consumers. When the smaller subset of respondents who completed the day 2 recall was examined alone, the rate of consumption was 12·6 %. Other differences between these studies include larger sample size for the CCHS 2·2 data and the inclusion of foods such as lima beans (which we excluded in our analyses), and exclusion of lentils, split peas and yellow peas, which represented approximately 8 % of the food sources reported in the CCHS 2·2 survey.
In terms of the most frequently consumed pulse-containing foods, in the NHANES study pinto beans and refried beans were predominantly consumed, which mimicked results found in the Continuing Survey of Food Intakes by Individuals study(Reference Lucier, Lin and Allhouse33). In Canada, however, pinto and refried beans represented only 1 % of the pulse foods reported, while mung beans were the most popular pulse in the CCHS 2·2 dataset. This probably can be ascribed to the differences in the cultural mosaic of the USA and Canada. The US Hispanic population represents 16 % of the US population(34), while the same group represents approximately 1 % of the Canadian population(35). Conversely, the Asian population in Canada is approximately 10 %, making up approximately 66 % of Canada's visible minority population(35, 36), while Asian Americans represent less than 5 % of the US population(37). The provinces with the highest proportion of Asians, Ontario and British Columbia, were also the two provinces found to contain the highest proportion of pulse consumers(35), fitting in with the finding that Asian Canadians were found to be almost four times more likely to be pulse consumers. In contrast to the US data, neither education level nor income level influenced pulse consumption in Canadians, perhaps reflecting the differing cultural backgrounds of Canadian consumers, or the higher proportion of US citizens (27 %) having less than a high school education compared with Canadians (16 %)(Reference Mitchell, Lawrence and Hartman22, Reference Lucier, Lin and Allhouse33).
Overall, consumption of pulses is associated with improved nutrient intakes, especially in the highest quartile of intake. Similar effects on dietary quality were observed in our previous analysis of the NHANES population(Reference Mitchell, Lawrence and Hartman22). The nutrient intake which improved the most with pulse consumption was fibre. Consumers in the highest quartiles of pulse consumption in both Canada and the USA consume almost twice as much fibre as non-consumers. Although this level of intake still does not meet the dietary recommendation for this nutrient, it should be noted that the Canadian Nutrient File lacks data on functional fibre (i.e. isolated, extracted or synthetic fibre) so it is possible that the fibre intakes may be underestimated in this analysis.
The higher intakes of carbohydrate, protein and fibre are probably due to these macronutrients being present in large amounts in pulses. This also contributes to the improvement of diet quality observed in pulse consumers, as 32 % of males and 21 % of females, aged 19 years and older, have carbohydrate intakes below the acceptable macronutrient distribution range(38–40). Several micronutrients (folate, Mg, Fe, K and Zn) that were consumed by pulse eaters in larger amounts also can be explained by these nutrients being found in higher levels in pulses(Reference Patterson, Maskus and Dupasquier6, Reference Sgarbieri, Antunes and Almeida41). Indeed, there were fewer pulse consumers that had inadequate intakes (below the EAR) of Mg, Zn, folate and Fe. Health Canada recently reported that 34 % of adults consume Mg in quantities below the EAR, with this number being higher than 40 % in some life stage groups. There also is a low prevalence of inadequacy for Zn, folate and Fe, ranging from 10–41 % for specific age and sex groups that consume less than the EAR. Similarly, median K intakes of Canadian adults are below the adequate intake value(38, 39). The current analysis using EAR values was consistent with these findings and further demonstrates that fewer pulse consumers had intakes of nutrients below the EAR.
Pulse consumption is associated with higher Na intake, contributing to the reported 78 % of Canadian adults that exceed the tolerable upper intake level for Na(38, 39). This is probably not due to the composition of the pulses themselves, but may reflect an increased intake of pulse-containing foods traditionally high in Na, such as Mexican or other Hispanic dishes and bean soups. These dishes account for approximately 25 % of all pulse products consumed. It is also possible that the increased Na intake among pulse consumers is due to the Na that is added to canned beans during processing, but such conclusions cannot be made from this dataset. Another potential concern associated with pulse consumption was the lower intakes of vitamins B12 and D, as 10–35 % of Canadian adults have an intake of vitamin B12 that is below the EAR(38, 39) and the median intake of vitamin D in Canada is below the recently revised RDA for this nutrient(38–40, 42). However, the proportions of respondents below the EAR for both vitamin D and B12 were similar among consumers and non-consumers, suggesting that pulse consumption does not compromise the nutrient status of these individuals in this regard and that the majority of Canadians, regardless of pulse consumption, are not consuming sufficient levels of these nutrients.
On the other hand, pulse consumers tended to consume higher levels of Ca, a finding that was significant in the US data analysis. This cannot be explained by altered dairy product intake, as consumption of foods from the milk and milk product group was not increased in pulse consumers. The increase in Ca is perhaps due to the fact that common pulse dishes such as Hispanic foods contain Ca(Reference Mitchell, Lawrence and Hartman22). Further detailed analysis on the connection between ethnic background and food choices may shed some light on the relationship between pulse intake and vitamin D status.
Overall energy intake was higher in pulse consumers, a finding consistent with the US population analysis(Reference Mitchell, Lawrence and Hartman22). It would be expected that this higher energy intake by pulse consumers would be associated with an increased body mass. However, although mean BMI was higher in pulse consumers (28·0 (se 0·75) and 27·3 (se 0·11) kg/m2, respectively), this difference was not statistically significant. This trend is in contrast to other findings which suggest that high-fibre foods such as pulses lead to an increased feeling of fullness and may lead to a healthier body weight when eaten at higher amounts(Reference Anderson, Smith and Gustafson15, Reference Papanikolaou and Fulgoni16). The reason for this apparent discrepancy cannot be determined from the survey data, but it may be that other foods consumed along with pulses may counteract the expected satiating effects of high-fibre pulses. The effect of pulse consumption on body weight also may be confounded by the fact that a large proportion of Canadians are in the overweight BMI category(43).
In the USA, the percentages of total energy from total and saturated fat were significantly lower in the diets of consumers in the third and fourth quartiles of pulse consumption(Reference Mitchell, Lawrence and Hartman22). This trend also was observed in Canadians in the present analysis, but not as strongly as in the US data. It is interesting to note that while US pulse consumers in the highest quartile of intake consume 20 g more of total fat than non-consumers, Canadians in the third quartile consume 10 g more total fat, but in the fourth quartile, fat consumption is similar to non-consumers. These differences may be due to the differences in the types of foods commonly consumed in the different data sets. Mung bean dishes more commonly consumed in Canada are typically lower in fat compared with pinto and refried bean dishes more commonly consumed in the USA. This also may explain why the intakes of MUFA and PUFA in the Canadian pulse consumers were higher than in non-consumers, while this trend was not observed in the US data(Reference Mitchell, Lawrence and Hartman22).
In addition to the predominantly positive effect of pulse consumption on nutrient intakes, further evidence of improved dietary quality with pulse consumption is demonstrated by the extra serving of fruits and vegetables eaten by consumers compared with non-consumers, a goal of the Food Guide that most Canadians do not achieve. In contrast, pulse consumers in the NHANES data consumed more grain products, but not other food groups(Reference Mitchell, Lawrence and Hartman22). These differences are probably due to the difference in the sources of pulses being eaten by Canadian compared with US consumers.
There are some limitations in this research. As with the NHANES study, the consumption of pulses in the CCHS 2·2 is based on a single reference day, meaning that those who were not identified as a consumer during a single day of intake may still be a pulse consumer. Although second-day consumer values were similar to the first day, the frequency of consumption is impossible to determine based on the 24 h recall method. Information was not collected on specific types of diets (i.e. low-carbohydrate, vegetarian or vegan diets) which may have been helpful in further examining the demographic of the average consumer, or on food preparation techniques, which may affect the nutrient content (for example, added salt) of the dishes consumed. It is also impossible to determine whether the 24 h dietary recall was truly representative of the respondent's normal diet, as respondents may over- or under-report their food consumption, even with trained experts administering the dietary recall. Because the CCHS 2·2 was a cross-sectional look at the dietary habits of Canadians, the results should be interpreted with caution. It is entirely possible that the survey would have provided differing results if another time-frame had been chosen, with either higher or lower amounts of consumers. As well, cause and effect cannot be assumed, as pulse consumption may be a component of an overall lifestyle. The CCHS 2·2 also does not take into account those residing on Indian reserves, residents occupying any of the three territories, those living in institutions or members of the Canadian Forces(24, 25).
These results demonstrate that an increased intake of dry beans and peas, especially at higher intakes, is associated with higher intakes of fibre, protein, carbohydrate, folate, Mg, Fe, K and Zn in Canadians, leading to improved diet quality. Clarification of the reasons for the effects of pulse consumption on these potential improvements in the diet as well as the potential increase in Na intake will need to be elucidated so that dietary advice to consume pulses can include ways to enhance or mitigate any positive or negative effects, respectively. In this way, the potential beneficial effects of pulse consumption on nutrient intake can be realised.
Acknowledgements
We would like to offer many thanks to Dr Ian Clara and Kelly Cranswick at the Manitoba Research Data Centre for their ongoing statistical help and support. The present study was supported by grants from Saskatchewan Pulse Growers and as part of the Pulse Innovation Project, through Canada's Agricultural Policy Framework (APF), a Federal–Provincial-Territorial initiative. All authors were responsible for the study design and assisted in revision of the manuscript. A. N. M., N. Y. and H. M. A. were responsible for data analyses, interpreting the results, drafting of the manuscript and critical revision of the manuscript. All authors read and approved the final manuscript. All authors declare no conflicts of interest.


