


Introduction
In the aftermath of the financial crisis of 2007, not only the public but also the scientific debate on economics intensified: Economists were blamed for not considering the increasing complexity of reality, and it was maintained that their research practices lacked reflection of normative positions. The lack of a manifold methodological arsenal was criticized as well as ignorance regarding the findings of other scientific disciplines (e.g. Coyle Reference Coyle2012; Dequech Reference Dequech2007; Morgan Reference Morgan2012). Economists, as political advisors, were debating possible steps to re-structure and re-strengthen the financial and economic sector (e.g. concerning the banking sector in general, whether and how to regulate activities within financial markets, the policy of low interest rates, if and why the risk of speculation was not perceived by economists). The Euro crisis in 2010 also nourished the distrust of economists. The public blamed economists for not being able to develop ideas and instruments to harmonize the observed imbalances within the European currency area (e.g. Wolf Reference Wolf2018). These difficulties in managing economic and financial crises threw their abilities to develop effective solutions into question. These developments led to the question whether or not economic scientific disciplines are able to adapt to short- and medium-term changes in economic reality.
Our study aims to identify and examine the possible extent of scientific change in economic research topics after the global economic and financial crisis of 2007-2008. What topical changes can be observed in respect to possible “core” and “peripheral” topics within the field of economic research in Germany? Is there evidence for a thematic shift, and are alternative or heterodox approaches taken into consideration? In the following sections, a brief characterization of economics is provided, followed by a description of the procedure applied, and a discussion of the results as well as the possible limitations of this study.
Sociological insights into economics: standard, heterodox, and pluralist approaches
In accordance with its object of study, economics is highly heterogeneous, as is shown by the wide range of approaches, perspectives, theories, and methods employed to help find answers to economic problems. Scientific disciplines in economics strive to develop explanatory models for those parts of life dedicated to ensuring and improving the supply of materialistic needs. As economic research develops over time, aspects of different theories or approaches are integrated into each other. A clear differentiation between different economic approaches is difficult to achieve, therefore. Conventionally, research frames are strongly orientated towards the methods of the natural sciences. Here, the utmost goal of economic research is to describe economic regularities in the form of “laws.” This self-conception is not shared by all scientists, though: Economics can be assigned to both the social as well as the natural sciences, depending on its research focus and its underlying normative base (e.g. Lazear Reference Lazear2000; Rodrik Reference Rodrik2015). This basic aspect designates a first factor for any differentiation between “standard” and “non-standard” (heterodox) economic approaches. Many researchers of the scientific community within economics share an orientation towards the natural scientific pole, while an orientation towards the social sciences is represented more often by heterodox economists. Therefore, economic research generates either descriptive or normative statements (e.g. Blaug Reference Blaug1992; Dwivedi Reference Dwivedi2006). This does not distinguish between standard and heterodox approaches, but rather between pluralistic and non-pluralistic conceptions of economics. Pluralistic conceptions focus on a meta-level of reflection on the scientific economic field. A lack of reflection is sometimes termed “orthodox.” An orthodox economist rarely questions why he or she is applying the concepts of economics, other than reasoning that this is commonly taught in universities or promoted in the top economic journals and thus applied by the majority of economic scientists. In this sense, the differentiation between “orthodox” in the meaning of “standard,” and heterodox in the meaning of “non-standard” economic researchers is not disjunct.Footnote 1 Heterodox economics have evolved in the last 40 years as the set of approaches widely applied in economics were not believed to be delivering good economic solutions to societal problems. Pluralist economics emerged during the last 10 years as a critical response to those economic attitudes lacking plurality of theories, methods, epistemology, and multidisciplinarity (e.g. Colander, Richard, and Rosser Reference Colander, Holt and Rosser2004; Davis Reference Davis2006; Dequech Reference Dequech2007; Dobusch and Kapeller Reference Dobusch and Kapeller2012; Hirte and Thieme Reference Hirte and Thieme2013; Thornton Reference Thornton2016). Thus, pluralist economics struggle to promote heterodox economic approaches. Heterodox approaches such as ecological economics,Footnote 2 feminist economics,Footnote 3 neomarxism,Footnote 4 or postkeynesianismFootnote 5 are examples illustrating the plural arsenal of economics.Footnote 6
The “mainstream” in economics, on the contrary, is mostly associated with neoclassical approaches, often suppressing the knowledge bases of other approaches in an orthodox manner (e.g. Thornton Reference Thornton2016, 53). The selection of economic problems and economic instruments for their solutions makes possible a classification on a meta-level within the economic research field. This classification should trigger further sociological research, as the elaboration of scientific practices depends to a large degree on social negotiating processes. These processes ensure “legitimation” for a certain scientific perspective. However, economics is still under-represented within sociological research (e.g. Pahl Reference Pahl2012). Furthermore, studies seeking explanatory factors for the financial crisis within the field of economics itself are rare. Colander and his co-authors are some of the few making contributions by declaring a misallocation of research resources within economics as a primary factor that has driven economics into crises (Colander et al. Reference Colander, Föllmer, Haas, Goldberg, Juselius, Kirman, Lux and Sloth2009). As expressed by the authors, the whole range of consequences of commonly applied models (including their weaknesses, limitations or risks) were not taken into account, and nor were they communicated to the public. Another aspect favoring the development of the financial crisis was a lack of fundamental research on (economic) “system crisis.” Explanations for the financial crisis focus mainly on certain economic issues but rarely seek arguments within the state of economics itself. This must happen, along with a critical view on the neoclassical paradigm elaborated since the Second World War and globally agreed on as “standard.”
Only few contributions were made in this context, taking into account the insufficiencies of neoclassical theories and methods for explaining economic evolution in the long-run. Besides aspects like growth development, inventions, or the impact of wars, cliometric findings can be put forward to explain the development of the financial system itself. According to Jaremski (Reference Jaremski, Diebolt and Haupert2016), panic within the financial system often occurs for the same reasons. The importance of such meta-studies as conducted in cliometrics cannot be underestimated, as they might help to prevent mistakes that have already been made in the past. Meta-reflections on economics in general are still commonly provided by other social sciences.
In the temporal context of the financial crisis of 2007-2008, performativity theories meta-analyzing economics were in vogue. Following this perspective, scientific communication has further functions exceeding the mere exchange of knowledge and information. Empirically, MacKenzie (Reference MacKenzie2006) illustrated this in his study of the “Black-Scholes-Merton-Model,” which had a strong influence on the social and individual behavior of the actors on the Chicago derivatives market. The application of this model strongly influenced the actors’ practices, which in turn led to the perfect confirmation of the model. One conclusion of the study is that as long as the real economic incidents match the “formula” (resulting from economic models and their underlying theories), the whole system stabilizes itself, whereby the financial and economic crisis in 2007-2008 can be seen as a destabilizing factor of the current valid “formula” (Callon Reference Callon2006). Consequently, a modification of the “valid formula” that actors within the financial markets follow as a leading pattern for their decisions and acting can ultimately foster scientific change. Here, the theory of performativity demonstrates the interaction of economic research issues and the social construction of empirical facts.
Another approach is given by discourse analysis applied in economics, also regarding the evolution of the topical structure of this discipline. Influencing factors are named, for example, by Maeve (2013). Discourses, as an essential element of scientific practice, equip actors with “scientific capital,” which thus gives legitimacy to their propositions. However, those discourse practices do not function as instruments to inform about science. Instead, they form scientific practice, giving it a unique character and ultimately generating it. Scientific discourse practices, especially within economics (e.g. Leininger Reference Leininger2009), operate primarily through journal papers, monographs or expert assessments, as they fulfill several functions: They are integrated into the heterogeneous field of economic sciences and they serve as a reputational up-valuation for scientists (Maeße Reference Maeße and Maeße2013). Thus, academic legitimacy results from several sources. This gives reason to examine the publication practices within economics as conducted in our analysis.
Other studies contextualizing the efforts depicted in this paper apply bibliographic methods. They aim to illustrate social and topical interrelations within economics, such as citation analysis or the numeric analysis of publications. Network analysis attempts to model social or citation links among the actors who contribute to the publication market within economics (e.g. Cronin Reference Cronin2010; Kapeller Reference Kapeller2010a, Reference Kapeller2010b; Dobusch and Kapeller Reference Dobusch and Kapeller2012). Bibliometric analysis applied to economic subcategories can also focus on types of publications (e.g. journal papers, monographs, conference papers, critical reviews) and their specific nexuses such as keywords, titles, or scientific categories to which they belong. However, only few contributions to the meta-reflexion of economics can be found here. The analyses focus primarily on special topics, e.g. “Macrodynamics of Economics: A Bibliometric History” (Claveau and Gingras Reference Claveau and Gingras2016). These authors identify a decrease in topical diversity, a focus on theories with decreasing orientation toward a general scope of application, a growing application of econometric methods, and a decrease in specialization within macroeconomics from 1956 to 2014. Furthermore, the project Bibliometric History of Specialties in Economics 1956-2014 (Claveau, Düppe and Gingras Reference Claveau, Düppe and Gingras2016) provides an interactive overview of the specialities structure, starting in the late 1950s and up until now. This study takes into account all journal papers defined as belonging to the category “economics” in the Web of Science. In this way, bibliographic methods might contribute to a critical reflection on the development of economic sciences. This follows the conclusion formulated by Jaremski (Reference Jaremski, Diebolt and Haupert2016): We need a more detailed knowledge of the factors influencing economics and becoming “the economy.” However, this should not only address the methods or theories applied, but also the topical context and network of economic sciences, seeing as they serve as a fundamental source for accumulating, spreading, and interpreting the economic knowledge that leads to scientific discourse. This paper aims to deliver another of the rare contributions to the analysis of economic sciences.
On the relation between “mainstream” and “heterodox” economics
Economics nowadays reveals a high level of standardization, theoretically, methodologically, and globally (e.g. Kapeller and Dobusch Reference Kapeller and Dobusch2009). Considering publication practice, the publishing of journal papers has become more important both for the reputation of a scientist and for placing a research topic successfully within the economic discourse. This is accompanied by a stratification of the scientific field. Labelling economic institutions as “top” symbolizes this process, e.g. “top-journals,” “elite-universities,” or “top-economists” (e.g. Nobel Prize Award for EconomicsFootnote 7). This stimulates an ongoing stratification not only between scientists, but also among scientific communities within economics (Maeße Reference Maeße and Maeße2013).
This development helped strengthen the neoclassical paradigm within economics. The neoclassical paradigm, which already existed during the pre-war period, was complemented by Keynesian and – from the 1970s on – monetarist content (e.g. Hesse Reference Hesse2010; Maeße Reference Maeße and Maeße2013). To the present day, scientists have been unable to agree on a coherent definition of neoclassicism as a theory. Nor is it possible to reduce it to only one set of characteristics (e.g. Hedtke Reference Hedtke2015; Kolb Reference Kolb2015). In general, the central motif indicating a neoclassical orientation is the assumption of a stable market equilibrium, which adjusts via the regulation of supply and demand. The actions of market participants, on the other hand, are led by general-purpose norms of economic reason (e.g. Maeße Reference Maeße and Maeße2013). This concept is called “methodological individualism.” The developed models assume complete rationality and that all actions are guided by mere self-interest on the part of actors (e.g. Kirchgässner Reference Kirchgässner2008). “Economical rationality” is a term describing a permanent calculation of profit for individuals, mathematically resulting in a utility function (Expected Utility Theory; e.g. Graupe Reference Graupe2013, 150; Wakker Reference Wakker2010). Contents of the utility function may vary (e.g. altruism, time, social influence): however, in this model individual preferences and needs are assumed to remain stable over time. These preferences and needs are expected to be continually orientated towards the improvement of the individual’s situation, regardless of the actors’ social localization or information situation (e.g. Becker Reference Becker1976). These characteristics describe the most common idea of man within economic theory, as well as the idea of man as defined in neoclassical theory: homo economicus (see e.g. Kirchgässner Reference Kirchgässner2008; Tomer Reference Tomer2001). However, this conception of homo economicus has been criticized as too restricted and abstract, so that nowadays divergent concepts of economic actors are approved as well as studied, even in standard economics. The general restrictions and limitations allowed the development of economic theories that either complemented neoclassical theory or created an alternative framework for economic relations and acting. Behavioural economics, therefore, expanded the concept homo economicus to homo economicus neumannensis (e.g. Biesecker and Kersting Reference Biesecker and Kesting2003; Gintis Reference Gintis2014; Tammena Reference Tammena2009), which is influenced by the economic game theory. Implementing game-theoretical research in economic contexts led to the development of new theories including the “prospect-theory,” which now pertains to the classical base of knowledge within economic education. Variables such as “risk” and “uncertainty” were taken into account and added new aspects to neoclassical assumptions. Ideas of behavioral economics were also adapted to macroeconomic research and models. This can be regarded as a reaction to rising criticism against “Keynesian macro control” and a continuous market liberalization at the end of the 1970s. This influence led macroeconomic research to take factors on a micro-level into account and concepts such as the “agency dilemma,” “moral hazard,” or “information asymmetry” arose (e.g. Münnich Reference Münnich2015).
Another error-handling procedure is the nowadays commonly known concept of “bounded rationality” (Simon Reference Simon1982; Giggerenzer and Selten Reference Giggerenzer and Selten2001). This concept takes the cost of acquiring complete information into account. It assumes that a search for complete information about the interesting aspect is too cost-intensive for individuals in many (not only economic) situations. In turn, this newly arising idea of man, which is called Resourceful Evaluative Maximizing Man (REMM; e.g. Dennis Reference Dennis1998, 61) was adopted by New Institutional Economics (NIE), giving him the name homo economicus institutionalis. NIE itself can be seen as a theoretical extension of the neoclassic (and not an alternative to it; see, e.g., Hodgson Reference Leininger2007) in the search for those institutionalized operational rules that help individuals to achieve maximum benefit despite their bounded rationality or an uncertain information situation. Typical research topics in NIE include “property rights theory,” “satisficing,” or “transaction cost theory” (e.g. Maeße Reference Maeße2015). A critical attitude towards the neoclassical conception of man was also expressed by information economics, which – in simultaneous demarcation to Game Theory as well as to behavioural economics – examines information inequalities, especially within markets.
Towards the end of the twentieth century many theories and methods evolved within economics. These can be positioned on a scale between the poles “supplementing the neoclassical approach” via “alternative approach to neoclassic” through to “deviating from the neoclassical paradigm.” The second and latter can be classified as “heterodox economics,” which have attempted to construct a counterpart to “orthodox” neoclassical concepts since the 1970s. Since the year 2000, a movement for pluralizing economics has demanded that further attention be granted to heterodox approaches in scientific economics. In Germany, for example, this movement is represented by the Netzwerk Plurale Ökonomik (Anon. 2019a), which is acting as a central promoter of this approach. Internationally, the network Rethinking Economics (Anon. 2019b) is trying to achieve progress in changing economics together with other organizations in the global association International Student Initiative for Pluralism in Economics (Anon. 2016).
Concluding with regard to contemporary economics: Approaches with a neoclassical imprint can be categorized as (rather) standard, orthodox, or mainstream economics. Schools which have overcome or defy this imprint should be called heterodox, sidestream, or pluralistic economics.
Following our research goal to identify possible changes in economic research after the crisis of 2007-2008, we ask:
1) Which topics can be defined as the “core” topics of economic research in the period of time examined? Can a shift of core topics be observed, and if so, what might be the reasons for such shifts?
2) Which topics play a minor (“peripheral”) role within the field of economic research? Which shifts can be observed here during the period of time examined?
3) Which specific changes within economic research can be identified after the financial and economic crisis in 2007-2008?
4) Can we identify changes that can be traced back to heterodox economics?
Method and procedure
To identify possible shifts in research topics in economic research in Germany after the global economic and financial crisis of 2007-2008, a sample of journal articles and index terms from publications in economic journals was drawn up and analyzed using a co-word analysis.
Sample
The sample was derived from journal articles published within the category “Economics” as indicated in the Social Sciences Citation Index (Anon. 2019c). The SSCI is one of the most extensive data bases and part of the “Web of Science.” It is published by the US-American company Clarivate Analytics, which formerly belonged to Thomson Reuters. The period of time analyzed was 2005 to 2014. Therefore, it should be possible to identify changes which might have occurred after 2007-2008, the years in which the global economic and financial crisis took place, by comparison with the time before. Considering that it may take up to two years for economic research to react to any crisis by collecting and analyzing data as well as communicating the results in scientific publications, most publications referring to the crisis should not appear before 2009-2010. Therefore, we chose the period with the crisis in the first third of the time and analyzed the index terms of the journal papers. Additionally, a regional limitation was applied in order to reduce the complexity of the sample. Thus, only articles published by German-speaking authors or author collectives with at least one writer associated with an institution localized in a German-speaking region were considered.Footnote 8 This results in a sample of 11,934 documents and 26,031 index terms. The index terms were either calculated by computer programs within the SSCI (called “Keywords PLUS”) or defined by the respective authors themselves. Index terms name the area(s) of research that are picked up in the article. Simultaneously, they differentiate between areas of knowledge and research. Furthermore, they localize the articles in certain cognitive and social contexts, in which the texts as well as the authors (prefer to) operate.
The distribution of keywords is shown in Table 1. During the period of time investigated, both the number of documents and the number of keywords in each time phase increased. In total, the sample contained 372 documents not labelled with a keyword. Out of 11,934 documents this was 3.12 per cent. The maximum number of keyword groups a single document referred to was 27 in the last period. In total, the maximum number of keywords (before classifying them into groups of words) was 37 as identified by the program SciMAT (Cobo, López-Herrera, Herrera-Viedma, and Herrera Reference Cobo, López-Herrera, Herrera-Viedma and Herrera2012; see also Brixy Reference Brixy2014).
Distribution of keywords
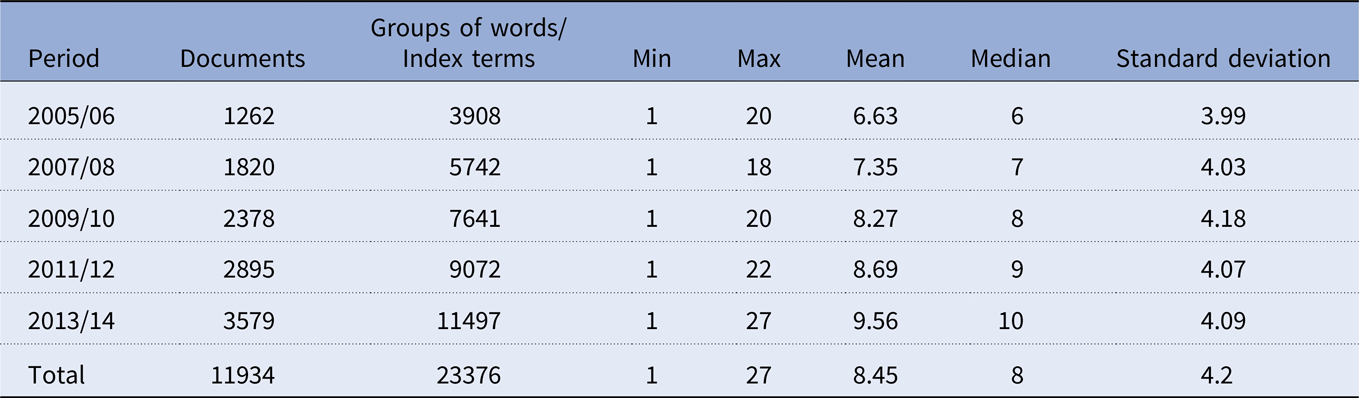
Notes: Number of Documents; Groups of words/Index terms: Number of groups of words formed by congruent or similar keywords; Min: Minimum number of keywords per document; Max: Maximum number of keywords per document; Mean: Average number of keywords per document; Median: Median of keywords per document; Standard deviation: Standard deviation of the values
Procedure
In order to answer the questions formulated above, a co-word analysis was carried out using SciMAT (Cobo et al. Reference Cobo, López-Herrera, Herrera-Viedma and Herrera2010). A co-word analysis is a bibliographic analytical instrument dedicated to the study of written communication (Jovanović Reference Jovanović2012). The foundation of the investigation are articles published in scientific journals, focusing on the keywords describing those articles. In this context the co-word analysis is advantageous, considering keywords, as one of the primary bases for scientific communication in economics, are taken into account. (e.g. Leininger Reference Leininger2009). It is a two-dimensional analytical method for detecting “co-occurrences” of two terms and can be characterized as an explorative analytical research approach (e.g. Döring and Bortz Reference Döring and Bortz2016). Co-occurrences exist when linguistic entities appear together in the same text document. In this study, a co-occurrence exists when two terms describe the same document (see also Dees Reference Dees2014). A term is defined as an amount of distinguishable meanings referring to certain objects.Footnote 9 Describing co-occurrences of certain terms across a certain number of documents allows us to uncover the underlying network structure of the relevant topics in economics and their thematic development over time.
The final result is a term-document matrix depicted in a network illustration. Index terms describe texts in a certain topical field or establish topical links. This procedure results in the categorization of terms into topic clusters, which can be visualized using statistical procedures. By comparing the visualizations of the five periods of time over the years 2005-2014, it is possible to draw conclusions about the development of the field examined. “Nodes” (n) and “lines” (l) are the essential elements of the network. The lines between the nodes are undirected, i.e. a direction going from one node to another cannot be observed. The link, however, is established equally from both nodes. In this study the nodes represent index terms (key terms) and lines between nodes represent co-occurrences of the index terms. Nodes and lines lead to a term-document-matrix A in which the factor a ij is defined as the edge (line) weight, i.e. how often term j appears in document i (e.g. Coulter et al. Reference Coulter, Monarch and Konda1998; Havemann and Scharnhorst Reference Havemann, Scharnhorst, Stegbauer and Häußling2010). For network visualization, clusters are created in five steps:
1) Calculation of the Equivalence Index:
For every pair of terms i and j, a value e ij describing the intensity of their connection is determined, which indicates the frequency of co-occurrence. This equivalence index e ij (Neff and Corley Reference Neff and Corley2009) is calculated by the formula
 $${e_{ij}} = {c_{ij}^2 \over c_i \cdot c_j}$$
whereby c ij refers to the number of documents in which two index terms i and j occur together. By dividing c2 ij by the occurrence frequencies of the index terms c i andc j the measure of co-occurrence already is standardized. Whenever two index terms always appear together, the equivalence index reaches the value of one. If they never appear together in one of the documents, the value is zero.
2) Clustering
The result of step 1) is a network of nodes (index terms) and weighted lines (equivalence index). In order to gain further insight into possible structures within the network, the complexity is reduced by clustering. The clusters are subcategories containing those terms that can be localized closer to each other than to other terms. An ideal cluster can be characterized as follows: It should be discrete and the proportion of the original data set (“coverage”) should be as high as possible. Special algorithms in this step allow the clustering of the index terms. In this case, we used the Simple Centers Algorithm, following Dees (Reference Dees2014). This offers the advantage of an automatic generation of cluster names by taking the minimal occurrence as well as the co-occurrence and the minimum and the maximum number of terms listed in the cluster into account. The visualization is made up of bipartite networks. Threshold values calculated in pre-tests are necessary for this process. There are no existing standards for this step. The threshold values should lead to a clear result presentation with a preferably sensible depth of detail: The maximum number of words contained in a cluster should not be more than 200, as the depiction would become too confusing with a higher density of words (Cobo et al. Reference Cobo, López-Herrera, Herrera-Viedma and Herrera2012). Pre-tests showed the threshold value of four as the minimum number occurrences in this analysis, that is, in order to create clusters that meet the aim formulated above. With every following time stage, this value had to be increased by one to still meet the aim formulated above. This need to increase the threshold values could be explained by a different approach by authors over time, when deciding which keywords to use. The automated keyword generation of the SSCI (“Keywords PLUS”) could also be a reason. Therefore, the increase in threshold values is not necessarily an indication of a growing diversity among the applied keywords. In the last time stage, the index terms should appear together in at least eight documents to form a cluster – all index terms where this was not the case were not considered in the calculation. This simultaneously complies with the median of the number of keywords dedicated to the documents in the sample. It is necessary for the threshold value for the first period of time to be smaller than those from the following periods. This is due to the fact that the number of documents was smaller in this period, as well as the number of index terms used for denoting the documents listed. Subsequently, the data set was reduced by another threshold value, which defines the minimum value of the co-occurrence of the keywords (i.e. the edge value). Pre-tests revealed an edge value of four to be appropriate for the first period of time (2005-2006). For the following periods, the appropriate values were as follows: 2007-2008: 6; 2009-2010: 8; 2011-2012: 9; 2013-2014: 12.
3) Network Degrees of the Clusters
In this step the indices of density and centrality of each cluster within the network are calculated. These indices form the base of the cluster’s position in the strategic diagram as visualized in the following steps. By means of these indices, one can define the relevance of the cluster within the area of research analyzed. Density is a measure of the internal cohesion of the cluster. The higher the density, the more stable the cluster is, meaning either the interest in this topic will probably be longer-term in this research field, or indicating a more specialized field of research that is carried out by smaller scientific networks only. Option one favors the further development within the topic area that the cluster is built upon. There can be various outcomes for a dense but specific area of research: It may either heighten its relevance and centrality for the scientific field, or it remains in this specific position until its attraction or institutionalization diminishes. With regard to the scientific community, density can be interpreted as an indicator for the internal consensus between the researchers within this area (e.g. Renner Reference Renner1997). The higher the internal cohesion, the higher the consensus is regarding central theories and methods applied within the area of research. To calculate the density, the actual number of lines is divided by the possible number of lines:
 $$d = 100 \cdot {\sum\nolimits_{i,j = 1}^n {{e_{ij}}} \over n}$$
While i and j represent two index terms within a cluster, n refers to the total number of index terms in this cluster. The density reaches a value of one when all nodes are linked to each other and zero when there are no established linkages within the cluster.
The index of centrality C indicates the linkages of the network or the cohesion. The different options to calculate this index all take into account the total count of clusters in relation to the other clusters of the network, whereby the number of linkages realized is examined. The degree of centrality C is calculated as follows
 $$c = 10 \cdot \sum\nolimits_{u,v = 1}^n {{e_{uv}}}$$
whereby u and v each name an index term from different clusters. Depending on the result of the calculation, a cluster with a high degree of centrality can be characterized as highly relevant for the area of research. Meanwhile, a cluster with a low degree of centrality belongs rather to the “periphery” of the research field. If a scientist is aiming for (relevant) research in the area examined, he or she must deal with those topics with a high degree of centrality.
4) Placement in the Strategic Diagram
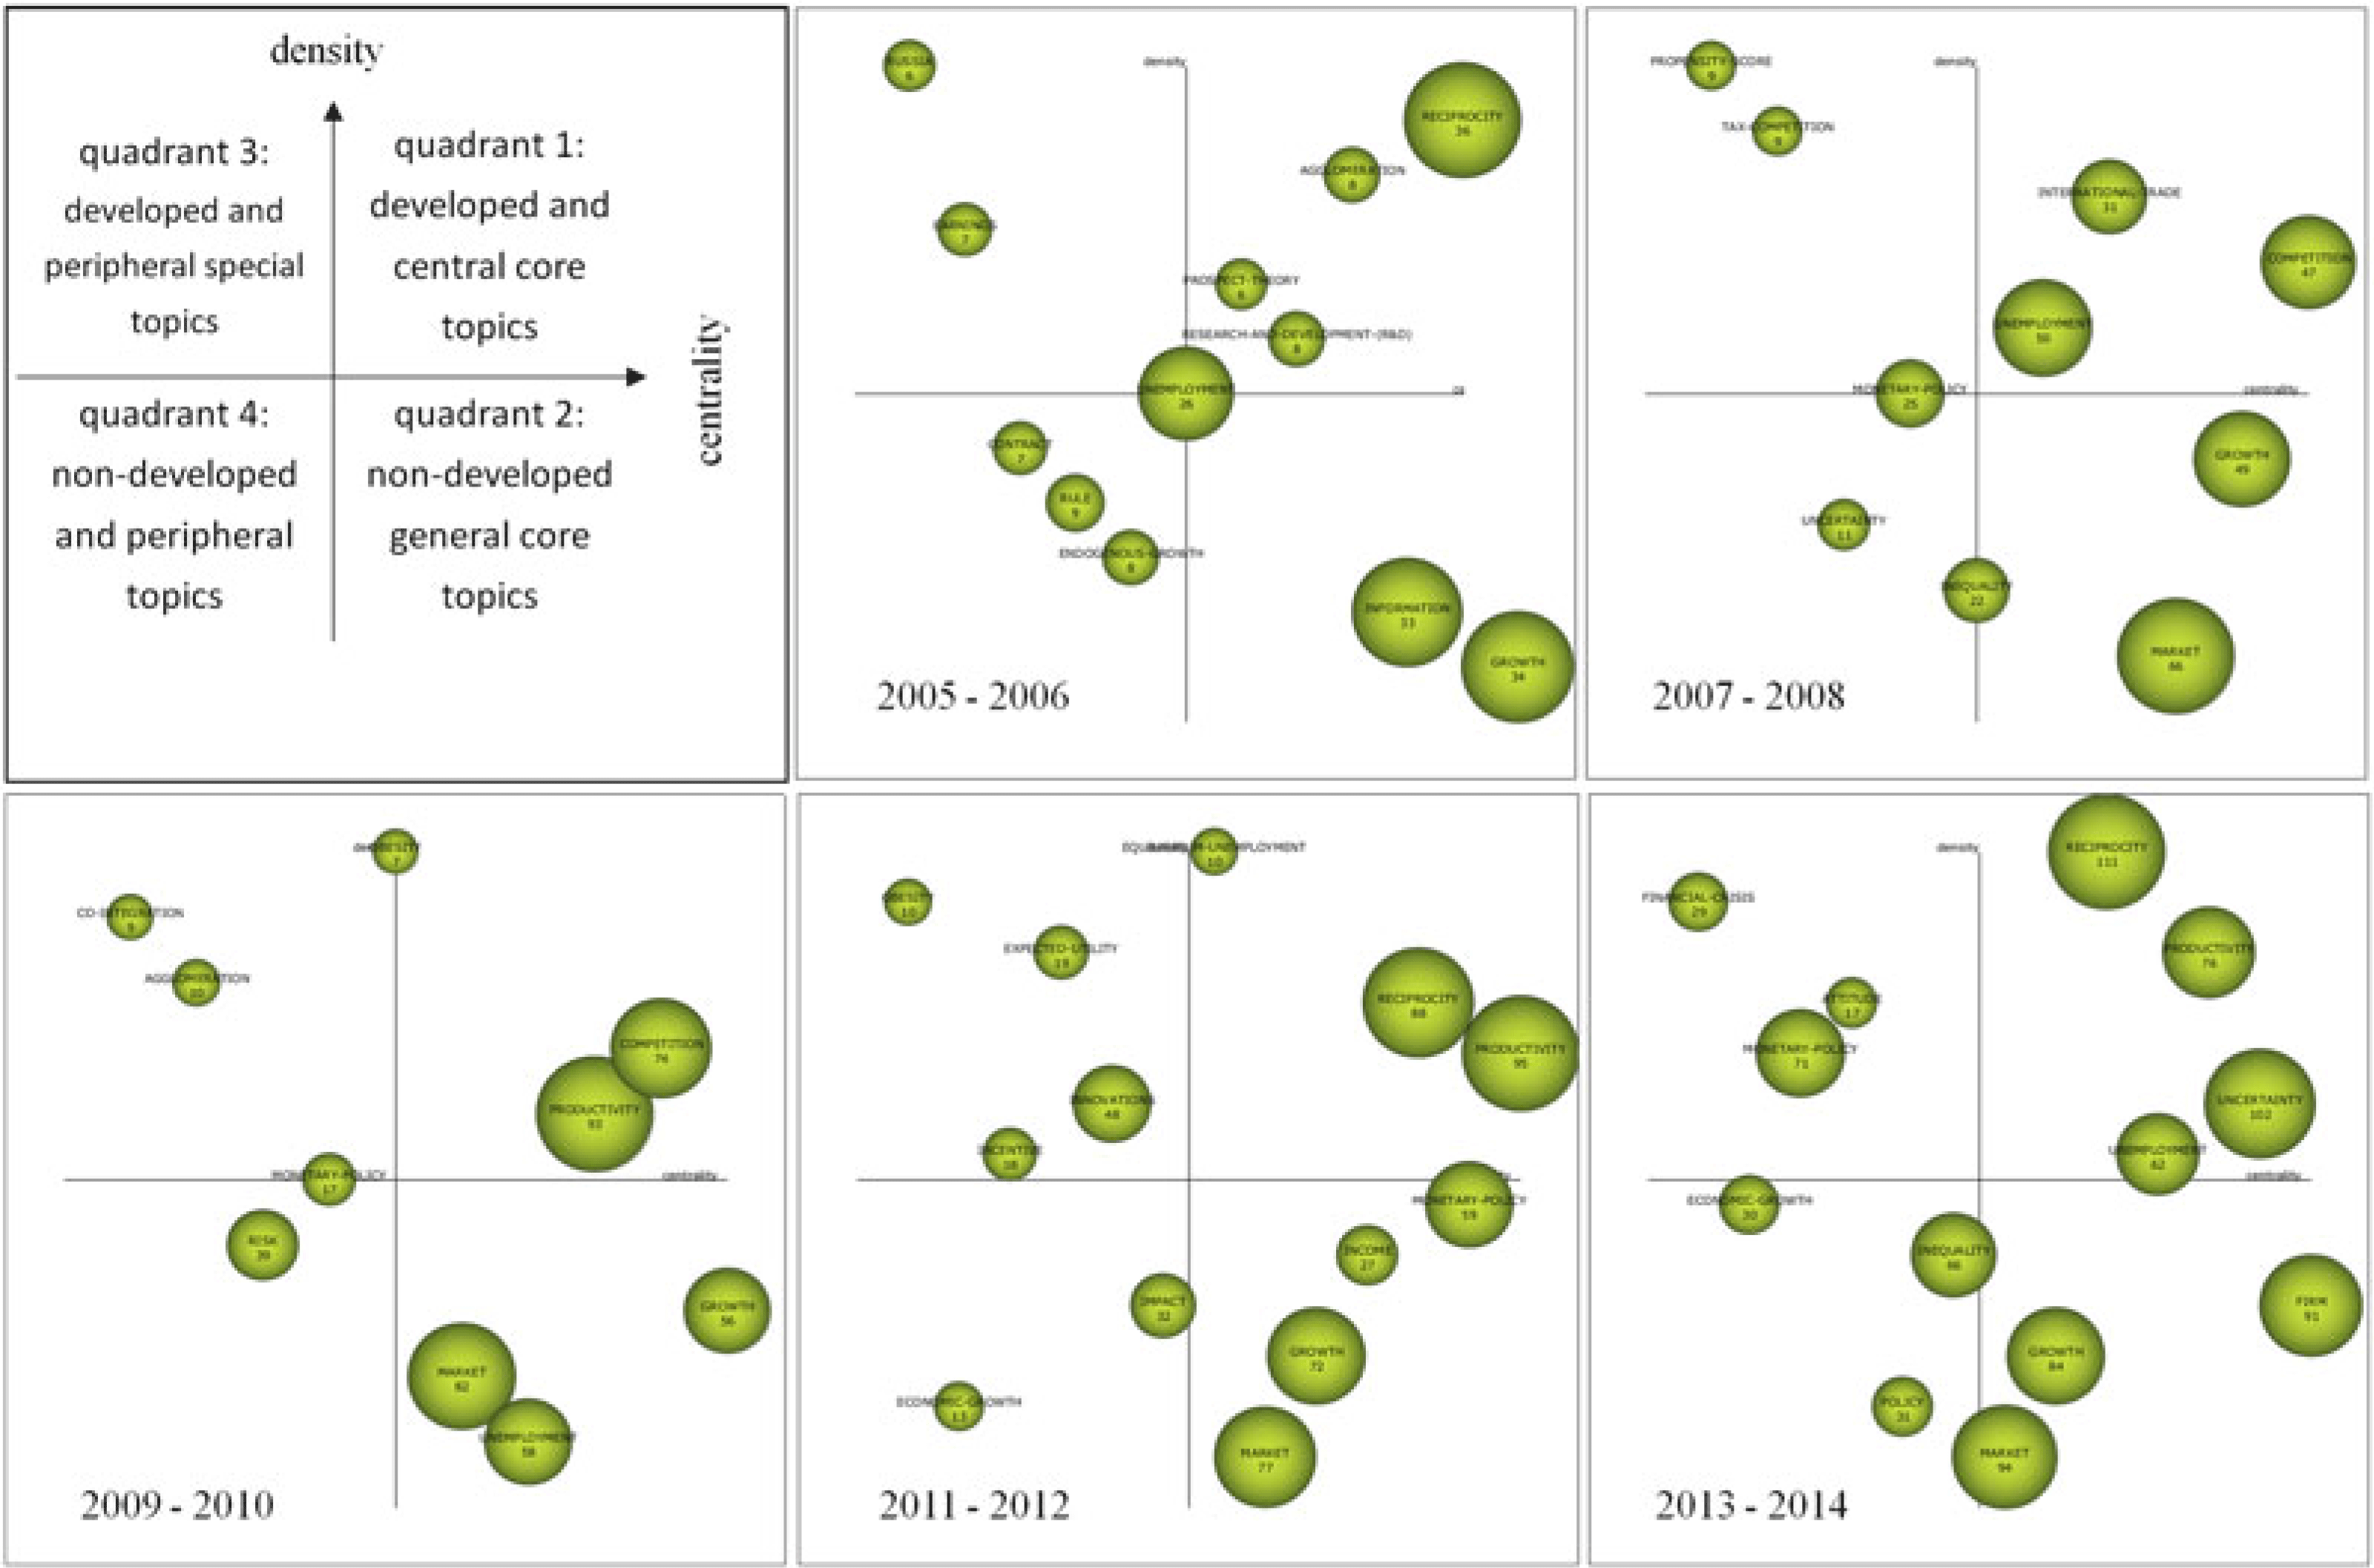
The connection between the centrality and the density of a cluster in relation to its relevance for the whole field of research, as indicated by the degrees (see Bredillet Reference Bredillet2009; Dees Reference Dees2014), can be illustrated in a strategic diagram (see fig. 2 for the strategic diagrams calculated in our analyses). The zero position of the diagram is determined by the meridians of the indices of centrality and density. As depicted in fig. 2, centrality and density provide information about the significance of the cluster within a certain area of research. According to Dees (Reference Dees2014), the strategic diagram can be divided as follows: In quadrant 1 topics which are very central and well-developed are depicted. The clusters show a high internal as well as external degree of cross-linking. The core topics in the area of research are situated here. In the second quadrant clusters with a high relevance for the research field are depicted. Internally, these clusters are relatively underdeveloped, so that it is not possible to identify a single and homogeneous scientific frame where the topics are discussed. Those clusters are prominent in various approaches within the scientific field, processed in respect to different scientific problems and with diverse methods. Externally, the clusters are quite cross-linked. The rather general topics within the area of research appear here. The left section of the strategic diagram is assigned to the “peripheral” topics, i.e. less important for the area of research. In quadrant 3 the topics are still well-developed (indicated by the high density), while in quadrant 4 they are peripheral and undeveloped (as indicated by a low density and centrality). Clusters are not cross-linked much either internally or externally. Quadrant 3 thus indicates topics which are said to be “special” or adapted from other scientific disciplines, which are therefore clearly separable from other topics from the area of research.
5) Temporal Changes in the Strategic Diagram
Scientific change occurs whenever a theme cluster changes its position within the strategic diagram or vanishes completely in the long-term. New clusters can appear in the diagram in the same way. Thus the dynamic is driven by a movement of keywords, altering their level of relevance for the scientific community. This affects the composition, relevance, as well as the topical focus of the clusters. Mutschke and Renner (Reference Mutschke, Renner, Mochmann and Gerhardt1995) regard the career of a research topic as a process in which a growing centrality is followed by a cycle also favoring a growing density of the cluster. A turning point in this career is reached when high degrees of both centrality as well as density can be identified, but the topic becomes increasingly less attractive for the research community, provoking shrinking degrees of centrality and density as one effect. A peripheral and sufficiently innovative and interesting research topic originating in quadrant 4 of the strategic diagram (peripheral and non-developed) can gradually be integrated into the first quadrant. Here, the research community sets its focus on this topic, so that its “maturity” can grow rapidly. Once interest in a topic declines, it will most likely drift into quadrant 3, also known as the “ivory tower of science,” where highly specific and relatively isolated research takes place. This describes a general cycle or dynamic of scientific trends (Mutschke and Renner Reference Mutschke, Renner, Mochmann and Gerhardt1995). Temporal changes within areas of research are depicted with the “overlapping items graph” and the “evolution map” (see figs. 1 and 3). In the overlapping items graph, the stability index indicates the numeric changes to the examined keywords. The stability index specifies the number of shared keywords between two neighboring periods of time in the five periods of time analyzed in this study. It is calculated by the formula
 $$item{s_{ij}} \div \left( {item{s_i} + item{s_j} - item{s_{ij}}} \right),$$
whereby i and j name two keywords from two different clusters. If the value is 1, the keywords between two periods are absolutely congruent. If it is 0 there are no shared items.
Development of the number of keywords.

Strategic diagrams of the different time periods with clusters’ centrality and density within an area of research.
Evolution map of all clusters 2005-2014.
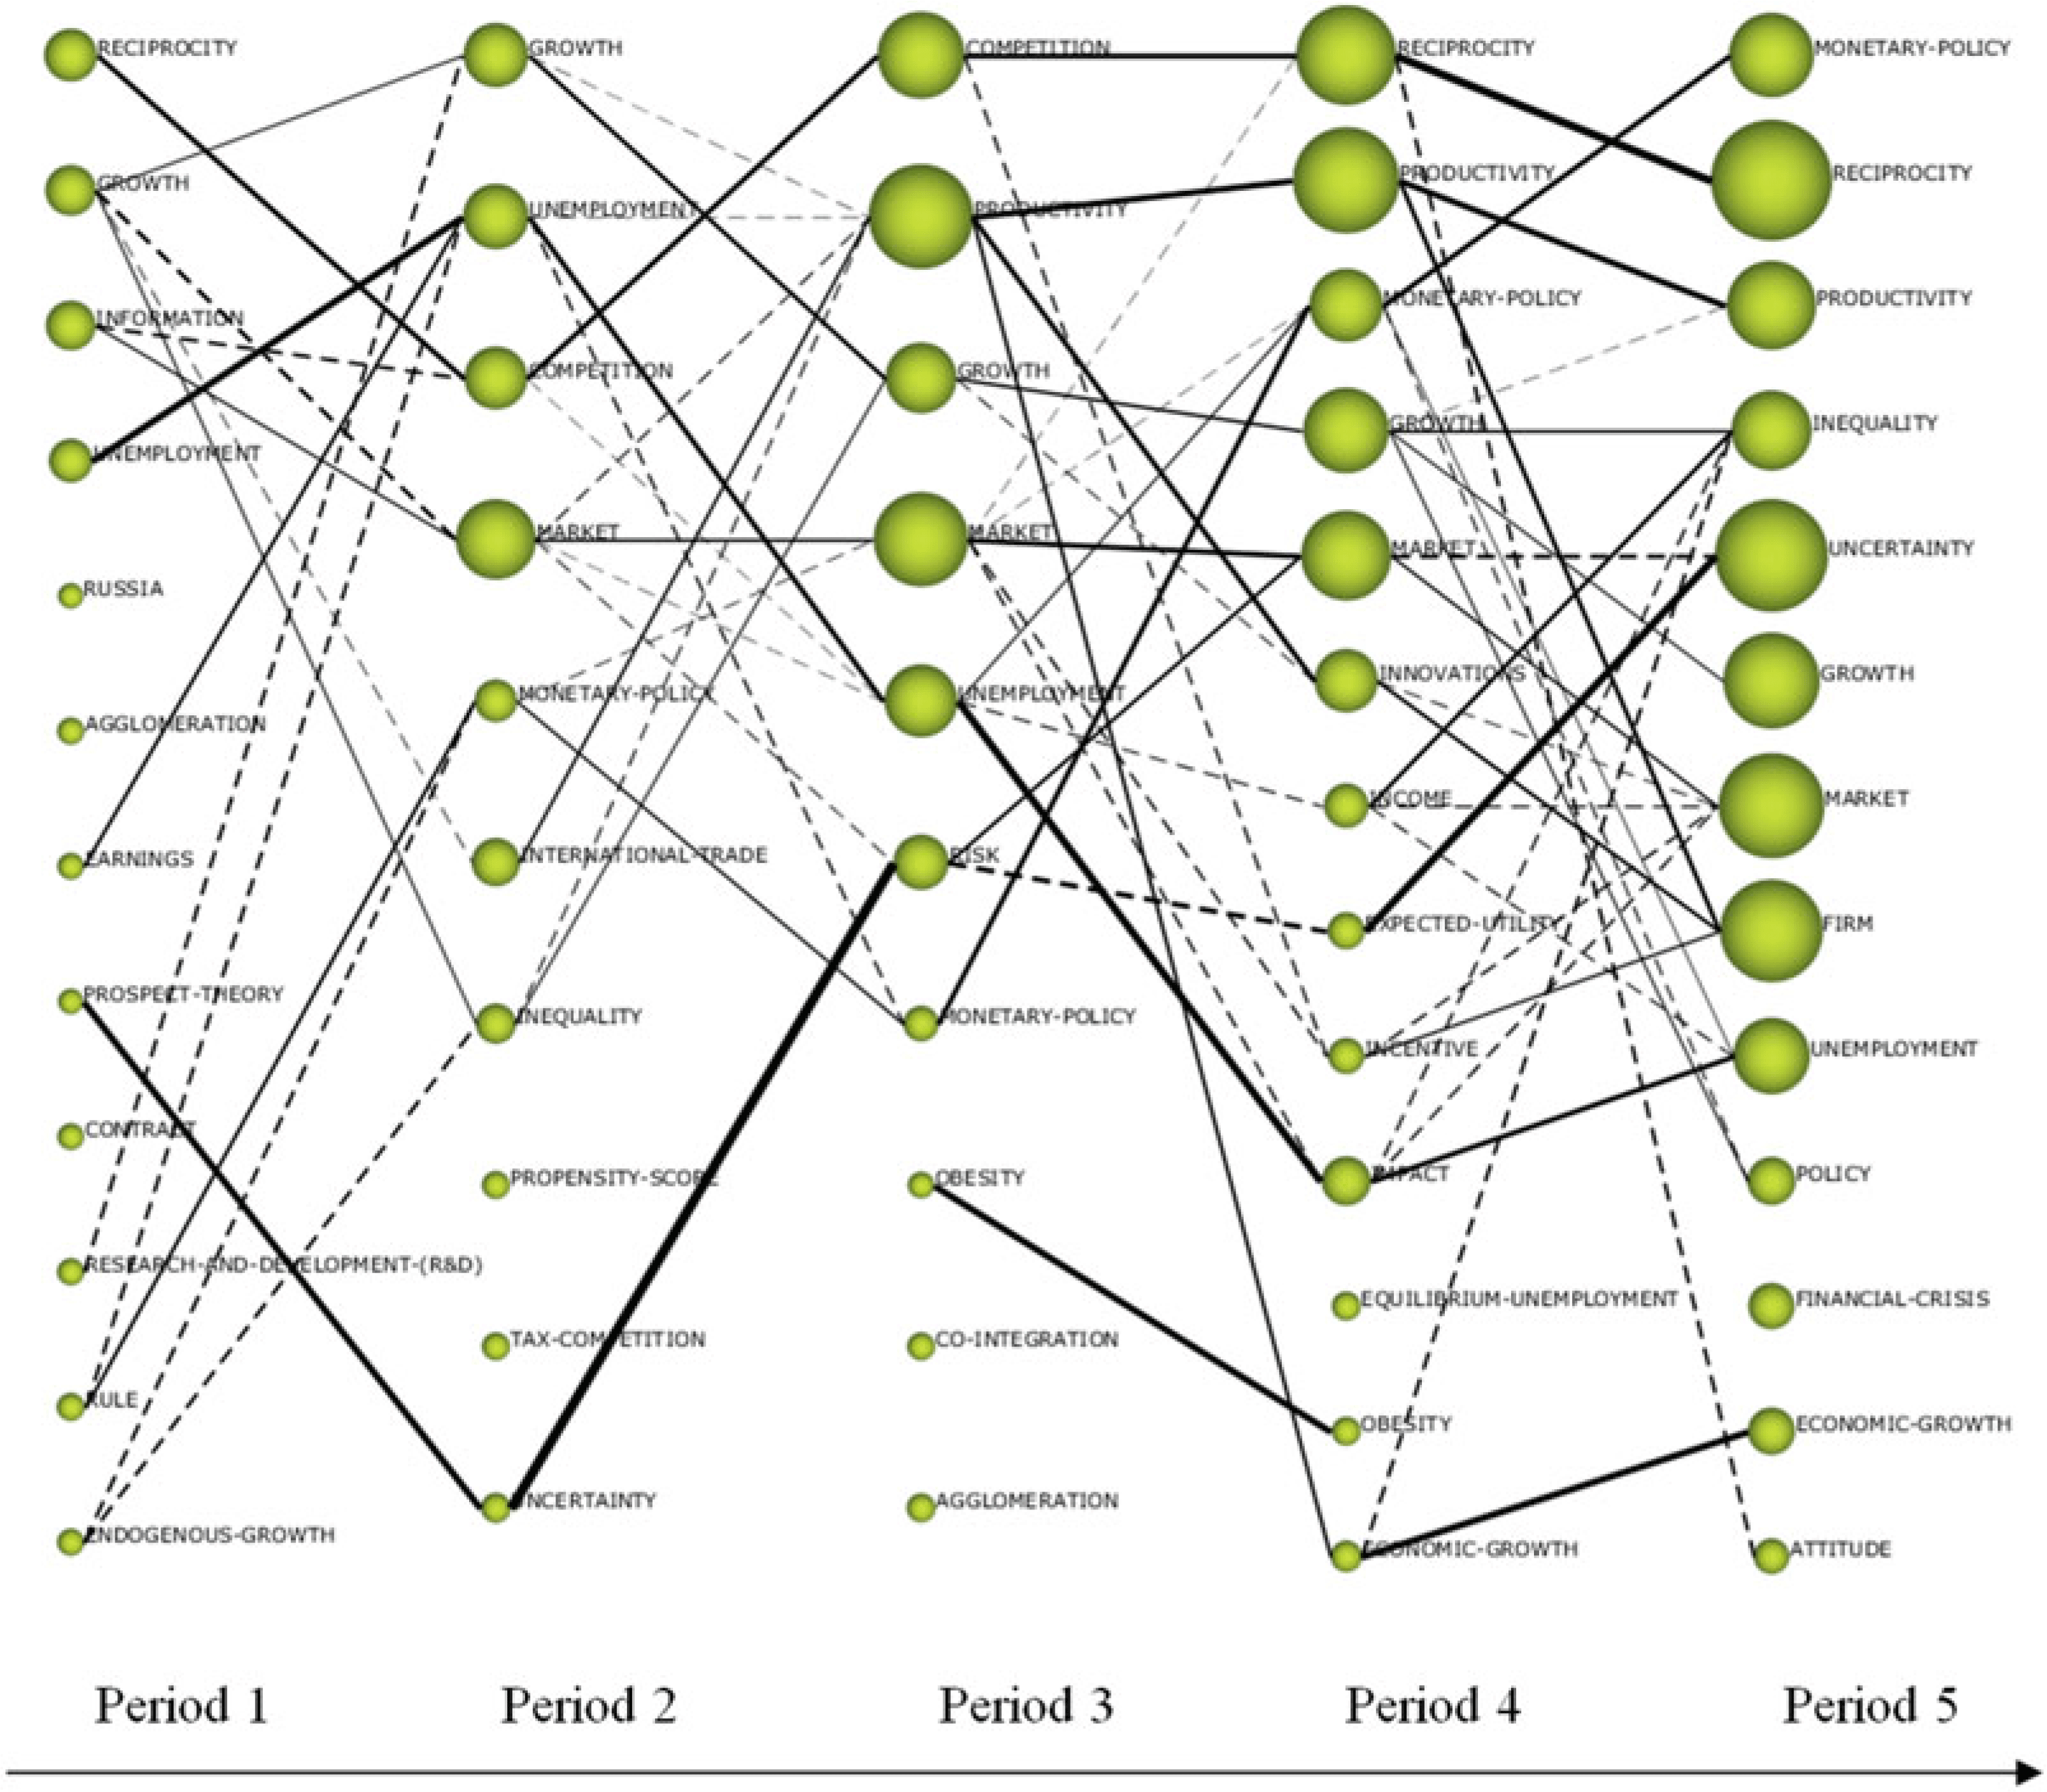
The evolution map illustrates the differentiation of the theme clusters in a complete overview over all periods. Here, the inclusion index is calculated for the edge weight. The value 1 for the inclusion index stands for all index terms of one cluster being equivalent to those of the following cluster.
In the co-word analysis, the following steps were conducted: First, the data set was corrected. Duplicates, abbreviations, plural/singular, vocabulary in different languages, orthographic misspelling, as well as synonyms were identified and condensed into groups. The result of this procedure is 23,376 groups of terms containing between one and six index terms. Furthermore, 55 stopword groups were defined, which were excluded from the sample. Stopwords are terms that are regarded as irrelevant in regard to the analysis, or which would have distorted the analysis because of an extraordinary high frequency of occurrence. Considering our focus was on understanding the development of different theoretical approaches, we excluded methodological terms, codes, years, geographical information, or dates, although one could learn something from those terms, too. The selection of stopwords was conducted following the procedure proposed by (Dees Reference Dees2014, 152). Furthermore, the data was differentiated into five time periods. See Table 1 for the number of documents and index terms in each period of time.
Results and discussion
Figure 1 depicts the development of the keywords distribution in the distinct time periods and shows the stability of keyword-usage from a temporal perspective as measured by the stability index. The general quota of change for the keywords increases from one period to the following. The value for the stability index is zero. This indicates a high heterogeneity of keyword usage across the single periods of time. This may result from a lack of clarification of the principles of indexation within the SSCI. There are no indications, however, about the changing dynamic within economic research topics.
Cross-sectional perspective
For each period of time, a strategic diagram shows the allocation of the detected clusters induced by the applied threshold values. The strategic diagrams of the five periods of time are depicted in figure 2.
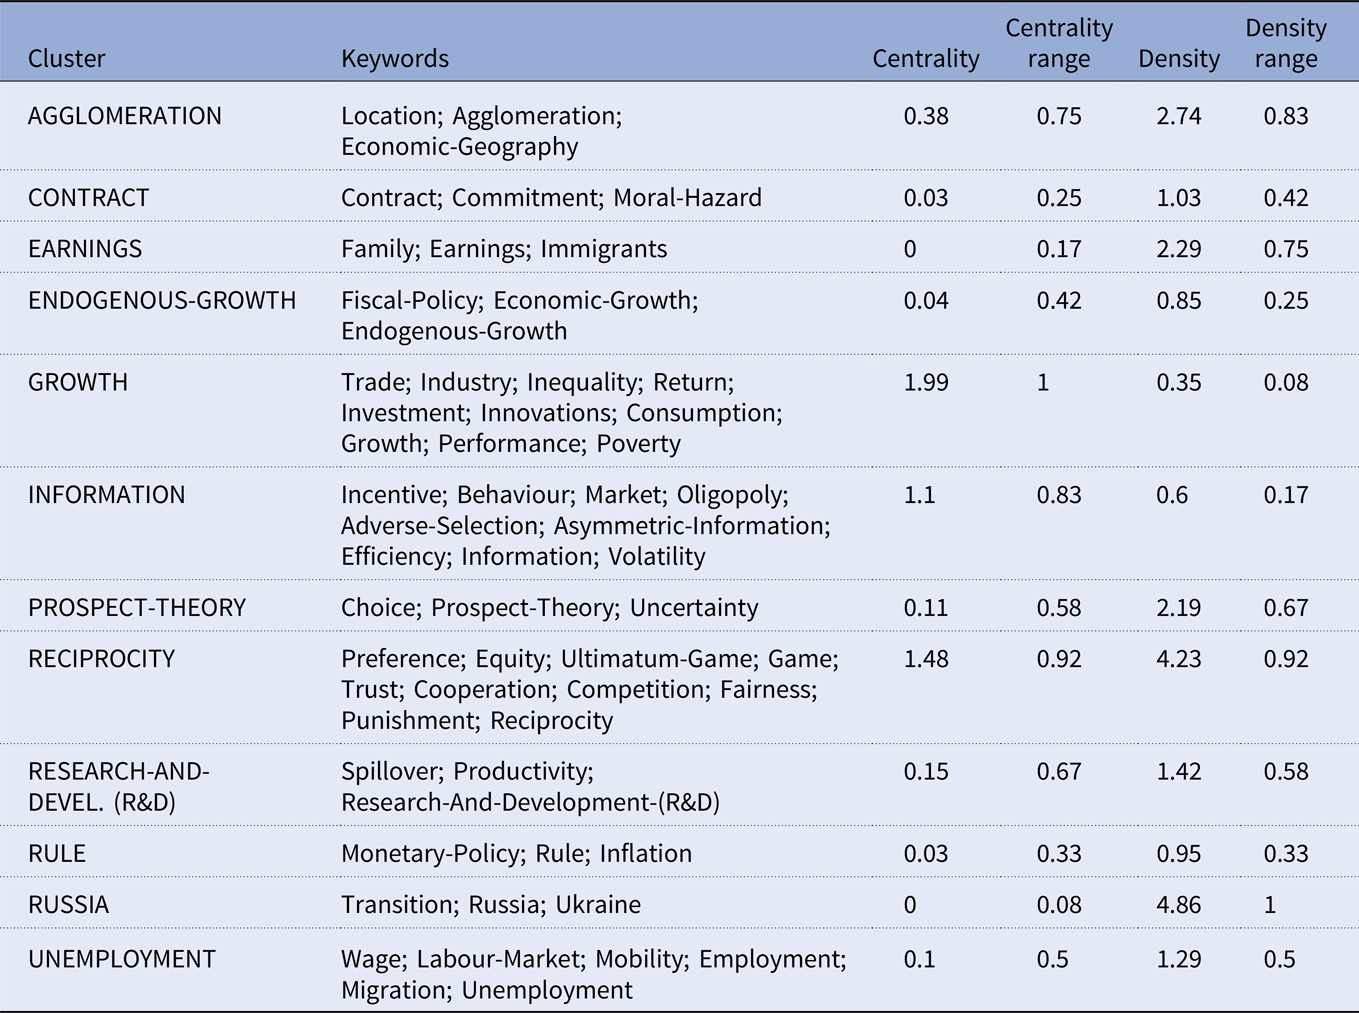
The thematic structure of the first period (2005/2006) is illustrated in figure 2. Twelve thematic areas evolve by means of the parameters applied. Seven of them can be characterized as core topics due to their location in the right section of the diagram. This result confirms the stable establishment of economic research in general. One third of the clusters is allocated to the upper quadrant 1 – these clusters are central and internally well-developed and can be regarded as central topics. The clusters named “AGGLOMERATION,” “PROSPECT-THEORY,” “RESEARCH and DEVELOPMENT,” and partly also “UNEMPLOYMENT” can be found here.Footnote 10 Themes equally central, but rather general and mainstream can be identified in the second quadrant of the diagram, e.g. “GROWTH” and “INFORMATION.” Thus, the centrality and density measures determine the position of each single cluster in the strategic diagram. For the years 2005/06, the analysis results in the cluster “RUSSIA” having the lowest degree of centrality (0), and “GROWTH” having the highest centrality range (the degree of centrality is 1.99). For the degrees of density, the relation is vice versa. The cluster “GROWTH” shows a low density of 0.35, while a degree of density of 4.86 was calculated for “RUSSIA.” This is the highest degree of density in the first period of analysis. Table 2 depicts the centrality and density measures of all clusters as shown in the strategic diagram for period 1 (2005/06). Table 2 also illustrates a more detailed insight into the topical structure of clusters and their single (groups of) keywords. Within the cluster “RECIPROCITY,” the keywords “Game,” “Ultimatum-Game,” or “Punishment” indicate a focus lying on economic Game Theory. When interpreting the displayed index terms in this cluster, the thematic area can be associated with economic geography. “PROSPECT-THEORY” has a nexus to behavioural economics regarding its internal keyword structure. Peripheral topics within economics research showing low levels of centrality and loose crosslinks to other clusters are depicted in the left section of the diagram. The topics “RUSSIA” and “EARNINGS” in the upper left quadrant (peripheral and developed) can be categorized as special topics. Economists – among others – were also scientifically concerned with the natural gas embargo originating in Russia. Economic studies concerning social entities like “families” and “migrants” are accumulated within the cluster “EARNINGS.” With “CONTRACT,” “RULE,” and “ENDOGENOUS-GROWTH” in the lower left quadrant (peripheral and undeveloped), new trend topics within economic research may evolve. “ENDOGENOUS-GROWTH” can be interpreted as an alternative to the “exogenous growth theory”. The keywords of the first topic mentioned contextualize it within behavioural economics. The other strategic diagrams in figure 2 and tables 3 – 6 can be interpreted in an analogous manner.
Period 1 (2005/06): keywords belonging to the different clusters, centrality and density measures
Period 2 (2007/08): keywords belonging to the different clusters, centrality and density measures
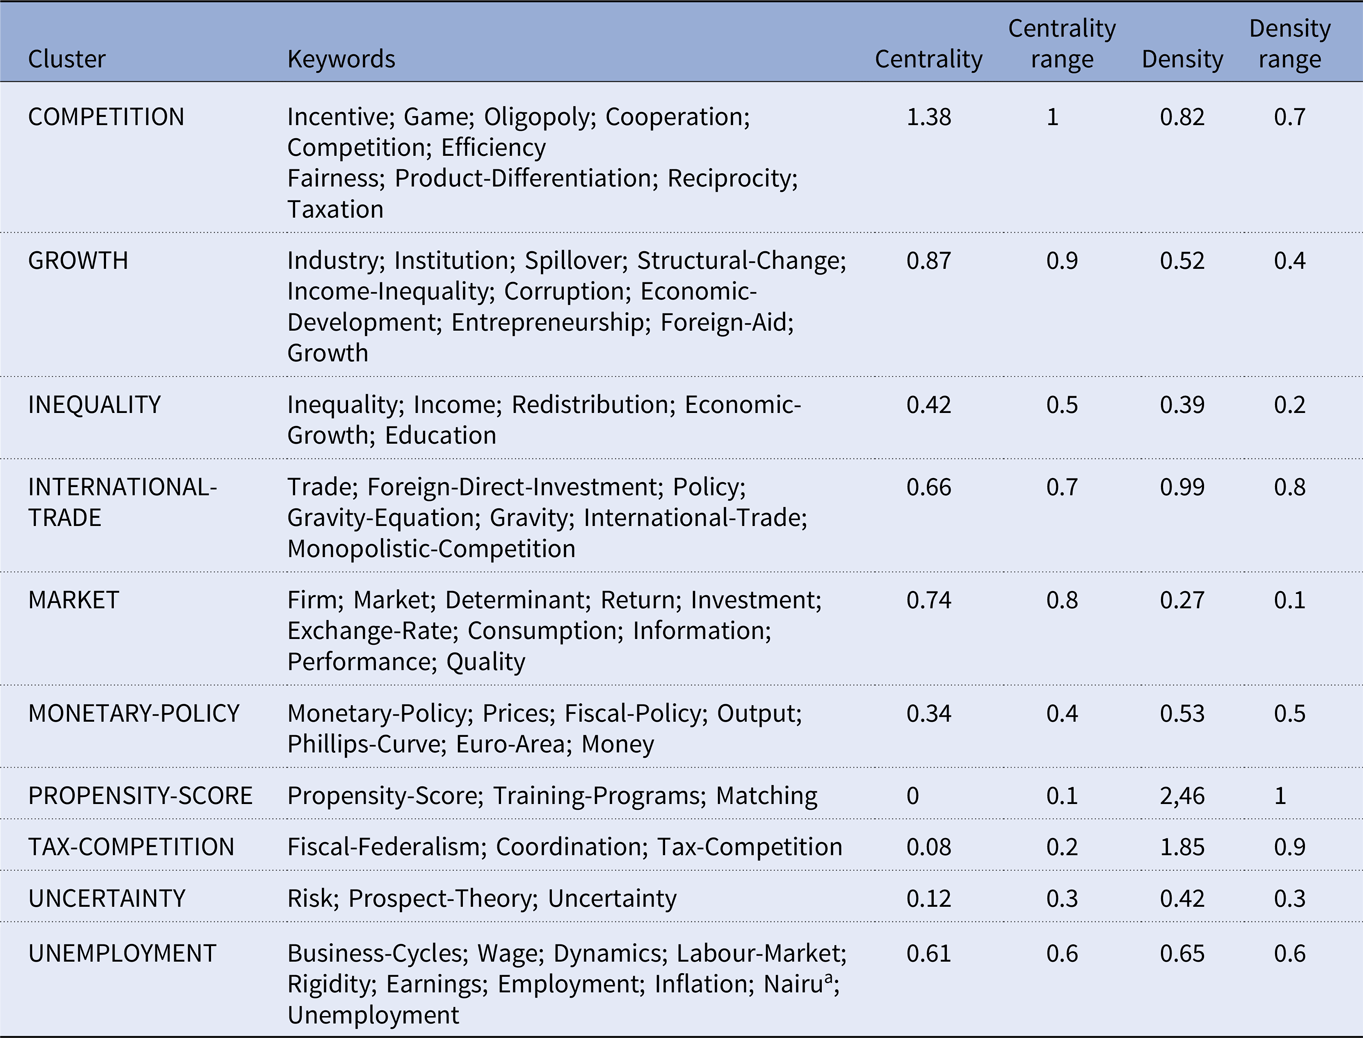
Notes: a“Non-Accelerating Inflation Rate” (NAIRU; see Welfe Reference Welfe2013: 354) is a model which assumes the unemployment rate and the rate of inflation to be negatively correlated.
Period 3 (2009/10): keywords belonging to the different clusters, centrality and density measures
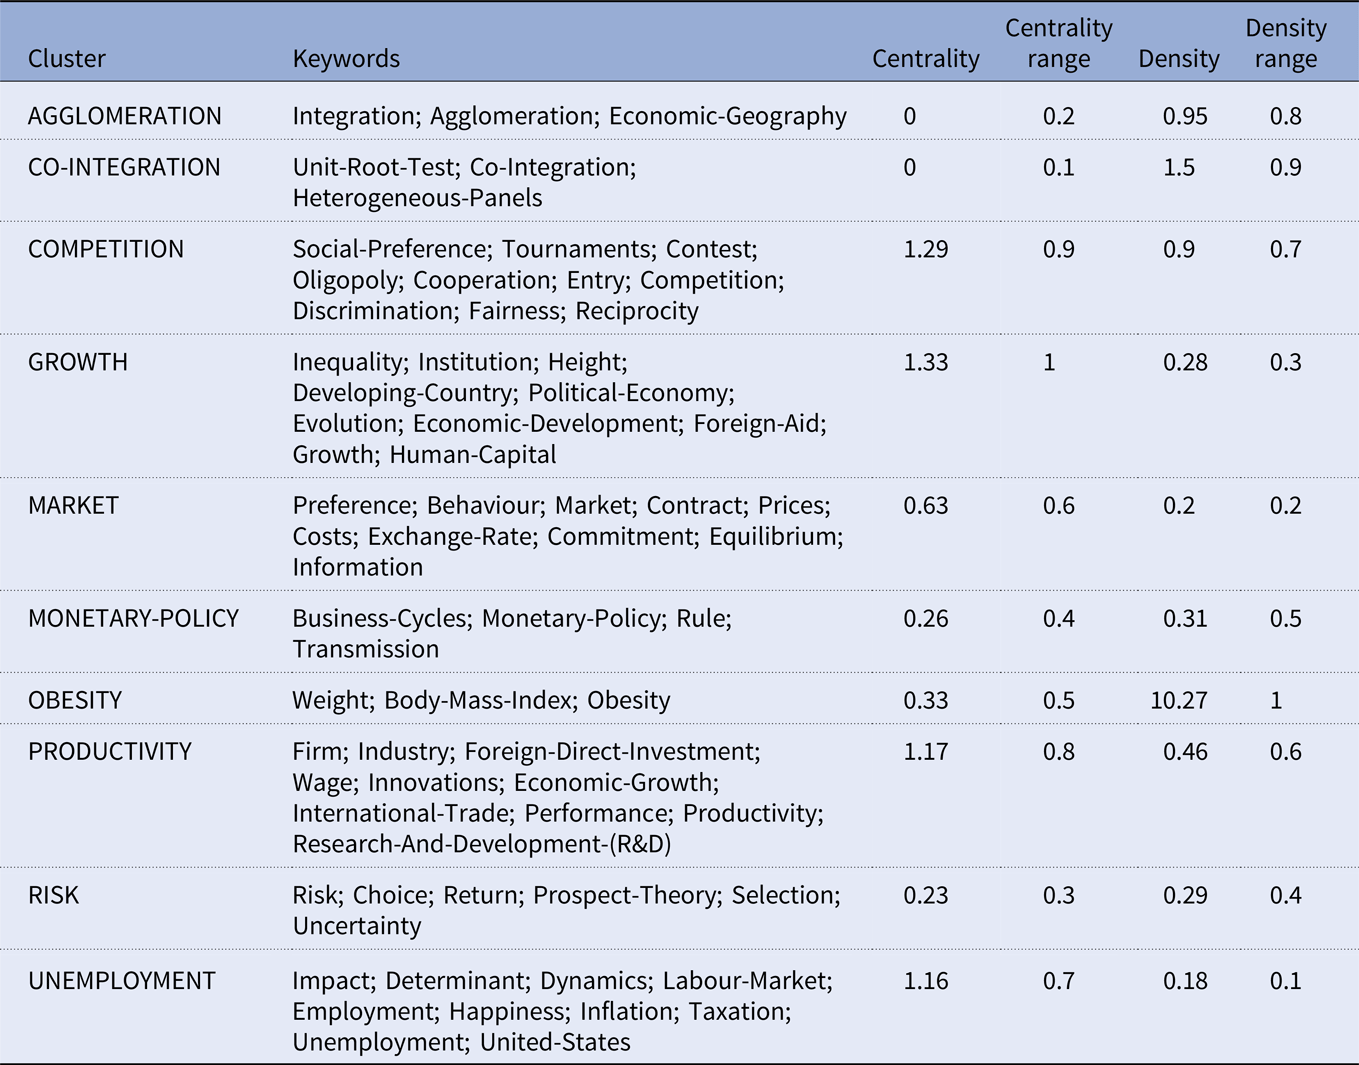
Period 4 (2011/12): keywords belonging to the different clusters, centrality and density measures
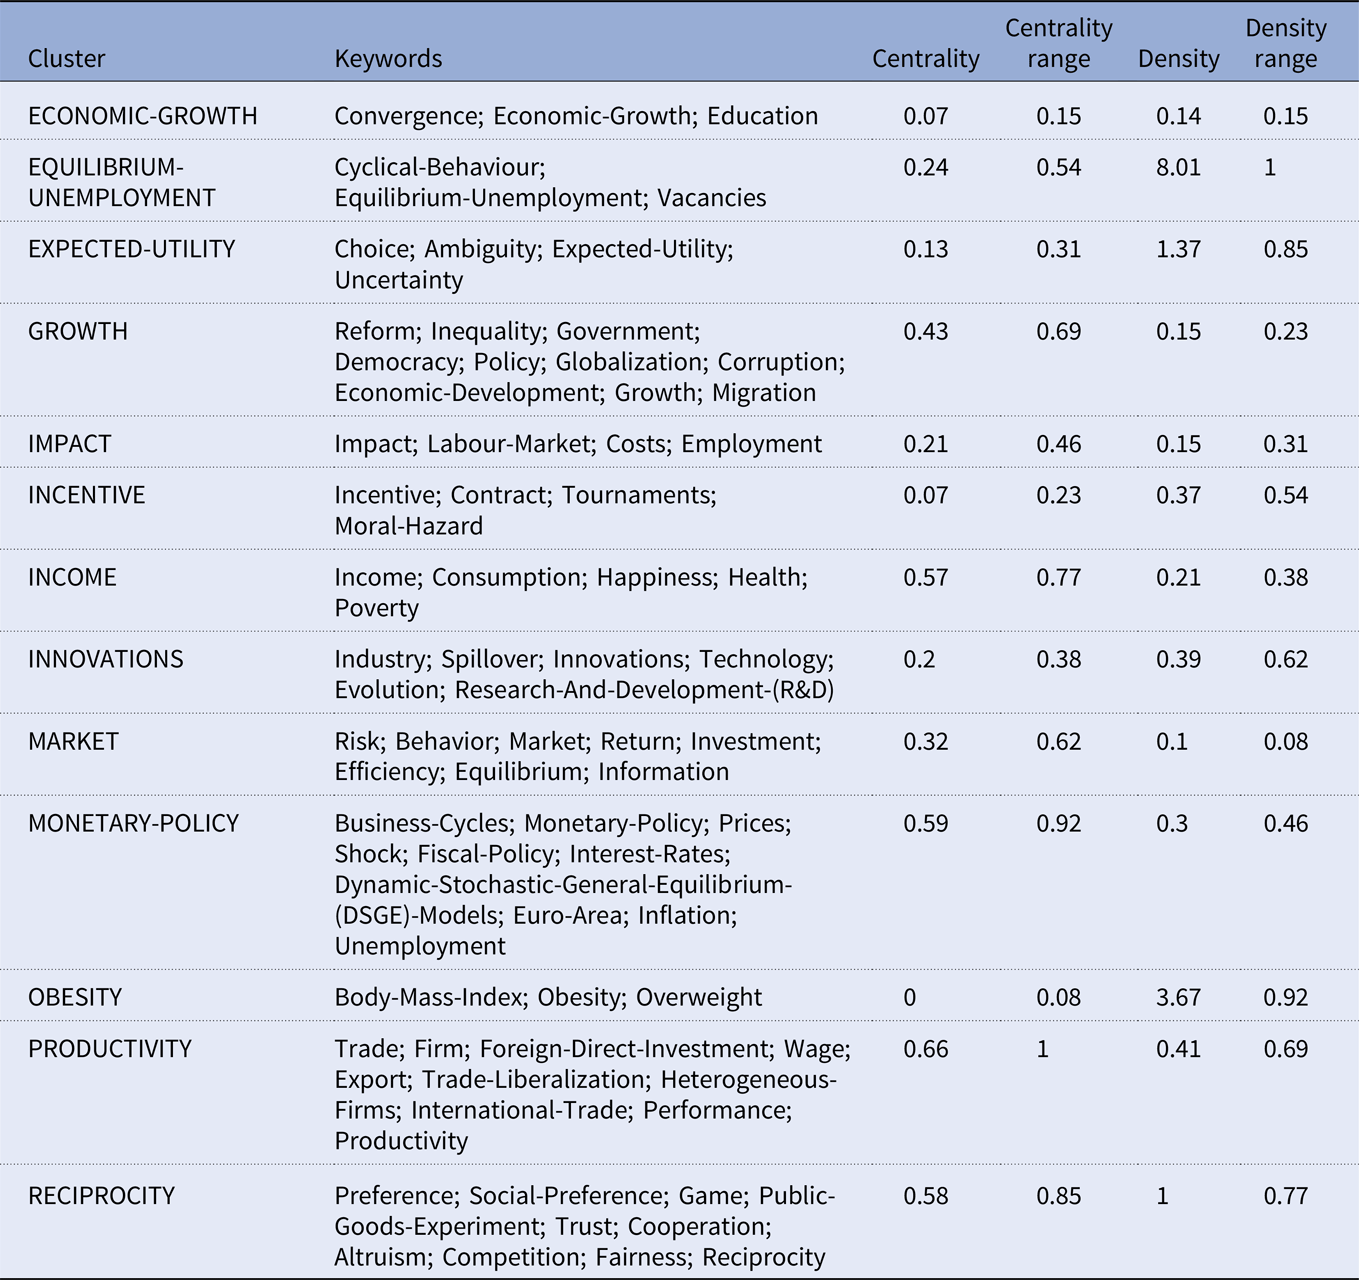
Period 5 (2013/14): keywords belonging to the different clusters, centrality and density measures
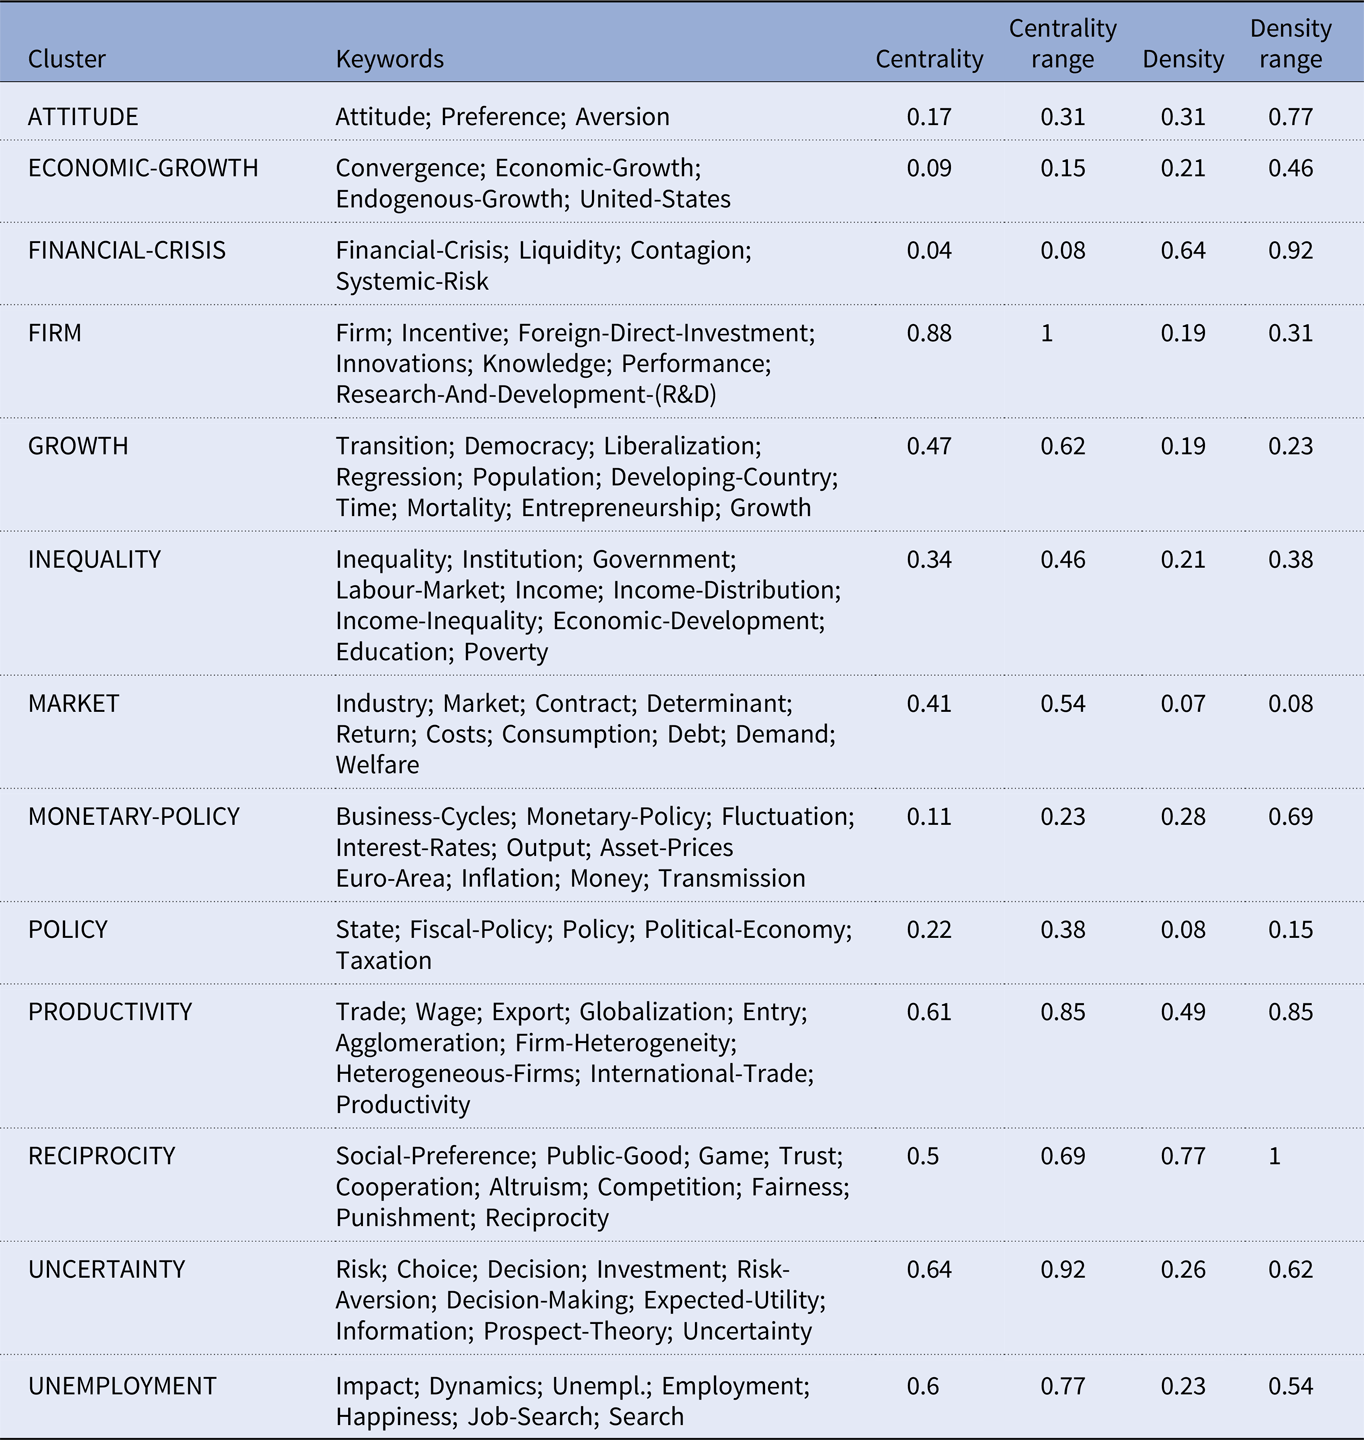
Longitudinal perspective
The evolution map (figure 3) depicts the topical development within economic research from a longitudinal perspective throughout the examined time period. Little thematic fluctuation can be found here, though fluctuation in peripheral topics remains high (Bredillet Reference Bredillet2009). What are the core topics of economic research in Germany from 2005 to 2014, and what do they tell us about the status quo of economics and economic research in Germany?
First, the crosslinks between the topics in the upper half of fig. 3 (core topics of economic research) are stronger than those in the lower half (peripheral topics). Second, we can identify which specific core as well as peripheral topics occur more frequently. Other topics, which are rarely or not cross-linked at all, do not appear with a high frequency throughout the period examined. Considering this, the diagram allows a rough classification of the following core topics within economic research between the years 2005 and 2014: Competitions and Reciprocity; Growth and Inequality; Market and Information; Earnings and Unemployment; Productivity and Innovations. Clusters also linked to this topical area, but which do not appear as frequently throughout the examined periods: Firm, Economic-Growth; Risk and Uncertainty; Monetary-Policy and Rule.
Topic clusters generated from different clusters and appearing frequently throughout all periods (name changes of the clusters were taken into account) are included in this diagram. Some thematic areas show strong cross-linkages considering the clusters they contain. The clusters with the highest rate of cross-linkages are “Growth,” “Market,” “Unemployment,” and “Productivity,” which – again – represent the main core topics within economic research between the years 2005 to 2014. However, a mainstream and/or a sidestream attribution of the topics is often ambiguous (e.g. Mearman Reference Mearman2011). One could argue that some keywords produce clusters establishing a certain “neoclassical” environment (e.g. “efficiency,” “liberalization,” “growth,” and “equilibrium”). Especially the later periods show, however, that certain keywords within the dominant core topics can be associated with rather heterodox economic approaches (e.g. “transition,” “happiness,” “consumption,” and “debt”). “Consumption” and “debt” might be interpreted as an increasing shift in attention towards the financial crisis, although they are inferior in number and therefore more difficult to identify. A more detailed analysis would be necessary to detect the origin and development of these clusters in a more profound way. Other topical areas show a rather independent development with only few cross-linkages throughout the entire period examined. Also belonging to the core topics of economic research, these topical areas are “Reciprocity” and “Competition.” Some topics are consolidated in the long-term of the period examined, e.g. research on risk and uncertainty. Beginning in a rather peripheral branch and developing into a more mainstream topic over time, this topic shows consolidation. “Uncertainty” and “risk” are typical variables used in neoclassical approaches. The topic “monetary policy” appears to be part of economic research throughout the whole period examined but persists as a rather peripheral topic.Footnote 11 However, a decision whether this topic should be regarded as heterodox or mainstream remains difficult. It could be seen as a mainstream topic when arguing that a stable economy is negatively influenced by an unwise monetary policy (e.g. Mankiw Reference Mankiw1989; Knoop Reference Knoop2015), or as heterodox when arguing in favor of a new financial architecture (Colander et al. Reference Colander, Föllmer, Haas, Goldberg, Juselius, Kirman, Lux and Sloth2009). The same is true of “Obesity.” It could be regarded as mainstream topic when looking at poor individual lifestyle choices (e.g. Lundborg, Nysted, and Rooth Reference Lundborg, Nystedt and Rooth2014) or as heterodox when dealing with political and/or social determinants of health (e.g. Nayga Reference Nayga2008). “Obesity” maintained a peripheral status within economic research. It is no longer displayed as an autonomous topic within economic research in the last period (2013-2014), though, and diminishes from the depiction in the strategic diagram. This finding can also be explained in different ways. For example, it might be harder for economic researchers to react rapidly to topics constantly dealt with but always remaining within the peripheral area of economic research These contemporary topics are often underfunded, making it difficult to set up research agendas. Another example of this is monetary policy. Its lower relevance for economic research can be explained by its belonging to the core topics of political sciences rather than to the topics of economic research. Another finding is the missing relevance of political economy within these results, which was once criticized by scientists in a public letter (e.g. Vaubel Reference Vaubel, Caspari and Schefold2011). Our findings might confirm these worries. Another explanation, of course, could be that political economy appears under a variety of keywords (e.g. “public choice”), making it difficult to identify. Another hindrance for the integration of peripheral topics into the core topics of economic research may be a lack of research infrastructure. Therefore, these topics are accompanied by cognitive and scientific uncertainties. Integration could mean a weakening of the scientific disciplines’ stability as well as increasing uncertainty about economic knowledge inside and outside the scientific discipline. Again, the results of our study deliver implications for interpretations and show the necessity for subsequent research.
Further specific dynamics can be observed in certain topics, which are shown as independent clusters primarily in period 1 (2005-2006). In the following period they are integrated into other clusters in the form of keywords only, e.g. “Endogenous-Growth,” “Rule,” or “Research-and-Development.” Completely new topic areas, which have not yet established any cross-linkages in the network, arose in the lower part of the diagram in the second period (2007-2008; i.e. during the years of the financial crisis). It may be assumed that the precursors to the financial crisis had already provoked new research topics, which became relevant with the empirical outburst of economic turnovers in 2007-2008. Pursuing this hypothesis, it could be interpreted as economic research’s high adapting potential to sudden occurrences – but – only in the peripheral area of research. Also, it must be considered that the financial crisis appeared as a surprising event for the public, politicians and even some economists. There were several factors indicating the “burst of the bubble,” though. Those signs may be revised within the peripheral research areas, which will continue to be discussed in future research. The rather new and peripheral topics mentioned above are “Propensity-Score,” “Tax-Competition,” “Co-Integration,” or “Agglomeration,” among others. The latter appears in both the first and the third period and has two keywords in common during the two different periods. These topics cannot be summarized into bigger topic areas, which also applies to the topics “Russia,” “Equilibrium-Unemployment,” or “Financial-Crisis.” However, the cluster “Financial-Crisis,” which refers to very notable events shaking the whole global economy recurrently, appears as an individual cluster only once throughout all the periods analyzed (2013-2014). As predicted by Bredillet (Reference Bredillet2009, 4; see also Dees Reference Dees2014, 72), topics are found in quadrant 3 that have been adopted by economic researchers as a short-term reaction to contemporary societal or political issues. This could also explain why more topics associated with political economy can be found here. The cluster “Monetary-Policy,” which constantly remains a rather peripheral issue within economic research, can also be found here.Footnote 12 The “Euro-Area” has continued to belong to the cluster “Monetary-Policy” since 2007-2008. The peripheral status of this topical complex, however, appears paradoxical in regard to the facts and events leading up to the financial and economic crisis in 2007-2008 as well as to the Eurocrisis. Once again, it becomes obvious that research topics shaking our society and relating to economic, political, and societal problems can only be found as peripheral research topics.
Finally, statistical and methodological terms like “Propensity-Score” or “Co-Integration” were not pursued constantly in the research periphery. These can only be treated as special issues over a short period of time due to the degree of difficulty in establishing new methodological approaches in economic research.
In conclusion, it is possible to classify core as well as peripheral topics in economic research in Germany from 2005-2014. Judging from an internal perspective, the stability of the basic research within economics enables a more intense concentration on specific topics. A science not frequently being challenged and shaken by a steady shift in “research trends” allows the legitimacy of the dominant research agenda to grow stronger. This, consequently, makes it harder for new approaches to influence the discipline, e.g. by offering alternative solutions to certain scientific problems as heterodox and/or pluralist economists are attempting to do.
Limitations
Our study has several limitations. Co-word analysis allows an examination of broad topics to gain first insights into an area of research. The results of our analysis only scratch the surface of the underlying structure of economic research, therefore. More detailed and reliable findings are possible when smaller, more separate scientific subdivisions are examined. Our analysis had to meet the challenge of examining a broad scientific field. The central objective was to provide a first and general impression of the thematic structure of economic research. No claim was made initially to more detailed and complex results. Future research might consider a weighting of the journals entering the analysis sample (e.g. by addressing the Journal Impact Factor) not realized in the present study, in order to constrain complexity. The “core document mapper,” as calculated by the computer program SciMAT, takes into account the way many of the most central documents appear within a cluster. The core document mapper analyzes all clusters regarding their publication performance and documents the count of the publications and their impact (Dees Reference Dees2014).
Another critical aspect is the choice of keywords as the foundation of the analysis. There are no general rules for the assignment of “Author Keywords” in the SSCI. Keywords are assigned by the authors. Time pressure, a lack of reflection on the assignment of index terms, or opportunistic selection might have a distorting effect. This leads to a lack of context and a failure to represent the real topics for journal articles published. These distortions have been reduced by the implementation of “Keywords PLUS” since 2004. These keywords are generated automatically, based on the titles in the reference list of the respective article. Therefore, one might expect the keywords in the research period examined to possess a certain signaling effect (e.g. in search queries in the SSCI). It is therefore possible to identify thematic complexes, which reveal a thematic structure within the research area through the cumulative common appearance of keywords. The structure detected may also indicate the pressure to produce scientific publications, which is proven for economics in particular (Leininger Reference Leininger2009). The appointment of professors or the nomination of “top economists” are orientated towards personal publication activities.Footnote 13 Due to time restrictions, it is therefore not unusual for scientists to issue a number of journal papers discussing similar topics – which finally affects the corpus of keywords accumulated in economics. This tendency in economic research is manifested in the form of a hard-topical core with little likelihood of shifting dynamics within its thematic landscape. Despite this, one has to bear in mind the main function of index terms, which is to simplify the document search in databases. Terms that resemble each other thematically or which have a general meaning are used to increase the chances of finding a document, even when synonyms are used. This may lead to a certain bias regarding the illustrations of the co-word analysis, because some index terms might be overemphasized. Furthermore, the indexation practice is presumed to change only gradually. This makes it harder for new terms to come into usage and – consequently – to be perceived. Those restrictions cannot be controlled methodologically within a co-word analysis and can only be taken into account, therefore, when discussing the results. Keywords allow a second order analysis because they are meta data of the underlying empirical documents. Thus, the results of the co-word analysis are strongly dependent on the indexation practices within the data bases examined. Despite those limitations, the co-word analysis allows an assessment of the topical structure within economic research, making it adequate enough for the purposes of this study.
Another challenge was the determination of stop words and their exclusion from the analysis. For further investigations, it may be useful to use methodological terms (e.g. “experiment”) as part of the analyzing corpus. These words were defined as stop words in the present study, as recommended by Dees (Reference Dees2014), who also applied a co-word analysis to a broad scientific field. It might be interesting to find out about the methodological trends and preferences within a scientific field, though. Special methodological topics (e.g. “Propensity-score”) appeared in quadrant 3 of the strategic diagram. If more methodological terms had been allowed, a more detailed depiction of special methodological approaches might have been possible. Considering that our goal was to identify broad trends in economic research, we refrained from this approach.
Regarding our third research question, “Which changes within the research field of economics can be traced back to influences of heterodox economics?” the conducted study was challenged to decide whether clusters, topics, or keywords should be regarded as mainstream, heterodox, or something in between. The keywords were treated on a very abstract level and the time horizon may have been too short for a definite assignment of a cluster or topic as originating in a heterodox economic approach. Subsequent studies could conduct a comparison between keywords used in explicitly heterodox economic journals and those used in explicitly standard economic journals. This procedure would offer implications regarding the structure of the general research landscapes of standard and non-standard economics. Nonetheless, the possibilities and limitations of a comparison study as suggested have to be determined. The introduction of economics into the historical development in Germany should provide first anchor points for a discussion of possible heterodox connections among the topical findings. If clusters such as “care economics,” “degrowth,” or “capital overaccumulation” had been detected, the classification would have been clearer with respect to possible heterodox nexuses.
Conclusion
The core topics of economic research were assessed in both a cross-sectional and a longitudinal way. As the results show, the core topics are: “competition and reciprocity,” “growth,” “inequality,” “income,” “unemployment,” and “productivity and innovation.”
Our study has three key findings: First, there is little variation in the core topics of economic research. Second, a wide range of research topics can be categorized as linked to standard neoclassic topics, confirming that these are dominating scientific discourse (e.g. “competition,” “innovation,” “productivity,” “market,” “growth,” “equilibrium,” and “liberalization”). Third, topics related to economic, political and societal problems (economic crises, monetary policy) and those that might be interpreted as linked to heterodox approaches adapt slowly – if at all – and can only be found as peripheral research topics. However, since the dynamic (or fluctuation) in the peripheral research area is higher than in the core topic area, they may be able to adapt to sudden economic occurrences faster.
Thus, economic research does react to political or societal issues to a certain extent despite its stable topical core. However, the influence of heterodox topics in economic research, which might be useful for dealing with economic as well as other problems, is weak. Contrarily, there is evidence for the revival of classic approaches: Apart from monetary policy, the research on risk and uncertainty can be identified as a steady theme complex in this analysis. This appears throughout all the periods examined. In 2013-2014 this complex was integrated into the core area of research. The examination of risk and uncertainty can be assigned to behavioral economics, which again highlights its present high relevance for economic research. This could be a reaction to the financial and economic crisis in 2007-2008. Considering that 2013–2014 is the last period examined, it remains unclear whether this focus will be sustained or if it is only a temporary peripheral topic.
In conclusion, the study shows slight tendencies towards shifts in research topics within economics. Within the peripheral sphere of economic research, a higher degree of thematic shifts can be found. Meanwhile, only few changes of the topical structure within the central field of economic research can be observed during the period of time examined (2005-2014). No topics with a clear heterodox economic linkage could be determined. The fact that heterodox economic topics were not displayed unequivocally within a keyword corpus extracted from the SSCI shows that they still are extremely underrepresented within the holistic economic research field. The financial crisis, thus, could not serve as a “door opener” for an accelerated integration of heterodox approaches. As discussed above, one of the main differences between standard and non-standard economics may be seen in the normative – and therefore political – perspective that is underlying its research base. Non-standard economics generally view conventional economic approaches or even economic relations revealed in the real world rather critically. A financial crisis with the dimensions of the years 2007-2008 does not seem to have released enough skepticism about economic research standards to cause a change in the normative biases. Economic research nevertheless reacts to changes in economic reality after a certain period of time. However, one might question whether those rather small adaptations within the core area of research are sufficient. The dominance of standard economics with topics like “market” and “competition” seems to disregard a reality overshadowed by crises, which in a global dimension confronts more and more human beings with the problem of securing their mere subsistence on an economic level. Subsistence needs are seen primarily as regulated on well-functioning markets by an “invisible hand,” interpreted as balanced in an equilibrium – even though the economic reality is being shaken by crises. One might ask whether the highly funded central institutions of economic research secure paradigmatic claims made within standard economics instead of finding solutions to the basic question of how economic activity could be channeled to secure life and living spaces for expanding humankind. The shift in economic research topics as identified in this study confirms an insight expressed by Paul Feyerabend, who illustrates scientific change as follows: “Madness turns into sanity if it is sufficiently rich and sufficiently regular to function as the basis of a new world-view” (Feyerabend Reference Feyerabend1993, 206).
Acknowledgments
We would like to thank the reviewers and the editors for their helpful comments and suggestions.
Ulrike Jacob is a sociologist currently working as a union secretary for ver.di – Vereinte Dienstleistungsgewerkschaft. She contributed to the formation of the network for pluralism in economics, managing the internal communication, coordination and organization of the network. Her main research interests are the sociology of economic sciences, economic sociology, sociology of social change, the sociology of power and inequality and methods and theories of community organizing.
Oliver Brust is a Research Assistant at the Chair of Empirical Social Research of the Technische Universität Dresden. His main research interests are development of self-report measures, test theory, social network analysis, development and measurement of occupational interests and economic sociology.


 Open access

