


1. Introduction
A geographical indication (GI) is an information signal based on a product’s geographical origin, granting consumers a guarantee of quality and safeguarding producers from fake competitors. GIs establish intellectual property rights for region-specific products,Footnote 1 yet their impact on local economic development has received limited empirical attention. To examine such potential spillover effects, this paper exploits the renowned GI of Champagne, a high-quality sparkling wine protected under the EU’s strongest GI classification, the Protected Designation of Origin (PDO). It is more commonly referred to as the Champagne Appellation d’Origine Contrôlée (AOC). This paper shows that such institutional protection has positively affected the Champagne region’s economy beyond the famous wine industry alone.
The Champagne AOC is defined at the municipal level, enabling a granular geographical analysis that takes a product’s local specificity into account (i.e., terroir for wine). The current delineation of the Champagne AOC boundary was (and remains) driven primarily by political decisions rather than viticultural decisions based solely on terroir. As a result, the probability of producing a luxury sparkling white wine comparable in quality to Champagne varies smoothly across the GI boundary. This continuity assumption permits identification of a causal relationship between the Champagne AOC and municipal-level economic outcomes at the boundary via a spatial regression discontinuity design.
I find that the Champagne AOC has led to higher employment rates for municipalities just inside the AOC boundary. This effect is economically significant: the right to label wine as Champagne leads to a 10% reduction in unemployment. These municipalities also generate increased fiscal revenue due to differentiated tax structures characterized by higher rates on land and real estate, and lower rates on business property. In turn, I note that local residents benefit from enhanced public service provision, such as healthcare and education.
These findings suggest that institutional protections like GIs can achieve broader regional benefits beyond the designated sector. In the case of Champagne, employment gains stem not only from viticulture and wine production itself, but also from upstream and downstream activities such as tourism, logistics, and regional branding. The differentiated tax regimes reflect both increased demand for property and greater local government capacity.
Next, I turn to a major evolution in the Champagne region, the significant increase in global demand for Champagne from the early 1990s until the Covid-19 pandemic. As a result, Champagne vineyard prices per hectare have risen sharply over the past few decades. I first verify that land, real estate, and rent prices are higher for municipalities inside the AOC. Afterwards, employing a difference-in-discontinuities design, I estimate whether the price increases have affected the spatial RD estimates at different periods. Importantly, the Champagne AOC does not appear to crowd out economic activity over time, underscoring the potential of GIs as instruments for broader regional development rather than narrow sectoral privileges only. Finally, to rule out potential sorting or migration effects related to elevated housing prices near the AOC boundary, I use commuting data from French censuses covering the period 1999–2019, and observe no evidence of sorting around the boundary.
Much of the literature on GIs focuses on their political economy (Barham, Reference Barham2003; Josling, Reference Josling2006; Meloni and Swinnen, Reference Meloni and Swinnen2013) and partial equilibrium effects, such as impacts on wine quality and prices (Carbone et al., Reference Carbone, Caswell, Galli and Sorrentino2014; Cei et al., Reference Cei, Stefani, Defrancesco and Lombardi2018; Meloni and Swinnen, Reference Meloni and Swinnen2018; Gastaldello et al., Reference Gastaldello, Schäufele-Elbers and Schamel2024; Delmond and McCluskey, Reference Delmond and McCluskey2025). GIs generally benefit consumers by reducing information asymmetry (Mérel et al., Reference Mérel, Ortiz-Bobea and Paroissien2019; Saïdi et al., Reference Saïdi, Ay, Marette and Martin2020) and enable producers to exercise monopolistic pricing (Cross et al., Reference Cross, Plantinga and Stavins2011; Chandra and Moschini, Reference Chandra and Moschini2022). In contrast, empirical evidence on GIs within a general equilibrium framework remains limited, leaving their broader spillover effects unclear.
This paper contributes to the literature on GIs by providing empirical evidence on their influence on regional economic performance within a well-identified econometric framework. A priori, their impact on overall local economic development is ambiguous, as rising land and vineyard prices (Gergaud et al., Reference Gergaud, Plantinga and Ringeval-Deluze2015; Cross et al., Reference Cross, Plantinga and Stavins2017) may crowd out other economic activity. Establishing causality has often proved difficult, since most major GIs were introduced before spatial data on local development was available (exceptions include Cei et al., Reference Cei, Stefani, Defrancesco and Lombardi2018; Crescenzi et al., Reference Crescenzi, De Filippis, Giua and Vaquero-Piñeiro2022; Raimondi et al., Reference Raimondi, Curzi, Arfini and Falco2024). Moreover, the majority of these studies are confined to administrative levels above the municipal scale in their spatial analysis, as GIs are often defined at the regional or provincial level.
The paper is structured as follows. Section 2 outlines the institutional context of the Champagne AOC. Section 3 describes the data. Section 4 presents the identification strategy and local economic outcomes. Section 5 examines temporal dynamics and potential crowding out effects. Section 6 concludes.
2. Champagne AOC history
The Champagne region in northeastern France has a long winemaking tradition, with the earliest experiments dating back to the Roman period.Footnote 2 Over time, Champagne wine became closely tied to the region’s geography, cultural identity, and secondary fermentation method that gives it its signature effervescence. To preserve this unique identity, the Champagne AOC (Figure 1) now legally guarantees its origin and production method. Modern legislation notwithstanding, Champagne wine was not always institutionally protected. Until the early 20th century, Champagne producers largely abided by informal norms and traditions. The first attempt to legally define Champagne wine and its production came after the Champagne Riots of 1910–1911, which were sparked by growing tensions and economic pressures.
Map of the Champagne AOC.

During the first wave of globalization (1870–1914), rapid growth in international trade caused the Champagne market to skyrocket. The rise of consumer elites in booming export markets such as Britain, Russia, and the United States drove sharp increases in demand for luxury products. Champagne came to be regarded as a highly desirable export product, a global symbol of prestige. Reputable Champagne producers were strongly incentivized to maintain high standards to protect the Champagne name in international markets.
Initially, brand identity and regional reputation served as powerful informal enforcement mechanisms. However, by the end of the 19th century, French vineyards had been decimated by the Phylloxera epidemic.Footnote 3 This crisis, compounded by mold, mildew, hailstorms, and flooding, led to a catastrophic 96% loss of Champagne vineyard crops in 1910. The untenable mismatch between supply and demand led Champagne houses to source cheaper grapes from outside the Champagne region. Some producers substituted grapes from the Loire Valley or Languedoc—with rumors circulating that rhubarb from the UK was used. Wines produced in this fraudulent manner were called faux Champagnes. Growing issues of collusion between Champagne houses (producers), and the production of these fake Champagnes generated tensions with legitimate Champenois vine growers. The resulting clash of interests eventually generated violence and riots, making it clear that legislation was urgently needed.
In 1911, the French government introduced the first legal definition of Champagne, along with accompanying legislation to define the appellation. Nevertheless, social unrest continued. The exclusion of the historical capital of Champagne production, Troyes, provoked protests from local vine growers. Moreover, while the initial legislation was intended to ease the supply issues that plagued Champagne production, it effectively halved the existing Champagne vineyard area. As a result, social unrest escalated into political unrest, threatening a regional civil war. The outbreak of World War I subsequently rearranged the priorities of all stakeholders involved, as the Champagne region became a major battleground within range of German artillery. The war disrupted the wine industry once again, with many vineyards, towns, and essential infrastructure destroyed, forcing producers to rebuild, rethink their practices, and re-establish their markets.
After the Great War, mounting political pressure led to the establishment of more coherent laws and regulations. In 1927, the French government enacted legislation that laid the foundation for the modern AOC system. The Champagne Appellation d’Origine Contrôlée (AOC) legally defined the production area and established strict guidelines for cultivation and production methods. The law not only protected the geographical boundaries of Champagne but also ensured that only wine produced under stringent conditions could bear the prestigious name of “Champagne.” These protections remain essential to preserving the prestige of the wine and preventing imitation by producers elsewhere.
The AOC standards officially came into being with the decree of June 29, 1936. Its geographical area covered five départements and 635 communes where Champagne production was authorized. Figure 1 displays the AOC boundary and all associated municipalities allowed to produce Champagne. The boundaries of the Champagne AOC have remained unchanged since their initial establishment in 1927. Since July 2008, a potential expansion of the Champagne AOC area has been under evaluation.Footnote 4
3. Data
Employment data is drawn from two waves of French census data, conducted in 1999 and 2019. Observations are initially at the individual level, and later aggregated into georeferenced municipalities. Beyond standard demographic and employment information, these surveys include the data points related to commuting practices, used to examine sorting near the boundary. I combine these datasets with the digitized Champagne AOC boundary constructed using a database on all French GIs maintained by the Institut national de l’origine et de la qualité (INAO), Table 1 presents mean summary statistics for 2019.
2019 mean summary statistics (50 km bandwidth)

Data on municipal tax bases, rates, and revenues come from the French Ministry of Economy, Finance and Industrial and Digital Sovereignty (MEFSIN). Statistics on healthcare and education facilities are sourced from publicly available French administrative data hosted on the official data repository (data.gouv.fr). Real estate and rent price data are obtained from the French National Institute of Statistics and Economic Studies (INSEE).
The GIS data for geographical variables come from various sources. The digital elevation model (DEM) dataset is produced by the French National Institute of Geographic and Forest Information (IGN) and has a precise spatial resolution of 5  $\times$ 5 m. The slope and total ruggedness index variables are publicly available from Nunn and Puga (Reference Nunn and Puga2012). Data on rainfall is provided by the Global Climate Database, which I average over twelve months for annual measures of rainfall. The variable on soil quality is derived from soil carbon and nitrogen levels, part of the Atlas of the Biosphere (University of Wisconsin-Madison). The functional form of the formula is explained in the online appendix of Michalopoulos (Reference Michalopoulos2012). These GIS variables are subsequently averaged within each municipality’s polygon borders using QGIS.
4. Local economic outcomes
4.1. Empirical strategy
The contentious political and historical process leading to the creation of the AOC suggests that its precise boundary reflects bargaining power and contingent decisions, rather than underlying geography relevant to viticulture. This arbitrary component enables the Champagne AOC to be exploited as a quasi-natural experiment. I estimate how the ability to produce wine labeled Champagne influences economic outcomes using the following baseline geographical regression discontinuity:
 \begin{equation}
Y_{m,d} = \alpha + \beta Champagne_{m} + f(geolocation_m) + \chi_d + \epsilon_{m,d}
\end{equation}
\begin{equation}
Y_{m,d} = \alpha + \beta Champagne_{m} + f(geolocation_m) + \chi_d + \epsilon_{m,d}
\end{equation} where  $Y_{m,d}$ is the outcome variable of interest for municipality m in department d; $Champagne$ is an indicator equal to 1 if municipality m is inside the Champagne AOC area and 0 otherwise; $f(geolocation_m)$ is the RD polynomial, which controls for smooth functions of geographic location; $\chi_d$ are department fixed effects; and $\epsilon_{m,d}$ are the standard errors clustered at the department level.
The baseline specification is a local linear polynomial in distance to the boundary, estimated independently on both sides (Gelman and Imbens, Reference Gelman and Imbens2019). Furthermore, I implement all other best practices regarding (geographical) regression discontinuities (Calonico et al., Reference Calonico, Cattaneo and Titiunik2014; Cattaneo et al., Reference Cattaneo, Titiunik, Vazquez-Bare and Keele2016). This implies using a triangular weighting kernel and calculating the optimal bandwidth using the MSE-minimizing procedure from Cattaneo et al. (Reference Cattaneo, Idrobo and Titiunik2019).
The coefficient of interest,  $\beta$, captures the effect of a municipality being right inside the Champagne AOC boundary on the outcome variable. Interpretation relies on the fact that the exact location of the AOC boundary is orthogonal to local geography (i.e., the capacity to produce Champagne wine). This central continuity assumption is key for causal identification, since a difference in geography may be a confounding factor for economic performance today. Any observed local discontinuities in outcomes can then be interpreted as causal effects of the Champagne AOC designation. In order to determine whether municipalities on both sides of the boundaries are indeed valid counterfactuals with relation to viticulture, I show that geographic variables vary smoothly around the AOC border. This provides quantitative evidence that the Champagne AOC boundary was not determined purely by terroir, complementing the qualitative historical evidence presented in Section 2.
Table 2 presents summary statistics and estimates of geographic variables near the Champagne AOC boundary. The balance test is based on the granular GIS data described earlier, with variable values averaged for each municipality. The RD estimates are obtained using an adapted version of specification (1) without department fixed effects. Instead, the standard errors provided are clustered at the department level. Column (5) provides the evidence that all geographic characteristics are smooth around the AOC boundary, confirming the identification assumption is not violated. Moreover, column (3) shows that the majority of these geographic characteristics are also balanced over the entire bandwidth of 50 km. This fixed bandwidth is based on the average optimal bandwidth of the RD estimates (47.5 km), selected by the MSE-minimizing procedure in Cattaneo et al. (Reference Cattaneo, Idrobo and Titiunik2019), and will be used in addition to the optimal bandwidth in all baseline results. These estimates suggest that there is little reason to doubt that the geography of the Champagne AOC area is significantly different from the surrounding region.
Champagne AOC and geographical balance

Notes: The unit of observation is the aggregated average value within a municipality. Columns (1) and (2) present the sample mean of the corresponding variable. Column (3) presents clustered standard errors for the difference in means clustered at the department level. Inside and Outside indicate whether a municipality is located inside or outside of the Champagne AOC respectively. Columns (4–5) use the average of all optimal bandwidths (47.5 km) as determined using the procedure suggested by Cattaneo et al. Reference Cattaneo, Idrobo and Titiunik2019.
*  $p \lt 0.10$, ** $p \lt 0.05$, *** $p \lt 0.01$.
4.2. Results
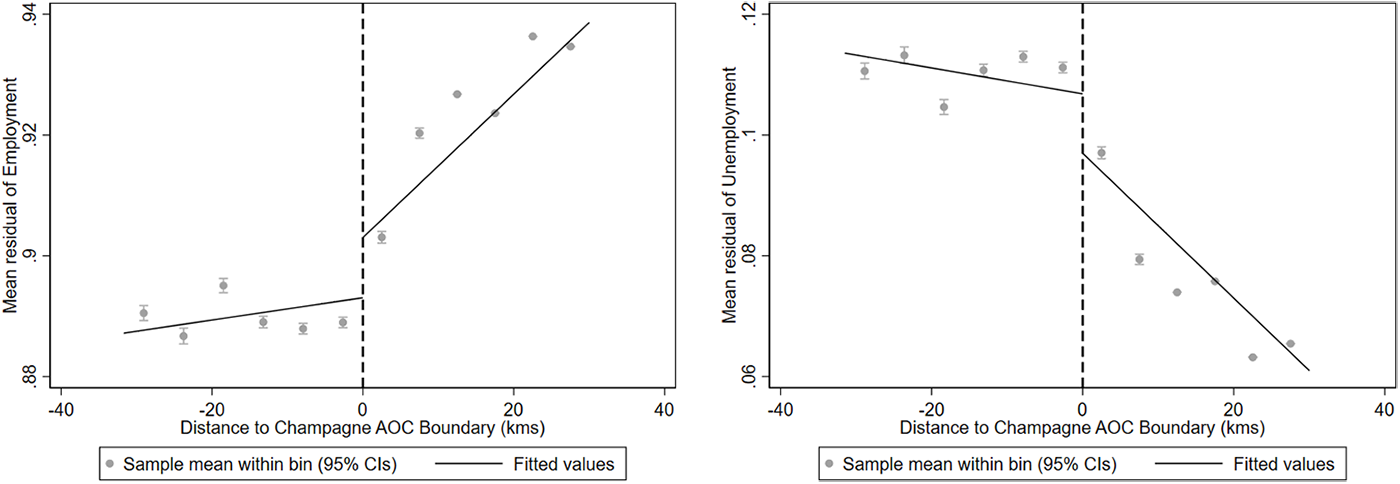
Comparing municipalities on either side of the Champagne AOC boundary, I identify consistent and statistically significant positive effects of the GI on local economic performance. The cross-sectional employment outcomes associated with exposure to the Champagne AOC are detailed in Table 3. These results are estimated using the baseline specification outlined in Equation (1). In particular, municipalities located close to the boundary that have the right to produce wine labeled as Champagne exhibit lower unemployment rates and higher employment levels. Quantitatively, these municipalities experience an average increase in employment of approximately 1 percentage point, coupled with a decrease in unemployment of roughly the same magnitude. When considered in relative terms, this reduction represents a substantial 10% decline in the unemployment rate within the Champagne AOC area compared to neighboring municipalities just outside the designated boundary. Achieving a 10% reduction in unemployment through a single policy (the Champagne AOC) is remarkable, and represents a compelling positive spillover effect.
Champagne AOC and employment

Notes: Champagne is a binary variable equal to 1 if the municipality is inside the Champagne AOC boundary and 0 otherwise. All regressions control for department and include a local linear specification estimated separately on each side of the concession boundary, using a triangular kernel. Optimal bandwidths are chosen using the MSE-minimizing procedure suggested by Cattaneo et al. (Reference Cattaneo, Idrobo and Titiunik2019) and are reported in km. t statistics in parentheses
*  $p \lt 0.10$, ** $p \lt 0.05$, *** $p \lt 0.01$.
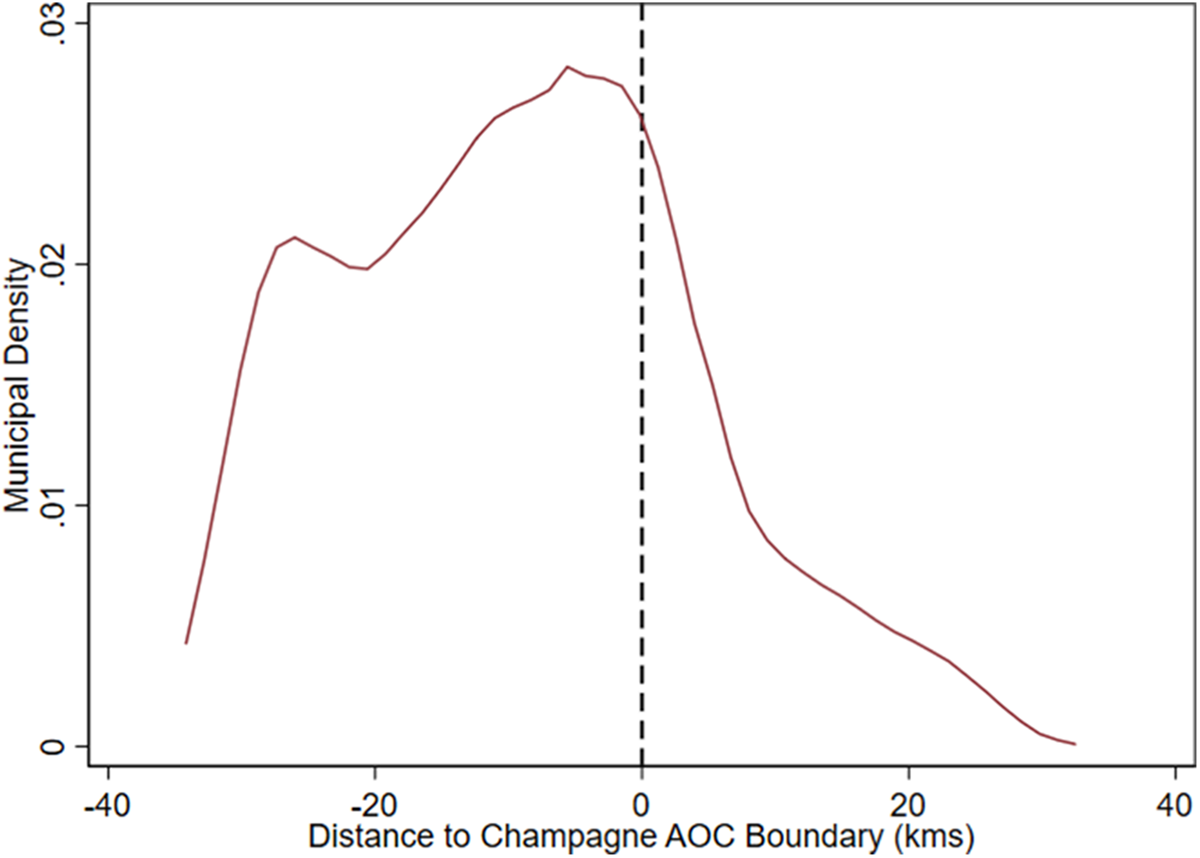
Figure 2 is a visual representation of the discontinuity in (un)employment rates around the Champagne AOC boundary. The classic RD plots display the mean value of the outcome variable (employment) at each bin along the running variable (distance to the AOC border), including a local linear trend estimated separately on each side of the discontinuity. 95% Confidence intervals are displayed with horizontal grey bars around each individual bin. I re-estimate the baseline RD model in the Appendix using different bandwidths (Table A1) and alternative functional forms (Table A2). I also include a visualization of municipal density (Figure A1), caused by the radial geometry of the Champagne AOC. The results remain virtually unchanged across all specifications.
RD plots for employment.

To disaggregate the aggregate employment effect and identify its primary drivers, Table 4 reports the RD estimates for each major economic sector. The results indicate that the agricultural sector is the principal beneficiary of the Champagne AOC. As anticipated, this sector experiences the most significant increase, with employment almost doubling at the boundary relative to the average level within the optimal bandwidth. Substantial positive effects are also found in manufacturing and the public sector, which exhibit employment gains of nearly 50% and 20%, respectively. In contrast, I find no evidence of a statistically significant employment impact in the construction and service sectors, suggesting that these industries do not directly benefit from the AOC designation.
Champagne AOC and sectoral employment

Notes: Champagne is a binary variable equal to 1 if the municipality is inside the Champagne AOC boundary and 0 otherwise. All regressions control for department and include a local linear specification estimated separately on each side of the concession boundary, using a triangular kernel. Optimal bandwidths are chosen using the MSE-minimizing procedure suggested by Cattaneo et al. (Reference Cattaneo, Idrobo and Titiunik2019) and are reported in km. t statistics in parentheses.
*  $p \lt 0.10$, ** $p \lt 0.05$, *** $p \lt 0.01$.
Next, I explore a potential mechanism underlying the employment differences observed across the Champagne AOC boundary. Municipalities on either side of the boundary have established markedly different fiscal regimes within their authority.Footnote 5 Table 5 presents differences in tax base, tax rate, and tax revenue across three categories: land, real estate, and business property. Municipalities within the Champagne AOC impose higher tax rates on land and real estate, while lowering their business property tax rates relative to neighboring municipalities just outside the boundary.
Champagne AOC and fiscal regime

Notes: Champagne is a binary variable equal to 1 if the municipality is inside the Champagne AOC boundary and 0 otherwise. All regressions control for department and include a local linear specification estimated separately on each side of the concession boundary, using a triangular kernel. Optimal bandwidths are chosen using the MSE-minimizing procedure suggested by Cattaneo et al. (Reference Cattaneo, Idrobo and Titiunik2019) and are reported in km. t statistics in parentheses
*  $p \lt 0.10$, ** $p \lt 0.05$, *** $p \lt 0.01$.
These findings are unsurprising, given that the land within the Champagne AOC boundary is highly desirable due to its capacity to produce Champagne. This desirability likely enables municipalities to levy higher taxes on land and real estate, and they may have reduced distortionary effects given the land’s intrinsic value. The resulting increase in tax revenues could then enable these same municipalities to reduce business property tax rates, thereby incentivizing further economic activity. These differential fiscal regimes of local municipalities may partly account for the observed disparities in their economic performance.
After establishing that municipalities within the Champagne AOC benefit from higher fiscal revenues compared to nearby municipalities outside the boundary, I turn to the question of how these additional resources are allocated. More precisely, I examine whether the ability to produce Champagne—and the accompanying fiscal windfall—translates into improved provision of local public goods. Table 6 presents supporting evidence: municipalities located just inside the Champagne AOC boundary are more likely to administer hospitals and educational facilities. This pattern indicates that the economic benefits of AOC status extend beyond private sector outcomes, enhancing the capacity of local governments to deliver essential public services. It provides preliminary evidence that the institutional protection offered by the AOC can yield tangible improvements in public goods provision for local populations.
Champagne AOC and public goods

Notes: Champagne is a binary variable equal to 1 if the municipality is inside the Champagne AOC boundary and 0 otherwise. All regressions control for department and include a local linear specification estimated separately on each side of the concession boundary, using a triangular kernel. Optimal bandwidths are chosen using the MSE-minimizing procedure suggested by Cattaneo et al. Reference Cattaneo, Idrobo and Titiunik2019 and are reported in km. t statistics in parentheses
*  $p \lt 0.10$, ** $p \lt 0.05$, *** $p \lt 0.01$.
Finally, to ensure the validity of the estimations, I rule out sorting—that is, whether employment outcomes inside the AOC are driven by commuters from adjacent, lower-cost municipalities. Columns (5)–(8) of Table 7 show no significant difference across the boundary in the share of residents who work in their own municipality.
Champagne AOC and housing & commuting

Notes: Champagne is a binary variable equal to 1 if the municipality is inside the Champagne AOC boundary and 0 otherwise. All regressions control for department and include a local linear specification estimated separately on each side of the concession boundary, using a triangular kernel. Optimal bandwidths are chosen using the MSE-minimizing procedure suggested by Cattaneo et al. Reference Cattaneo, Idrobo and Titiunik2019 and are reported in km. t statistics in parentheses
*  $p \lt 0.10$, ** $p \lt 0.05$, *** $p \lt 0.01$.
5. Persistence of results
Champagne vineyard prices have risen sharply over the past 30 years (Trenda, Reference Trenda2024), driven by surging global demand and the decline of Soviet-era sparkling wine substitutes.Footnote 6 I confirm this pattern by showing that rent and real estate prices are also higher right inside of the Champagne AOC than right outside of it. Columns (1) to (4) of Table 7 present prices and rents per square meter, which are around 5% higher for the Champagne AOC.
The static nature of the Champagne AOC boundary throughout the last century has created a highly inelastic supply. This may enhance monopoly rents, but can also raise local living costs. To test whether rising land and house prices have affected the AOC’s local results over time, I implement a difference-in-discontinuities analysis spanning two decades (1999–2019). This approach compares the effects of exposure to the Champagne AOC in two periods. The diff-in-disc estimator  $\delta$ is implemented by estimating the boundary points of four regression functions (See Grembi et al., Reference Grembi, Nannicini and Troiano2016).
This implies the estimation of two linear regressions on either side of the boundary, for each time period—yielding a 2  $\times$ 2 structure:
 \begin{equation}
\begin{aligned}
Y_{m, t} = {}
& \alpha_1 + \beta_1 Champagne_{m, t} + f(geolocation_{m, t}) + \chi_{m, t} \\
& + 2019_{t}[\alpha_2 + \beta_2 Champagne_{m, t} + f(geolocation_{m, t}) + \chi_{m, t}] + \epsilon_{m, t}
\end{aligned}
\end{equation}
\begin{equation}
\begin{aligned}
Y_{m, t} = {}
& \alpha_1 + \beta_1 Champagne_{m, t} + f(geolocation_{m, t}) + \chi_{m, t} \\
& + 2019_{t}[\alpha_2 + \beta_2 Champagne_{m, t} + f(geolocation_{m, t}) + \chi_{m, t}] + \epsilon_{m, t}
\end{aligned}
\end{equation} where  $\beta_2$ is the coefficient of interest. $Y_{m, t}$ is the outcome variable of interest for municipality m at time t; $2019_t$ is an indicator equal to 1 if the observation is from 2019 and 0 otherwise; and $\epsilon_{m, t}$ is the error term. All other variables follow the baseline specification, with the additional time period identifier t. This indicator is functionally the same as the post-treatment period indicator found in Grembi et al. (Reference Grembi, Nannicini and Troiano2016).
There was already a positive discontinuity in (un)employment at the AOC boundary in 1999. Table 8 shows that this result has remained stable over the past 20 years. This implies that rising land and housing prices—especially for vineyards—have not altered the overall impact of the Champagne AOC on the local economy. If there has been any increase in crowding out of other industries over time, it has been offset by additional gains within the Champagne-related sectors, fully compensating any employment losses.
Champagne AOC and persistence

Notes: Champagne 2019 represents the Difference-in-Discontinuity coefficient from Equation (2), relying on the RD coefficients at 25 km and 50 km bandwidths. This coefficient is interpreted as the change in the discontinuity over 20 years, with 1999 acting as the baseline. Regressions control for department. t statistics in parenthesis *  $p \lt 0.10$, ** $p \lt 0.05$, *** $p \lt 0.01$.
6. Conclusion
This paper provides causal evidence that the Champagne Appellation d’Origine Contrôlée (AOC) positively affects local economic outcomes in the Champagne region. Utilizing a spatial regression discontinuity design at the municipal level, I find that municipalities within the AOC boundary exhibit significantly lower unemployment rates and higher employment relative to neighboring municipalities outside the boundary. In terms of magnitude, the Champagne AOC is responsible for a 10% reduction in the unemployment rate, which constitutes a meaningful spillover effect. A sectoral decomposition of the employment effects indicates that the largest gains are concentrated in the agricultural sector, rising by 100%. The manufacturing and public sectors also experience significant growth, with employment gains of 50% and 20%, respectively. These employment effects are accompanied by distinct fiscal regimes and increased municipal provision of public goods, indicating that the institutional protection conferred by the AOC generates broader economic spillovers beyond the wine sector. Moreover, despite substantial increases in vineyard and real estate prices over the past two decades, these price dynamics have not diminished the positive economic impact, nor do they appear to have induced residential sorting or crowding out of other economic activities.
These findings suggest that an expansion of the AOC to include additional municipalities—currently considered by the INAO—is likely to yield similar local economic benefits for the newly admitted municipalities in the future. The results contribute to the broader literature on GIs by providing granular empirical evidence of their spillover effects on regional development. In conclusion, the Champagne AOC exemplifies how legally enforced GIs can function as effective instruments of regional economic policy beyond the protected industry alone.
Acknowledgements
I am grateful to the editor, the anonymous referee, and the participants of the 17th Annual Conference of the American Association of Wine Economists, held at California Polytechnic State University, San Luis Obispo, for their insightful comments, which substantially improved this paper. I also thank the American Association of Wine Economists for their generous support through their Scholarship Program.
Appendix
Champagne AOC and employment bandwidth robustness

Notes: Champagne is a binary variable equal to 1 if the municipality is inside the Champagne AOC boundary and 0 otherwise. All regressions control for department and include a local linear specification estimated separately on each side of the concession boundary, using a triangular kernel. Bandwidths are chosen as robustness checks and are reported in km. t statistics in parentheses
*  $p \lt 0.10$, ** $p \lt 0.05$, *** $p \lt 0.01$.
Champagne AOC and employment polynomial robustness

Notes: Champagne is a binary variable equal to 1 if the municipality is inside the Champagne AOC boundary and 0 otherwise. All regressions control for department and include a local quadratic specification estimated separately on each side of the concession boundary, using a triangular kernel. Optimal bandwidths are chosen using the MSE-minimizing procedure suggested by Cattaneo et al. Reference Cattaneo, Idrobo and Titiunik2019 and arereported in km. t statistics in parentheses
*  $p \lt 0.10$, ** $p \lt 0.05$, *** $p \lt 0.01$.
RD plot for municipal density.


 Open access