


I
The issuance and evolution of sovereign bonds have profoundly influenced national economic trajectories, serving as a critical mechanism for governments, particularly in developing countries, to finance development and stimulate growth. Historically, sovereign bonds have enabled nations to bridge infrastructure funding gaps, finance public goods, and in some instances, wage wars, embedding these financial instruments within the broader political and economic framework of global history (Gardner Reference GARDNER2017; Beirne et al. Reference BEIRNE, RENZHI and VOLZ2021). Following the Napoleonic Wars, the reconfiguration of the global map catalyzed the emergence of new republics across Latin America. These states, soon in need of substantial capital, sought financial support from London, initiating the first boom in emerging market debt (Flandreau and Flores Reference FLANDREAU and FLORES2009; Meyer et al. Reference MEYER, REINHART and TREBESCH2022b). This debt boom underscored the crucial role of sovereign bonds as a primary means of accessing international capital, laying the foundation for a period of financial globalization that would define emerging markets’ economic trajectories for decades.
As sovereign bonds became essential to financing infrastructure projects, development initiatives and military expenditures, a paradigm of financial interdependence emerged. This early wave of capital market integration connected the fates of creditors and emerging economies, generating opportunities alongside unprecedented risks. Financial integration during this era allowed emerging markets, especially in Latin America, to access capital that would have been otherwise unavailable, fundamentally altering their economic landscapes and fostering a reliance on foreign debt with both positive and negative long-term implications (Flandreau and Flores Reference FLANDREAU and FLORES2009; Kaminsky Reference KAMINSKY2009; Ventura and Voth Reference VENTURA and VOTH2015; Gardner Reference GARDNER2017; Beirne et al. Reference BEIRNE, RENZHI and VOLZ2021). Highlighted by Gardner (Reference GARDNER2017), this period featured levels of financial integration comparable to those of the late twentieth-century globalization wave, underscoring the cyclical nature of international capital flows and illustrating the complex balance of embedded risks and benefits.
By the early twentieth century, sovereign bond markets had expanded further, with deepening financial integration and evolving geopolitical dynamics enhancing these connections. The United States’ expansion into the Caribbean, particularly following Cuba’s annexation in 1898, underscored the geopolitical implications of sovereign debt, with US policies serving both economic and strategic interests (Mitchener and Weidenmier Reference MITCHENER and WEIDENMIER2005). The Roosevelt Corollary, a significant extension of the Monroe Doctrine, exemplified this shift, allowing the US to intervene directly in the affairs of unstable Caribbean and Central American nations struggling with debt obligations. This policy shift catalyzed a boom in the bond market as investors grew increasingly confident in the implicit backing of Caribbean debts by the US Bond yields in the region rose markedly, reflecting investor confidence in US intervention in debt disputes if necessary. This implicit guarantee influenced investor behavior, further integrating Caribbean sovereign debt into global capital markets and underscoring how geopolitical considerations shaped financial risk assessments (Mitchener and Weidenmier Reference MITCHENER and WEIDENMIER2005). Despite a growing body of literature on sovereign debt market evolution – particularly within European colonial contexts – a notable gap remains regarding early twentieth-century Caribbean nations during a period of increasing US oversight. Previous studies have focused on European colonial entities and legislative advances like the Colonial Stock Act, often overlooking the Caribbean’s unique cases of Cuba, the Dominican Republic and Haiti (Flandreau et al. Reference FLANDREAU, FLORES, GAILLARD and NIETO-PARRA2010; Gardner Reference GARDNER2017). This article addresses that gap by focusing on these Caribbean countries, where US intervention and environmental risks add critical complexity to their bond market dynamics. Specifically, this study explores how these countries navigated the challenges of early twentieth-century bond markets under varying degrees of US oversight while facing recurrent environmental shocks in the form of hurricanes.
The literature on sovereign debt markets frequently highlights the mechanisms used to mitigate risk, such as the use of collateral arrangements during the gold standard era and the trustee status granted to colonial bonds under the Colonial Stock Act of 1900 (Accominotti et al. Reference ACCOMINOTTI, FLANDREAU and REZZIK2011; Maerean et al. Reference MAEREAN, PEDERSEN and SHARP2021). This article builds on that understanding by focusing on the Caribbean, where US-appointed officials managed customs revenues to stabilize economies and safeguard investor interests. This arrangement not only lowered perceived risk but also contributed to favorable bond yields, given the implicit US backing. By exploring the intersection of geopolitical oversight and regional economic vulnerabilities, this article advances a nuanced understanding of how institutional structures impacted sovereign debt markets in the Caribbean. Importantly, this financial environment influenced how external shocks, particularly hurricanes, affected investor confidence and bond yields, revealing the complexities of managing sovereign debt within a region marked by heightened vulnerability.
The Caribbean is particularly susceptible to hurricanes, which pose significant risks to economic stability by increasing public spending on recovery and reconstruction and simultaneously depressing revenues due to economic disruption (Cavallo et al. Reference CAVALLO, GÓMEZ, NOY and STROBL2024). As exogenous and unexpected events, hurricanes differ from financial crises or wars in their unpredictable yet significant impact. By examining how natural disasters impact sovereign debt markets, this study expands the literature to incorporate environmental risks that uniquely influence bond markets within the Caribbean. Studies such as Klomp (Reference KLOMP2015) have found that natural disasters elevate sovereign risk premiums by increasing the likelihood of default due to the substantial costs of emergency relief and reconstruction. The relationship between natural disasters and bond yields reflects investor concerns regarding governments’ capacity to manage these expenses, often resulting in higher bond yields as governments confront fiscal imbalances exacerbated by these shocks (Klomp Reference KLOMP2015; Beirne et al. Reference BEIRNE, RENZHI and VOLZ2021).
This article makes several contributions to the literature. While prior studies have examined major historical shifts in bond markets, such as sovereign debt cycles in Europe and the Colonial Stock Act’s impact, they largely emphasize European colonial entities, overlooking the Caribbean during this period (Flandreau et al. Reference FLANDREAU, FLORES, GAILLARD and NIETO-PARRA2010; Gardner Reference GARDNER2017). By concentrating on Cuba, the Dominican Republic and Haiti in the early twentieth century, this study adds essential nuance to understanding sovereign debt markets in regions under US oversight but facing distinct risks from natural disasters. Existing research often examines how sovereign debt was structured to mitigate risk, using mechanisms such as collateral arrangements during the gold standard era or trustee status under the Colonial Stock Act (Maerean et al. Reference MAEREAN, PEDERSEN and SHARP2021; Accominotti et al. Reference ACCOMINOTTI, FLANDREAU and REZZIK2011). This article builds on this foundation by examining how US involvement in Caribbean bond markets provided an implicit assurance, where US-appointed officials oversaw customs revenues. This structure not only decreased perceived risk but also influenced bond yields, particularly when these economies faced external shocks like hurricanes. In doing so, this study provides a deeper understanding of how geopolitical oversight structures interacted with environmental vulnerabilities in shaping sovereign debt risk premiums in the region.
Additionally, where sovereign debt literature often focuses on general financial shocks, such as wars or economic crises, this article expands the scope by examining environmental shocks – specifically hurricanes – and their impact on bond markets (Kaminsky Reference KAMINSKY2009; Ventura and Voth Reference VENTURA and VOTH2015). Methodologically, the study introduces a hurricane destruction index, aligned with approaches in climate-economic history research (Strobl Reference STROBL2012). This index provides a nuanced proxy for assessing hurricane damage, allowing for an examination of how these shocks influenced bond market dynamics and investor behavior, revealing the unique risk profiles and resilience mechanisms within early twentieth-century Caribbean bond markets. In contrast to studies such as Auh et al. (Reference AUH, CHOI, DERYUGINA and PARK2022), which found that natural disasters reduced returns on uninsured municipal bonds in the United States, this study shows that hurricanes in the Caribbean heightened investor demand for risk premiums, more closely aligned with findings in regions where sovereign defaults are more probable. Furthermore, this study diverges from the findings of NguyenHuu (Reference NGUYENHUU2022), who observed no significant impact of natural disasters on stock returns in advanced economies, demonstrating that in early twentieth-century Caribbean markets, hurricanes substantially increased bond yields. This distinction underscores the particular vulnerability of Caribbean sovereign debt to environmental shocks, as well as the resilience mechanisms investors employed by demanding higher premiums to offset perceived risks.
In summary, this article contributes to the sovereign bond literature by exploring the intersection of environmental risks with institutional finance structures and geopolitical conditions unique to the Caribbean. By offering a rare view into early twentieth-century financial markets in a high-risk, high-intervention region, this study enriches our understanding of how sovereign bond dynamics responded to environmental shocks under an implicit foreign guarantee. These findings underscore the importance of incorporating environmental risks into broader discussions of sovereign debt and investor behavior.
The article is organized as follows: Section II explores the historical issuance of sovereign bonds and the economic backdrop of the Caribbean countries under study. Sections III and IV outline the data sources and methodology applied in my analysis. In Section V presents the empirical results, explaining the impact of hurricane strikes on sovereign bond returns and discusses the implications of the findings, situating them within the existing literature on sovereign debt and natural disasters. Finally, Section VI concludes the article.
II
This section begins with a concise overview of the significant historical events in the Caribbean. These events will be described in greater detail in the following section.
At the turn of the twentieth century, the Caribbean economies of Cuba, the Dominican Republic and Haiti were profoundly shaped by both external interventions and their reliance on agricultural exports. In Cuba, US intervention following the Spanish–American War not only led to a military occupation (1899–1902) but also ushered in significant American investment in agriculture and infrastructure, making sugar – accounting for nearly 80 percent of exports – a central driver of the economy (Deere Reference DEERE1998; Harrison Reference HARRISON1974; McKercher and Enjamio Reference MCKERCHER and ENJAMIO2007; Bulmer-Thomas Reference BULMER-THOMAS2003). This reliance, however, also created vulnerabilities, as illustrated by the severe downturn following the 1920 sugar price collapse, despite rapid population growth spurred by European immigration and public health reforms (Dye Reference DYE1993; McLeod Reference MCLEOD1998; Hollerbach et al. Reference HOLLERBACH, DAZ-BRIQUETS and HILL1984; Díaz-Briquets Reference DAZ-BRIQUETS1981; Sánchez-Alonso Reference SÁNCHEZ-ALONSO2019).
Similarly, the Dominican Republic’s economic stability hinged on its agrarian base, particularly sugar production financed by US capital and Cuban expertise. The country experienced significant political volatility – with over 50 presidential turnovers by 1930 – which, combined with external market fluctuations, rendered its economy sensitive to changes in trade policies. US intervention was also evident: to secure debt repayment, the US assumed control over the Dominican Republic’s customs houses in 1905, and later occupied the country from 1916 to 1924 to enforce fiscal stability (Lundahl and Vedovato Reference LUNDAHL and VEDOVATO1989; Martínez Reference MAEREAN, PEDERSEN and SHARP1999; McPherson Reference MCPHERSON2013; Frankema and Masé Reference FRANKEMA and MASÉ2014; Shaffer Reference SHAFFER2022).
In Haiti, a postcolonial legacy of substantial foreign-imposed debt and subsequent US occupation (1915–34) laid the groundwork for a fragile economy. While initially burdened by a debt that constrained growth, Haiti’s economy remained heavily dependent on coffee exports – which made up around 80 percent of its exports from 1905 to 1930 – and later on sugar production under US influence (Bulmer-Thomas Reference BULMER-THOMAS2003; Phillips Reference PHILLIPS2008; Frankema and Masé Reference FRANKEMA and MASÉ2014; Henochsberg Reference HENOCHSBERG2016; Abad and Maurer Reference ABAD and MAURER2021; Palsson Reference PALSSON2021, Reference PALSSON2023; Shaffer Reference SHAFFER2022). The overreliance on a few primary commodities, along with dependence on trade taxes for government revenues, left Haiti particularly vulnerable to external shocks and price fluctuations.
Collectively, these cases illustrate how US economic and political intervention, coupled with a heavy reliance on agricultural exports, defined the early twentieth-century economic landscape in the Caribbean. While each country faced its own set of challenges – from Cuba’s boom-and-bust cycle and political unrest to the Dominican Republic’s volatile leadership and Haiti’s postcolonial debt burden – the common thread was an economy deeply integrated into global markets yet susceptible to external shocks and domestic vulnerabilities.
The issuance of sovereign bonds has historically played a pivotal role in enabling governments to fund expenditures, particularly in times of crisis. Between 1692 and 1815, Britain’s national debt surged as it financed overseas wars, marking the early integration of sovereign debt markets (Ventura and Voth Reference VENTURA and VOTH2015). Initially, Amsterdam served as the central hub for sovereign debt issuance during the eighteenth century, but following the French wars, London emerged as the primary financial center, indicating the start of a globally integrated sovereign debt market (Flandreau and Flores Reference FLANDREAU and FLORES2009). By the late nineteenth century, the bond issuance process for foreign governments in London was well established. Governments in need of financing would commission agents to connect with banks, which, along with stockbrokers and underwriters, would promote the bond issuance through prospectuses to attract investors (Gardner Reference GARDNER2017). During the classical gold standard era, sovereigns often employed collateral to secure loans, which lowered borrowing costs and reassured creditors of payment security (Maerean et al. Reference MAEREAN, PEDERSEN and SHARP2021).
British colonies benefited particularly from these arrangements. The Colonial Stock Act of 1900 granted trustee status to colonial bonds, making them more appealing to investors and lowering interest rates for these regions. This financial advantage, however, was contrasted by the practical limitations of many colonial economies, which struggled with constrained resources to support economic and infrastructure development (Jessop Reference JESSOP1976; Accominotti et al. Reference ACCOMINOTTI, FLANDREAU and REZZIK2011).The close financial ties between colonies and Britain reflected a system where the stability of colonial bonds was bolstered by their association with the British government (Gardner Reference GARDNER2017). In the early twentieth century, the Roosevelt Corollary to the Monroe Doctrine reinforced US involvement in the financial stability of the Caribbean. Investors viewed this as an assurance against default risk, leading to favorable bond market conditions in the region, particularly in 1904 and 1905 (Mitchener and Weidenmier Reference MITCHENER and WEIDENMIER2005). This intervention underscored the intersection of geopolitical strategies with financial markets, as US involvement was seen as a stabilizing force for bond investors (Mitchener and Weidenmier Reference MITCHENER and WEIDENMIER2005).
The onset of World War I profoundly disrupted global capital flows. Fearing the economic uncertainty of impending conflict, investors liquidated foreign assets, triggering a liquidity crisis across major financial centers (Jacobson and Tallman Reference JACOBSON and TALLMAN2015). While central banks in the United Kingdom, United States and continental Europe managed to stabilize markets temporarily, the war ultimately brought a halt to international capital flows (Kaminsky Reference KAMINSKY2009). Despite these shocks, many Latin American countries avoided default, leveraging export surpluses generated from rising demand for raw materials (Marichal Reference MARICHAL2000). Notably, Latin America became a net capital exporter during the war as increased commodity prices buoyed the region’s economies (Marichal Reference MARICHAL2000; Kaminsky Reference KAMINSKY2009). However, post-war economic recovery proved fragile. By the early 1920s, efforts to combat inflation in the US and UK inadvertently triggered banking and currency crises worldwide. Commodity prices collapsed, hitting Latin American economies that were heavily dependent on exports (Grilli and Yang Reference GRILLI and YANG1988; Kaminsky Reference KAMINSKY2009). The subsequent Great Depression exacerbated these challenges, with the depreciation of the US dollar and British pound significantly increasing the debt service costs for countries holding foreign-denominated debt (Alejandro Reference ALEJANDRO, Frieden, Pastor and Tomz2018). For Latin American nations, the debt-to-export ratio climbed from 1.5 in 1929 to 2.3 in 1935, as declining export revenues heightened the debt burden (Alejandro Reference ALEJANDRO, Frieden, Pastor and Tomz2018). Among these financial strains, most Latin American countries entered debt restructuring negotiations in 1931 to ease repayment schedules and avoid default. However, the Dominican Republic and Haiti distinguished themselves as the only nations in Latin America and the Caribbean to maintain debt payments during this period, highlighting their unique fiscal resilience in the face of global economic hardship (Gerchunoff and Machinea Reference GERCHUNOFF and MACHINEA2015).
The Cuban and Dominican sovereign bond issuances of the early twentieth century illustrate the strategic use of debt financing for economic stabilization, public works and the consolidation of fiscal policies under US influence. In 1904, Cuba issued $35 million in 5 percent external gold bonds with the purpose of repaying its debt to the United States, as authorized by Cuban Congress (Liverpool Daily Post, 1904). These bonds were exempt from Cuban taxes and denominated in US gold, reinforcing their appeal to foreign investors. The Cuban government pledged its customs revenues to guarantee the repayment of bonds, a practice that became standard for subsequent bonds issued (Evening Irish Times, 1910).
In the Dominican Republic, the 1907 Dominican–American Convention established a customs receivership to stabilize the country’s finances. This arrangement led to the issuance of $20 million in 50-year 5 percent bonds, with interest payments and debt amortization funded by customs revenues collected by an American-appointed General Receiver (Evening Mail, 1907). These bonds effectively positioned the United States as the financial watchdog of the Dominican Republic, ensuring regular debt service and reducing the risk of default. Further adjustments under the 1907 convention provided legal guarantees for creditors and prevented the Dominican Republic from increasing its public debt or altering its customs duties without US consent (African Times and Orient Review, 1913).
In 1922, both countries issued new bonds under continued US oversight. The Dominican Republic issued $6.7 million of a planned $10 million in 20-year 5.5 percent Customs Administration Sinking Fund Gold Bonds to fund public works and manage existing debts. These bonds were secured by a first lien on customs revenues and were exempt from Dominican taxes, with an additional US commitment that customs revenues would continue to be administered by an official appointed by the US president should the original convention expire.Footnote 1 In Haiti, a similar $40 million loan authorized in 1922 aimed to stabilize the economy, with the first $16 million instalment designated for infrastructure and debt repayment. The loan administration involved close cooperation with a US-appointed financial adviser, ensuring alignment with US fiscal policies.Footnote 2 By 1930, Cuba issued a significant $50 million in 5.5 percent bonds to finance public infrastructure projects, with $40 million placed in bonds maturing in 1945. Secured by an extensive pledge of customs revenues and US guarantees, this issuance underscored Cuba’s reliance on US-backed financing and marked a continuation of its strategy to secure external funds for economic modernisation (Daily Record, 1930).
Together, these bond issuances represent a period in which Cuba, the Dominican Republic and Haiti heavily relied on US-secured debt financing. By pledging customs revenues and aligning with US financial structures, these countries could access capital markets despite political and economic vulnerabilities, illustrating the extensive influence of US economic policy in the Caribbean during this period.
The annual return ( $Return$) for each bond, plotted on the vertical axes of Figure 1, is computed using the following formula:
 \begin{equation*}Return\; = \;\left( {\frac{{ACP\; + \;\frac{{100 - price}}{{YTM}}}}{{price}}} \right) \times 100,\end{equation*}
Returns of bonds by country and storm events
Panels (a), (b) and (c) correspond to Cuba, Dominican Republic and Haiti, respectively. Hurricanes affecting the respective islands are indicated with a dashed line.

where  $ACP$ represents the annual coupon payment of the bond, $price$ is the monthly opening price of the bond (scaled to a face value of 100), and $YTM$ denotes the number of years to maturity, calculated as the difference between the bond’s final redemption year and the current year. The term $ACP/price$ captures the coupon yield relative to the bond’s market price. The component $(100 - price)/YTM$ spreads the capital gain (assuming redemption at par value) over the remaining years to maturity, thereby accounting for the annualized capital gain or loss. By dividing the sum of these components by $price$ and multiplying by 100, the formula expresses the return as a percentage. Although this approach is a simplified approximation relative to an exact yield-to-maturity calculation, it provides a transparent method for estimating bond returns using historical data where precise coupon payment schedules or day counts may be incomplete.
The temporal distribution of the individual bond returns is illustrated in Figure 1. In general, the average returns of the bonds between 1906 and 1915 were between 4 and 5 percent and increased dramatically during World War I, with some bonds exhibiting returns of more than 6 percent. In 1920, the spread of returns increased before decreasing again in 1922 and 1923, during which the returns remained between 5 and 6.5 percent. At the end of the observed period, when the Great Depression began, the returns rose again. All bonds were traded in New York; however, two Cuban bonds were also traded on the London Stock Exchange (in US$), namely the 4.5 percent Gold Ext. 1909 and the 5 percent Gold Ext. 1904 bond. Moreover, the average amount issued was USD 14.91 million. Wind speeds exceeding 119 km/h were also recorded.
Figure 1 presents the historical returns for selected bonds issued by Cuba, the Dominican Republic and Haiti. The figure is divided into three panels. Panel (a), which corresponds to Cuba, shows the returns on multiple Cuban bonds from approximately 1909 through the 1930s. Each colored line corresponds to a different bond, and the dashed vertical lines indicate the timing of hurricanes (or tropical storms) with wind speeds above 119km/h. A few notable observations stand out. First, the returns are relatively stable in the earlier part of the sample (around 1909–15), hovering in the 4–6 percent range. Second, occasional spikes or dips in returns can be observed around the dashed lines. For instance, a downward dip occurs just before or around certain storm years (e.g. in the early 1920s), suggesting that major storms could have affected investors’ perception of sovereign or quasi-sovereign risk. Finally, as the sample moves into the late 1920s and early 1930s, the returns fluctuate more significantly, which may reflect broader global economic stresses, including the aftermath of the Great Depression.
Panel (b) corresponds to the Dominican Republic. The bonds from this country exhibit a slightly different pattern. In the early 1920s, the returns begin around 5 percent but gradually rise above 8 percent by the late 1920s or early 1930s for some bond issues. The dashed lines again mark hurricane events. Although not every storm correlates with a dramatic shift in returns, certain hurricanes appear to coincide with abrupt changes in bond yields, potentially signaling increased sovereign risk premiums or disruptions in customs revenue, a crucial repayment source for many historical bonds. It is also noteworthy that the Dominican Republic experienced foreign financial oversight and interventions during portions of this sample period, which may partly explain why some of the bonds maintained relatively high yields. Political and institutional developments, combined with natural disasters, are likely to have been intertwined in shaping the yield trajectory.
Panel (c) represents Haiti. Haiti’s bond returns show a narrower set of bonds but still exhibit discernible movements across the 1920s and 1930s. The overall trend starts from around 7 percent in the early 1920s, dips toward 6–6.5 percent in the mid 1920s, and then recovers above 7 percent by the early 1930s. Dashed lines in the late 1920s correspond to hurricanes that may have contributed to short-term yield fluctuations. Haiti’s pattern appears somewhat less volatile than the Dominican Republic’s in the 1920s, possibly reflecting fewer large bond issues or a more limited secondary market. However, by the early 1930s, increased volatility in returns suggests that global financial pressures were influencing even smaller markets. Overall, the three panels underscore the interplay of economic, political and environmental factors in shaping historical sovereign bond returns. Although the dashed lines alone cannot establish causality between storm events and bond returns, they offer a visual correlation indicating that major natural disasters often coincide with noticeable yield volatility. A more formal econometric analysis would be needed to disentangle these effects from broader macroeconomic shocks, such as the Great Depression or changing political conditions in each country.
The information on the bonds discussed in the following paragraphs is also summarized in Table 1. Between 1904 and the early 1930s, Cuba, the Dominican Republic and Haiti issued several bonds and loans to manage external and internal debt obligations while navigating complex political and economic challenges. In Cuba, the 1904 external 5 percent Gold Loan was issued for $35 million to settle liabilities incurred during the War of Independence (Thomasville Times-Enterprise and South Georgia Progress, 1904). This issue carried a fixed 5 percent coupon payable in gold with semiannual interest payments (Foreign Claims Settlement Commission of the United States (FCSC) 1968). The entire principal was scheduled for a bullet repayment at maturity after 40 years, with no annual sinking fund mandated in the original legislation. However, during the Great Depression (1934–5), sinking fund contributions were temporarily suspended, though the bonds were ultimately redeemed at par (FCSC Reference FLANDREAU, FLORES, GAILLARD and NIETO-PARRA1968). These bonds were secured by Cuban customs revenues, which provided an additional layer of security for investors. US oversight under the Platt Amendment ensured that Cuba did not overextend its debt burden, functioning as an informal backstop and reinforcing investor confidence (Thorndike Reference THORNDIKE2021). Also in 1904, Cuba issued domestic 5 percent Gold Bonds amounting to approximately $7.96 million. Unlike the external issue, these bonds were designed to refinance outstanding revolutionary bonds held by veterans of the 1895–8 war of independence. They did not have a fixed maturity date; rather, they were redeemable through annual drawings facilitated by a structured sinking fund. These securities were backed solely by the full faith and credit of the Cuban government and did not feature an explicit US guarantee, though they contributed to the nation’s broader debt restructuring strategy (Lynch Reference LYNCH1951). In 1909, Cuba expanded its borrowing program with the issuance of a 4.5 percent Gold Loan totaling $16.5 million, distributed in three tranches over several issues (September 1909, February 1910 and February 1911). This bond carried a fixed coupon of 4.5 percent, had a 40-year maturity expiring in 1949 and was issued at prices between 96 and 99 percent of par, reflecting robust investor demand. A sinking fund was set up with redemptions beginning in the early 1920s; however, as with earlier bonds, contributions were suspended during the Depression. The bond’s security rested on Cuban customs revenues and US fiscal oversight, which helped maintain market confidence despite temporary financial disruptions (Lynch Reference LYNCH1951; United Nations, Department of Economic and Social Affairs 1955; FCSC Reference FLANDREAU, FLORES, GAILLARD and NIETO-PARRA1968; Thorndike Reference THORNDIKE2021). Further borrowing in Cuba occurred in 1923 with the issuance of a 5.5 percent Gold Sinking Fund Loan for $50 million. Underwritten by a syndicate led by J. P. Morgan, this bond featured a 5.5 percent coupon and a mandatory sinking fund with scheduled redemptions intended to fully amortize the principal by 1953. Although the Depression forced a temporary suspension of sinking fund payments in 1934–5, Cuba eventually maintained full interest payments, and the loan was retired through subsequent refinancing in the late 1940s. This issuance, like earlier external bonds, was secured by the pledge of customs revenues and was indirectly supported by US oversight (Lynch Reference LYNCH1951; United Nations, Department of Economic and Social Affairs 1955; Thorndike Reference THORNDIKE2021). In 1930, as part of a broader $100 million infrastructure program, Cuba issued $10 million in 5.5 percent Public Works Bonds. These internal bonds, with a 15-year maturity expiring in 1945, were designed to finance projects such as highway construction, water infrastructure and educational facilities. Unlike previous issues that incorporated a public sinking fund, these bonds were issued directly to US contractors as payment and later restructured via a refunding mechanism when a financial crisis in 1931–3 led to a suspension of debt service on several internal obligations (Lynch Reference LYNCH1951; United Nations, Department of Economic and Social Affairs 1955).
Detailed summary of bond issues and US backstops (1904–30)

The Dominican Republic’s bond issues similarly reflected a blend of domestic financing needs and US-imposed fiscal discipline. In 1908, the government issued a 5 percent Customs Administration Loan for $20 million in gold bonds under a 1907 US–Dominican convention. These bonds carried a fixed 5 percent coupon and a long 50-year maturity (expiring in 1958). A sinking fund was established by channeling Dominican customs revenues to a US-appointed General Receiver, thus functioning as a de facto US guarantee that bolstered investor confidence. This arrangement helped stabilize the country’s finances until the onset of the Great Depression, after which the bonds were refinanced during US military occupation and fully retired by 1927 (Fraser Reference FRASER1951).Footnote 3 Under US military rule, the Dominican Republic issued a 5.5 percent Customs Administration Loan in 1922 for $6.7 million. This bond carried a 5.5 percent coupon with serial maturities originally set for 1942; however, a restructuring agreement in 1934 extended the final maturity to 1962. Sinking fund contributions were maintained until the economic turmoil of the 1930s forced a temporary suspension, and the bond was managed by a US fiscal agent who oversaw the collection and application of customs revenues (Fraser Reference FRASER1951).Footnote 4 In 1926, the Dominican Republic issued another 5.5 percent Customs Administration Loan totaling $20 million, divided into two series. The first series was used to retire outstanding balances of previous bonds (notably the 1908 and 1922 issues), while the second series financed new public works. Both series carried a 5.5 percent coupon, but they featured staggered maturities (one series due in 1940 and the other in 1942). Following a 1934 restructuring, the final maturity of the 1926 bonds was extended to 1970, and US fiscal receivership under the extended 1907 convention continued to support the bonds until political changes eventually led to their retirement or refunding by the end of World War II (Fraser Reference FRASER1951).
In Haiti, the 1922 issuance of a 6 percent Sinking Fund Gold Loan for $16 million marked a significant transition in its debt management strategy.Footnote 5 This bond was part of a larger authorized bond program of up to $40 million and was designed to refinance external debt, including obligations from the nineteenth-century indemnity payments to France.Footnote 6 The loan carried a fixed 6 percent coupon with a 30-year maturity, expiring in 1952. To ensure gradual principal repayment, a sinking fund was established, allowing redemptions via annual drawings or open-market purchases.Footnote 7 Although formally issued as an obligation of the Haitian government, the bond effectively carried a US guarantee under the 1915 US–Haiti treaty. Under this arrangement, an American financial adviser was granted control over Haiti’s treasury and customs collections (United States Senate Reference United States Senate1925). At least 40 percent of customs revenues were mandated for debt service, ensuring that investors received regular interest and principal payments (Krenn Reference KRENN2013). This explicit financial oversight represented a significant shift from the more informal US arrangements in Cuba and the Dominican Republic, effectively transferring Haiti’s creditor base from European lenders to American institutions.Footnote 8
Hurricanes were a defining feature of the Caribbean landscape in the early twentieth century, shaping not only the physical and economic environment of countries such as Cuba, Haiti and the Dominican Republic, but also the way international markets perceived risk in the region. These storms caused enormous structural and agricultural damage, highlighting the challenges of economic stability and resilience in a region fundamentally exposed to extreme natural events. In Cuba, the 1910 hurricane was an early example of large-scale destruction. The storm caused widespread flooding in Havana, devastating buildings and infrastructure and causing an estimated US$10 million in damages (The Advertiser, 1910; Pielke Jr et al. Reference PIELKE, RUBIERA, FERNÁNDEZ, L. and KLEIN2003). The economic impact extended beyond Cuba’s borders, as the hurricane also hit Haiti and the Dominican Republic, underscoring the interconnectedness of these economies and their shared vulnerability to such powerful storms (Lancaster New Era, 1910). While Cuba suffered relatively minor economic losses during the Galveston hurricane of 1915, due to its impact on less populated areas, the hurricane destroyed almost all of the infrastructure in western Cuba, highlighting the vulnerability of rural areas to hurricanes. The destruction of homes and other structures, despite limited direct economic losses, illustrated the precarious balance of rural resilience in Cuba, a region that played a critical role in agricultural exports (Frankenfield Reference FRANKENFIELD1915; Pielke Jr et al. Reference PIELKE, RUBIERA, FERNÁNDEZ, L. and KLEIN2003).
The hurricane of 1924 highlighted the direct economic risks to agricultural production. This hurricane, which severely damaged the tobacco crop in western Cuba and caused widespread agricultural losses in the southwestern region of Haiti, demonstrated how hurricanes could undermine the foundations of export economies and threaten food security (Frankenfield Reference FRANKENFIELD1915; Day Reference DAY1924; Mitchell Reference MITCHELL1924). The estimated US$ 5 million damage in Cuba, combined with the losses in Haiti, served as a reminder that agricultural and economic stability is directly linked to storm patterns across the Caribbean (Day Reference DAY1924; Mitchell Reference MITCHELL1924; Pielke Jr et al. Reference PALSSON2003). Among the most severe was the 1926 Havana–Bermuda hurricane, which had catastrophic social and economic costs. With losses estimated at US$100 million and 600 deaths, the hurricane left around 100,000 people homeless and destroyed over 25,000 buildings, illustrating the extensive devastation that hurricanes can cause to infrastructure and communities (New York Times, 1926; Pielke Jr et al. Reference PIELKE, RUBIERA, FERNÁNDEZ, L. and KLEIN2003). The 1928 hurricane, which led the Haitian government to appeal for international aid to prevent the starvation of 100,000 of its citizens, demonstrated the extent to which hurricanes could cause not only economic losses but also humanitarian crises in countries dependent on single-crop agriculture (Mitchell Reference MITCHELL1928; Weightman Reference WEIGHTMAN1928; New York Times, 1928). The 1930 San Zenon hurricane, one of the deadliest in the region’s history, killed more than 4,500 people, nearly wiped out the Dominican Republic’s capital, Santo Domingo, and left the country struggling with severe economic and social aftershocks (New York Times, 1930; Pielke Jr et al. Reference PIELKE, RUBIERA, FERNÁNDEZ, L. and KLEIN2003).
In order to estimate the impact of hurricane strikes on bond return, I employ a model to estimate the potential destruction of hurricanes per country. In order to obtain the potential destruction, I use the National Hurricane Center’s North Atlantic Hurricane database (HURDAT) which includes the best tracks of all known tropical storms from 1855 onwards. The data base contains the six-hourly position of the storm eye as well as the maximum wind speed. To get more accurate results, I interpolate the storm tracks to obtain two-hourly positions. In the next step, I apply a wind field model in the manner of Strobl (Reference STROBL2012), initially developed by Boose et al. (Reference BOOSE, SERRANO and FOSTER2004), which is based on the equation for cyclostrophic wind and sustained wind speed developed by Holland (Reference HOLLAND1980).Footnote 9 This wind field model provides me with the estimated wind speed at any given location, based on important factors such as movement speed and direction, peak wind speed and landfall occurrence. However, I further use the estimated wind speeds together with population weights to determine potential destruction caused by hurricanes. To do so, I also rely on the methodology of Strobl (Reference STROBL2012). The main reason for choosing potential destruction instead of wind speed lies in the fact that a hurricane with a certain wind speed would cause greater destruction in a densely populated area compared to an area with low population density. For this reason, I use population statistics from the History Database of the Global Environment (HYDE 3.2) (Klein Goldewijk et al. Reference KLEIN GOLDEWIJK, BEUSEN, DOELMAN and STEHFEST2017). Therefore, for every country I use the population approximations from HYDE 3.2 on a grid of 0.083 x 0.083 degrees, which is a grid cell of roughly 9.5  $ \times $ 9.5km. In order to avoid endoeneity issues, I use 1840 population data which pre-dates the analyzed storms. In the next step, I estimate the wind speed in every grid cellFootnote 10 and weigh it in accordance with Strobl (Reference STROBL2012), according to its population. As I use decadal population data pre-dating the storms, there are no endogeneity issues with respect to migration. The wind speed at every grid cell is estimated in accordance with Strobl (Reference STROBL2012):
 \begin{equation}\begin{array}{*{20}{l}}
{V = GF[{V_m} - S(1 - sin(T))\frac{{{V_h}}}{2}] \times {{[(\frac{{{R_m}}}{R}{)^B}exp(1 - {{(\frac{{{R_m}}}{R})}^B})]}^{\frac{1}{2}}}}
\end{array}\end{equation}
\begin{equation}\begin{array}{*{20}{l}}
{V = GF[{V_m} - S(1 - sin(T))\frac{{{V_h}}}{2}] \times {{[(\frac{{{R_m}}}{R}{)^B}exp(1 - {{(\frac{{{R_m}}}{R})}^B})]}^{\frac{1}{2}}}}
\end{array}\end{equation}  ${V_m}$ is the maximum sustained wind speed found anywhere within the hurricane, while $T$ represents the angle formed by the forward path of the hurricane and a radial line drawn from the hurricane centre to the point of interest, $P$ (see Strobl Reference STROBL2012). ${V_h}$ is the forward speed of the hurricane, ${R_m}$ is the radius of maximum winds, whereas the radial distance from the centre of the hurricane to the point $P$ is denoted by $R$ (for more details see Strobl Reference STROBL2012) In the second step, I calculate the population-weighted destruction index $DEST{R_{j,t}}$ based on the previously estimated wind speed ${v_{j,t}}$ in grid cell $j$ at time $t$:
$t$:
 \begin{equation}
{DEST{R_{j,t}} = \left( {\sum \limits_{j = 1}^J \smallint \limits_0^\tau v_{j,t}^\lambda {w_{i,j,r,t}}dr} \right){\text{if}}\,{{\text{v}}_{{\text{j,t}}}}\,\, \gt { \text{63km/h}}} \\
{{\text{and}}\,\,{\text{0}}\,{\text{otherwise}}}
\end{equation}
\begin{equation}
{DEST{R_{j,t}} = \left( {\sum \limits_{j = 1}^J \smallint \limits_0^\tau v_{j,t}^\lambda {w_{i,j,r,t}}dr} \right){\text{if}}\,{{\text{v}}_{{\text{j,t}}}}\,\, \gt { \text{63km/h}}} \\
{{\text{and}}\,\,{\text{0}}\,{\text{otherwise}}}
\end{equation} Hence, the estimated total destruction in a given grid cell, caused during the lifetime  $\tau $ of a storm $r$, has to be aggregated to receive the maximum destruction sustained in a given country. For this reason, I use the maximum $DESTR$ caused to a grid cell by a storm as a proxy for the destructionFootnote 11 caused to the country. Importantly, only tropical storms (wind speed $ \gt 63\,{\textrm{km/h}}$) are included in the analysis.
The potential destruction index of the underlying storms is depicted in Figure 2. The vertical axis measures a population-weighted destruction index, capturing the intensity of each storm in relation to the affected population. The horizontal axis indicates the year of occurrence, while different colors distinguish among the countries in our sample (Cuba, the Dominican Republic and Haiti). Overall, the figure provides a clear visualization of how the severity and frequency of major hurricanes evolved during the period under study, and will serve as the basis for subsequent empirical analysis.
Hurricane timeline with historical events, 1905–30
This figure shows the potential destruction of the underlying hurricanes as well as key historical moments. (a) In 1898, the Spanish–American War marked a turning point in the Caribbean, leading to US expansion, the annexation of Puerto Rico and Cuba and increased control over the Panama Isthmus (Mitchener and Weidenmier Reference MITCHENER and WEIDENMIER2005). (b) In 1900, the Colonial Stock Act enhanced the attractiveness of colonial bonds to investors, facilitating lower borrowing costs in the Caribbean (Jessop Reference JESSOP1976). (c) The Roosevelt Corollary, introduced between 1904 and 1905, boosted the bond market due to US involvement in resolving debt disputes in the region (Mitchener and Weidenmier Reference MITCHENER and WEIDENMIER2005). (d) In 1910, a major hurricane struck Cuba, causing damages estimated at 10 million US dollars and also affecting Haiti and the Dominican Republic (Pielke et al. Reference PALSSON2003). (e) Between 1915 and 1934, the US occupation of Haiti led to significant economic changes, including a transition to large-scale sugar plantations (Phillips Reference PHILLIPS2008). (f) From 1916 to 1924, the US occupation of the Dominican Republic aimed to control finances and enforce debt payments but was met with vast resistance (Shaffer Reference SHAFFER2022; McPherson Reference MCPHERSON2013). (g) In 1920, a crash in sugar prices caused an economic crisis in the Caribbean, triggering significant demographic shifts and changes in immigration patterns (McLeod Reference MCLEOD1998). (h) The Great Depression of 1929 severely impacted the Caribbean, as the steep depreciation of the US dollar and the British pound inflated the real cost of servicing foreign-denominated debts (McLeod Reference MCLEOD1998; Ward and Devereux Reference WARD and DEVEREUX2012).

III
This article analyzes the relationship between sovereign bond returns and the economic consequences of natural disasters, focusing on the impact of hurricane events within the Caribbean basin. The analysis is based on a curated dataset of historical bond data and a proxy for destruction caused by hurricanes.
Using historical bond data enables us to track the development of investor sentiment and market mechanisms in response to environmental shocks. This offers insights into the adaptive strategies employed by financial markets in the face of uncertainty. The underlying bond data come from Meyer et al. (Reference MEYER, REINHART and TREBESCH2022a,Reference MEYER, REINHART and TREBESCHb). For data preceding 1870, Meyer et al. (Reference MEYER, REINHART and TREBESCH2022b) obtained information from a selection of periodicals, including the Money Market Review and The Economist, among others. For the subsequent period stretching from 1870 to 1930, the data from Meyer et al. (Reference MEYER, REINHART and TREBESCH2022b) notably benefit from the digitalized bond pricing data available in the British Investor Monthly Manual. Meyer et al. (Reference MEYER, REINHART and TREBESCH2022b) further enrich this data set by incorporating detailed data on bond defaults, including instances of missed or partial payments of coupons and principals, as well as the terms of bond restructuring Meyer et al. (Reference MEYER, REINHART and TREBESCH2022b). From the bond data, I used all individual sovereign bonds from Caribbean countries, which were Cuba, the Dominican Republic and Haiti. In addition, I utilized the monthly opening price of the bond to calculate the return. Moreover, as there were many months without trading in the period before 1905 and often bonds issued by only one of the three countries, I used data from 1905 onwards. In addition, I included only the years up to 1930 for several reasons. First, the Great Depression caused several governments, such as Cuba, to default (Bordo and Rockoff Reference BORDO and ROCKOFF1996). Given the significant financial turmoil after 1929, which drastically increased the real cost of servicing foreign-denominated debt and led to widespread renegotiations and restructuring across Latin America (Alejandro Reference ALEJANDRO, Frieden, Pastor and Tomz2018), my analysis excludes data after 1930. This cutoff ensures clarity and consistency in evaluating bond returns prior to the economic distortions introduced by the Great Depression’s global impact, specifically observed in the varying responses to debt management of countries like Cuba, the Dominican Republic and Haiti (Alejandro Reference ALEJANDRO, Frieden, Pastor and Tomz2018). Second, as the UK left the gold standard in 1931, this also indirectly impacted on bond returns (Bordo and Rockoff Reference BORDO and ROCKOFF1996).
IV
As natural disasters destroy infrastructure and capital, governments must spend large amounts of money on reconstruction and disaster relief (Ouattara and Strobl Reference OUATTARA and STROBL2013). Recent research also shows that after disasters, tax revenues fall (Mohan and Strobl Reference MOHAN and STROBL2021), which leads to increased public debt (Mohan and Strobl Reference MOHAN, SPENCER and STROBL2021) and therefore to increased risks of budget deficits (Ouattara et al. Reference OUATTARA, STROBL, VERMEIREN and YEARWOOD2018). Therefore, hurricanes increase the default risk of the affected entity. Since hurricanes increase the risk of default, a higher risk premium must be paid for the asset (Sharpe Reference SHARPE1964; Bekaert and Wang Reference BEKAERT and WANG2010), which would result in a higher return on the asset.
In order to estimate the impact of hurricane strikes on bond returns, I use the following fixed-effects regression: the econometric model for assessing the impact of hurricanes on bond returns is specified as follows:
 \begin{align}
{{\text{LOG(Retur}}{{\text{n}}_{i,t}}) = }\,\,{{\beta _0} + {\beta _1}{\text{LOG(Retur}}{{\text{n}}_{i,t - 1}}) + {\beta _2}DEST{R_{t + 1m}} + {\beta _3}DEST{R_t}}\\\nonumber
\qquad+ {\beta _4}DEST{R_{t - 1m}}
{}{ + {\beta _5}DEST{R_{t - 2m}} + {\mu _i} + {\gamma _t} + {\alpha _m} + {\delta _{t,m}} + {\phi _c} + {\varepsilon _{i,t}}}
\end{align}
\begin{align}
{{\text{LOG(Retur}}{{\text{n}}_{i,t}}) = }\,\,{{\beta _0} + {\beta _1}{\text{LOG(Retur}}{{\text{n}}_{i,t - 1}}) + {\beta _2}DEST{R_{t + 1m}} + {\beta _3}DEST{R_t}}\\\nonumber
\qquad+ {\beta _4}DEST{R_{t - 1m}}
{}{ + {\beta _5}DEST{R_{t - 2m}} + {\mu _i} + {\gamma _t} + {\alpha _m} + {\delta _{t,m}} + {\phi _c} + {\varepsilon _{i,t}}}
\end{align} where  $Retur{n_{i,t}}$ is the bond return for bond $i$ at time $t$,
$t$,  ${\text{LOG(Retur}}{{\text{n}}_{i,t - 1}}$) represents the logarithm of the Return in the previous period, which controls indirectly for the years to maturity of the bond. $DEST{R_t}$, $DEST{R_{t - 1m}}$, $DEST{R_{t + 1m}}$, and $DEST{R_{t - 2m}}$ represent the potential destruction caused by hurricanes at time $t$, one month before $t + 1m$, one month after $t - 1m$, and two months after $t - 2m$, respectively. ${\mu _i}$ is the bond fixed effect, capturing unobserved heterogeneity across bonds, ${\gamma _t}$ are time fixed effect, capturing common shocks across all bonds as well as seasonal variation. ${\phi _{country}}$ are the country fixed effects, capturing country-specific unobserved factors and ${\varepsilon _{i,t}}$ is the error term. Moreover, I use robust error-terms.
The unpredictable nature of hurricanes, including their location and intensity, even shortly before landfall, underscores their random and exogenous characteristics (Willoughby et al. Reference WILLOUGHBY, RAPPAPORT and MARKS2007). When using the previous value of the return, the residuals I am working with capture the variation in returns between two consecutive time periods, effectively controlling for temporal autocorrelation in bond returns. Additionally, employing country fixed effects removes time-invariant characteristics specific to each country, such as institutional factors or long-term economic conditions. By further incorporating time fixed effects, I control for shocks or trends that simultaneously impact all countries in the sample, such as global economic events or shifts in financial markets. As a result, the remaining residuals isolate variations that are unique to each country and each time period, capturing only those changes that cannot be attributed to the general time trends or stable country-specific factors. Hence, by incorporating time and entity fixed effects, I capture the random, unanticipated outcomes from the distribution of potential hurricane damages, enabling a causal analysis of their effects on returns. This approach aligns with the findings of Willoughby et al. (Reference WILLOUGHBY, RAPPAPORT and MARKS2007), Miranda et al. (Reference MIRANDA, ISHIZAWA and ZHANG2020), Civelek (Reference CIVELEK2023) and Elliott et al. (Reference ELLIOTT, STROBL and TVEIT2023) highlighting the feasibility of establishing causality due to the inherent unpredictability of hurricane events. It is important to consider that including additional variables, especially those that might be influenced by hurricanes, would be classified as ‘bad regressors’ (Angrist and Pischke Reference ANGRIST and PISCHKE2009; Brei et al. Reference BREI, MOHAN, P. and STROBL2024). For this reason, I have limited the set of controls to fixed effects and the value of Return (log) in the previous period.
V
Summary statistics are provided in Table 2. In the underlying data set there are a total of 12 sovereign bonds, 7 from Cuba, 4 from the Dominican Republic and one from Haiti. The average return was 5.47 percent with a standard deviation of 0.81 percent.
Summary statistics

Notes: Bonds refers to the total number of bonds issued by the three countries, while Amount indicates the total issuance amount (in USD). Return represents the average return (in %), and Coupon refers to the coupon rate (in %). Tropical storms indicates the number of tropical storms during the observed period. Cat. 1 hurricanes, Cat. 2 hurricanes and Cat. 3 hurricanes denote the number of hurricanes of each category. Cuba: TS & cat. 1–3 hurricanes, Dominican Republic: TS & cat. 1–3 hurricanes and Haiti: TS & cat. 1–3 hurricanes indicate the combined number of tropical storms and hurricanes for each country. WIND cat. 1–3 hurricanes represents the estimated wind speeds (in km/h) for category 1, 2 and 3 hurricane strikes.
Table 2 also shows that there were nine category 1–3 hurricanesFootnote 12 affecting at least one country. The average wind speed was 156.1km/h with a maximum of 221.6km/h. Six of the hurricanes and tropical stormsFootnote 13 struck Cuba, only two hit the Dominican Republic and one Haiti. This is unsurprising, as Cuba is twice the width of Hispaniola, the island which is divided into the Dominican Republic and Haiti, increasing the probability of a strike. Figure 3 shows the spatial distribution of the storms, as well as their maximum wind speed (in km/h). As mentioned before, most of the storms made landfall in Cuba and left the Dominican Republic and Haiti unaffected.
Spatial distribution of the hurricanes

This section presents the empirical findings of the study on the impact of hurricane strikes on the returns of sovereign bonds issued by Cuba, the Dominican Republic and Haiti from 1905 to 1930. The analysis employs a fixed-effects regression model to isolate the effect of hurricane-induced destruction on bond returns, accounting for other influencing factors and inherent characteristics of the bonds and issuing countries. The model incorporates a lag structure to capture the immediate and delayed effects of hurricanes on the dynamics of the bond market. The inclusion of fixed effects for bonds, countries and time allows for controlling for unobservable heterogeneity and common temporal shocks.
Table 3 shows that the impact of  $DEST{R_{t - 1m}}$ is roughly 0.45 and stable across the different specifications, indicating that hurricanes increase the returns of bonds. The results from column 4 are also illustrated in Figure 4. Hence, the figure indicates that hurricanes caused a temporary increase in the returns in $t - 1m$. Moreover, the average non-zero value of $DESTR$ increases $Returns$ by over 0.9 percent. Based on the average $Return$ (5.47 percent), this would result in an increase of almost 0.05 percentage points, which is a significant amount. Additionally, when considering the estimated destruction caused by the top 10 percent most destructive hurricanes, the results indicate that the $Return$ would increase by over 4.5 percent, which is almost 0.25 percentage points. Hence, the finding that bond returns increase in response to hurricanes suggests investors require a risk premium for holding sovereign debt exposed to these natural disasters. This risk premium reflects the anticipated costs of reconstruction and fiscal strain on the issuing countries.
Impact of hurricanes on returns

Effect of hurricanes on return (log)

*** Notes: Signification codes: 0.01, **: 0.05, *: 0.1. Year-, month- and bond-fixed effects are included in all specifications. Standard errors are clustered on bond-level.
Furthermore, Figure 5 illustrates the aggregated impact of hurricane strikes on bond returns (along with the corresponding 95 percent confidence interval) by increasing the risk premium. The empirical evidence presented in this graph supports the hypothesis that hurricanes acted as an initial shock to the bond markets, with a noticeable cumulative increase in returns observed over time. It can be observed that there is a pronounced increase in the returns on bonds immediately following the occurrence of the hurricane event (at t=0), which then stabilizes briefly and gradually increases in the following eight months. This suggests that the immediate market response to hurricanes is amplified in the subsequent months, likely due to the market’s reassessment of the increased risk associated with sovereign debt in hurricane-prone regions. This pattern serves to illustrate the significance of hurricanes as an exogenous shock that initially disrupts economic stability, followed by a gradual increase in bond returns as investors demand higher risk premiums to compensate for the perceived elevated risk of default and fiscal strain on the affected countries.
Aggregated impact of hurricanes on returns

In Table 4 I focused on category 2 hurricanes, i.e. where wind speeds exceed 154 km/h. The results from column 2 are similar to the ones in Table 3. However, the average category 2 hurricane increases returns by 3.45 percent.
Effect of hurricanes (cat. 2) on return (log)

*** Notes: Signification codes: 0.01, **: 0.05. Date- and bond-fixed effects are included in all specifications. Standard errors are clustered on bond-level in parentheses.
The analysis of the impacts of hurricane strikes on the returns of sovereign bonds issued by Cuba, the Dominican Republic and Haiti from 1905 to 1930 offers a novel perspective on how natural disasters affected financial markets, particularly in regions prone to natural disasters. The findings indicate that hurricanes significantly affect the returns on sovereign bonds of countries affected by hurricane strikes, with a significant increase in returns after a hurricane. This effect is attributed to the market’s perception of increased risk associated with the sovereign debt of countries vulnerable to natural disasters. Specifically, the results show that hurricanes, on average, lead to a 0.9 percent increase in bond returns. Hence, this amounts to an increase of 0.05 percentage points, given the average potential destruction. Put differently, the annual average return per bond increases by almost USD 7,500 from USD 815,600 to USD 823,000.Footnote 14 Furthermore, with average years to maturity of 27.16 years, the average hurricane-related return is estimated to be in excess of USD 101,000. This resulting variation in returns underscores investors’ demand for a higher risk premium due to the anticipated fiscal burden caused by increased relief payments and reconstruction costs after the disaster.
Instead of focusing on a population-weighted destruction index alone, I also incorporate an alternative index weighted by sugar suitability, recognizing the central role of sugar production in the economies of Cuba, the Dominican Republic and Haiti during the study period. Higher sugar suitability correlates closely with actual sugar production areas, so wind events affecting highly suitable regions are likely to result in significant losses, potentially leading to economic shocks. The data on soil suitability for sugar production is derived from the Global Agro-Ecological Zones (GAEZ) suitability index provided by the Food and Agriculture Organization (FAO) of the United Nations (Fischer et al. Reference FISCHER, NACHTERGAELE, VAN VELTHUIZEN, CHIOZZA, FRANCHESCHINI, HENRY, MUCHONEY and TRAMBEREND2021a,Reference FISCHER, NACHTERGAELE, VAN VELTHUIZEN, CHIOZZA, FRANCHESCHINI, HENRY, MUCHONEY and TRAMBEREND2021b).Footnote 15 With a 9×9 km resolution, I estimate wind speed impacts at this granular level and weight each region’s wind exposure by sugar suitability. I then use the country’s maximum value for this new destruction index to evaluate its effect on bond returns.
The results of the new model are presented in Table 5. Overall, the estimated effect of  $DEST{R_{CSI}}$ remains consistent with those from the previous models. However, when weights are adjusted for sugar suitability, the impact at $t - 6m$ becomes insignificant. Additionally, the effect sizes at $t - 1m$ and $t - 3m$ are approximately 5 percent lower than those observed with population-weighted estimates. This suggests that bond returns tend to increase more when hurricanes affect areas with higher population density compared to those with greater suitability for sugar production.Footnote 16
Effect of hurricanes on return (log)

*** Notes: Signification codes: 0.01, **: 0.05, *: 0.1. Standard-errors are clustered on bond-level in parentheses.
To better understand the mechanisms behind the impact of hurricanes on bond returns, I analyzed the effect of hurricanes on three key national indicators: Public Expenditures (EXPENDITURES), Public Revenues (REVENUES) and Exports, using data from Bulmer–Thomas (2003). Table 6 presents the results, which include year and country fixed effects, with heteroskedasticity-robust standard errors. The findings suggest that while hurricane strikes did not significantly affect  $EXPENDITURES$ or $EXPORTS$, they did lead to a reduction in $REVENUES$ in the year following a strike. This result aligns with the timing of hurricane season, which occurs late in the calendar year, meaning that $REVENUES$ for that year have often already been collected. The decline in $REVENUES$ most likely stems from the widespread damage hurricanes cause across industries. Firstly, agricultural output drops as hurricanes destroy key crops such as sugarcane and banana trees. Secondly, hurricanes can damage manufacturing facilities, along with the machinery necessary for processing goods. As a result, output declines, leading to a reduced tax base and, consequently, lower $REVENUES$. This decline in $REVENUES$, coupled with steady $EXPENDITURES$, creates a deficit that governments may need to finance through higher future taxes, reduced spending, or increased public debt. Investors, anticipating this increased debt burden in the wake of hurricane strikes, may then demand a higher risk premium. This expectation of heightened risk increases bond returns, thereby explaining the observed rise in bond returns following hurricane events.
Effect of hurricanes on public finances

*** Notes: Signification codes: 0.01, **: 0.05, *: 0.1. Heteroskedasticity-robust standard-errors in parentheses.
The possibility of measurement error in the destruction proxy,  $DESTR$, deserves careful consideration. If $DESTR$ inadequately captures the true economic damage from hurricane strikes, this could introduce an attenuation bias due to measurement error, potentially increasing the standard errors. Nevertheless, $DESTR$ has been widely used in economic and economic history research (Mohan and Strobl Reference MOHAN and STROBL2013; Huesler and Strobl Reference HUESLER and STROBL2024; Huesler Reference HUESLER2024), confirming its robustness as a measure of hurricane-related destruction. Moreover, the consistency of the impact on bond returns, whether $DESTR$ is weighted by population (assuming that areas with higher population density suffer greater economic damage) or by sugar suitability (assuming greater damage where land is optimal for sugar production), suggests a low likelihood of significant measurement error. Thus, the similarity of results across different weighting schemes supports the reliability of $DESTR$ as an effective proxy for hurricane-related destruction. Regarding the (historical) context, it is clear that the early twentieth-century Caribbean was not only a site of geopolitical manoeuvring, but also closely tied to agricultural economies and vulnerable to the unpredictable forces of nature. The empirical evidence on the impact of hurricanes on bond yields points to a financial market that reflected the socio-economic vulnerabilities and geopolitical stakes of the time. The increased investor demand for risk premia following hurricanes highlights a broader story of economic vulnerability. Caribbean economies are heavily dependent on agriculture and burdened by public debt, creating a context in which the financial impact of natural disasters is amplified.
The observed short-term increase in bond returns following a hurricane strike, driven by an elevated risk premium, aligns with established patterns in the financial response to natural disasters. This heightened return, however, was fleeting, as the effect diminished within a month. This adjustment period reflects investors’ re-evaluation of risks in the aftermath, mirroring findings by Worthington and Valadkhani (Reference WORTHINGTON and VALADKHANI2004) on stock returns post-disaster in Australia. Other contexts, including outbreaks and natural crises, have demonstrated similar patterns in risk premium recalibration, as noted by Teitler-Regev and Tavor (Reference TEITLER-REGEV and TAVOR2019) and Singh et al. (Reference SINGH, DHALL, NARANG and RAWAT2020). The initial surge in risk premiums most likely stemmed from two primary uncertainties: first, the indeterminate extent of economic damage inflicted by the hurricane; second, concerns over the affected governments’ capacity to finance relief and reconstruction efforts. However, the return of bond yields to pre-disaster levels within a month suggests that, in the early twentieth-century Caribbean context, the risk premium increase was transient, implying that sovereign debt markets effectively absorbed the environmental shock without sustained premium elevation.
This study contributes to the growing literature on the economic implications of natural disasters on sovereign debt, offering a historical perspective that elucidates how early twentieth-century Caribbean bond markets responded to such environmental shocks. The results align with Klomp (Reference KLOMP2015) and Beirne et al. (Reference BEIRNE, RENZHI and VOLZ2021), who observed that natural disasters elevate sovereign bond yields and risk premiums, reflecting an anticipatory adjustment to heightened perceived risk. This article thus underscores a historical precedent for market reactions to increased sovereign risk following natural disasters, illustrating a temporary, yet robust, demand for higher premiums in response to disaster-induced uncertainties. These findings suggest a potential model for contemporary policymakers, who might benefit from examining historical financial strategies when assessing risk management and resilience measures.
This study also contributes to the literature on how historical shocks influence risk premiums, expanding on research concerning financial crises, wars and other economic upheavals (Ferguson Reference FERGUSON2006; Jopp Reference JOPP2016; Campbell et al. Reference CAMPBELL, QUINN, D. and YE2018; Hirshleifer et al. Reference HIRSHLEIFER, MAI and PUKTHUANTHONG2023; Del Angel et al. Reference DEL ANGEL, FOHLIN and WEIDENMIER2023). By integrating environmental shocks into this framework, the article highlights the unique financial impacts of hurricanes in regions susceptible to recurrent natural disasters. Methodologically, the use of a hurricane destruction index introduces a nuanced approach to assessing economic impact, allowing for spatial and intensity-based disaster evaluations. This aligns with climate-economic research like that of Strobl (Reference STROBL2012), improving historical assessments of financial risk and investor response. In particular, by examining the early twentieth-century Caribbean bond market, this study sheds light on a period and region largely overlooked in prior literature. It shows that while previous studies emphasized shifts in European sovereign debt structures and legislative milestones like the Colonial Stock Act (Flandreau et al. Reference FLANDREAU, FLORES, GAILLARD and NIETO-PARRA2010; Gardner Reference GARDNER2017), US oversight in the Caribbean also shaped sovereign debt markets by implicitly stabilizing bond yields through customs revenue management. This geopolitical assurance interacted with environmental shocks in a manner distinct from other regions, where investors’ demand for risk premiums was tempered by the perception of US intervention. Such insights advance understanding of how geopolitical structures influence debt markets in high-risk environments, revealing resilience strategies within financial frameworks that uniquely addressed environmental vulnerabilities.
Ultimately, this study illustrates a critical interaction between institutional finance structures and environmental risks, adding to the sovereign debt literature by analyzing how natural disasters influenced bond dynamics in high-risk Caribbean economies. The results not only highlight the immediate market reaction to hurricanes but also reveal the adaptive mechanisms within the bond market as risk premiums reverted to baseline levels, indicating a nuanced, short-lived adjustment process. These findings enhance our understanding of sovereign bond markets’ resilience to environmental shocks in an era marked by geopolitical intervention and limited financial stability, underscoring the importance of historical context in informing modern financial risk assessments and resilience planning.
To assess the robustness of the results, I applied a Fisher-type randomization test (Fisher et al. Reference FISHER1937). To do this, I randomly redistributed the estimated destruction indices across the three countries and over time. In the next step, I re-estimated the model from the Table 3 and plotted the obtained  $t$-values of the coefficient from $DEST{R_{t - 1m}}$ by estimating the baseline model 1,000 times in Figure 6. The graphical representation of the Fisher test in Figure 6 shows a red dotted line corresponding to the initial $t - 1$ value from the result in column 4 of Table 3. The distribution of $t - 1$-values estimated with the Fisher randomization test is centred around zero, while only a small number of $t$-values exceed values of 2. Therefore, given the notable $t - 1$-values found in the original baseline models, it can be concluded that the influence of hurricanes on $returns$ is unlikely to be random. As a result, these effects can be considered causal, which reinforces the strong results obtained from the baseline model.
Fisher randomization test:  $DEST{R_{t - 1m}}$

As a further robustness check, I applied a Local Projections Difference-in-Differences (LP-DiD) in accordance with Dube et al. (Reference DUBE, GIRARDI, JORDA and TAYLOR2023). In contrast to traditional two-way fixed-effects models, LP-DiD circumvents the ‘negative weights’ issue by implementing a ‘clean control’ condition, thus preventing control units from being influenced by prior treatment effects (Dube et al. Reference DUBE, GIRARDI, JORDA and TAYLOR2023). This significantly reduces bias and provides more accurate estimates. Furthermore, LP-DiD’s adaptability renders it suitable for empirical settings with dynamic treatment effects: (Dube et al. Reference DUBE, GIRARDI, JORDA and TAYLOR2023).
In Figure 7, the results of the estimated impact of hurricanes on  $Returns(log)$ are illustrated. To do so, I controlled for $Return{s_{t - 1}}(log)$ and added $bond - $ and time-fixed effects and clustered at bond level. In addition, nine leads and lags were included. The results show that hurricanes increased $Returns$ by 1.28 percent, which is approximately 0.07 percentage points. Therefore, this result is situated somewhere between the results obtained with categories 1 and 2 hurricanes. For this reason, the results previously obtained seem reasonable and plausible.
Results: local projections difference-in-differences

VI
This article shows that hurricanes temporarily increase bond yields by raising the risk premium in the Caribbean in the early twentieth century. However, this effect is strikingly temporary, with risk premiums returning to pre-disaster levels within a month. This temporary jump in bond yields after hurricane events reveals the initial reaction of investors to increased perceived risk, as they assess both the immediate financial impact of the disaster and the ability of Caribbean governments to finance relief and reconstruction efforts. The results reflect a short-lived adjustment process, with risk premia quickly normalizing as markets reassess and absorb the shock. This rapid reversion underscores that bond markets in this region have effectively priced in environmental risks during the period under review without a sustained increase in the premium, illustrating a form of resilience in early sovereign debt markets exposed to high environmental risk.
Using extensive historical bond price data and an innovative hurricane destruction index, this article provides insights into past financial market responses to environmental disruptions. On average, hurricanes lead to a 0.9 percent increase in bond yields, an additional 0.05 percentage points above baseline yields, with an associated yield premium of more than USD 101,000 over the average maturity. This significant shift captures the premium that investors demand for sovereign debt in hurricane-prone regions, revealing how market dynamics have adapted to environmental risk in ways that have been understudied in the sovereign literature. The results make an important contribution to the broader discourse on the financial impact of natural disasters. Unlike previous studies that rely on disaster counts or dummy variable treatments, this article uses a hurricane destruction index to better represent the potential damage from individual hurricanes, providing a more accurate understanding of how markets have historically responded to varying intensities and spatial distributions of environmental shocks. In addition, the study addresses a critical literature gap by focusing on a unique period in the Caribbean bond markets when US surveillance and geopolitical considerations intersected with environmental risk. This examination of US-influenced bond markets in high-risk regions highlights the nuanced relationship between geopolitical structures and sovereign risk premia, particularly in the face of extreme natural disasters.
A key implication of the study is that while the short-run market reaction to hurricanes is pronounced, the enduring risk premium for sovereign bonds in hurricane-prone regions may incorporate a permanent component reflecting the ongoing threat of future disasters. This raises several important questions for future research: was hurricane risk implicitly built into the risk premia for Caribbean sovereign debt? How might improvements in resilience through economic development or changes in governance or the current impacts of climate change affect these historical risk premia? Addressing these questions could provide valuable insights into how environmental risk is priced in sovereign debt markets today and inform policy measures aimed at enhancing economic resilience.
Finally, this article adds to the literature on the impact of natural disasters on sovereign bond markets in the early twentieth century. The rapid recovery of risk premiums after disasters suggests a nuanced market response that integrates both environmental and geopolitical factors, and underscores the adaptability of early sovereign bond markets in high-risk regions.


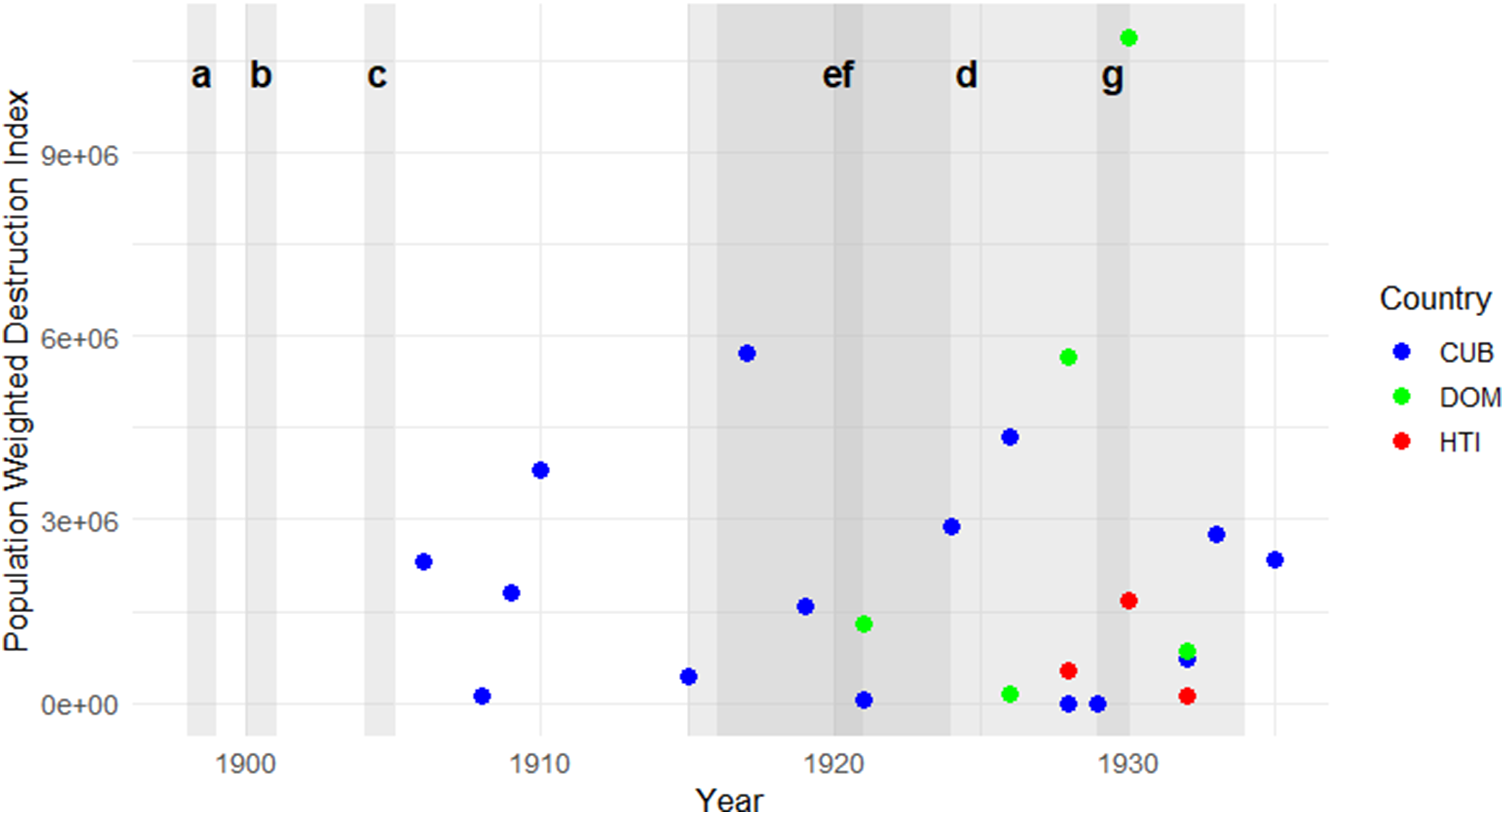
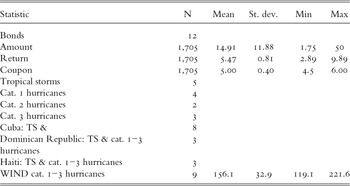

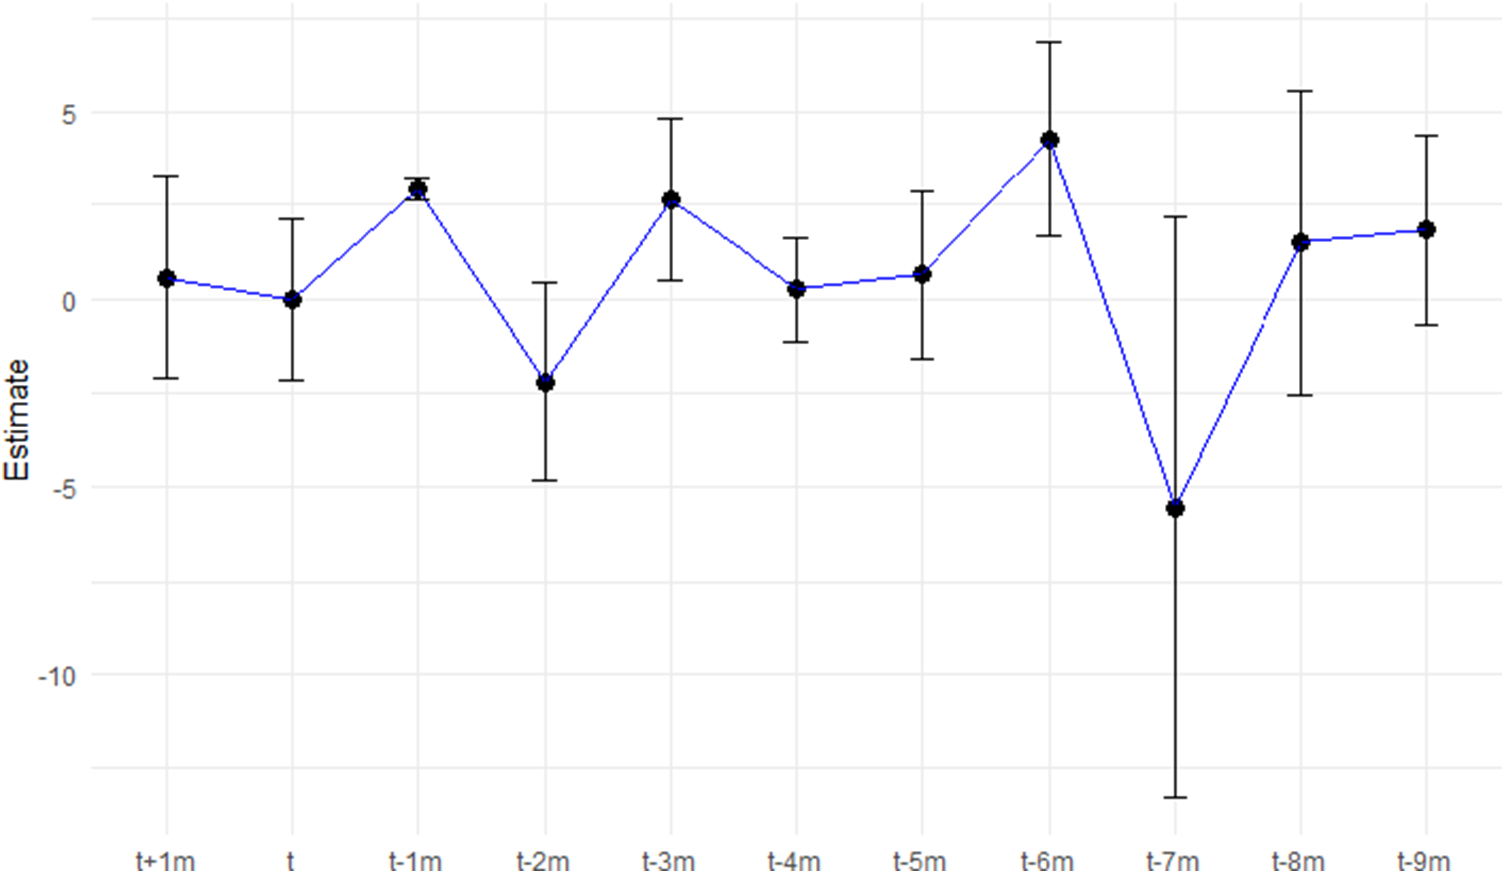

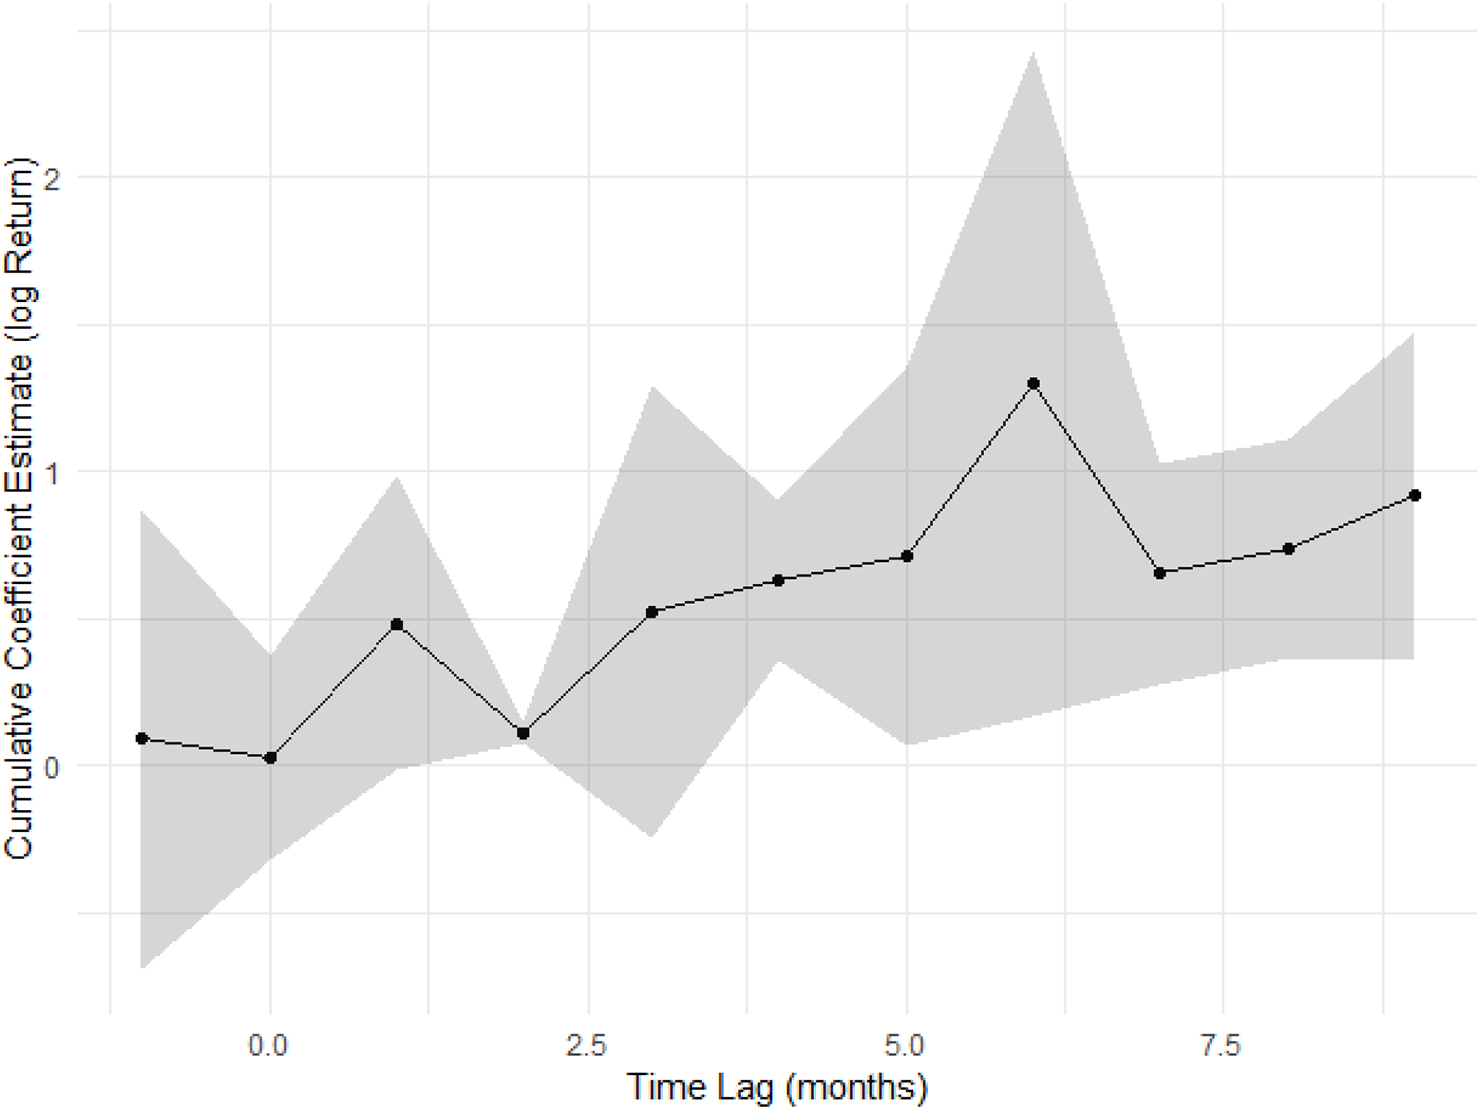


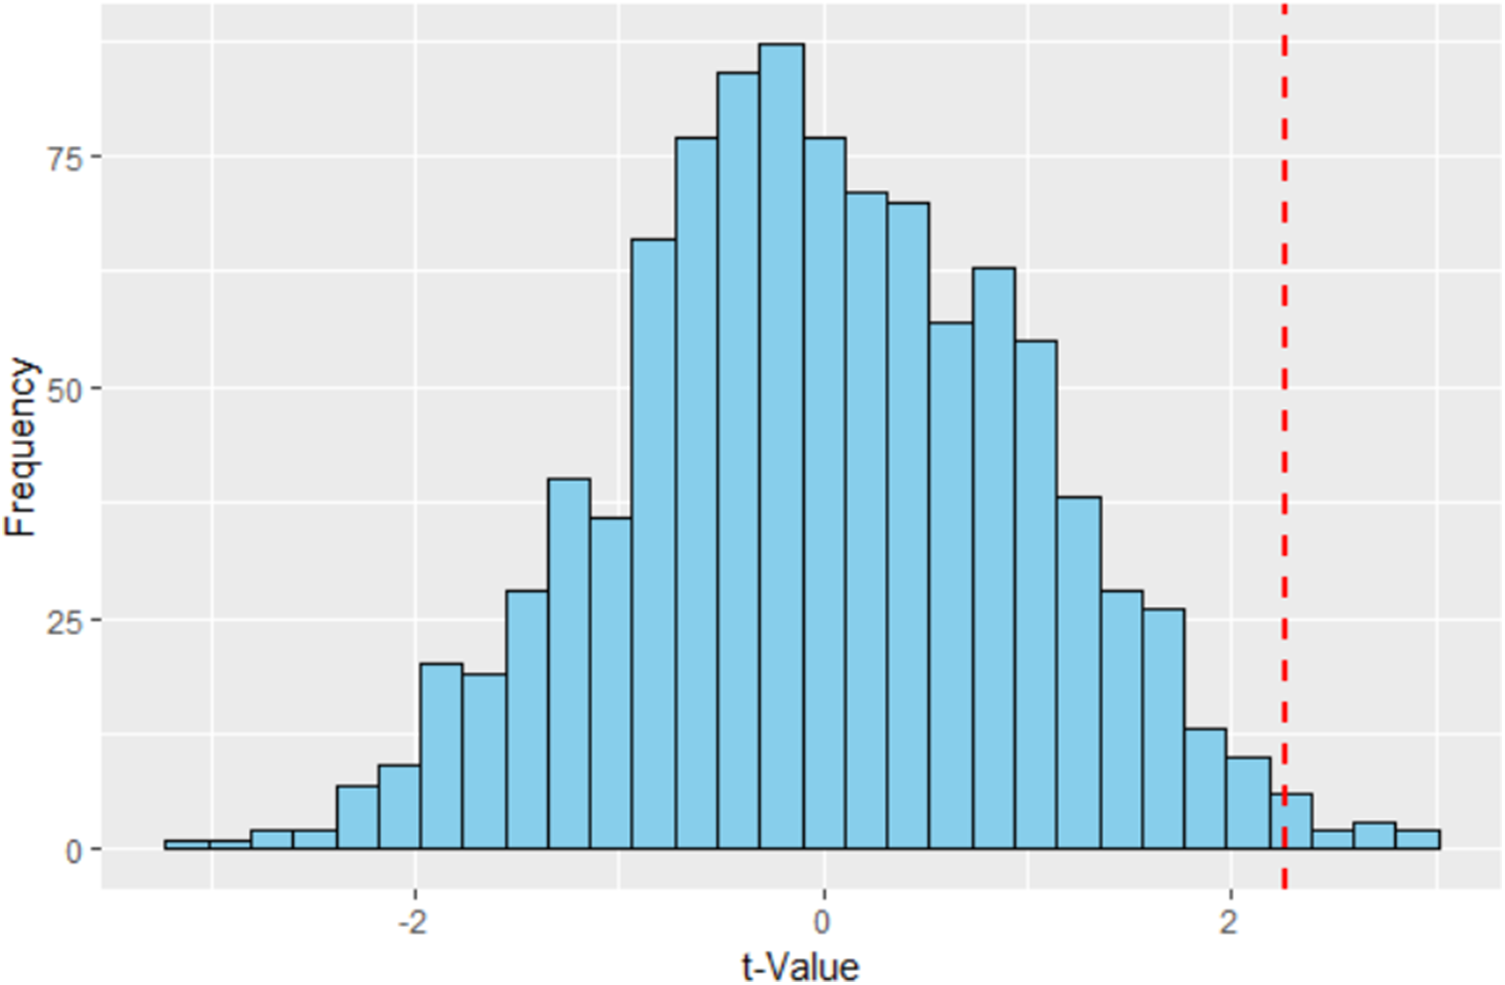

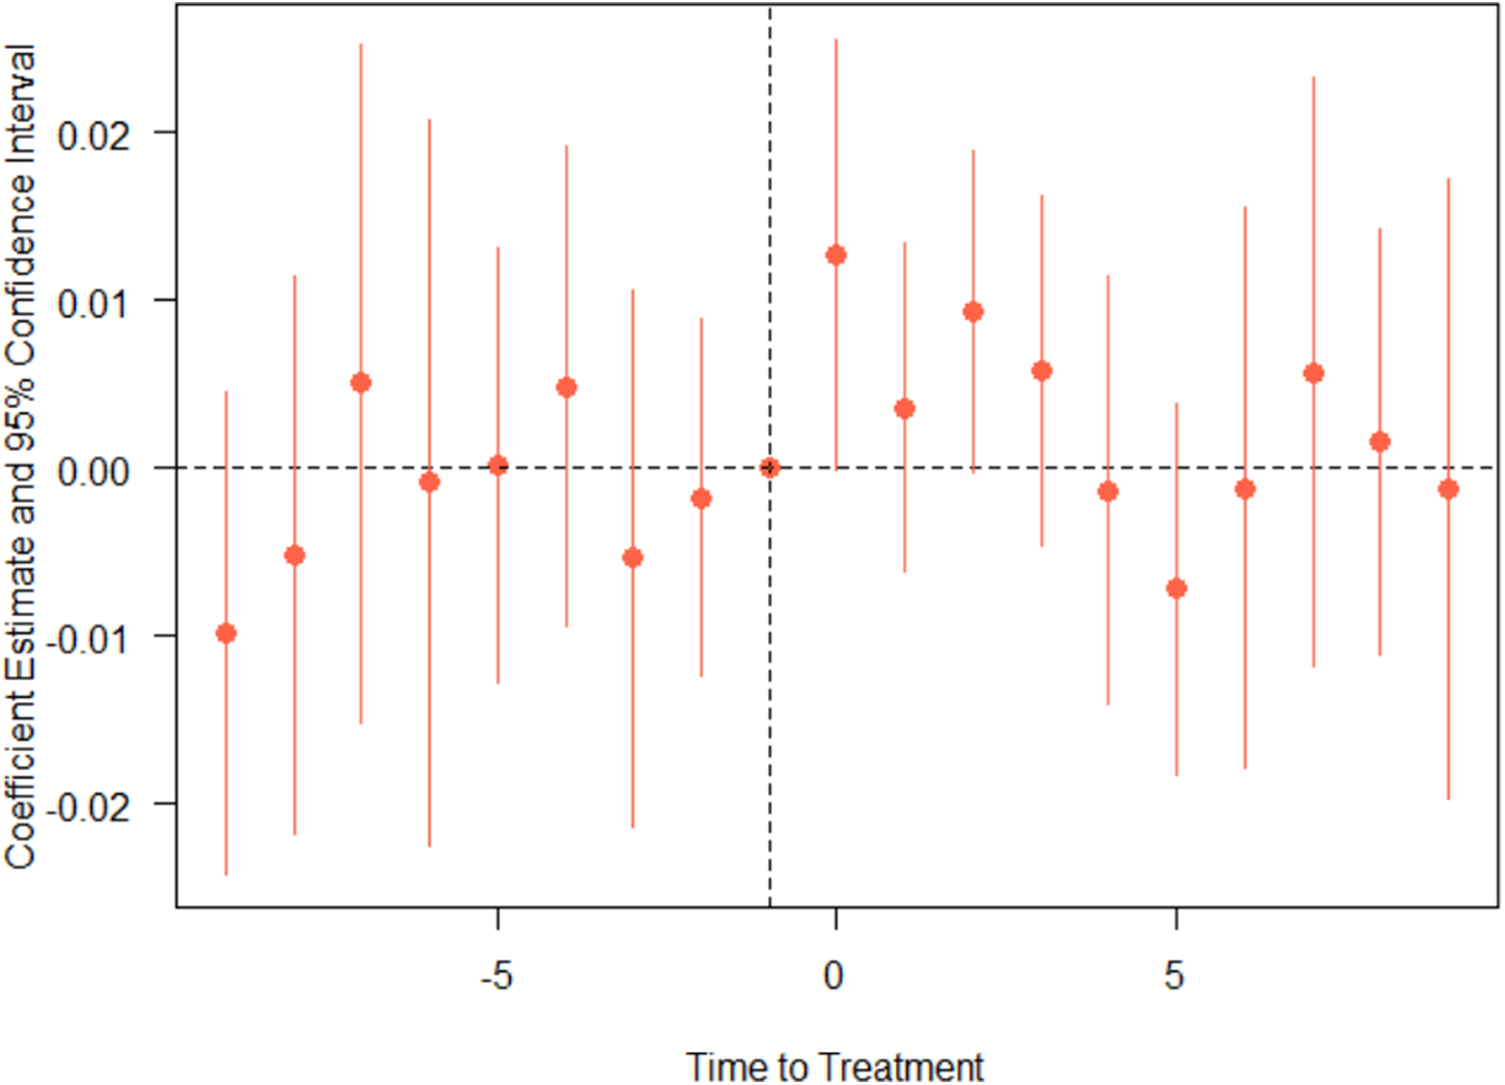

 Open access