

Liver lipid overload has deleterious effect on the hepatocyte viability and functionality. Non-alcoholic fatty liver disease (NAFLD) is a wide spectrum of fatty liver ranging from simple steatosis, which is previously considered as the benign form of NAFLD, to non-alcoholic steatohepatitis (NASH) which can progress to liver inflammation, fibrosis and malignancy in absence of alcohol consumption( Reference Angulo 1 ). NAFLD is known as the ‘hepatic manifestation’ of the metabolic syndrome (MS)( Reference Marchesini and Babini 2 ) and fatty liver per se has been linked to insulin resistance (IR) and progression of atherosclerosis and thus by itself may be a major aggravating factor in the pathogenesis of the MS and its associated disorders( Reference Targher 3 ). The mechanisms underlying steatosis occurrence and progression to NASH remains incompletely understood but IR, mitochondrial dysfunction, oxidative stress and inflammatory cascades are believed to play a central role in the pathogenesis of NAFLD( Reference Nassir and Ibdah 4 ). Hepatic steatosis originates mainly from the excessive NEFA delivery from insulin resistant adipose tissue into the liver( Reference Bugianesi, Gastaldelli and Vanni 5 ); of the induction of hepatic de novo lipogenesis (DNL) by IR( Reference Musso, Gambino and Cassader 6 ) and of the inhibition of fatty acids β-oxidation (FAO) by hyperinsulinaemia( Reference Hamel, Bennett and Upward 7 ). Decreased TAG secretion in the form of VLDL or abnormalities of adipokines metabolism can also contribute to fatty liver( Reference Trauner, Arrese and Wagner 8 ). In DNL, the lipogenic transcriptional regulators sterol regulatory element-binding protein-1c (SREBP-1c) and carbohydrate responsive element-binding protein (ChREBP) are transactivated by liver X receptor αβ (LXRαβ), a nuclear receptor (NR) that regulates the metabolism of cholesterol and NEFA. LXRαβ, SREBP-1c and ChREBP regulate coordinately the expression of lipogenic genes, including acetyl-CoA carboxylase 1 (ACC1) and fatty acid synthase (FASN) in response to nutritional signals( Reference Postic and Girard 9 ) and seem to play a major role in the pathogenesis of NAFLD( Reference Ahmed and Byrne 10 – Reference Iizuka, Bruick and Liang 12 ). The NR PPARγ is another transcriptional factor (TF) which has been linked to exacerbated hepatic steatosis by mechanism involving activation of DNL and increased TAG concentration( Reference Schadinger, Bucher and Schreiber 13 ). A role in the development and treatment of fatty liver has been also shown for the NR PPARα, principal regulator of the fatty acid oxidative metabolism through the transcriptional induction of several enzymes as carnitine palmitoyltransferase-1 (CPT-1), – that catalyses the rate-limiting step in mitochondrial FAO( Reference Wahli and Michalik 14 ) – , and for the critical sensor of cellular energy charge the AMP-activated protein kinase α (AMPKα) that regulates the partitioning of NEFA between oxidative and biosynthetic pathway controlling the hepatic lipid homoeostasis( Reference Saha and Ruderman 15 ). It has been suggest that a redox control may be involved in the early development of fatty liver( Reference Serviddio, Bellanti and Vendemiale 16 ), as reactive oxygen species (ROS) could modulate liver lipid metabolism acting as NR and TF ligands or alter their DNA binding or nuclear import( Reference Lukosz, Jakob and Buchner 17 ) and modifying post-translationally some proteins involved in NEFA metabolism( Reference Hayes and Lockwood 18 ).
Increasing evidence suggests that the dietary protein can affect body lipid metabolism, as the type and the amount of protein in the diet seems to play an important role on the development of obesity and its metabolic consequences( Reference Torres and Tovar 19 ). Long-term consumption of a high animal/vegetable protein ratio and a low-protein intake (PI) leads to TAG adipocyte accumulation( Reference Du, Higginbotham and White 20 ) and fatty liver infiltration in absence of alcohol( Reference Torres and Tovar 21 ). However, recently it has been shown that consumption of whey proteins and/or milk protein fractions lessens several risk factors for metabolic diseases( Reference Sousa, Lira and Rosa 22 ), although the data reported are controversial. Thus, while a protective effect of dietary whey protein reducing steatosis and oxidative stress has been found in high-carbohydrate fat-free-fed rats( Reference Hamad, Taha and Abou Dawood 23 ), the consumption of 25 % whey protein showed an increase in insulinaemia and insulin intolerance in mice compared with dietary casein( Reference Veldhorst, Nieuwenhuizen and Hochstenbach-Waelen 24 ). It has been suggested that dietary α-lactalbumin (α-LAC) is the most hypercholesterolaemic and atherogenic animal protein in rabbits( Reference Kritchesky 25 ) whereas promotes( Reference Rubio 26 ) or unmodifies( Reference Gregersen, Bystrup and Overgaard 27 ) lipid liver accumulation in rats compared with dietary casein. We reported previously, that the consumption of 14 % dietary α-LAC as the sole protein source v. chow-based diet improves body fat weight and induces an atherogenic dyslipidaemia in adult and old male Balb/c mice( Reference López-Oliva, Nus and Agis Torres 28 ). As the presence of atherogenic dyslipidaemia has been reported to be associated with NAFLD( Reference Chatrath, Vuppalanchi and Chalasani 29 ), we reason if the atherogenic effect elicited by dietary α-LAC could be related to a possible hepatic steatosis development. The main purpose of this study was to assess the ability of the dietary α-LAC (14 %) to induce liver steatosis identifying the molecular mechanisms underlying hepatic lipid metabolism and its relationship with the peripheral IR and the hepatic redox status. The protein expression of regulators and enzymes involved in DNL (LXRαβ, SREBP-1c, ChREBP, PPARγ, ACC1 and FAS), and FAO (PPARα and CPT-1) as well as the role played by the energy sensor AMPKα were studied. The possible influence of a prooxidant/antioxidant imbalance in the liver of male Balb/c mice capable of modulating lipid metabolism was also investigated.
Methods
Experimental design
A total of twelve male Balb/c mice aged 6 months with an average body weight of 30 (sem 1) g were obtained from the breeding centre Nutrición y Fisiología (Spanish Government licence: ES280790000085), Faculty of Pharmacy, Universidad Complutense Madrid, Spain. The mice matched by weight were housed in individual metabolic cages and kept in a room at 22°±1°C, 60 % humidity and with a 12 h light–12 h dark cycle. After a 7-d adaptation period, mice were assigned (n 6 each) at random and blinded to either the control group fed a standard chow for mouse maintenance (A04; PanLab) or the α-LAC group fed an experimental diet containing α-LAC (α-LAC diet) for an experimental period of 4 weeks. Food and water were freely available. Food intake (FI) and PI and body weight (BW) were measured daily. The experimental diet was formulated according to AIN-93M standards( Reference Reeves, Nielsen and Fahey 30 ) substituting α-LAC for casein while maintaining all other components. The composition of diets is shown in Table 1. At the end of study, six mice from each group were starved for 12 h and killed under anaesthesia with ketamine (30 mg/kg) and xylazine (5 mg/kg). Blood sampling were collected from retro-orbital plexus and serum was separated from whole blood by centrifugation (1500 g 10 min; 4°C) and analysed immediately or placed into aliquots and stored at −80°C. Livers were removed after blood was collected, rinsed with cold PBS and then weighed. Parts of each liver were fixed in 10 % formaldehyde/PBS or frozen in liquid N2, and stored at −80°C until used. Abdominal adipose tissues (mesenteric, retroperitoneal and peri-intestinal fat pads), and the gonadal fat pad were carefully removed, weighed and used to determine the adiposity index, calculate as abdominal and/or gonadal (g)/BW(g)×100). The eviscerated bodies of mice were frozen in liquid nitrogen and ground to a homogeneous mixture and used to the body composition measure. Aliquots were used to determine DM, diethyl ether extract (representing the fat content), protein and ash( 31 ). Results were used to calculate relative content of BW. Linear relationships between body protein gain (BPG) and body fat gain (BFG) v. PI were fitted to study the efficiency of PI utilisation to BPG and BFG. All animal care and experimental protocols conformed to the European Union Guidelines for the Care and the Use of Laboratory Animals (European Union Directive 2010/63/EU) and were approved by the Institutional Animal Care and Use Committee of Madrid Complutense University.
Composition of experimental diets
α-LAC, α-lactalbumin.
* 1 kg of diet contains the following minerals (g/kg): chow diet: Ca, 8·8; P, 5·9; Mg, 1·40; K, 6·25; sodium, 2·5; Cl, 3·1. α-LAC diet: mineral mix (AIN-93M).
† 1 kg of diet contains the following vitamins: chow diet: vitamin A, 2·0 mg (6600 IU); vitamin D3, 22·5 μg (900 IU); vitamin E, 30·0 mg, vitamin K3, 2 mg; thiamine, 1 mg; riboflavin 4 mg; niacin, 20 mg; pantothenic acid, 15 mg; pyridoxine, 4 mg; biotin, 0,1 mg; folic acid, 1 mg; cyanocobalamin, 20 mg; choline 500 mg. α-LAC diet: vitamin mix (AIN-93VX).
Serum measurements
Serum total cholesterol (TC), HDL-cholesterol, TAG and NEFA concentrations were assayed using enzymatic/colorimetric assay kits (Biolabo SA. Materlab). The non-HDL-cholesterol ((LDL+VLDL)-cholesterol) was calculated according the formula: (LDL+VLDL)-cholesterol=TC−HDL-cholesterol. The TC:HDL-cholesterol ratio was employed as atherogenic index. Serum glucose was measured using the glucose oxidase method (Spinreact S.A.). Serum insulin concentration was determined using an ELISA for mouse insulin (Mercodia AB).The homoeostasis model assessment-estimated insulin resistance (HOMA-IR) was calculated using the following formula: fasting blood glucose (mmol/l)×fasting insulin (mIU/l)/22·5. The greater the HOMA-IR value, the higher the level of IR. The absorbance of enzyme alanine aminotransferase (ALT) was read at 505 nm and the enzyme activity was calculated as IU/l. Serum adiponectin, leptin and TNFα levels were measured using ELISA kits (Diagnostic Systems Laboratories Inc.)
Liver lipids determinations
The liver of each mouse was homogenised and total lipids were extracted with a mixture of chloroform–methanol (2:1, v/v) according to the Folch et al.( Reference Folch, Lees and Sloane Stanley 32 ) method. The hepatic TAG and NEFA contents were assayed using enzymatic/colorimetric assay kits.
Histological and immunohistochemical examination
Liver tissues were sectioned (4-5 μm), alcohol-dehydrated, and embedded in paraffin. Sections were stained with haematoxylin–eosin to evaluate severity of histological changes. For each mouse, assessment of the area occupied by the lipid vacuoles was performed on five different fields at 100× magnification and it was expressed as a percentage of the total surface of these different fields, using Image J version 1.44 software (http://rsb.info.nih.gov/ij/). Hepatic steatosis was graded according to the percentage of hepatocytes containing fat, as 0: no steatosis (fatty hepatocytes occupying <5 %), 1: minimal steatosis (fatty hepatocytes occupying 5–33 %), 2: moderate steatosis (fatty hepatocytes occupying 34–66 %) or 3: severe steatosis (fatty hepatocytes occupying >66 %)( Reference Kleiner, Brunt and Van Natta 33 ). The liver sections were observed under a light microscope using a Leica DM LB2 microscope and a digital Leica DFC 320 camera (Leica).
Standard immunostaining procedures were performed to assess the effect of the α-LAC feeding on the expression of lipogenic enzymes (ACC1; FASN) in the liver. Before the immunostaining, the sections were deparaffinised, rehydrated and then treated in 3 % hydrogen peroxide in methanol to inhibit peroxidase activity. They were then boiled in a microwave oven in 0·01 m sodium citrate buffer (pH 6·0) for 20 min. To avoid background staining, blocking serum was derived from same specie in which the secondary antibody had been raised. After, the sections were incubated overnight at 4°C with the following rabbit polyclonal primary antibodies: anti-ACC1 (1:50) and anti-FASN (1:50) (Santa Cruz Biotechnology). After washes with PBS the sections were covered for 30 min at room temperature with biotinylated goat anti-rabbit (1:500) as secondary antibody (Santa Cruz Biotechnology). Immunochemical staining was performed for 30 min using streptavidin-biotin conjugated horseradish peroxidase (Sigma Aldrich) and visualised by incubation with 3, 3'-diaminobenzidine (Sigma Aldrich) for 10 min at room temperature. The sections were counterstained by Harris’s haematoxylin, dehydrated and mounted. Protein expression was evaluated by their staining pattern: weak, moderate, diffuse or intense.
Tissue preparation for biochemical analysis
Mouse liver tissue was homogenised in a glass homogeniser in 1:10 (w/v) of ice-cold buffer (mannitol 210 mm, sucrose 70 mm, HEPES 5 mm, EDTA 1 mm and 0·01 % protease inhibitor cocktail, pH 7·4) for assessment of protein expression. For oxidative status and lipid parameters assessments, liver samples were homogenised in 10 volumes of ice-cold PBS. Tissue homogenates were centrifuged at 800 g for 15 min at 4°C. The supernatants and the pellets were collected. The nuclear pellets were washed twice and re-suspended in 20 mm HEPES, 1·5 mm MgCl2, 420 mm NaCl, 0·2 mm EDTA, 0·1 mm EGTA, 25 % glycerol, 1 mm dithiothreitol, 0·5 mm phenylmethylsulfonyl fluoride, 1 mm sodium orthovanadate, 0·5 mm spermidine and protease inhibitors at pH 7·9. After frequent vortexing for 15 min, nuclear homogenates were stored at −80°C until analysis.
The supernatant fractions were centrifuged at 14 000 g for 25 min at 4°C. The resulting supernatants representing the mitochondria-free cytosolic fraction were collected, sampled and stored at −80°C for later biochemical analyses. The mitochondrial pellets were re-suspended in homogenising buffer, and centrifuged at 14 000 g for 25 min at 4°C. The supernatant fractions were decanted and the mitochondrial pellets re-suspended in storage buffer and stored at −80°C. The protein concentration of the liver fractions was quantified using the Lowry method (DC(TM) Protein Assay Kit; Bio-Rad). Bovine serum albumin in a concentration range of 0–50 μg/ml was used as a standard.
Western blotting
The protein content of the LXRαβ, SREBP-1c, ChREBP transcription factors, as well as the PPARα and PPARγ NR were assessed in the nuclear liver fraction. The protein expression of the enzymes ACC1, FASN, and CPT-1, the protein kinase AMPKα, the phospho-derivatives phosphorylated-AMPKα (p-Thr172-AMPKα) and phosphorylated-ACC1 (p-Ser79-ACC1) as well as the antioxidant enzymes (AOE) Mn superoxide dismutase (MnSOD), Cu,Zn superoxide dismutase (Cu,ZnSOD), glutathione peroxidase (GPx), glutathione reductase (GR) and catalase (CAT) were assessed in mitochondrial and/or cytosolic fractions of liver.
For each sample 50–80 μg protein were boiled in Laemmli sample buffer and loaded into each well of 10 or 15 % polyacrylamide gel (SDS-PAGE) and after migration, proteins were transferred to a polyvinylidene fluoride membrane (GE Healthcare). All membranes were blocked with 5 % non-fat dry milk for 1 h at room temperature. For immunodetection, membranes were incubated overnight at 4°C with the following rabbit polyclonal primary antibodies: anti-SREBP-1c (1:200); anti-ChREBP (1:500); anti-ACC1(1:500), anti-FASN (1:1000), anti-CPT-1 (1:1000); anti-AMPKα (1:500); anti-p-Ser79-ACC1 (1:700); anti-p-Thr172-AMPKα (1:1000); anti-MnSOD (1:1000); anti-Cu,ZnSOD (1:1000); anti-GPx (1:500); anti-GR (1:1000) and anti-CAT (1:2000) (Santa Cruz Biotechnology). Goat polyclonal anti-PPARα (1:1000) and anti-PPARγ (1:2000), and mouse monoclonal anti-LXRαβ (1:100) primary antibodies were also used (Santa Cruz Biotechnology). Membranes were then washed in 0·05 % Tween-20, incubated with appropriate peroxidase-conjugated secondary antibodies for 1 h at room temperature, and then washed with PBS and the antigen-antibody complexes were visualised by chemiluminescence (ECL Select-kit; GE Healthcare). Anti-β-actin, anti-TFIID and anti-Tom20 antibodies (Santa Cruz Biotechnology) were used as loading control for cytosolic, nuclear and mitochondrial proteins respectively. p-AMPKα and ACC1 were quantified by densitometric analysis and normalised to the levels of endogenous AMPKα and ACC1 proteins respectively. Relative levels of inmunoreactive proteins were quantified using Image-Quant LAS 500 system (GE Healthcare) and the Quantity One version 4.62 for Windows as densitometric analysis software (Bio-Rad).
Lipid peroxidation assay
The assay used by lipid peroxidation (LPO) measure is based on the reaction of a chromogenic reagent N-methyl-2-phenylindole in acetonitrile, with malonyldialdehyde (MDA) and 4-hydroxynonenal (4-HNE) at 45°C (Bioxytech LPO-586 kit; Oxis International). Mitochondrial and cytosolic MDA+4-HNE concentrations were expressed as nmol/mg protein.
Protein oxidation assay
Carbonyl groups were measured as indicative of liver proteins damage according to the method of Levine et al. ( Reference Levine, Williams and Stadtman 34 ). The liver homogenates were incubated in 0·25 m TRIS (pH 7·4) and 0·2 m sucrose and 10 mm 2, 4-dinitrophenylhydrazine (DNTP) in 2 m HCl at room temperature for 1 h. Blanks were run without DNTP. Afterward, proteins were precipitated with TCA and centrifuged (3000 g; 20 min; 4°C). The protein pellet was washed three times with ethanol–ethylacetate (1:1) and incubated at 37°C until complete re-suspension. The mitochondrial and cytosolic carbonyl content was measured spectrophotometrically at 370 nm (molar extinction coefficient 22 000 M −1×cm−1) and expressed as nmol per mg protein.
Measurement of GSH and GSSG
GSH and GSSG concentrations were measured by a commercial kit supplied by Cayman Chemical. This kit utilises an optimised enzymatic GR recycling method for quantification of GSH( Reference Baker, Cerniglia and Zaman 35 ). Just after homogenisation of the liver, 100 μl aliquots of the cytosolic and mitochondrial homogenates were added to an equal volume of 5 % (w/v) meta-phosphoric acid to remove protein. After 30 min of incubation on ice, samples were centrifuged (2000 g ; 20 min; 4°C). Then, 50 μl of 4 m triethanolamine (catalogue no. T5830-0; Sigma-Aldrich) were added for each millilitre of homogenate to increase the pH. For total GSH assay, 50 μl of sample was added to 150 μl of a reaction mixture containing 0·4 m 2-(N-morpholino) ethane-sulfonic acid, 0·1 m phosphate (pH 6·0), 2 mm EDTA, 0·24 mm NADPH, 0·1 mm 5,5'-dithiobis-2-nitrobenzoic acid and 0·1 unit GR. The reaction was carried out at 37°C for 25 min, and then total glutathione was determined by absorbance at 405 nm using GSSG as standard. For the measurement of GSSG, GSH was removed from the reaction by adding 10 ml of 1 m 2-vinylpyridine/ml of homogenate. Then, the remaining GSSG in the reaction was quantified as total GSH assay. The amount of reduced GSH was obtained by subtracting GSSG from total glutathione. Each sample was assessed in duplicate, and the levels of GSH and GSSG were expressed as nmol/mg protein. The ratio of GSH:GSSG was used to indicate redox status that inferences the detoxification capacity.
Antioxidant enzyme activities
MnSOD, Cu,ZnSOD, GPx, GR and CAT activities were assessed in cytosolic and/or mitochondrial fractions of the liver. In brief, cytosolic Cu,ZnSOD activity was determined by using the hypoxanthine–xanthine oxidase system to generate O2 –. The capacity to scavenge superoxide radicals by suppression of nitrotetrazolium reduction was monitored at 550 nm( Reference Flohe and Otting 36 ). Enzyme activity was expressed in units/mg protein (1 unit of SOD is defined as the amount of enzyme required to inhibit the rate of nitrotetrazolium reduction by 50 %). MnSOD activity was determined in the mitochondrial fraction under the same conditions as the Cu,ZnSOD assay, with the addition of 1 mm-KCN to inhibit the Cu,ZnSOD isoform. The GPx activity assay was based on the oxidation of GSH to GSSG, catalysed by GPx. NADPH oxidation at 340 nm and 25°C was measured when GSSG is reduced back by GR with cumene hydroperoxide as the substrate( Reference Paglia and Valentine 37 ). Cytosolic and mitochondrial GPx activities were expressed as nmol NADPH oxidised to NADP/min per mg protein. GR catalyses the NADPH-dependent reduction of GSSG to GSH. GR activity was also determined by monitoring NADPH oxidation at 340 nm and was expressed as mmol NADPH oxidised/min per mg protein at 25°C( Reference Carlberg and Mannervick 38 ). Cytosolic CAT activity was measured by monitoring the decomposition of H2O2 at 240 nm( Reference Aebi 39 ). The reaction consisted of 50 mm sodium phosphate buffer (pH 7·2) and 10 mm H2O2. CAT activity was expressed as nmol formaldehyde formed/min per mg protein at 25°C.
ATP measurements
ATP content was measured in cytosolic and/or mitochondrial fractions of the liver by using an ATP colorimetric assay kit according to the manufacturer’s protocol (Biovision, Deltaclon S.L.). ATP content in liver homogenates was determined in a reaction mix that supported the phosphorylation of added glycerol as a substrate. The reaction mix was incubated in a ninety-six-well plate for 30 min at room temperature. The OD was measured at 570 nm in a microplate reader, and ATP content was calculated by applying sample to a standard curve.
Statistical analysis
The sample size calculation was based on observed variations in lipid profile parameters from our previously published study( Reference López-Oliva, Nus and Agis Torres 28 ), and was conducted through power analysis method by using the software G*Power version 3.1.9.2 (Faul F., Universitat Kiel). For a value of α=0·05 and 80 % power (β=0·20) and using the means of serum TC (2·65 for chow control group and 4·78 for α-LAC group with an average sd of 1·1), we calculated an effect size of 1·936. Hence, conducting a power analysis for a two-tailed t test, this effect size revealed a sample size of six mice per experimental group. Results were expressed as means with their standard errors. Differences were assessed by unpaired Student’s t test, and were considered statistically significant at the 5 % level on two-sided testing. The data obtained from the semiquantitative steatotic score were comparatively analysed using the Kruskal–Wallis test. Linear correlation analysis was used to explore the relationships between the continuous variables studied. Correlation coefficients (R) and P values were evaluated to judge the fit of the correlation; two-sided P<0·05 and P<0·001 values of correlations were considered significant and highly significant, respectively. The statistical analyses were conducted using SPSS 22.1 for Windows (SPSS).
Results
α-Lactalbumin diet increased body weight and abdominal adiposity in the Balb/c mice
Obesity is a hallmark in the pathogenesis of the MS and the fatty liver. As shown in Table 2, the BW gain in the α-LAC-fed mice increased significantly (5-fold; P=0·0001) compared with the control group, leading to a BW 14 % greater at end of experiment. The increase of BW was associated with a significantly elevated relative body fat (12·63 (sem 1·27) v. 8·63 (sem 0·40); P=0·01) together to a reduction in relative body water (4 %; P=0·009) and protein (7·75 %; P=0·013) as compared v the control group. Specially, the α-LAC group exhibit higher abdominal (57·6 %; P=0·005) and gonadal fat pads weights (27 %; P=0·007) than the chow-fed mice but only the abdominal fat adiposity index was significantly greater (34·89 % (0·58 (sem 0·03) v. 0·43 (sem 0·05); P=0·033).
Feed and protein intake, body weight (BW), body weight gain, body composition, abdominal and gonadal fat pad weights and abdominal and gonadal adiposity index of chow and α-lactalbumin (α-LAC)-fed Balb/c mice (Mean values with their standard errors; n 6)
* Differences were considered significant at P<0·05 between α-LAC and chow groups (two-sided unpaired t test).
α -Lactalbumin diet enhanced the protein intake efficiency towards body fat gain in the Balb/c mice
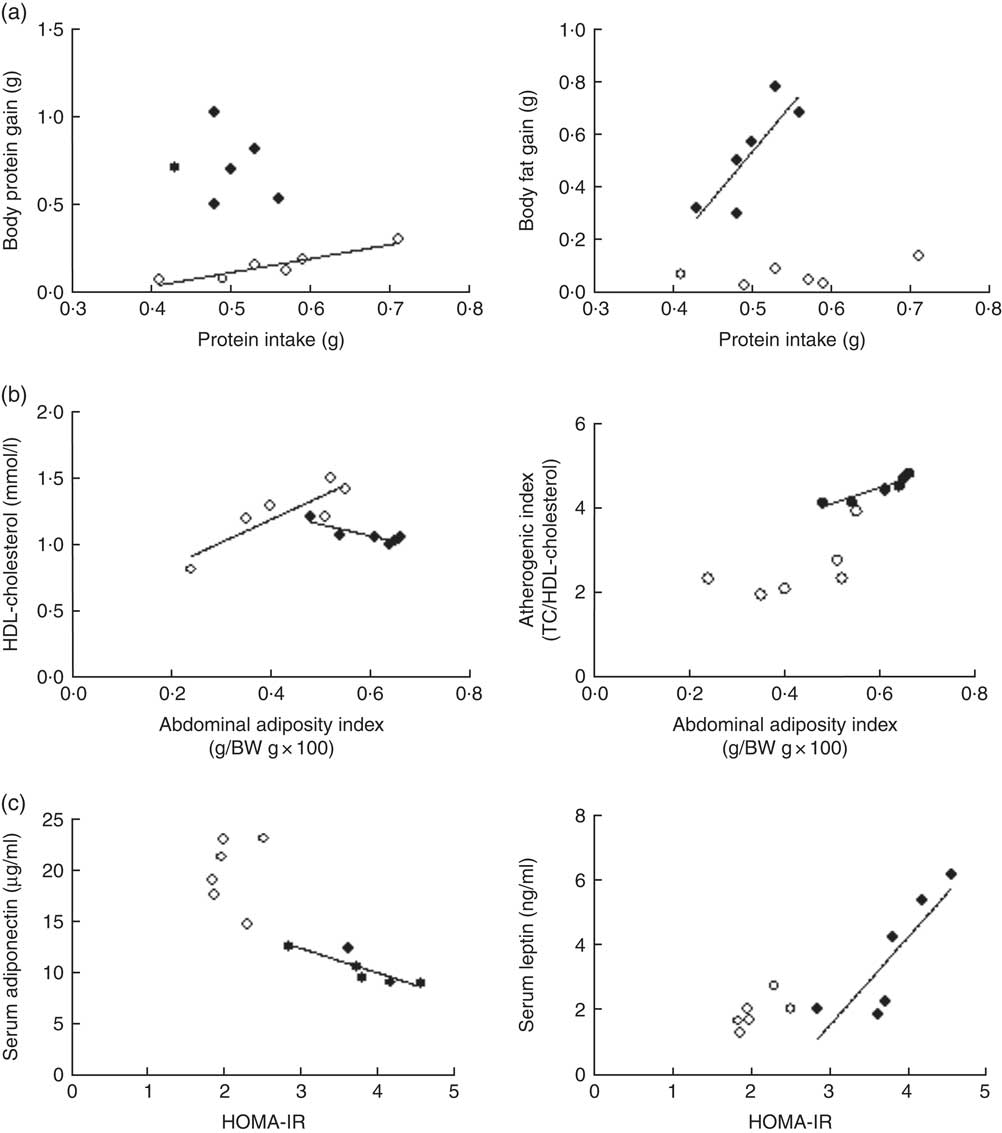
Although daily FI and PI did not differ among groups (P>0·05), the efficiency of PI utilisation on body substrate partitioning was significantly modified by the α-LAC diet. As evidenced in Fig. 1(a), the control mice utilised their PI towards BPG as indicates the significantly correlation found between PI and BPG (R 0·891; P=0·0046), whereas any correlation for the α-LAC-fed mice was observed (P>0·05). On the contrary, only the α-LAC-fed mice directed the higher proportion of their PI to BFG as it was showed by the significantly correlation coefficient of BFG relative to PI (R 0·705; P=0·036) (Fig. 1(a)), whereas no significant correlation (P>0·05) was found in the control mice. These results indicate that the α-LAC intake induced anomalous body substrate partitioning and improved body fat stores.
Scatterplots of the relationships: (a) between protein intake and both body protein gain and body fat gain; (b) between abdominal adiposity index and both serum HDL-cholesterol and atherogenic index; (c) and between homoeostasis model assessment-estimated insulin resistance (HOMA-IR) and both serum adiponectin and serum leptin of chow (○) and α-lactalbumin (α-LAC)-fed (●) Balb/c mice. Each linear regression analysis is represented by its correlation coefficient (R), P value and the fitted regression line (P<0·05). BW, body weight; TC, total cholesterol.
α -Lactalbumin diet produced dyslipidaemia and insulin resistance in the Balb/c mice
Dyslipidaemia is one of the most striking features in the development of fatty liver. In our work serum TC (64·82 %; P=0·0001), TAG (65·47 %; P=0·0001) and NEFA (70 %; P=0·0001) levels in the α-LAC group were significantly higher than those of the control mice (Table 3). Also, the α-LAC intake increased serum (LDL+VLDL)-cholesterol (113·45 %; P=0·0001) level, whereas serum HDL-cholesterol level was reduced (13 %; P=0·04). Thus, the atherogenic index was enhanced (82 %; P=0·001) in the α-LAC-fed mice compared with the chow-fed mice. The higher abdominal adiposity index of the α-LAC-fed mice was negatively correlated with HDL-cholesterol (R −0·875; P=0·021) and positively with the atherogenic index (R 0·932; P=0·006) whereas the chow-fed mice correlated positively (R 0·873; P=0·023) with HDL-cholesterol (Fig. 1(b)). These results suggest that the abdominal fat content plays a role in the α-LAC-induced atherogenic dyslipidaemia.
Serum lipid profile, atherogenic index, glucose, insulin, adiponectin, leptin and TNFα levels, homoeostasis model assessment-estimated insulin resistance (HOMA-IR) and alanine aminotransferase (ALT) activity of chow and α-lactalbumin (α-LAC)-fed Balb/c mice (Mean values with their standard errors; n 6)
* Differences were considered significant at P<0·05 between α-LAC and chow groups (two-sided unpaired t test).
Mean serum insulin levels of the α-LAC-fed mice were significantly higher (77 %; P=0·0001) than the control mice, whereas mean serum glucose levels did not differ among the groups (P>0·05) (Table 3). Furthermore, the HOMA-IR was significantly higher in the α-LAC group (79 %; P=0·002) than the control group, suggesting that the α-LAC intake induced an insulin sensitivity decline in the Balb/c mice.
α -Lactalbumin diet modulated serum adiponectin, leptin, and TNFα levels and alanine aminotransferase activity in the Balb/c mice
Serum adiponectin, leptin and TNFα levels as IR and fatty liver biomarkers were evaluated (Table 3). Our results showed that the α-LAC diet induced hypoadiponectinaemia (45 %; P=0·0001) whereas serum leptin (110 %; P=0·0001) and serum TNFα (60 %; P=0·0001) levels significantly increased compared with the control diet. Serum ALT activity, a marker of hepatocyte damage, was also significantly increased (33 %; P=0·0001) in the α-LAC group compared with the chow group. Significantly negative and positive correlations between serum adiponectin (R −0·860; P=0·027) and between serum leptin (R 0·843; P=0·034) and HOMA-IR were found in the α-LAC-fed mice (Fig. 1(c)). These results suggest that these adipokines derived of adipose tissue could be involved in the IR α-LAC induced.
α -Lactalbumin diet increased hepatic weight, TAG and NEFA contents inducing fatty liver in the Balb/c mice
Hepatic fat accumulation defines fatty liver. The liver weight was significantly increased in the α-LAC group (11 %; P=0·045) (Fig. 2(c)) but the liver:BW ratio (4·24 (sem 0·11) v. 4·33 (sem 0·19); P>0·05) did not differ among the groups, indicating that the liver grows in proportion to BW. Hepatic TAG (7·81 (sem 0·24) v. 4·87 (sem 0·19) μmol/g liver; P=0·0001) and NEFA (1·02 (sem 0·12) v. 0·45 (sem 0·03) μmol/g liver; P=0·001) contents were increased also by the α-LAC diet, attaining at 60 % (TAG) and at 126 % (NEFA) over control values (Fig. 2 (d and e)).
Dietary α-lactalbumin (α-LAC) induced non-alcoholic fatty liver in Balb/c mice. (a) Haematoxylin–eosin (H&E) stain shows macrovesicular lipid accumulation in liver of α-LAC-fed mice compared with normal liver histology of the chow-fed mice (light microscope, magnification 200×). (b) Steatosis score (c) liver weight; (d) hepatic TAG and (e) hepatic NEFA in the chow and α-LAC-fed mice. Values are means (n 6), with their standard errors represented by vertical bars. * Mean value was significantly different from that of the control group (P<0·05); two-sided unpaired t test). (f) Scatterplots of the relationships between the steatosis score and both serum HDL-cholesterol and the atherogenic index in the liver of α-LAC (●) and chow-fed (○) mice. Each linear regression analysis is represented by its correlation coefficient (R), P value and the fitted regression line (P<0·05). TC, total cholesterol.
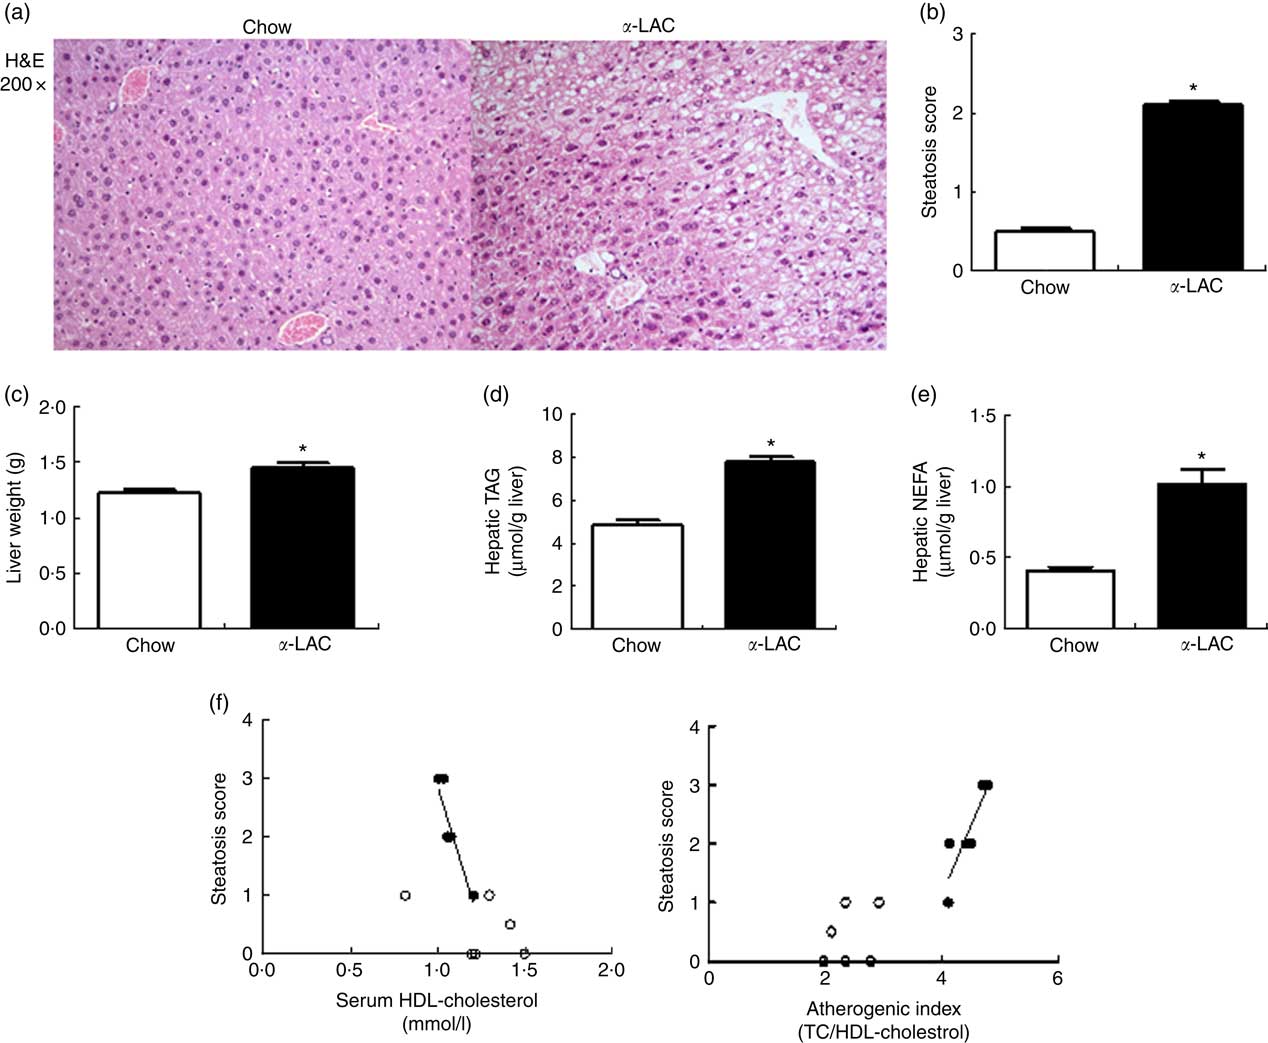
Histological sections of liver tissue from the α-LAC group showed macrovesicular intracellular lipid droplet, predominantly in pericentral zone of the liver compared with the chow-fed mice (Fig. 2(a)). The average steatosis grade score was significantly higher in the α-LAC liver (2·1 (sem 0·01) v. 0·42(sem 0·02)) than control mice (Fig. 2(b)), suggesting that the α-LAC diet developed a moderate steatosis, consistent with the results of biochemical evaluation. The higher steatosis score elicited by α-LAC-fed mice was correlated negatively with serum HDL-cholesterol (R −0·905; P=0·013) and positively with the atherogenic index (R 0·879; P=0·020) (Fig. 2(f)). Neither signs of inflammation nor fibrosis were histopathologically observed. Liver sections from the control group showed normal lobular architecture. These results suggest that the α-LAC intake induced liver fat infiltration associated to atherogenic dyslipidaemia.
α -Lactalbumin diet increased hepatic de novo lipogenesis in the Balb/c mice
We investigated the pattern of expression of the lipogenic TF, LXRαβ, SREBP-1c, ChREBP and PPARγ and of their enzymes target ACC1 and FASN in the nucleus and the cytosol respectively, of the liver of control and α-LAC mice.
Hepatic LXRαβ (15 %; P=0·042), SREBP-1c (34 %; P=0·001) and PPARγ (23 %; P=0·003) nuclear proteins were overexpressed in the α-LAC group compared with the control group when examined by immunoblot. The protein expression of cytosolic ACC1 and FASN, the key enzymes of the DNL and targets of LXRαβ, SREBP-1c and PPARγ, also exhibited a significant up-regulation in liver of α-LAC-fed mice increasing at 17 % (P=0·019 (ACC1)) and 37 % (P=0·006 (FASN)) respectively of the control mice (Fig. 3(a)). On the contrary, nuclear ChREBP protein did not differ among the groups (P>0·05) (Fig. 3(a)). These results seem to indicate that the α-LAC diet induced DNL activation in liver of the Balb/c mice. Immunostaining of hepatic ACC1 and FASN proteins in α-LAC mice showed an intense staining in the cytoplasm of the hepatocytes especially for FASN, whereas there was a weak staining of both enzymes in control mice. These data confirm that α-LAC intake promotes greater expression of ACC1 and FASN in liver of the Balb/c mice (Fig. 3(b)).
Effect of dietary α-lactalbumin (α-LAC) on de novo lipogenesis in liver of Balb/c mice. (a) Immunoblotting analysis was performed to measure the protein expression of the transcription factors liver X receptor αβ (LXRαβ), sterol regulatory element-binding protein-1c (SREBP-1c), carbohydrate responsive element-binding protein (ChREBP) and PPARγ and of the enzymes acetyl-CoA carboxylase 1 (ACC1) and fatty acid synthase (FASN) in hepatic nuclear and cytosolic fractions of α-LAC (■) and chow-fed (□) mice. A representative blot is shown from three independent experiments with identical results. Values are means (n 6), with their standard errors represented by vertical bars. TFIID, transcriptional factor II D. * Mean value was significantly different from that of the control group (P<0·05; two-sided unpaired t test). (b) Representative photomicrograph of cytosolic ACC1 and FASN protein expression in liver of chow and α-LAC-fed mice (light microscope, magnification 200×). (c) Linear regression analysis between nuclear LXRαβ, SREBP-1c and PPARγ proteins and hepatic NEFA (![]() ), homoeostasis model assessment-estimated insulin resistance (
), homoeostasis model assessment-estimated insulin resistance (![]() ) and serum adiponectin (
) and serum adiponectin (![]() ). The Pearson’s correlation coefficient (R) of each linear regression is represented by vertical bars.* Significant correlations (P<0·05).
). The Pearson’s correlation coefficient (R) of each linear regression is represented by vertical bars.* Significant correlations (P<0·05).
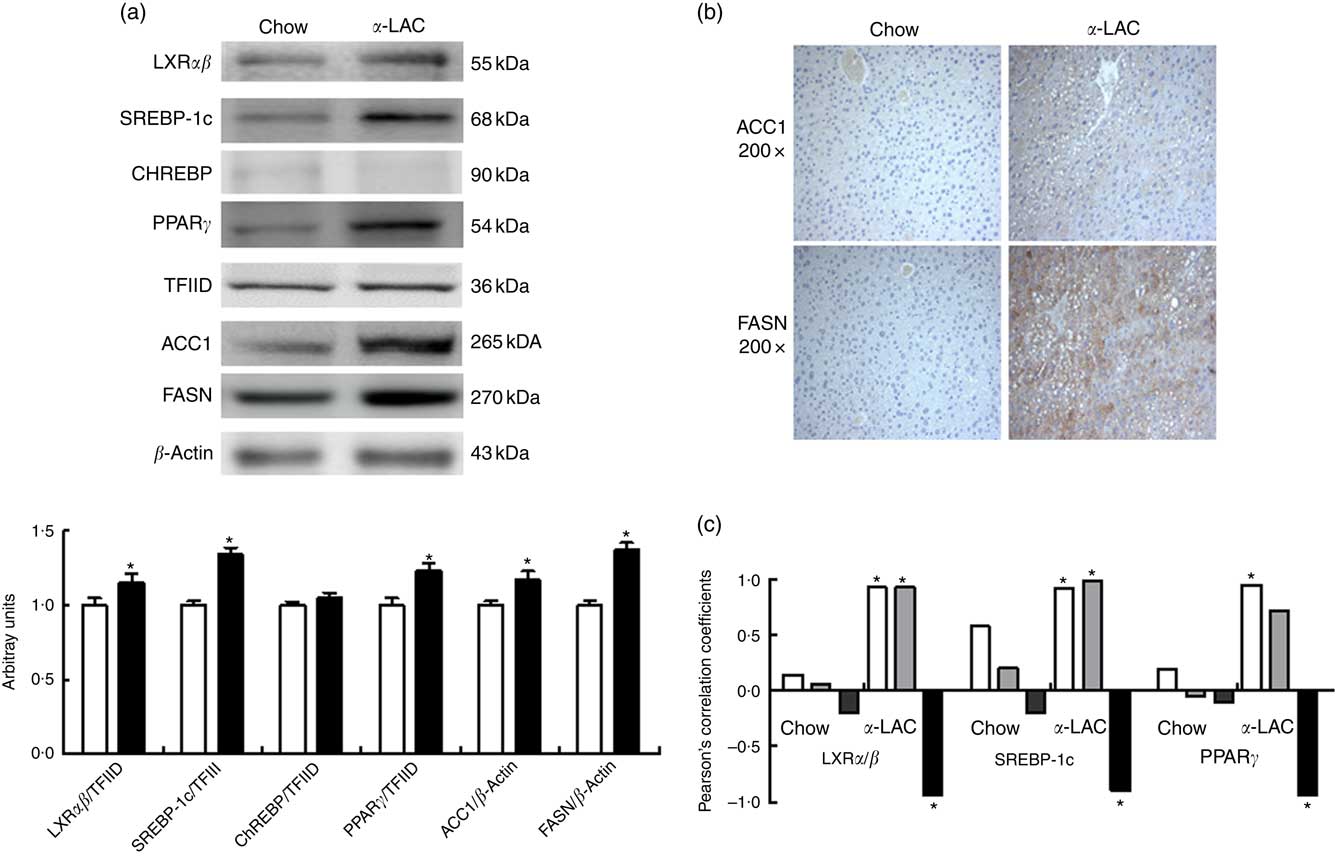
Interestingly, nuclear LXRαβ and SREBP-1c protein expression appears positively associated with both HOMA-IR (LXRαβ, R 0·895; P=0·015; SREBP-1c, R 0·948; P=0·0037) and hepatic NEFA (LXRαβ, R 0·926; P=0·008; SREBP-1c, R 0·921; P=0·009), whereas nuclear PPARγ protein was associated positively with hepatic NEFA (R=0·928; P=0·007) in α-LAC liver (Fig. 3(c)). On the contrary, α-LAC intake elicits a significantly negative correlation between nuclear LXRαβ (R −0·822; P=0·044); SREBP-1c (R −0·897; P=0·016) and PPARγ (R −0·938; P=0·005) proteins and serum adiponectin (Fig. 3(c)). No significant correlations were found in control mice. These results suggest that the DNL activation α- LAC-induced could be controlled by IR, of the hypoadiponectinaemia and of the NEFA overload in the Balb/c mice.
α -Lactalbumin diet reduced hepatic mitochondrial fatty acid β-oxidation in the Balb/c mice
Fat accumulation in liver of α-LAC mice could also result of decreased FAO. The NR PPARα and the enzyme CPT-1 are involved in mitochondrial FAO pathways. Thus, immunobloting was performed to evaluate the pattern of nuclear PPARα and of mitochondrial CPT-1 protein contents in liver of the α-LAC and control groups.
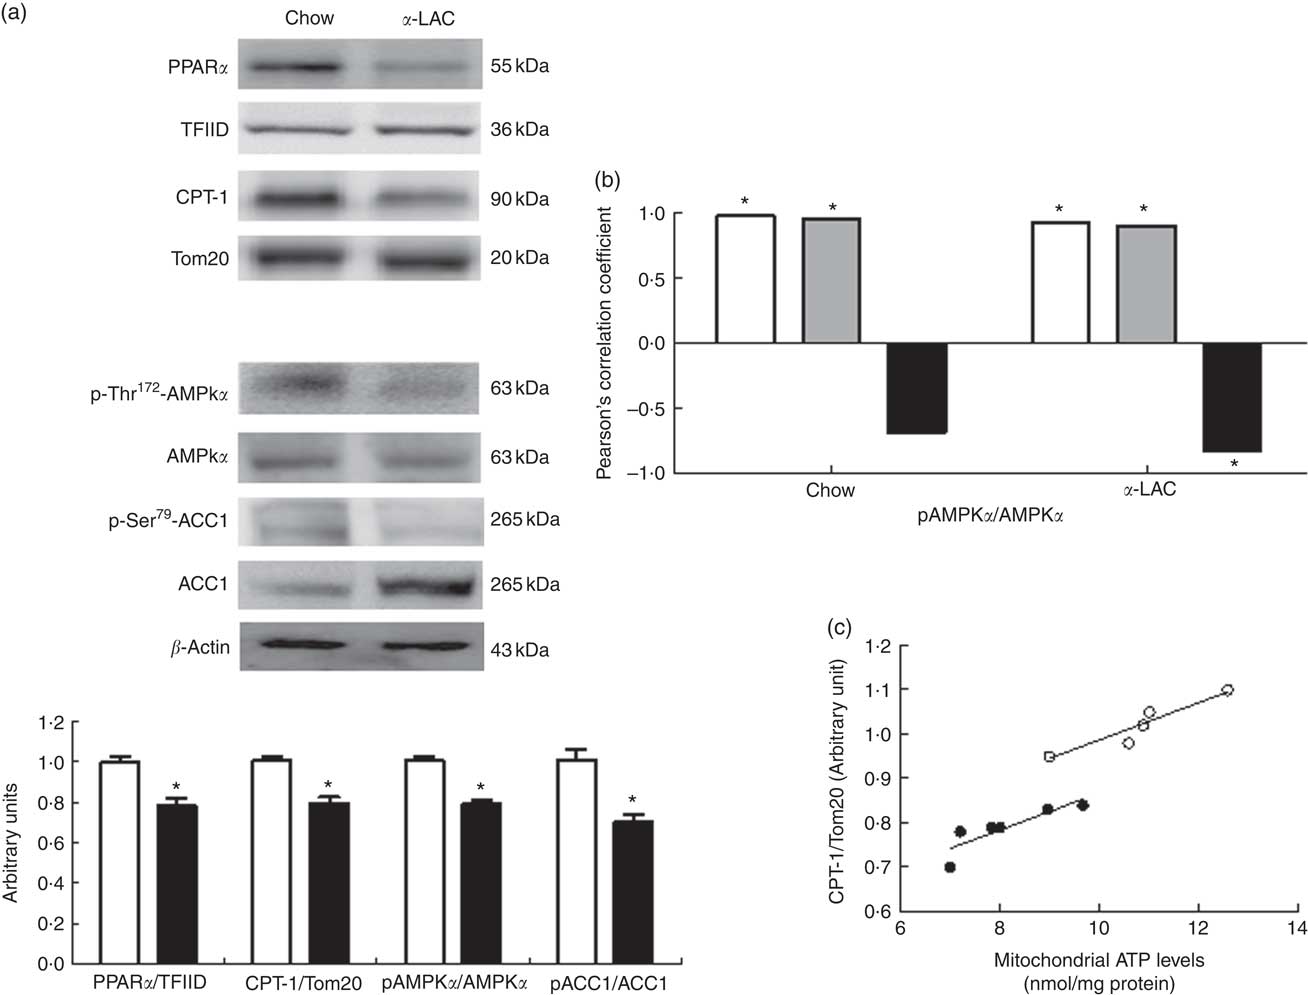
As shown in Fig. 4(a), both nuclear PPARα (22 %; P=0·006) and mitochondrial CPT-1 (21 %; P=0·0001) protein expression were significantly reduced in the liver of the α-LAC-fed mice compared with the chow-fed mice. These results suggest that the reduction of the mitochondrial FAO is involved in the fatty liver α-LAC-induced.
Effect of dietary α-lactalbumin (α-LAC) on fatty acid β-oxidation in liver of Balb/c mice. (a) Immunoblotting analysis was performed to measure the protein expression of nuclear PPARα and mitochondrial carnitine palmitoyltransferase-1 (CPT-1) as well as the cytosolic phosphorylated AMP-activated protein kinase α (AMPKα), total AMPKα, phosphorylated acetyl-CoA carboxylase 1 (ACC1) and total ACC1 proteins in liver of chow (□) and α-LAC-fed (■) mice. A representative inmunoblot is shown from three independent experiments with identical results. Values of PPARα and CPT and the p-AMPKα:AMPKα and p-ACC1:ACC1 ratios are means (n 6), with their standard errors represented by vertical bars. * Mean value was significantly different from that of the control group (P<0·05; two-sided unpaired t test). (b) Linear regression analysis between phosphorylated (p)-AMPKα:AMPKα ratio and nuclear PPARα (![]() ) and PPARγ (
) and PPARγ (![]() ) proteins and mitochondrial CPT-1 (
) proteins and mitochondrial CPT-1 (![]() ) protein. The Pearson’s correlation coefficient (R) of each linear regression is represented by vertical bars.* Significant correlations (P<0·05). (c) Scatterplots of the relationship between mitochondrial ATP levels and CPT-1 protein of chow (○) and α-LAC-fed (●) mice. Each linear regression analysis is represented by its correlation coefficient (R), P value and the fitted regression line (P<0·05).
) protein. The Pearson’s correlation coefficient (R) of each linear regression is represented by vertical bars.* Significant correlations (P<0·05). (c) Scatterplots of the relationship between mitochondrial ATP levels and CPT-1 protein of chow (○) and α-LAC-fed (●) mice. Each linear regression analysis is represented by its correlation coefficient (R), P value and the fitted regression line (P<0·05).
The dysregulation of the liver lipid metabolism α-LAC-induced is linked to inactivation of AMP-activated protein kinase α
To determine whether the prolipogenic effects of the α-LAC intake could be mediated by AMPKα inactivation, the phosphorylation of AMPKα and of its target the enzyme ACC1 were analysed by Western blot in the cytosolic fraction of liver of the experimental mice.
As shown in Fig. 4(a), the α-LAC diet led to a significantly decrease in both p-Thr172-AMPKα (22 %; P=0·005) and p-Ser79-ACC1 (30 %; P=0·0001) respectively, resulting in lower p-AMPKα:AMPKα and p-ACC1:ACC1 ratios compared with the control mice. p-AMPKα:AMPKα ratio changes were positively correlated with nuclear PPARα (α-LAC group; R 0·918; P=0·009; control group; R 0·968; P=0·001) and with mitochondrial CPT-1 (α-LAC group: R 0·895; P=0·015; control group: R 0·941; P=0·005) proteins in both α-LAC and control groups. Also, the p-AMPKα:AMPKα ratio was negatively correlated with the nuclear PPARγ protein in α-LAC liver (R −0·830; P=0·048) (Fig. 4(b)). These results seem to indicate that the impaired AMPKα and ACC1 phosphorylation in liver of the α-LAC mice could contribute to fatty liver by inhibiting FAO and enhancing DNL.
α -Lactalbumin diet increased lipid peroxidation and protein oxidation and decreased cytosolic and mitochondrial ATP levels of the Balb/c mice liver
Increased oxidative stress, a condition associated with fatty liver, can raise the level of LPO (MDA+4-HNE) and/or protein carbonylation. They are the two most common biomarkers of oxidative lipid and protein damage and contribute to the development of hepatocyte steatosis( Reference Serviddio, Bellanti and Vendemiale 16 ). Thus, liver cytosolic and mitochondrial LPO and protein carbonyl (PC) concentrations were determined to assess the α-LAC diet-related lipids and proteins oxidative changes (Fig. 5(a)). The present results showed that mitochondrial (2·45-fold (P=0·000)) and cytosolic (1·65-fold (P=0·000)) LPO and mitochondrial (2·04-fold (P=0·001)) and cytosolic (2·4-fold (P=0·000)) PC levels were higher respectively in the α-LAC liver than control mice. Also, LPO and PC biomarkers were positively correlated with nuclear LXRαβ (LPO: R 0·971; P=0·0012; PC: R 0·890; P=0·016), SREBP-1c (LPO: R 0·931; P=0·007; PC: R 0·975; P=0·0009) and PPARγ (LPO: R 0·920; P=0·009; PC: R 0·976; P=0·0009) proteins and negatively with nuclear PPARα (LPO: R −0·867; P=0·025; PC: R −0·867; P=0·013), mitochondrial CPT-1 (LPO: R −0·816; P=0·045; PC: R −0·928; P=0·007) proteins and the pAMPKα:AMPKα ratio (LPO: R −0·820; P=0·045; PC: R −0·814; P=0·045) (Fig. 5(b)). These results suggest that the α-LAC intake induced oxidative stress in liver which in turn could to modulate the hepatic lipid metabolism of Balb/c mice.
Effect of dietary α-lactalbumin (α-LAC) on lipid peroxidation (LPO), protein carbonylation, antioxidant enzyme system and ATP levels in liver of chow and α-lactalbumin (α-LAC)-fed Balb/c mice. (a) Malonyldialdehyde+4-hydroxynonenal (MDA+4-HNE) (LPO), protein carbonyls and ATP levels in the hepatic cytosolic and/or mitochondrial fractions of α-LAC (■) and chow-fed (□) mice. Values are means (n 6), with their standard errors represented by vertical bars. * Mean value was significantly different from that of the control group (P<0·05; two-sided unpaired t test). (b) Linear regression analysis between both MDA+4-HNE and protein carbonyl levels and nuclear liver X receptor αβ (LXRαβ, ![]() ), sterol regulatory element-binding protein-1c (SREBP-1c,
), sterol regulatory element-binding protein-1c (SREBP-1c, ![]() ), PPARγ (
), PPARγ (![]() ), PPARα (
), PPARα (![]() ) and mitochondrial carnitine palmitoyltransferase-1 (CPT-1) (
) and mitochondrial carnitine palmitoyltransferase-1 (CPT-1) (![]() ) proteins and the phosphorylated (p)-AMPKα:AMPKα (
) proteins and the phosphorylated (p)-AMPKα:AMPKα (![]() ) ratio. The Pearson’s correlation coefficient (R) of each linear regression is represented by vertical bars.* Significant correlations (P<0·05). (c) Immunoblotting analysis was performed to measure the protein levels of hepatic cytosolic and/or mitochondrial superoxide dismutase (SOD), glutathione peroxidase (GPx), glutathione reductase (GR) and catalase (CAT) of α-LAC (■) and chow-fed (□) mice. A representative blot is shown from three independent experiments with identical results. β-Actin (cytosolic fractions) and Tom20 (mitochondrial fractions) were used as internal controls to monitor equal loading of the proteins. Values are means with their standard errors represented by vertical bars. * Mean value was significantly different from that of the control group (P<0·05; two-sided unpaired t test).
) ratio. The Pearson’s correlation coefficient (R) of each linear regression is represented by vertical bars.* Significant correlations (P<0·05). (c) Immunoblotting analysis was performed to measure the protein levels of hepatic cytosolic and/or mitochondrial superoxide dismutase (SOD), glutathione peroxidase (GPx), glutathione reductase (GR) and catalase (CAT) of α-LAC (■) and chow-fed (□) mice. A representative blot is shown from three independent experiments with identical results. β-Actin (cytosolic fractions) and Tom20 (mitochondrial fractions) were used as internal controls to monitor equal loading of the proteins. Values are means with their standard errors represented by vertical bars. * Mean value was significantly different from that of the control group (P<0·05; two-sided unpaired t test).
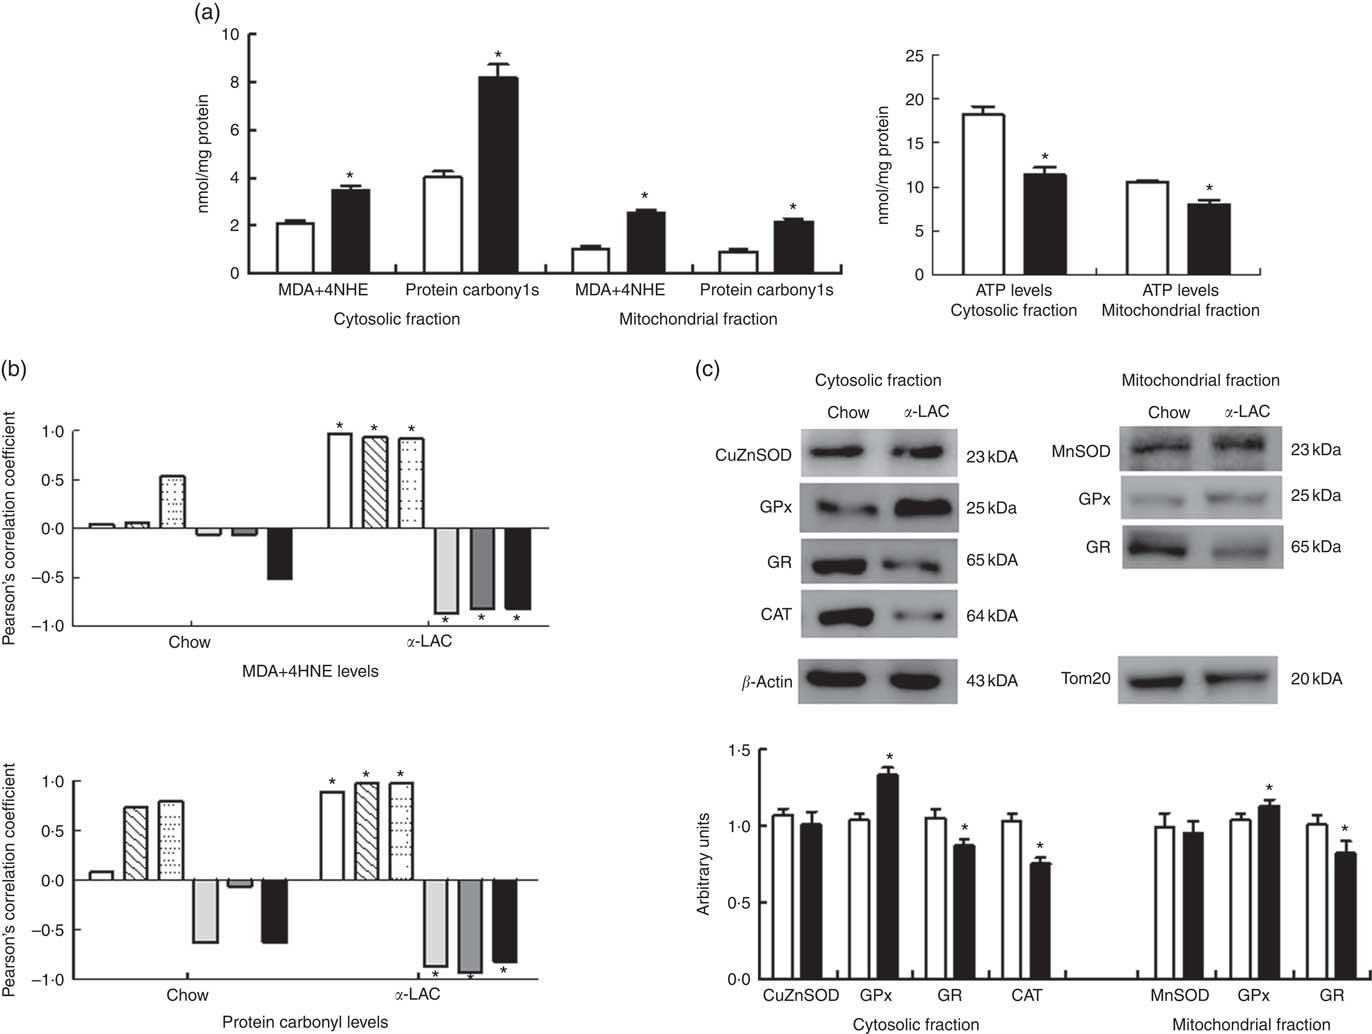
In addition, as a consequence of excessive ROS the efficiency of mitochondrial ATP synthesis was reduced. As shown in Fig. 5(a), the α-LAC intake reduced significantly the hepatic cytosolic (37 %; (P=0·001)) and mitochondrial (24 %; (P=0·03)) ATP levels compared with the control mice. A significantly positive correlation between mitochondrial CPT-1 protein and mitochondrial ATP levels in both α-LAC (R 0·865; P=0·003) and control groups (R 0·956; P=0·026) were found (Fig. 4(c)). It could indicate that the α-LAC intake elicited a hepatic mitochondrial dysfunction related to decrease of mitochondrial FAO.
α -Lactalbumin diet decreased the cytosolic GSH redox status of the Balb/c mice liver
GSH constitutes the major intracellular low molecular weight thiol. GSH is responsible for the maintenance of an intracellular redox balance and detoxification of electrophilic xenobiotics and ROS. GSH and GSSG levels were measured to evaluate the effect of the α-LAC feeding on the cytosolic GSH:GSSG ratio in the liver, as the reduction in the redox status has been observed in human NAFLD.
Both, cytosolic GSH and GSSG contents in liver showed a significant decline in α-LAC mice although the GSH fall was higher (33 %; (P=0·001)) than the GSSG (14 %; (P=0·014)) compared with the control group (Table 4). Consequently, the GSH:GSSG ratio decreased significantly (17·2 %; P=0·05) in the α-LAC group (Table 4), indicating that the α -LAC intake elicited a more oxidised GSH redox status in the liver of the Balb/c mice.
Effect of dietary α-lactalbumin (α-LAC) on GSH, GSSG and the GSH:GSSG ratio and on superoxide dismutase (SOD), glutathione peroxidase (GPx), glutathione reductase (GR) and catalase (CAT) activities and both the SOD:GPx and SOD:CAT ratios of hepatic cytosolic and/or mitochondrial fractions of chow and α-lactalbumin (α-LAC)-fed Balb/c mice (Mean values with their standard errors; n 6)
* Differences were considered significant at P<0·05 between α-LAC and chow groups (two-sided unpaired t test).
α -Lactalbumin diet-related changes in the cytosolic and mitochondrial antioxidant enzyme system of the Balb/c mice liver
The AOE system, including the GSH-dependent enzymes, constitutes an important defense mechanism against the oxidative stress and it has been reported that impairment of AOE functionality was associated with progression of hepatocyte damage( Reference Koek, Liedorp and Bast 67 ). To evaluate changes in the AOE system by the α-LAC intake, we determine the activities and the protein expression of SOD (MnSOD and Cu,ZnSOD), GPx, GR and CAT in the cytosolic and/or mitochondrial fractions of the liver.
A significant decline in the antioxidant enzyme activities except for GPx was induced by the α-LAC diet (Table 4). Thus, the activities of cytosolic Cu,ZnSOD (40 %; P=0·01) and mitochondrial MnSOD (58 %; P=0·000) decreased significantly in the α-LAC liver compared with the control mice (Table 4) but the protein content was unmodified (Fig. 5(c)). This suggests that α-LAC diet induced a lower capacity for dismutation of O2 - to H2O2 in liver. Similarly, the activities and the protein contents of both CAT and GR in the α-LAC liver (ranging between 33 and 39 %) were significantly lower compared with the control mice (Table 4 and Fig. 5(c)), suggesting that the α-LAC intake diminished both the H2O2 scavenging of CAT function and GSH reduction capacity from GSSG of GR in liver.
GPx showed a different pattern: α-LAC diet did not affect GPx activity of the liver (Table 4) but the GPx protein expression was significantly increased in the mitochondrial (15 %; P=0·05) and especially in the cytosolic (33 %; P=0·0001)( Fig. 5(c)) fraction of liver compared with the control values. Thus, the α-LAC diet seems to up-regulate GPx, increasing the enzyme expression but maintaining GPx activity. The significant decrease of the SOD:GPx ratio compared with the control mice (Table 4) in the hepatic cytosolic and/or mitochondrial fractions (45 %; P=0·001 and 66 %; P=0·000 respectively) suggests an enhanced capacity of liver to reduce H2O2 or hydroperoxides.
Discussion
α-LAC a whey protein, has been reported to have nutritive( Reference Trabulsi, Capeding and Lebumfacil 40 ) and health properties related to immunity, cancer, learning and metabolism( Reference Krissanssen 41 ) but its effects on lipid metabolism are controversial. We reported previously that feeding male Balb/c mice a diet containing 14 % α-LAC as the sole protein source induces an atherogenic lipoprotein profile and an increase in abdominal fat pad, associated with low serum arylesterase activity( Reference López-Oliva, Nus and Agis Torres 28 ). In the present investigation we looked at whether this atherogenic effect could be due to a possible α-LAC-induced hepatic steatosis, identifying the molecular mechanisms that regulate the hepatic lipid metabolism and its relationship with the peripheral IR and the hepatic redox status. The main findings of this study were as follows: (1) 14 % α-LAC intake for 4 weeks produced macrovesicular hepatic steatosis related to increased adiposity, atherogenic dyslipidaemia, IR, hyperleptinaemia, hypoadiponectinaemia and enhanced serum TNFα in Balb/c mice; (2) the fatty liver development was due to enhancement of both NEFA influx into the liver and DNL, together with a decrease in FAO; (3)AMPKα inactivation seems to influence both hepatic DNL and FAO in the α-LAC-induced fatty liver and (4) changes in the α-LAC-induced hepatic lipid metabolism were related to a pro-oxidative redox status.
Increased body fat was the main cause of the change in BW in the α-LAC-fed mice. This was a consequence of an anomalous change in dietary protein efficiency leading to a redistribution of body energy from BPG toward BFG, increasing the BW and the abdominal adiposity index, as evidenced by the positive correlation found between BFG and PI (Fig. 1(a)). This higher abdominal adiposity index was related to reduced HDL-cholesterol levels and an increase in the atherogenic index (Fig. 1(b)). The accumulation of intraabdominal fat has been associated with IR, atherogenic dyslipidaemia as well as atherosclerosis and CHD( Reference Gaggini, Morelli and Buzzigoli 42 , Reference Bril, Sninsky and Baca 43 ). Improved peripheral IR due to hyperinsulinaemia in the α-LAC mice, as indicated by the increase in HOMA-IR, leads to the release of NEFA from visceral fat into the portal vein and they are therefore cleared mainly by the liver( Reference Gastaldelli 44 ) contributing to liver fat accumulation. Increased inflow of both pro-inflammatory TNFα and antiesteatotic leptin, and decreased inflow of insulin-sensitising adiponectin in blood draining into the liver, suggest a role for these adipokines in the α-LAC-mediated IR development, reducing peripheral insulin sensitivity( Reference Ziemke and Mantzoros 45 ) as they seem to indicate, the negative and the positive correlation found respectively, between serum adiponectin and leptin and HOMA-IR (Fig. 1(c)). Conversely, beneficial effects of α-LAC improving impaired glucose tolerance via increases in adiponectinaemia in diabetic rats, when they were oral and chronically administered (300 mg/kg) with bovine milk-derived α-LAC for 10 weeks have been reported( Reference Yamaguchi and Takai 46 ). In addition, α-LAC seems to have an anti-inflammatory effect in rats( Reference Yamaguchi, Yoshida and Uchida 47 ). However, in this study excessive NEFA flux to the liver due to diminished insulin responsiveness at the level of the adipocyte, would seem to be an important factor developing fatty liver in α-LAC-fed mice contributing to moderate hepatic steatosis, indicated by high hepatic TAG and NEFA levels and steatotic score which was associated with the atherogenic index (Fig. 2(f)). Also, increased liver fat together with differences in portal flow of amino acids have been reported in 15 % lactalbumin-fed rats compared with casein-fed rats( Reference Rubio 26 ). In addition to NEFA inflow, enhancement of DNL seems to help promote fatty liver in the α-LAC mice, as a consequence of activation of the hepatic TF and enzymes involved in fatty acid synthesis( Reference Tamura and Shimomura 48 ). LXRαβ is a major regulator of FA synthesis( Reference Joseph, Laffite and Patel 49 ). It has been postulated that LXRαβ plays a direct and indirect role in the regulation of lipogenesis, controlling the expression of SREBP-1c and of ChREBP as well as of their target genes (i.e. Acc and Fasn) when they are induced by insulin or glucose respectively( Reference Chen, Liang and Ou 50 ). In the present study, we observed that the α-LAC diet enhanced both nuclear LXRαβ and SREBP-1c protein expression. This suggests that LXRαβ overexpression simultaneously up-regulates SREBP-1c in the α-LAC liver. As a consequence, both hepatic lipogenic enzymes ACC1 and FASN were up-regulated( Reference Talukdar and Hillgartner 51 ), increasing their cytosolic protein expression in the hepatocyte, wherein they were strongly identified inmunohistochemically (Fig. 3(b)). The up-regulation of PPARγ coincided with up-regulation of LXRαβ and SREBP-1c as compared with the control mice, suggesting that high expression of nuclear PPARγ protein in the α-LAC liver induced an important prolipogenic effect. This possibly takes place through enhanced uptake and intracellular binding/transport of NEFA, which may reinforce the lipogenic actions associated with LXRαβ and SREBP-1c, as has been demonstrated in obese patients( Reference Pettinelli and Videla 52 ) and in male C57Bl/6 J mice subjected to continuous intragastric overfeeding with a high-fat liquid diet( Reference Gaemers, Stallen and Kunne 53 ). This hepatic DNL enhancement could be related to the insulin action, which seems to persist in IR states and to the detrimental effect of the hepatic NEFA overload, as suggested by the strong positive correlation found between the nuclear LXRαβ and SREBP-1c proteins and HOMA-IR and hepatic NEFA, and also between the nuclear PPARγ protein and hepatic NEFA in α-LAC liver (Fig. 3(c)). These relationships have also been reported in obese patients( Reference Pettinelli and Videla 52 ), in casein and soy protein fed-rats( Reference Ascencio, Torres and Isoard-Acosta 54 ) and in high-fructose fed insulin-resistant rats( Reference Mohammadi, Gholamhoseinian and Fallah 55 ). In addition, according to Handa et al.( Reference Handa, Maliken and Nelson 56 ) who suggested the participation of a reduced adiponectin-AdipoR2/LKB1/AMPKα signalling pathway in the development of NALFD in rat, adiponectin appears as a controller of DNL in α-LAC liver as suggested by the negative correlation between the nuclear LXRαβ, SREBP-1c and PPARγ proteins and serum adiponectin (Fig. 3(c)).
Our results also suggest that the reduction of the mitochondrial FAO contributed to α-LAC-induced hepatic steatosis and that both the NR PPARα and the energy sensor AMPKα are involved in the process. We observed that the α-LAC diet down-regulates both PPARα and AMPKα in liver, as evidenced by the significant reduction in both nuclear PPARα and mitochondrial CPT-1 protein expression and by the fall in the AMPKα phosphorylation at the Thr172 site (inactivation) as compared with the control (Fig. 4(a)). However, it has been reported that PPARα gene expression was unmodified in liver of 49 % lactalbumin-fed Wistar rats( Reference Gregersen, Bystrup and Overgaard 27 ), whereas soya protein diet up-regulated PPARα and CPT-1 gene expression in the liver of Zucker rats( Reference Tovar, Torre-Villalvazo and Ochoa 57 ). ACC1 is a substrate for AMPKα and its activity is negatively regulated by phosphorylation( Reference Brownsey, Boone and Elliott 58 ). Thus, the decrease of hepatic p-Thr172-AMPKα in the α-LAC liver induced lower ACC1 phosphorylation at the Ser79 site, leading to ACC1 activation and consequently to possibly higher production of malonyl-CoA, supporting the notion of mitochondrial FAO inhibition via allosteric regulation of CPT-1. This suggests that α-LAC intake elicits an impairment of long-chain fatty acyl-CoA inflow into mitochondria( Reference Louet, Chatelain and Decaux 59 ) through PPARα/AMPKα signalling pathway inactivation, as the significant association between nuclear PPARα protein and the p-AMPKα:AMPKα ratio found in our study (Fig. 4(b)) suggests that they were coordinately dysregulated. In addition, the inactivation of the PPARα/AMPKα signalling pathway could contribute to the enhancement of the DNL in α-LAC liver, not only via ACC1 but also via PPARγ, as shown by the negative correlation found between the nuclear PPARγ protein and the p-AMPKα:AMPKα ratio (Fig. 4 (b)). On the contrary, inhibition of PPARγ transcriptional activity by activated AMPKα has been reported in hepatoma cells( Reference Sozio, Lu and Zeng 60 ).
In the α-LAC liver, reduced FAO via CPT-1 was associated with lower cytosolic and mitochondrial ATP levels, the major product of mitochondrial oxidative phosphorylation (Fig. 4(c)). This was likely as a consequence of the impairment of mitochondrial respiratory chain activity, which could contribute to α-LAC-induced NALFD through increased ROS, leading to an imbalance in pro/antioxidant molecules and to a more oxidative environment( Reference Lazarin, Ishii-Iwamoto and Yamamoto 61 ). In the present study, the increase of by-products of lipid (MDA+4-HNE) and protein (PC) oxidation indicates the prooxidant potential of the α-LAC diet, which could impair liver lipid metabolism. A role for oxidative stress in α-LAC-induced hepatic lipid metabolic dysregulation was suggested by both the positive and negative correlation found between nuclear LXRαβ, SREBP-1c and PPARγ proteins and between nuclear PPARα and mitochondrial CPT-1 proteins and the p-AMPKα:AMPKα ratio respectively and LPO and PC biomarkers (Fig. 5(b)). For instance, modulation of the lipogenic TF by free radicals during hepatic steatosis in humans( Reference Kohjima, Enjoji and Higuchi 62 ), specific adducts between 4-HNE and CPT-1 in a NAFLD model( Reference Serviddio, Giudetti and Bellanti 63 ) and increased production of ROS and cytotoxic aldehydic derivatives by repression of AMPKα have all been reported( Reference Qiang, Xu and Zhang 64 ). In addition, the hepatic AOE system was altered by the α-LAC diet. The reduction in mitochondrial and cytosolic SOD activities, coupled with a decrease of cytosolic CAT, suggests a functional fall in both the capacity of dismutation of O2 − to H2O2 and in the capacity to reduce H2O2 in the hepatocyte. Then again, the unexpected maintenance of GPx activity (decrease in SOD:GPx ratio) and the increase in its protein expression, suggests that GPx could help to scavenge H2O2 faster than it is formed. Nevertheless, in this study the antioxidant GPx function seems compromised. The maintenance of GPx activity, consistent with sustained capacity to oxidise GSH to GSSG, combined with the decrease in both GR protein and activity, produces a decrease in the cytosolic GSH:GSSG ratio, altering the GSH redox status in the α-LAC liver( Reference Jones 65 ). In this connection, Merry et al. ( Reference Merry, Tran and Dodd 66 ) demonstrated that hepatocyte GPx-1-deficiency improves hepatic glucose metabolism and reduces steatohepatitis in mice despite high hepatic levels of H2O2 and evidence of increased systemic oxidative stress. Thus, the α-LAC-associated changes in the GSH:GSSG ratio demonstrate that α-LAC intake induced a pro-oxidising shift, contributing to a more oxidative cellular environment in the hepatic cytosol of Balb/c mice. In this connection, Koek et al.( Reference Koek, Liedorp and Bast 67 ) reported that overproduction of ROS in NAFLD may directly deplete antioxidant molecules, leading to apparently insufficient antioxidant capacity to compensate for oxidative stress. In parallel with these oxidative abnormalities, the serum ALT activity was increased suggesting that α-LAC intake promotes hepatocellular injury.
An important issue addressed in the present study was the potential effect of dietary α-lactalbumin upon the metabolic regulators involved in DNL and the FAO in liver, that demonstrates for the first time, to our knowledge the prolipogenic effect of a 14 % dietary α-LAC intake. However, the variability among diets could be a limitation in the present study. Although the chow diet is used commonly in many NALFD-related dietary studies( Reference Zou, Yan and Shi 68 , Reference Torres-Villalobos, Hamdan-Pérez and Tovar 69 ), it is possible that differences in macro and micronutrients and in the consumed energy between the diets could contribute to the differences observed in the liver lipid metabolism. Finally, there are several possible causes for the detrimental effects elicited by α-LAC diet on hepatic lipid metabolism: the amount of protein in the diet (14 %) could induce NAFLD as a high PI has been shown to reduce hepatocellular lipid deposition and revert steatosis in mice( Reference Garcia-Caraballo, Comhair and Verheyen 70 ); also the very high chemical score of α-LAC with an essential amino acids (EA), account for 63·2 % (specially of tryptophan, cysteine and lysine) against 51·4 or 52·5 % of casein or whole milk protein which could justify their lipotoxicity( Reference Heine, Klein and Reeds 71 ). Accordingly, recent studies demonstrate that elevated circulating branched-chain amino acids (BCAA) are strongly associated with NAFLD-related metabolic disorders( Reference Lynch and Adams 72 ). However, contradictory results have been published regarding the role played by EA in lipid metabolism. Thus, both a low BCAA diet( Reference Bai, Greene and Li 73 ) and a diet high in ketogenic EA( Reference Noguchi, Nishikata and Shikata 74 ) appear to enhance liver lipid metabolism and improve hepatic steatosis through down-regulation the hepatic expression of lipogenic genes particularly ACC1, FASN and stearoyl-coA desaturase 1 in female broiler chickens and in high-fat diet-fed male ob/ob mice respectively. Interestingly, this repression in ob/ob mice appears to be mediated by the SREBP-1c pathway. Then again, there are differences in the protein absorption kinetics and in the portal flow rates of amino acids( Reference Rubio 26 ) to be considered. Therefore, given the importance of α-LAC in the human and animal diet further research is required to determine their effects on lipid metabolism.
All together, the present study provides evidence that a 4-week diet containing 14 % of α-LAC intake induced liver steatosis in Balb/c mice as a consequence of increased systemic IR and hepatic lipid metabolism dysregulation, shifting the FAO toward fatty acid synthesis. Dietary α-LAC induced LXRαβ/SREBP-1c/PPARγ signalling activation and PPARα/CPT-1 pathway inhibition and this mechanism was probably mediated by AMPKα inactivation. The prolipogenic effect of dietary α-LAC was associated with a more oxidative liver environment caused by prooxidant/antioxidant imbalance.
Acknowledgements
The authors thank Mr Pedro Alcántara for histological tissue processing. The authors also thank Dr Luis Ortega-Medina, expert pathologist of Hospital Clínico Universidad Complutense (UCM), Madrid, Spain for performing the histopathological evaluations. The authors thank Alistair Ross and Christopher Mulhern for revising and correcting the English language.
The present research was performed under the financial support of the project PR41/06-14972 of the UCM and Banco de Santander.
M. E. L.-O. and E. M.-M. contributed jointly to the conception, design and perform the experiment, data analysis and interpretation and manuscript writing. A. G. contributed to analysis and interpretation of data and manuscript preparation.
The authors declare that there are no conflicts of interest.


