

Higher n-3 fatty acid (FA) intakes and blood levels are associated with reduced risk for CHD, especially sudden cardiac death( Reference Harris and Von Schacky 1 , Reference De Caterina 2 ). Fat intake is one of the most difficult diet components to be accurately and precisely assessed( Reference Arab 3 ). People tend to alter their usual diet during recording period or under-report their total fat intake due to social implications( Reference Lichtman, Pisarska and Berman 4 ). Relative intake of individual FA was even harder to estimate as it is hard to remember exactly the amount of each food consumed and sometimes it is also hard to match a meal prepared with a unique recipe to the food code in database. To address these limitations, FA levels in body tissues are proposed as useful biomarkers for estimation of dietary FA intake and as actual risk factors for CVD( Reference Harris 5 ). Levels of specific FA can be expressed either as absolute concentrations (e.g. mg/dl or µmol/l) or as proportion (mol% or wt% of total FA). In this paper, we focus on the papers reporting n-3 FA weight percentages of the total FA.
n-3 FA weight percentages can be measured in many lipid pools, among which total lipids (TL) and phospholipids (PL) in plasma and erythrocytes are the most commonly used. Other lipid depots in which human FA composition have been reported include adipose tissue, cholesteryl esters, TAG, platelets, mononuclear cells, individual lipoprotein classes, whole blood and plasma phosphatidylcholine, but due to the relative paucity of studies reporting comparisons among these pools, we have focused on plasma TL, PL and erythrocytes only. Both plasma and erythrocyte n-3 biomarkers have been used in large-scale epidemiological studies and population surveys, erythrocyte n-3 biomarkers exhibit less within person variability, their ability to reflect longer-term exposure and the simpler laboratory procedure (compared with PL assays)( Reference Harris and Thomas 6 ). Two recent review papers have documented comprehensively the normal range and distribution of plasma and erythrocyte n-3 biomarkers, and also demonstrated their comparability with conventional dietary methods( Reference Hodson, Skeaff and Fielding 7 , Reference Serra-Majem, Nissensohn and Øverby 8 ). However, the conversion between plasma and erythrocyte n-3 biomarkers was not addressed. Without such quantitative conversion ratios, it is a challenge to compare n-3 biomarkers reported in different lipid pools from different studies.
n-3 FA, like n-6 and trans-FA, cannot be endogenously synthesised from carbohydrates( Reference Baylin and Campos 9 ). The main source of EPA and DHA is oily fish in Western diets( Reference Gebauer, Psota and Harris 10 ). Plant tissues and oils are good sources of linoleic acid (18 : 2n-6) and α-linolenic acid (ALA)( Reference Gebauer, Psota and Harris 10 ). Linoleic acid can ultimately be converted to arachidonic acid (20 : 4n-6) and, through the same series of enzymes, ALA can be converted to EPA( Reference De Caterina 2 ). Further conversion from EPA to DHA involves complex reactions, although the conversion is limited( Reference Hussein, Ah-Sing and Wilkinson 11 ). Besides competing for the elongation and desaturation enzymes, n-6 FA also compete with n-3 FA to incorporate into PL. Age, sex, BMI, dose and duration of n-3 FA supplement were reported to affect the n-3 FA composition in different lipid pools( Reference Walker, Browning and Mander 12 , Reference Walker, West and Browning 13 ).
In this study, we aimed to derive conversion ratios between plasma and erythrocyte n-3 biomarkers including EPA, DHA, DPA and total long-chain n-3 PUFA, including ALA using meta-analysis of values reported in the literature followed by validation with both reported values and measured data from the laboratory. Our assumption is that the ratio of n-3 FA weight percentage between plasma (TL/PL) and erythrocytes remains stable, although the weight percentage in plasma or erythrocytes will vary across different factors such as age, sex, BMI, dose and duration of n-3 FA supplement. Such conversion ratios will be useful for interpreting results reported in the literature and for planning of future nutritional epidemiological studies.
Methods
Literature search
A systematic literature search (1950 to October 2014) of PubMed, Embase and the Cochrane Library of Systematic reviews was performed to identify all published studies that reported both plasma and erythrocyte FA weight percentages in humans. Methodological studies comparing different FA quantification methods with human samples were also included. The search was not restricted to any language or publication date. Key words used for search comprised synonyms and abbreviations of red blood cell, RBC, erythrocyte, plasma and fatty acids. No further limit to any specific FA or study type applied to maximise the sensitivity of the literature search. Further studies were identified through hand searching of original articles on subjects found by the computerised search. Only studies that report both plasma and erythrocyte n-3 FA weight percentages in the same individuals without diseases known to influence FA metabolism were identified. Only data from control subjects were used from case–control studies. A total of 1855 articles were identified by the literature search; 579 duplicate and non-human studies were excluded before first round review. Of the 1276 records remained, 181 were identified for second round review based on the exclusion of 1095 records, that is, unrelated reports, reviews and no access to full-text articles. Another ninety-four studies were excluded after full-text screening, that is, not healthy participants, FA of interest was not reported in plasma and/or erythrocytes. Finally, fifty-six studies were included in meta-analysis with a further exclusion of twenty-one studies mainly due to the format of data reported (e.g. absolute concentrations instead of weight percentages, median and interquartiles instead of means and standard deviations, and graphic presentations without numeric values) (Fig. 1).
Flow chart of the selection of studies for the systematic review and meta-analysis. FA, fatty acids; TL, total lipids; PL, phospholipids.

Study selection and data extraction
The literature and identified studies for possible inclusion were reviewed by two researchers independently. Disagreements were resolved by negotiation and consensus. To be included studies had to report n-3 FA levels either in PL or TL (or both) in plasma/serum and erythrocytes; and mean n-3 FA levels had to be expressed as wt% with some measure of variability (standard deviations, standard errors or 95 % CI). Studies were excluded if all participants were <2 years old or had diseases or conditions known to affect FA metabolism (e.g. diabetes, hepatic or renal dysfunction, and those undergoing drug treatment for hyperlipidaemia). No restrictions were applied to study design and sample size.
The following data were extracted from each study: author name, year published, study design, study location, type of healthy participants in the study, sample size, percentage of male participants, average age of participants and n-3 FA weight percentages, including means and standard deviations of EPA, DHA, DPA and total n-3 PUFA (including ALA) in plasma and erythrocytes. Extracted data within a study were combined if more than one group of participants fulfilled the inclusion criteria (e.g. results being reported separately for men and women within a cross-sectional survey). The baseline data were utilised if n-3 FA weight percentages were measured at multiple time points. For case–control studies, data from control participants were extracted and used for conversion ratio derivation; data from cases were also extracted for validation purpose. The smaller sample sizes were included in situations where sample sizes differed between plasma and erythrocyte measurements due to technical difficulties with one or the other analyses. Data were extracted independently by two authors (X. F. H. and S. K. S.), and discrepancies were discussed with a third author (H. M. C.).
Laboratory analysis
To validate the calculated conversion ratios for EPA, DHA and DPA, we measured erythrocytes and plasma PL/TL FA composition in archived blood samples. In all, fifty random samples received at OmegaQuant Analytics, LLC were used in these experiments, for comparison between n-3 FA composition in TL and erythrocytes, and comparison between plasma PL and erythrocytes. Methods of analysis of the erythrocytes, PL and TL were previously reported( Reference Harris, Pottala and Sands 14 ). These samples were from healthy adults between 18 and 49 years of age, both male and female, with a BMI<30 kg/m2. All three methods used boron trifluoride in methanol as the methylating reagent and all were analysed on a GC2010 (Shimadzu Corporation) using a 100-m SP-2560 column (Supelco).
Statistical analysis
Two sets of comparisons were made in this paper: Comparison A (plasma PL with erythrocytes) and Comparison B (plasma TL with erythrocytes). For each comparison, conversion ratios based on meta-regression were derived for EPA, DHA, DPA and total n-3 PUFA. Both unadjusted and adjusted ratios (controlling for participants’ mean age, percentage of male participants in the study and study design) were reported. We adopted the non-constant option as it returned a single ratio between plasma and erythrocyte n-3 FA levels, which is easier to use than ratio plus constant term. Traditional mean differences (absolute difference between n-3 FA weight percentages in plasma and erythrocytes) were also estimated( Reference Friedrich, Adhikari and Beyene 15 , Reference Friedrich, Adhikari and Beyene 16 ). For studies that reported standard errors or 95 % CI instead of standard deviations, standard deviations was calculated according to formula 1 and formula 2. For studies with multiple groups being included in this study, mean values and standard deviations were combined according to formula 3. Mean values and standard deviations of n-3 PUFA weight percentages were log transformed to better approximate normal distribution which is essential for meta-analysis. Fixed-effects meta-regressions were estimated when there was no heterogeneity or moderate heterogeneity (I 2<50 %) and random-effect models otherwise( Reference Higgins, Thompson and Deeks 17 ).
 $$\scale70%{{\rm SD}}\,{\equals}\,\scale70%{{\rm SE}}{\times}\sqrt N ,$$
 $$\scale70%{{\rm SD}}\,{\equals}\,\sqrt N {\times}({\rm upper\, limit}\,{\minus}\,{\rm lower\, limit})/3 \!\cdot\! 92,$$
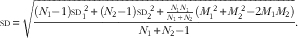 $$\scale70%{{\rm SD}}\,{\equals}\,\sqrt {{{\left( {N_{1} {\minus}1} \right)\scale70%{{\rm SD}}_{1} ^{\hskip2pt2} {\plus}\left( {N_{2} {\minus}1} \right)\scale70%{{\rm SD}}_{2} ^{\hskip2pt2} {\plus}{{N_{1} N_{1} } \over {N_{1} {\plus}N_{2} }}(M_{1} ^{\hskip2pt2} {\plus}M_{2} ^{\hskip2pt2} {\minus}2M_{1} M_{2} )} \over {N_{1} {\plus}N_{2} {\minus}1}}} .$$
Validation of conversion ratios
We validated our derived conversion ratios by comparing the predicted erythrocyte n-3 FA weight percentages to reported/measured values with external data. We first used reported mean n-3 FA weight percentages from cases in case–control studies (previously excluded from the meta-analytic derivation of conversion ratios) for this validation purpose. All the conversion factor derivation and validation were performed with aggregate data from each study as the analysing unit. It has been discussed that the correlations at individual level may be different from the correlations observed at group level( Reference Schwartz 18 ). To remove such potential ecological fallacy, we further validated our conversion ratios with measured n-3 FA weight percentage from individual samples. Agreement was presented as percentage of difference between mean predicted and measured values. Paired t test was used to compare the predicted and measured values (P<0·05 was seen as significant). Scatter plots were also used to show the agreement between predicted and measured erythrocyte EPA, DHA and DPA values from blood samples. All statistical analyses and meta-analyses were performed with STATA 13.0 (StataCorp LP).
Results
Literature search results and study characteristics
Of the fifty-six studies retrieved, thirty-four articles reported n-3 FA weight percentages for plasma PL and erythrocytes (1749 participants)( Reference Antalis, Stevens and Campbell 19 – Reference Vlaardingerbroek, Hornstra and de Koning 52 ); and twenty-two articles reported n-3 FA weight percentages for plasma TL and erythrocytes (1037 participants)( Reference Harris, Pottala and Sands 14 , Reference Catalán, Rodríguez and Ras 53 – Reference Sullivan, Williams and Meyer 73 ). In all, twenty-one were case–control studies, fifteen were cross-sectional surveys and the rest were randomised controlled trials. n-3 FA weight percentages in erythrocytes were not separated into PL and TL because virtually all of the FA in erythrocytes are in the membrane which is comprised only of PL (online Supplementary Table S1). The summary characteristics of the included studies, and the reported mean values of EPA, DHA, DPA and total n-3 PUFA are presented in Table 1. The ages of the participants spanned pre-teens through adults in their mid-60s. There were nearly equal male and female participants for both comparisons; fifty out of fifty-six studies reported EPA and DHA, thirty-seven reported DPA and twenty-seven reported total n-3 PUFA. n-3 FA weight percentages were erythrocytes>plasma PL>plasma TL.
Characteristics of included studies comparing n-3 fatty acid weight percentage between plasma phospholipids and erythrocytes and plasma total lipids (TL) and erythrocytes – by type of study

–, Not reported in the paper.
* Sample size, sometimes slightly differs for plasma and erythrocyte measurement, smaller value reported here. Total sample size is 1949.
† Mean age in years (mean, median or average of upper and lower limit).
‡ Total n-3 includes α-linolenic acid.
§ Sample size, sometimes slightly differs for plasma and erythrocyte measurement, smaller value reported here. Total sample size is 1037.
Comparison A: n-3 fatty acids in plasma phospholipids and erythrocytes
Both unadjusted and adjusted conversion ratios between plasma PL and erythrocytes for the n-3 FA of interest are shown in Table 2 (column 2). As n-3 FA weight percentages are higher in erythrocytes than plasma PL (except for EPA), the conversion ratios for the other FA are all higher than 1. The conversion ratios remained stable after adjusting for study design, participants’ mean age and percentage of male participants. Meta-regression results are presented in Fig. 2(a), (c), (e) and (g) for EPA, DHA, DPA and total n-3 PUFA, respectively. The conversion ratios for all n-3 FA adhered closely to the predicted line and were not affected by the baseline plasma n-3 FA levels. Another set of mean difference conversion factors (quantifying the absolute difference in weight percentage) between n-3 FA weight percentages in plasma PL and erythrocytes are presented in the online Supplementary Table S2 and Fig. S1–S4.
Meta-regression to estimate EPA weight percentage in erythrocytes from plasma phospholipids (a) and from plasma total lipids (b). Meta-regression to estimate DHA weight percentage in erythrocytes from plasma phospholipids (c) and from plasma total lipids (d). Meta-regression to estimate DPA weight percentage in red blood from plasma phospholipids (e) and from plasma total lipids (f). Meta-regression to estimate total n-3 PUFA weight percentage in erythrocytes from plasma phospholipids (g) and from plasma total lipids (h). ○, mean measured EPA weight percentage in erythrocytes and plasma (phospholipids in (a) and total lipids in (b)), with the cycle size reflecting the statistical weight of the study in the meta-regression. The slopes of the solid lines represent the ratios between fatty acids (FA) weight percentage in erythrocytes and plasma (phospholipids in (a), (c), (e), (g) and total lipids in (b), (d), (f), (h)). Non-constant meta-regression was adopted to derive easy to use conversion factors. EPA_rbc, EPA in erythrocytes; EPA_ppl, EPA in plasma phospholipids; EPA_ptl, EPA in plasma total lipids; DHA_rbc, DHA in erythrocytes; DHA_ppl, DHA in plasma phospholipids; DHA_ptl, DHA in plasma total lipids; wt%, weight percentage of all fatty acids; DPA_rbc, DPA in erythrocytes; DPA_ppl, DPA in plasma phospholipids; DPA_ptl, DPA in plasma total lipids; Total Omega-3_rbc, total n-3 PUFA in erythrocytes; Total Omega-3_ppl, total n-3 PUFA in plasma phospholipids; Total Omega-3_ptl, total n-3 PUFA in plasma total lipids.

Conversion ratios between n-3 fatty acid (FA) weight percentage in plasma and erythrocytes (Ratios and 95 % confidence intervals)

Comparison B: n-3 fatty acids in plasma total lipids and erythrocytes
Similarly, conversion ratios between plasma TL and erythrocytes for the n-3 FA of interest are shown in Table 2 (column 4). EPA is the same in plasma TL and erythrocytes; whereas all the other n-3 FA weight percentages are higher in erythrocytes, hence the conversion ratios are all higher than 1. The conversion ratios were affected by participants’ mean age and percentage of male participants. Meta-regression results are presented in Fig. 2(b), (d), (f) and (h) for EPA, DHA, DPA and total n-3 PUFA, respectively. The conversion ratios were stable across different baseline plasma n-3 FA levels. Another set of mean difference conversion factors (quantifying the absolute difference in weight percentage) between n-3 FA weight percentages in plasma TL and erythrocytes are presented in online Supplementary Table S2 and Fig. S5–S8.
Heterogeneity and publication bias
All the reported conversion ratios are based on random-effect estimates because heterogeneities were detected for all outcomes (I 2 statistics >80 %). Subgroup analyses were performed to study the potential confounding effects of participants’ mean age, percentage of male participants, type of study, sample size and n-3 FA concentration dependence. We found that heterogeneity varied across study design, with smallest heterogeneity in case–control studies and largest in randomised controlled trials. However, the estimated conversion ratios were not affected by the study design. Sample size and the FA weight percentages did not have any significant effects on the estimation of conversion ratios. To study the small study effects, the impact of the elimination of each individual study on the pooled estimates was studied. Participants’ mean age and percentage of male participants affected the ratios between plasma TL and erythrocytes, but not for plasma PL and erythrocytes. The results indicated that the conversion ratios between plasma PL and erythrocytes were stable.
Validation of conversion ratios
Reported mean n-3 FA from cases in nineteen case–control studies were used for validation of the unadjusted conversion ratios. Predicted values with conversion ratios showed very good agreement with reported values (Table 3). The conversion ratios neither tended to over- nor under-estimate the erythrocyte n-3 FA weight percentages systematically. The relative errors across all predicted values are within 10 % of the reported values.
Validation of conversion ratios between plasma and erythrocytes based on literature reported valuesFootnote *

* Validation of the unadjusted conversion factors was based on mean values from each study.
† Relative error=(estimated value−reported value)/(reported value).
Measured EPA, DHA and DPA in fresh samples were used to validate our conversion ratios at an individual level (Table 4 and Fig. 3). Fig. 3 shows good agreement between the measured erythrocytes EPA, DHA, DPA and predicted values from both plasma PL and the plasma TL. Results in Table 4 show that relative errors for plasma PL converted values are smaller than plasma TL converted ones. The relative errors between measured and converted EPA and DHA are smaller than DPA.
Measured erythrocyte n-3 fatty acid weight percentages and estimated values from plasma with conversion factors: (a) erythrocyte EPA v. from plasma phospholipid (PL); (b) EPA from plasma total lipid (TL); (c) DHA from plasma PL; (d) DHA from plasma TL; (e) DPA from plasma PL and (f) DPA from plasma TL.

Validation of conversion ratios between plasma and erythrocytes using laboratory-measured valuesFootnote * (Mean values and standard deviations)

* Validation of the unadjusted conversion factors was based on fifty individual samples. Compare estimated values with measured values in erythrocytes.
† Relative error=(estimated value−measured value)/(measured value).
Discussion
We have derived workable conversion ratios for erythrocyte and plasma n-3 FA weight percentages based on a systemic review of data reported in fifty-six studies and confirmed their usefulness using both literature data and measured individual samples. Both erythrocyte and plasma n-3 FA weight percentages reflected dietary intake reasonably well as they cannot be synthesised endogenously de novo ( Reference Lands 74 ). n-3 FA incorporated in plasma lipoproteins are exchangeable with erythrocyte membranes( Reference Reed 75 , Reference Marks, Gellhorn and Kidson 76 ). It is generally believed that plasma n-3 FA weight percentages respond quickly to changes in dietary intake (in days), whereas erythrocyte n-3 FA weight percentages reflect a more long-term exposure (in weeks). However, there are data showing that n-3 FA weight percentages in plasma PL and erythrocytes respond in similar time frame but with differing washout characteristics(25). To derive useful conversion ratios, the plasma and erythrocyte n-3 FA weight percentages needed to be measured in the same blood sample collected from the same participant. The majority of studies we found with such information were cross-sectional surveys with blood n-3 FA measurement, case–control studies in which n-3 FA were considered as a predictor of the outcome and randomised controlled trials with n-3 FA supplements. Meta-analysis is most frequently used to pool together continuous parameters like blood pressure or binary parameters like relative risk or OR in pharmaceutical or nutritional intervention studies. Recently, meta-analysis is increasingly used to combine other types of data, like proportion, prevalence, incidence rate and diagnostic accuracy( Reference Nyaga, Arbyn and Aerts 77 – Reference Jorm and Jolley 80 ). The validity of meta-analyses with these input parameters is similar to the traditional meta-analyses as long as input data are properly transformed to approach normal distribution. Meta-regression is superior to regular regression in this project as it takes into account the sample size and study precision.
In plasma, TL contain TAG, cholesteryl esters, NEFA as well as PL, whereas erythrocytes contain primarily PL( Reference Lands 74 ). n-3 FA contents of each of these lipid pools are commonly reported, but most studies only reported PL as it is generally accepted that PL closely represents tissue levels( Reference Hodson, Skeaff and Fielding 7 ). Our pooled mean n-3 FA weight percentages were similar to previously reported values. For example, for DHA they were 3·7 % in plasma PL, 2·0 % in plasma TL and 4·4 % in erythrocytes compared with 3·3, 2·4 and 3·9 %, respectively, in the literature( Reference Hodson, Skeaff and Fielding 7 ). We found n-3 FA weight percentages were higher in erythrocytes than plasma, except for EPA. The observed differences between erythrocyte and plasma TL were larger than those between erythrocyte and plasma PL. This also agrees with previous literature showing that n-3 FA weight percentages were diluted in plasma TL by other lipid pools which are richer in SFA( Reference Hodson, Skeaff and Fielding 7 ).
We found that the conversions between plasma PL and erythrocytes are more accurate than conversions between plasma TL and erythrocytes. One explanation is that the lipid compositions in plasma PL and erythrocytes are more similar. Another explanation is that there are more studies to compare n-3 FA between erythrocyte and plasma PL (thirty-four v. twenty-two studies in our search results). More data provide better estimates of conversion ratios. That may also explain why the conversions for EPA and DHA are more accurate than DPA. Participants’ age and sex were found to influence the conversion ratio from plasma TL to erythrocytes, but not for plasma PL. The reason needs further investigation. We adopted ratios to convert n-3 FA between plasma and erythrocytes because the data showed clearly that n-3 FA weight percentages varied across populations. A fixed absolute difference may yield biased conversions for people with n-3 FA around the lower or upper end of n-3 FA distribution. Other researchers who prefer the absolute differences can find a full set of conversion factors in the online Supplementary table and figures.
Besides the derivation of conversion ratios, we also validated their performances using two sets of external data: reported mean n-3 FA weight percentages from cases in the case–control studies (where only control data were used to derive the ratios) and with measured individual fresh blood samples. The unadjusted conversion ratios were validated as we did not want to over-interpret the meta-regression results. With the reported mean values, we were able to test the applicability of our conversion ratios in people with various conditions that are likely to affect FA metabolism. With the measured values in fresh samples, we were able to test the performance of conversion ratios at individual level. The converted values agreed with reported/measured values well at both the aggregate level and the individual level. The relationship between n-3 FA in erythrocyte and plasma PL/TL has also been investigated by other researchers using individual measured values( Reference Geppert, Kraft and Demmelmair 28 , Reference Stark 44 , Reference Stark, Beblo and Murthy 81 – Reference Metcalf, Cleland and Gibson 83 ). However, they did not report any coefficients of the associations. Therefore, it is not possible to compare with the results of this study. The only study that provided quantitative estimate of erythrocyte EPA+DHA from plasma PL and whole blood( Reference Harris and Von Schacky 1 ) reported a coefficient plus a constant number. Such regression results did not generate a single conversion factor and limit their applications. These previous studies as well as this study observed discrepancies between erythrocytes and plasma n-3 FA reported at the individual level. This is likely a result of modelling uncertainty, individual variations on n-3 FA metabolism or random measurement errors during FA analysis. Therefore, the developed conversion factors are useful for population studies and not suitable for individual data.
The present analysis adds to the existing n-3 FA literature in three ways. First, it provides a tool to compare n-3 FA measured in different blood lipid pools, because it is very common that n-3 FA were measured in only one compartment (either erythrocytes or plasma) in large-scale studies. This helps researchers to evaluate and compare n-3 intake across populations, or the same population over time. Second, it helps to understand and interpret the discrepant findings on n-3 FA and health effects. For example, the relative risk of coronary outcomes comparing top and bottom thirds of plasma PL DHA was reported to be 0·75 (95 % CI 0·62, 0·92) (from the Cardiovascular Health Study), whereas 1·31 (95 % CI 0·87, 1·97) comparing plasma TL DHA (from the Japan EPA Intervention Study)( Reference Chowdhury, Warnakula and Kunutsor 84 ). Now researchers will know the two studies actually showed exactly the same effect size, rather than inconsistent findings. Third, the conversion ratios derived from the present study help to create a harmonised n-3 FA estimate, which is essential to yield unbiased combined effect estimate for pooled analysis or meta-analysis. Without such ratios, the n-3 FA literatures with erythrocyte measurement and with plasma measurement have either to be analysed separately, or to be combined with the assumption that they are the same. Both of which results in substantial information loss and may lead to biased pooled estimate.
There are several strengths in our study. First of all, we conducted a comprehensive literature search using a high-sensitivity searching strategy with very general searching terms. We also did not set restrictions on study characteristics. All these efforts aimed to identify as much literature as possible. Second, the participants included in our studies came from different countries with diverse ethnic background, covered a wide age range with equal proportion of both sexes. This ensures the applicability of our conversion ratios for future studies in different populations. Third, our meta-analyses covered all the major n-3 FA in plasma and erythrocytes. Fourth, we estimated the conversion ratios for the conversion from plasma PL and TL to erythrocytes separately. This will help future studies to compare their results of FA measured in either plasma PL or plasma TL. Finally, our conversion ratios were validated using external data on cases which allows us to generalise our conversion ratios from healthy population to patients with a variety of different diseases. The validation using laboratory-measured individual samples also adds confidence to applicability of the derived conversion ratios.
Our study also has several limitations: first, large heterogeneities were detected in nearly all the n-3 biomarkers investigated. The wide coverage of population resulted in better representativeness but at the same time also higher heterogeneities. Small sample sizes of studies included might be another important source of heterogeneities. The relatively variable conversion ratios between plasma TL and erythrocytes need further investigation. Second, detailed n-3 FA measurement procedures (e.g. esterification method) and total number of FA identified were not clearly stated in some included studies. This may raise the concern that the weight percentages of n-3 FA in one study may not be comparable to another. However, this concern would be kept to minimal as (1) we calculated the ratio within each study first and (2) the total numbers of FA identified were the same for plasma and erythrocyte samples. Third, we only focus on n-3 FA in erythrocytes and plasma in the paper. Further works on other FA (e.g. n-6 PUFA), or other compartment (e.g. adipose tissue), would help to understand the whole picture. The conversion ratios capture the numeric relationship between n-3 FA in plasma and erythrocytes. Potential users should also bear in mind that the mechanisms or dose–response relationship between different n-3 biomarkers and certain health outcomes may differ.
In conclusion, we derived conversion ratios between n-3 FA weight percentages in plasma TL and PL v. erythrocytes. The differences between converted values and reported/measured n-3 FA weight percentages were within 10 % for most of the conversions. With this set of conversion ratios, researchers, nutritionists or public health professionals who are interested in dietary effects on FA profiles of different populations can compare and interpret their data with existing those reported in literatures regardless of measuring methodology. It also provides potential tool to summarise n-3 FA literatures measured in different lipid pools.
Acknowledgements
This work is supported by Northern Contaminant Program of the Government of Canada and the Canada Research Chair Program. The authors’ responsibilities are as follows: X. F. H. conducted literature search and literature screening, extracted and analysed the data and drafted the manuscript; S. K. S. extracted the data and judged study quality of included studies; H. M. C. screened the literature, supervised the data analysis and co-rewrote the paper. W. S. H. performed the laboratory-based analyses and edited the final paper; H. M. C. had primary responsibility for final content. All authors read and approved the final version of the manuscript.
W. S. H. is the owner of OmegaQuant Analytics LLC which specialises in FA analysis. None of the other authors has any conflicts of interest to declare.
Supplementary material
For supplementary material/s referred to in this article, please visit https://doi.org/10.1017/S0007114517001052


