


Introduction
As the global population faces growing environmental and humanitarian pressures, there is an increasing interest in understanding the extent to which the concentration of people in larger cities has a favourable or unfavourable impact on access to basic resources, such as water, available per capita (for an introduction, see Bettencourt Reference Bettencourt2021). Despite considerable interest among social scientists, anthropologists and economists in how societies marshal technological solutions (such as aqueducts) to overcome the demographic, social and economic constraints imposed by the lack of clean and fresh water, most classical archaeologists and ancient historians have been surprisingly pessimistic about the value of exploring the relationship between estimated population sizes of ancient cities and the delivery rates of aqueducts. This is despite the value of including the Roman Empire within this discussion, owing to its sheer demographic scale, unprecedented preindustrial economic growth and the originality and enduring importance of the technological solutions that enabled this.
The Latin aquae ductus can be translated as ‘leading of water’. Drawing upon Greek, Etruscan and Carthaginian influences, Roman aqueducts led water—primarily in underground channels (Figure 1a) but also over bridges (Figure 1b) and through inverted siphons—under the power of gravity to a single town or villa (very rarely aqueducts supplied two or even up to 10 different locations, Keenan-Jones Reference Keenan-Jonesin press). Aqueducts supplied monumental fountains, bathing complexes, elite houses, industrial premises, water-powered machines and networks of public street-side fountains. More than 1700 such aqueducts are known, testifying to their essential role in Roman urban living (Passchier et al. Reference Passchier, Sürmelihindi and Spötl2016).
a) Underground section of the Roman aqueduct of Nicopolis at Agios Georgios, Greece (photograph: Albinfo, CC0 1.0); b) Pont du Gard bridge of the Nîmes Roman aqueduct, France (image: Benh LIEU SONG, CCASA 3.0).

Despite the apparent ubiquity of these structures, proposals for the use of delivery rates of aqueducts (which are strictly flow rates, in units of volume per unit of time) as a proxy for the size of populations in ancient Roman cities (and particularly in the context of Britain and North Africa), have been extensively criticised for several reasons (Lloyd & Lewis Reference Lloyd and Lewis1977; Duncan-Jones Reference Duncan-Jones1978; Stephens Reference Stephens1985; Wilson Reference Wilson, Bowman and Wilson2011; Hanson Reference Hanson2016). The first difficulty, which is mainly technical, revolves around the challenges of using surviving evidence to estimate delivery rates. The second difficulty relates to establishing a reliable baseline for the quantity of water that would have been consumed during the imperial period by the average person over the course of a day or a year, since this varied dramatically according to an individual’s wealth and status. Moreover, an additional unknown quantity of water would have been used for industrial production, public entertainment, civic embellishment and imperial and elite power display—or simply not used at all. Where suggestions can be made, they are not easily transferable to other parts of the Roman world due to differences in climatic, social and economic conditions. This means that scholars have been forced to rely on evidence from other periods and places or on contemporary estimates for baselines, which might not be appropriate.
The next difficulty is that we would expect the quantity of water derived from aqueducts to have differed considerably depending on the amount of water that could have been captured from other sources, such as rainwater, watercourses and groundwater (e.g. wells). A fourth difficulty is whether we would expect the average patron or architect/engineer to have had sufficient information about the demographic scale, and sufficient concern about any future developments, to have been able to estimate the quantity of water that was required by individual cities with any accuracy. It is also important to question whether the architects and engineers who built water-related infrastructure would have had the technical understanding and practical ability required to build aqueducts that met these demands. Finally, any discussion of the delivery rates of aqueducts is bound up with wider debates concerning the nature of imperial authority and the projection of power, the scale and intentions of civic beneficence/munificence (generally referred to as euergetism in Greek and Roman contexts), and public health and personal hygiene. All this has led to a great deal of scepticism about the extent to which we can detect any relationship between the estimated populations of cities and the capacities of aqueducts.
The degree of scepticism about the link between the provision of water and population is nonetheless still quite surprising, for two reasons. The first is the widespread importance of water to almost all aspects of urban life, making it unlikely that patrons and architects would not attempt to design and build aqueducts that were broadly related to the scale of the demand that existed, especially given the importance for civic authorities of maintaining order and creating a functional urban environment (Keenan-Jones et al. Reference Keenan-Jones, Motta, Garcia and Fouke2015). Frontinus, writing as Rome’s water commissioner (curator aquarum) about AD 100, for example, was concerned that supply should meet the demand at Rome, and sought to maximise the amount of water supplied. He claimed to be able to account for every drop of water in the aqueduct system to deter theft and fraud, and scheduled maintenance outside the dry summer period when demand was greatest (Frontinus Reference Frontinus and Bennett1925: 122.3). Vitruvius, providing advice on architecture and engineering in the first century BC, laid out his ideal water-distribution system so that the demand for public water would always be met (Vitruvius 1914, On Architecture, 8.6.2), and contractors employed in the same century by Cicero’s brother Quintus could estimate areas of irrigable land based on the amount of water available on a property (Shackleton Bailey Reference Shackleton Bailey2002: 3.1 = SB21).
The second is the evidence that has emerged over the past few years for the existence of a series of relationships between general infrastructure, social and economic conditions, and estimated population sizes in both cities in general and ancient cities in particular (Smith Reference Smith and Gyucha2019; Lobo et al. Reference Lobo, Bettencourt, Smith and Ortman2020; Hanson Reference Hanson2023). This has led to a growing recognition of the scale of the effects of different inhabited areas and their estimated populations on the nature of life within them, particularly given the existence of non-linear relationships between the infrastructure and various social and economic outputs of settlements and their estimated populations (this is reflected in the fact that the former tend to increase more slowly, and the latter tend to increase more quickly, than estimated population).
We are also now in a unique position to re-evaluate these assumptions, given that it is possible to suggest a series of much more realistic estimates for the population sizes of ancient cities (Hanson Reference Hanson2023). These estimates are based on a combination of wider theoretical models, empirical evidence for the numbers and densities of residential units within a sample of cities from across the Greek and Roman world, and common, but well-founded, assumptions about the average numbers of individuals within pre-industrial households (Hanson & Ortman Reference Hanson and Ortman2017). This development is important as it provides us with evidence for the estimated size of populations of cities that is not based on measuring other aspects of the built environment—such as the capacities of public buildings and shared infrastructure—allowing us to re-evaluate the relationship between the delivery rates of aqueducts and the numbers of individuals that dwelt within cities (Hanson Reference Hanson2023).
In this article, we therefore begin by briefly reviewing the support for these wider theoretical models and the basis for the estimated populations of cities, before assembling estimates for the capacities (the only estimate of delivery rate for which there is sufficient data) of the aqueducts associated with these cities. In contrast to previous scholars, we argue that there is indeed evidence for a systematic relationship between the delivery rates (in this case, capacities) of a selection of aqueducts and the estimated populations of the cities with which they are associated. However, this relationship is not linear; the capacities of aqueducts increase more slowly than the estimated populations of sites, as observed for other forms of infrastructure, providing a potential explanation for why this relationship has not been apprehended before and has been dismissed by scholars.
Settlement scaling theory
Research over the preceding decades has identified various relationships between population size, infrastructure and social and economic conditions in contemporary cities across the world, including the USA, the UK, Europe, Brazil, India and China (Bettencourt Reference Bettencourt2021). One of the most notable aspects of these relationships is that they all tend to increase at similar rates, with slopes, or exponents, which are generally very close to either 5/6 or 7/6, although there is a small number of relationships that have slopes of either 2/3 or 4/3. An important corollary is that these relationships are not linear. Infrastructure tends to increase slower than the population of cities, as illustrated, for instance, by the total surfaces of roads within metropolitan statistical areas (MSAs) within the USA. This means that larger cities generally use fewer resources per capita than their smaller counterparts. Meanwhile, social and economic outputs tend to increase faster than the populations of cities, as is well illustrated by the gross metropolitan products (GMP) of MSAs within the USA. This means that larger cities generally tend to create more opportunities, again per capita, than their smaller counterparts. As we will see below, an important exception to this, however, is the relationship between the amount of water that is consumed by households and the estimated population size of contemporary cities, which is almost exactly linear (in other words, these are almost exactly proportional to one another), as illustrated, for instance, by recent data from China (Bettencourt Reference Bettencourt2021).
This has led to the creation of a series of general formal (i.e. mathematical) models, which seem to predict the values for systems of cities remarkably well (Smith Reference Smith and Gyucha2019; Lobo et al. Reference Lobo, Bettencourt, Smith and Ortman2020; Hanson Reference Hanson2023). These rely on two key concepts: 1) settlements can be conceived as social networks embedded within the built environment; and 2) the inhabitants of cities must balance the benefits of interacting with others and the costs of moving around the built environment. For this reason, these models are appropriate to both modern and non-modern, and urban and rural, contexts (Smith Reference Smith and Gyucha2019) and should be applicable broadly across the Greek and Roman worlds (for a review, see Hanson Reference Hanson2023). Application of these models to ancient cities reveals that relationships generally have slopes, or exponents, of about either 1/3 or 2/3, meaning that, although they do not increase at exactly the same rate as in modern contexts, they do increase at comparable rates.
Estimated populations
Estimates of population size used here are drawn from a previous study (Hanson & Ortman Reference Hanson and Ortman2017) and are based on the numbers of residential units within a selection of 52 sites, drawn from throughout the Greek and Roman worlds and dating between the classical and late Roman periods (c. fourth century BC to sixth century AD). In keeping with other contexts and the figures suggested by ancient censuses, the number of inhabitants within these residential units is estimated assuming an average of five individuals per household (see Hanson & Ortman Reference Hanson and Ortman2017). These figures are used alongside other information, such as the size of the area studied and the total extent of each site, to estimate the inhabited areas, population densities and population sizes of each settlement, allowing investigation of the relationships between each of these variables.
Using this method, a systematic relationship between the inhabited areas and estimated populations of cities can be observed (Hanson & Ortman Reference Hanson and Ortman2017), which is not only consistent with the theoretical models discussed above but also with empirical findings from other contexts. This relationship is slightly sublinear, reflected in the slope, or exponent, of the relationship, which is about 2/3. This means that the size of inhabited areas of Greek and Roman cities increased at a slightly slower rate than their population size, with the result that cities became denser as they increased in size. Although it is important to treat these findings with an element of caution, this relationship has been used to suggest a series of estimates for the population size of other sites based on their inhabited areas, with the results generally conforming to the small number of previously published estimates that are largely accepted by scholars (e.g. at Rome; Hanson & Ortman Reference Hanson and Ortman2017).
This research therefore lays a key groundwork for future work (including this article), as the method not only provides new estimates for the population size of settlements based on their inhabited areas but also offers separate evidence for the size of sites, making possible the investigation of the relationship between site size and other characteristics, such as their infrastructure and socioeconomic outputs (Hanson Reference Hanson2023). Furthermore, as this relationship is fundamentally a product of how the social networks of settlements change as they increase in size, we would expect to find a number of other relationships between the various aspects of cities that can be measured from historical and archaeological material and their estimated populations, with promising implications for aqueducts.
Capacities of aqueducts
The core data used in this article are derived from the Atlas Project of Roman Aqueducts (ROMAQ; https://www.romaq.org/), which aims to identify and collect all available information from existing publications—drawing on more than 4000 sources in 23 languages—concerning known aqueducts within the geographic area of the Roman Empire, between 400 BC and AD 400, in the form of an online database and geographic information system.
At the time of writing, the ROMAQ database includes a total of just over 1300 aqueducts, which are associated with nearly 1000 sites, including large cities and towns and various other sites such as villas and sanctuaries, providing evidence for a large cross-section of sites (Figure 2). The database includes diverse information, including the name of each aqueduct (and of the ancient and modern sites with which they are associated), the date of construction/use, total length (in km), the width and height of the channel (in m) and the flow rate (in m3/day) and gradient (in m/km). The total number of structures for which information about flow rates is available is, however, comparatively low, due to the difficulties outlined above in establishing these values from standing remains. As a result, relevant information is available for only just under a 10th of all documented structures, partially limiting the scope of this article.
Locations of the case studies used in this article. The shaded area shows the geographic extent of the Roman Empire in AD 117 (figure by authors).

Although it is not possible to directly measure the amount of water that was originally conveyed by these aqueducts, it is possible to use their geometry and roughness characteristics, or proxies such as deposited sinter, to provide estimates. In general, the depth and velocity of flow, and hence the flow rate (water volume carried per unit of time), in an aqueduct depend on both the water supplied to the aqueduct (itself depending on the upstream catchment collecting water as river flow or groundwater flow), which generally changed over time, and the characteristics of the aqueduct itself, namely its slope (driving the flow through gravity) and its resistance to flow (shape and roughness of the channel), which usually vary along its course (Keenan-Jones et al. Reference Keenan-Jones, Motta, Garcia and Fouke2015, Reference Keenan-Jones, Motta, Garcia, Sivaguru, Perillo, Shosted and Fouke2022; Motta et al. Reference Motta, Keenan-Jones, Garcia and Fouke2017). Some aqueducts carried hard water, leaving mineral deposits known as sinter or travertine. Where these survive, they can be used to estimate the water depth and sometimes the flow rate. Where they do not, only a maximum capacity (i.e. a maximum flow rate that can be carried) of the aqueduct can be estimated, the accuracy of which is dependent on how well the dimensions of the aqueduct are known over its full course (Blackman Reference Blackman1978). Unfortunately, it is not always clear how the delivery rates specified in the database were estimated. We therefore checked a sample of these values, which suggested that they are all maximum carrying capacities, but this uncertainty must be borne in mind.
Two changes were made to the information drawn from the ROMAQ database: the capacities for eight aqueducts were added from existing literature and the flow rates at Rome were modified. As with most scholars, the compilers of the database used Di Fenizio’s (Reference Di Fenizio1916) estimates for the aqueducts of Rome (Keenan-Jones et al. Reference Keenan-Jones, Motta, Garcia and Fouke2015). These estimates are not derived from carrying capacities, but by making assumptions about the value of the quinaria, the unit of flow rate used by Frontinus, c. AD 100. These assumptions are, however, problematic for a number of reasons and substantially overestimate the flow rates of each structure (Keenan-Jones et al. Reference Keenan-Jones, Motta, Garcia and Fouke2015, Reference Keenan-Jones, Motta, Garcia, Sivaguru, Perillo, Shosted and Fouke2022; Motta et al. Reference Motta, Keenan-Jones, Garcia and Fouke2017). We therefore use Blackman’s (Reference Blackman1978) maximum carrying capacities for the four major aqueducts of Rome and Fahlbusch’s (Reference Fahlbusch1982, Reference Fahlbusch and Frontinus Gesellschaft e1988) and Garbrecht and Manderscheid’s (1992) uniform flow estimations for another five, which are comparable (Keenan-Jones et al. Reference Keenan-Jones, Motta, Garcia and Fouke2015). For the remaining two aqueducts in Rome, the Aqua Alsietina (2 BC) and the Aqua Traiana (AD 109), there are no existing flow-rate estimates, so we assign the average figure for Rome to each one.
Aqueducts with associated flow rates listed in the ROMAQ database were matched against Hanson’s (Reference Hanson2016) database of cities in the Roman world in the imperial period, which includes evidence for the inhabited areas of sites that can then be used to estimate their population sizes (Hanson Reference Hanson2016; Hanson & Ortman Reference Hanson and Ortman2017). This ensured that our analysis included only aqueducts that are: 1) associated with an estimated capacity; 2) associated with cities; and 3) have estimates for their inhabited areas and therefore population size (see Figure 2).
One of the challenges with attempting to estimate the total quantity of water that could be supplied to settlements by aqueducts is the fact that we do not necessarily have evidence for all the structures that we know existed. To resolve this issue, we first calculated the average capacity of the extant structures within each site, and then counted the total number of structures for which we have material, textual, epigraphic or numismatic evidence, again within each site. Multiplication of these two statistics then provided an estimated value for the total quantity of water supplied by aqueducts that should be a close approximation of the original reality. Although the results are something of a compromise, this method should not make any difference to the figures for the settlements about which we know the most, while giving the best possible estimate for those settlements that are currently less well known.
Information about the numbers of aqueducts associated with each settlement was obtained from the ROMAQ database. Although these tallies are by no means perfect, and could be improved by further work, they are sufficient for our purposes here. Numbers of recorded aqueducts were also checked against Hanson’s database, and were adjusted in only a couple of cases. In particular, we have not included branches of aqueducts within cities, as this would risk artificially inflating the estimate for the total amount of water that was supplied by aqueducts in each case.
For the sake of simplicity, we used the mid-point of any ranges of values, which are relatively common in the dataset. Exploration of the impact of using the minimum and maximum figures is beyond the scope of this article but could be used to suggest a most likely figure based on a probabilistic approach. This is unlikely, however, to make much difference to the results below. It is also important to remember that this database does not include any evidence for the quantity of water that could have been derived from sources other than aqueducts, such as watercourses, rainwater or groundwater.
The overall relationship between the estimated capacities of aqueducts and the estimated population size of sites was assessed using ordinary least squares regression, employing logarithmically transformed values. The results of this assessment are available in Table 1 and Figure 3, and the relevant data can be found in the online supplementary materials (OSM).
Results from the regression of estimated total discharge, average discharge and number of aqueducts against estimated population.

All regressions were performed using ordinary least squares regression on log-transformed values. CI: confidence interval.
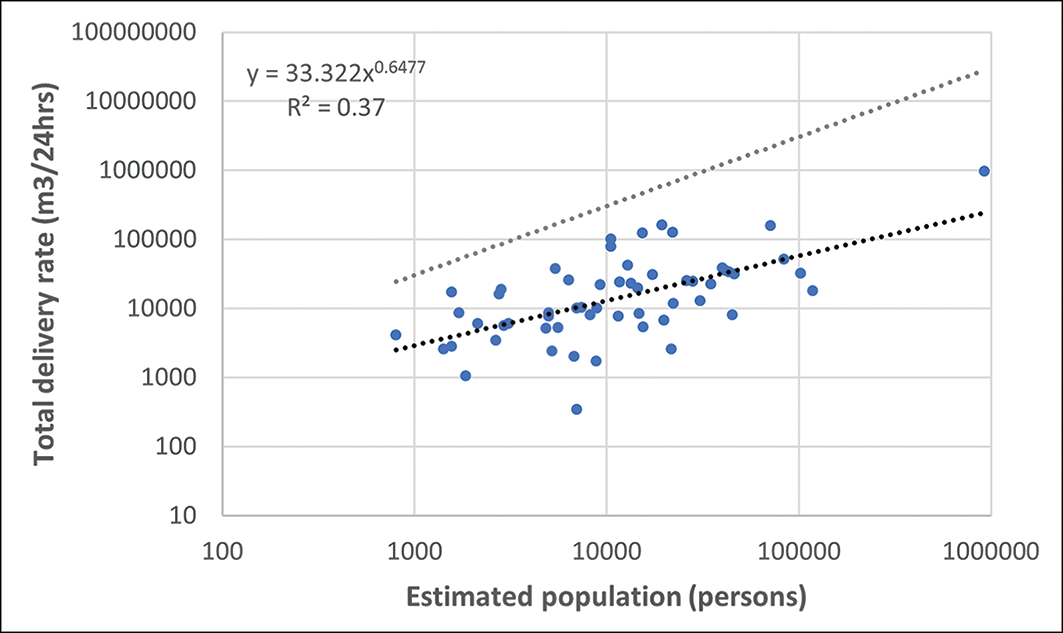
The relationship between the estimated total capacities (m3 per 24 hours) of aqueducts and the estimated populations of selected cities. The line of best fit, which is sublinear, is shown as a black dotted line with associated equation and R2. The grey dotted line reflects a hypothetical linear relationship, for reference (figure by authors).

Results and discussion
It is possible to derive estimates for the capacities of aqueducts for 57 different sites, including both Rome and a cross-section of other sites from different parts of the empire, most of which date to either the first or the second century AD. These sites cover a wide range of settlement size, from nearly one million inhabitants (Rome) to just under 1000 (Hippus). As we would expect, the capital had the largest number of aqueducts (11), while most other sites had only one or two, with an average figure of 1.89. The capital also had the largest total capacity (expressed in metres cubed per 24 hours) at just under 1 000 000m3/24hrs of water. This is based on estimates for the delivery rates of nine aqueducts (all in m3/24hrs): the Aqua Appia (312 BC) 48 000; the Aqua Anio Vetus (272 BC) 140 000; the Aqua Marcia (144 BC) 95 000; the Aqua Tepula (125 BC) 12 000; the Aqua Iulia (33 BC) 39 000; the Aqua Virgo (22 BC) 53 000; the Aqua Claudia (AD 38) 190 000; the Aqua Anio Novus (AD 38) 170 000; and the Aqua Antoniniana/Alexandrina (c. AD 217) 49 000. It is important to point out, however, that the impressive capacity at Rome is not just a result of the greater number of aqueducts, but also a product of the fact that most of these structures, with the sole exception of the Aqua Tepula, were able to supply a greater amount of water than their counterparts elsewhere. The average capacity of the aqueducts across the 57 studied sites was much lower, at 44 000m3/24hrs, and the smallest capacity (estimated for the city of Savaria) is miniscule in comparison at just 345m3/24hrs.
The results not only reveal that there is a consistent relationship between the capacities of aqueducts and the estimated populations of sites—very much overturning previous, more pessimistic, expectations—but also that the relationship conforms almost exactly with the theoretical models and wider empirical data described above (Figure 3). This relationship is also statistically significant, with an R2 that is comparable with other published scaling relationships, including those comparing population with the seating capacities of theatres and amphitheatres and the footprints of macella (markets) (Hanson & Ortman Reference Hanson and Ortman2020; Hanson Reference Hanson2024). This suggests that the formal (mathematical) models described above, and that are represented by the line of best fit, explain a similar amount of the variation within the data. It is important to point out, however, that this relationship is not linear; the capacities of aqueducts increase a little more slowly than the estimated populations of cities, with a slope, or exponent, of almost exactly 2/3 (0.65).
These results are perhaps slightly surprising, given that we might have expected the maximum quantity of water intended to be provided by these structures to have increased at the same (or an even greater) rate than the population of each settlement. Any increase in the size of the population might be expected to have required, at the very least, a proportional increase in the amount of water that was provided, as seems to be the case for contemporary cities across the world. Yet, at the same time, the results are reassuring, given that the water-carrying capacities of these structures increase at almost exactly the same rate as other forms of infrastructure in cities in general and ancient cities in particular, tracking the total sizes of public spaces such as fora and agorai and the dimensions of street networks (Hanson et al. Reference Hanson, Ortman, Bettencourt and Mazur2019), which, of course, makes intuitive sense.
The results have substantial implications for our understanding of the functioning of aqueducts, since they not only reveal the care that was taken to ensure the provision of clean and fresh water but also highlight important differences in the relationship between the supply of water and population between ancient and modern contexts, with the former being sublinear and the latter linear. Although this might be explained to some extent by considering the use of other water sources, it is extremely unlikely that there is a consistent relationship between the amount of water derived from other sources and the sizes of sites, meaning that alternate water provisioning in ancient cities cannot account for the discrepancy. These results therefore suggest that the architects, engineers, magistrates or local benefactors of larger cities either allowed for a smaller quantity of water per capita than those in smaller cities, or that smaller cities were generally more likely to be over-supplied with this vital commodity, potentially revealing different expectations about how water was accessed and used. Finally, it is important to note that the capacities of these aqueducts do not increase more quickly than the estimated population sizes of cities, as we would expect them to do if they were a direct proxy for the total amount of wealth produced by the residents of cities (such as, for example, if a greater amount was consumed for other means). These results therefore suggest that an increase in the capacities of aqueducts should not be seen as a reflection of an increase in the standards of living or quality of life within cities, although the provision of (relatively) clean and (relatively) fresh water would in itself represent an improvement.
An important implication of the approach to capacity estimation employed here is that it allows us to suggest a baseline figure, reflecting the maximum amount of water that would have been used by each individual on a day-to-day basis, without the need to work out how much would have been used for different activities, or the minimum demand deemed necessary to stimulate the construction of aqueducts. This baseline figure, derived by estimating the pre-factor (or y-intercept) of the relationship between the capacities of aqueducts and the estimated population sizes of cities, is about 33m3/24hrs per person, a volume that equates to 33 000 litres per day. Although this initially seems like a vast amount, it is important to remember that this figure represents the maximum amount that could have been supplied by each aqueduct, much of which was consumed by bathing complexes and monumental fountains. Additionally, since water would have been flowing constantly, and most of it would have overflowed onto the streets and been used to flush away effluent and other waste, this figure should not be judged against the baseline amount of water supplied by modern facilities.
As we estimated the total capacities of aqueducts by multiplying the average capacities of the best-known structures by the numbers of aqueducts that we know existed, this also allows us to explore how these measures vary with population. This reveals that the numbers of aqueducts generally increase a little more slowly than their average capacities, with slopes, or exponents, of about 0.18 and 0.47, respectively, although it should be noted that these relationships are not quite as strong as the main relationship. This also makes sense, given that it is generally more economical to design and build structures with a larger capacity than to design and build multiple structures.
Reflecting on the variation within the aqueduct capacity/estimated population relationship or the reasons why individual sites deviate from the underlying relationship either positively or negatively (values that are known as residuals), it is worth briefly noting that Rome is a significant positive outlier. The capital received a slightly greater volume of water than we might expect, based solely on its size (Figure 4). Our rejection of Di Fenizio’s (Reference Di Fenizio1916) estimates of Rome’s aqueduct flow rate as too high is thus further supported, with the datapoint for Rome on Figure 3 already sitting well above the line of best fit.
The residuals of the relationship shown in Figure 3 (figure by authors).

The extent to which we can use the capacities of aqueducts to estimate the populations of individual settlements, now that such a relationship has been established, is also worth considering. As Ortman and Hanson (Reference Ortman and Hanson2023) argue, we should not simply use scaling phenomena to investigate the relationships between the architecture and wider built environment of sites and their estimated population sizes, which are effectively based on housing densities, since these relationships can also be used to provide a series of new estimates for the sizes of sites (meaning that we can not only suggest a minimum and maximum figure for each one, but also select the most likely result). However, although our data indicate a consistent relationship between the capacities of aqueducts and the estimated population sizes of sites, the former should only really be used as a proxy for the latter in dialogue with other measures of the architecture and wider built environment of the cities in which we are interested, making it a matter for future work.
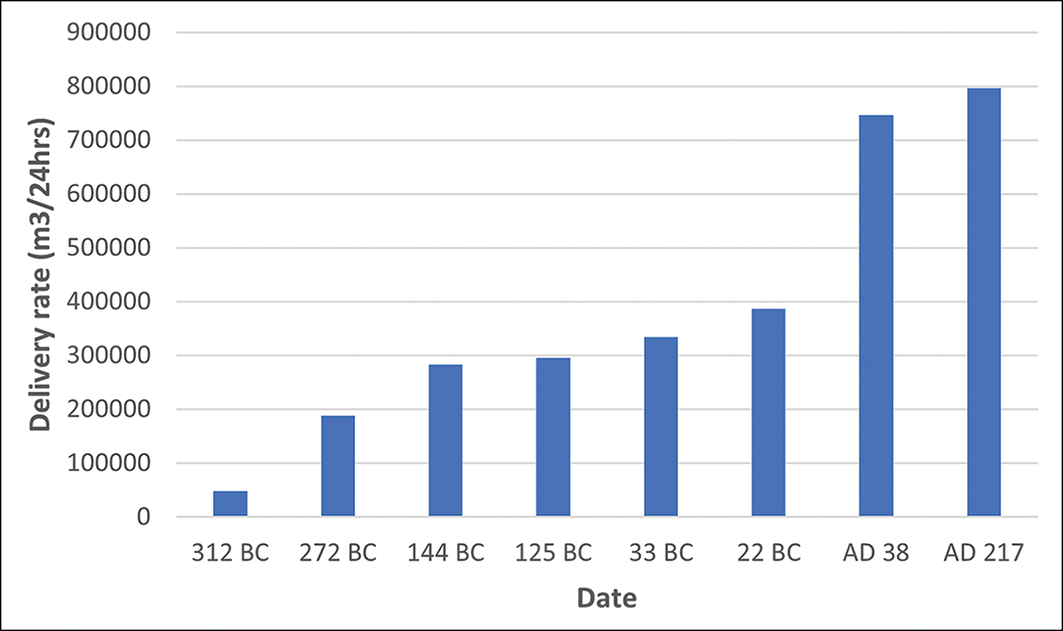
Finally, in closing, we can also consider whether the different estimates that we have for cities with more than one aqueduct, which were more often than not built at different points, can be used to explore how the total capacities and the estimated population sizes of cities changed over time, given the strong relationship between these variables. Focusing on Rome, as the site with the greatest number of aqueducts, the cumulative water-delivery rate rose sharply between the late fourth century BC and the early first century AD, rising from 48 000 to 796 000m3/24hrs (Figure 5). This suggests that the demographic scale of the capital also increased by an extraordinary degree, and possibly even quadrupled, although further work is also needed to clarify this.
The cumulative delivery rates, in m3/24hrs, over time of the aqueducts associated with Rome (figure by authors).

Conclusion
Although scholars have been somewhat pessimistic about the value of estimating the delivery rates of aqueducts, in this article we have shown that it is possible to find evidence for a systematic relationship between the capacities of a selection of these structures and the estimated populations of the cities with which they are associated, drawing our inspiration from recent theoretical work in complex systems and empirical research on the Greek and Roman world. One of the surprising aspects of this relationship, however, is that it is not linear, given that the total amount of water increased at a slower rate than the estimated populations of settlements, potentially revealing an important difference between ancient and modern contexts. Although more work will be required to understand the full consequences of this finding, this potentially has far-reaching implications for our understanding of the ancient world by revealing the care that was taken to ensure an adequate supply of clean and fresh water within settlements.
Acknowledgements
We thank the editor and the anonymous reviewers for their helpful comments and suggestions, which have made this a better piece of work. JWH would also like to thank Maddeline Atkinson for collecting some preliminary information as part of a University of Reading Undergraduate Research Opportunities Programme (UROP) project.
Funding statement
Parts of this research were funded by a British Academy Postdoctoral Fellowship (PF2/ 180110) and the UROP project noted above.
Online supplementary material (OSM)
To view supplementary material for this article, please visit https://doi.org/10.15184/aqy.2026.10296 and select the supplementary materials tab.
Author Contributions: using CRediT categories
J.W. Hanson: Conceptualization, Formal Analysis, Investigation, Methodology, Project Administration, Resources, Writing - Original Draft, Writing - review & editing. Duncan Keenan-Jones: Methodology-Supporting, Resources-Supporting, Writing - review & editing-Supporting. Davide Motta: Methodology-Supporting, Writing - review & editing-Supporting.


 Open access