

1. Introduction
As assumed by exemplar theory, words stand at the intersection between linguistic and social meaning, and analysis of their phonological and contextual variation gives insight into language variation and change (Hay Reference Hay2018). This study investigates the use of just as a way of gaining insight into different aspects of variation. As a polyfunctional word which can be used to ‘express speaker stance; to guide utterance interpretation and to structure discourse’ (Pichler Reference Pichler2013: 4), just is identified as a discourse-pragmatic variable (DPV). The structural and interactional patterning of DPVs can be analysed by referring to frequency of use, functions, social variation and grammaticalisation processes, as has been shown with like (Drager Reference Drager2011, Reference Drager and Pichler2016; Schleef & Turton Reference Schleef and Turton2018). Past research on just has focused on its various functions (examples are provided in table 1): adverbial functions of just (‘to be precise’ / ‘to reference the recent past’) are pragmatically distinct from emphatic (restricting/intensifying) or planning functions (Aijmer Reference Aijmer, McCafferty, Bull and Killie2005; Beeching Reference Beeching2016). Research on the phonetic variation of just has been rare (though see Grama et al. Reference Grama, Diskin-Holdaway, Gnevsheva, Brand, Hay, Foulkes, Drager, Docherty and Travisin prep; Lindemann & Mauranen Reference Lindemann and Mauranen2001). The present study compares phonetic variation across pragmatic functions and segmental contexts of just, thus contributing to a growing body of work which analyses phonological patterns via individual words in context (Pierrehumbert Reference Pierrehumbert2006; Hay Reference Hay2018).
Just function categories based on Woolford (Reference Woolford2021)

Note: Examples have been taken from the data and indicate interviewer (I) and participant (P).
2. Background
Just is a highly frequent word in spoken English. In the 2014 spoken British National Corpus (BNC), it was the twenty-seventh most frequent word at 0.75 occurrences per 100 words (up from forty-second in 1994) (Leech et al. Reference Leech, Paul and Andrew2014; Love et al. Reference Love, Dembry, Hardie, Brezina and McEnery2017). Just is also increasing over apparent time in Toronto and Tyneside Englishes (Tagliamonte Reference Tagliamonte2016; Woolford Reference Woolford2021). These frequency measurements, however, combine multiple distinct functions of just.
Many studies show differences in how just functions are distributed socially and stylistically. Aijmer (Reference Aijmer, McCafferty, Bull and Killie2005) highlighted the use of just as a metalinguistic marker which occurs between utterances and marks them as expressing attitudes or emotions. Beeching (Reference Beeching2016) categorised minimising, intensifying and filler functions in the spoken BNC, reporting a higher rate of just from younger speakers. Woolford (Reference Woolford2021) analysed the functions of just quantitatively in pre-verbal contexts across speaker age and sex in Tyneside English, finding that 5 per cent of all verbs in her corpora were preceded by just. Both Woolford (Reference Woolford2021) and Beeching (Reference Beeching2016) found that younger speakers use ‘depreciatory’ minimising just at a higher rate than older speakers.
Just has gradually gone through a process of grammaticalisation over time (see Aijmer Reference Aijmer2002, Reference Aijmer, McCafferty, Bull and Killie2005; Beeching Reference Beeching2016). Grammaticalisation is a linguistic process of both grammatical and pragmatic change by which content words gain new and related meanings and become more embedded in the grammar of a language (Hopper & Traugott Reference Hopper and Elizabeth C.2003; Brinton Reference Brinton2006; Pichler Reference Pichler2013: 35–41; Heine Reference Heine, Joseph and Janda2017). Previous work indicates that just may have developed from older to more recent uses in the following way: particularising adverb > temporal adverb > restrictive > evaluative (or ‘minimiser’) > intensifier – although the process of development ‘lacks a definite conclusion’ (Woolford Reference Woolford2021: 579–80).Footnote 1 However, there is a lack of a definitive conclusion as to its state of present development (Tagliamonte Reference Tagliamonte2016: 152).
Table 1 outlines the functions of just coded in the present study. Woolford (Reference Woolford2021: 580) refers to restrictive, particulariser and temporal functions as canonically adverbial. The present analysis therefore combines restrictive and temporal just under a broader ‘restrictive’ label, due to the lower number of tokens, and renames particulariser just as ‘adverb’. Again, due to similarities in function and number of tokens, evaluative and intensifier just were combined under ‘discourse’. There are broad differences between the canonically adverbial (particulariser, restrictive and temporal) uses of just, which hold propositional meanings. Whereas evaluative and intensifier uses of just are more discourse-pragmatic in their usage – expressing speaker attitude (see Woolford Reference Woolford2021: 580 for a further discussion). Therefore, adverbial and restrictive just represent less grammaticalised uses than discourse-pragmatic just does.
There is an established relationship between frequency of use, grammaticalisation of linguistic items and reduction of phonetic form. Phonetic reduction (referred to as ‘erosion’) is one of the interrelated mechanisms of grammaticalisation proposed by Heine (Reference Heine, Joseph and Janda2017: 578–9). The higher any item’s frequency of use, the more phonetically reduced it is (Bybee Reference Bybee2003: 9–11). Effects of token frequency on phonetic change are also ‘particularly noticeable in grammaticising elements’ according to Bybee (Reference Bybee2003: 9).
As Pichler (Reference Pichler2013: 37–8) states, the phonetic reduction of a linguistic item is due to the fact that ‘as their inferences conventionalise and their uses generalise, frequently occurring items… gradually weaken their prosodic emphasis and their referential contribution to utterance meaning’.
One of the key questions of the present study is assessing the effects on the phonetics of just. This will be achieved by contrasting canonical uses – i.e. particulariser, restrictive and temporal just – with discourse(-pragmatic) uses – i.e. evaluative and intensifier just. Reduction will be assessed by levels of vowel and /t/ elision and vowel centralisation alongside shorter segment and token durations. It is possible to predict that more recent uses of just would be likely to show some kind of phonetic reduction due to their more advanced stage of grammaticalisation. However, it would also be possible to predict that the more frequent uses of just (regardless of how recent they are) are likely to show the most phonetic reduction. It is therefore predicted that there will be a complex relationship between the function of just and its phonetic variables.
Lindemann & Mauranen (Reference Lindemann and Mauranen2001) investigated the relationship between just functions and stress in US English (interpreting stress as an auditorily louder token with a different pitch to surrounding speech). They found that when just was used in a minimising evaluative way (e.g. Let me just quickly…) it was almost never stressed and lacked any vowel. Whereas, when just was used as an adverb particulariser (e.g. just at the right time) it was stressed around 20 per cent of the time and often had a full vowel. Grama et al. (Reference Grama, Diskin-Holdaway, Gnevsheva, Brand, Hay, Foulkes, Drager, Docherty and Travisin prep) analysed the phonetic variation of just in New Zealand and Australian Englishes and found just was changing over time to be more like kit, and that this was independently of other strut vowels in similar contexts (such as bust or jut). They undertook a collocation analysis by extracting the immediately preceding and following words surrounding just. Collocations were split according to which were used most by younger or older speakers, representing younger and older uses of just. Generally, when just patterned with younger collocations, it was more kit-like in vowel quality, and when it occurred with older collocations it was more strut-like, suggesting newer variants of just are indicated by the younger collocations. Semantic bleaching is particularly indicated by the co-occurrence of just with other discourse-pragmatic markers (e.g. just so, just like), although by avoiding describing the specific functions of just, they did not speak to grammaticalisation.
By analysing the phonetic variation of just across context and pragmatic meaning, the present study aims to understand phonological changes at broader levels than the segment, and to see whether the form of just aligns with its function.
Although there is a lack of research on just phonetic variation according to function, like has been analysed in this way by various studies. In New Zealand, London, Edinburgh and West Yorkshire Englishes, when like was utilised as a quotative marker (e.g. I was like, ‘sure you can borrow that’), it tended to have a more monophthongal vowel, a reduced /k/ and a shorter /l/-to-vowel ratio than when fulfilling different functions (Drager Reference Drager2011; Schleef & Turton Reference Schleef and Turton2018; Gibb-Reid et al. Reference Gibb-Reid, Foulkes and Hughes2022). Like also varied in pronunciation according to speaker stance and style (Drager Reference Drager and Pichler2016). Schleef & Turton (Reference Schleef and Turton2018: 46–7) used boundary strengthFootnote 2 to refer to the following context of like, arguing that the strength of adjacent boundaries had a bigger impact on the phonetic variation of like than pragmatic function did: pre-pausal like was more likely to be fully realised (e.g. [laɪk]) but pre-consonantal or pre-vocalic like was more likely to be phonetically reduced (e.g. [lak̚]). Quotative like was more monophthongal compared to other functions, which was explained by its typical occurrence being surrounded by speech rather than by silences or pauses. For the present study, when just occurs before or after a pause (a stronger boundary), it is predicted to have a fuller phonetic realisation than when followed or preceded by a vowel or consonant (a weaker boundary). This is in line with general patterns relating to word-final /t,d/ in coda obstruent clusters. /t,d/ deletion research proposes a spectrum of following contexts from more-to-less elision: obstruents > liquids > glides > following vowels and pauses (Guy Reference Guy1991: 17–18; Tagliamonte & Temple Reference Tagliamonte and Temple2005).
3. Predictions
Based on previous work discussed above, just is predicted to vary in several ways:
-
i. The function of just will have a relationship with the level of token phonetic reduction such that discourse just will be more reduced than adverbial or restrictive just.
-
ii. Post- and pre-pausal just will show less phonetic reduction than just in continuing speech.
To test the robustness of function and phonological context effects, speech rate and audible stress will also be analysed. The following are predicted:
-
iii. Just in faster speech will show more reduction than just in slower speech.
-
iv. Unstressed tokens of just will show more reduction than stressed tokens.
4. Methodology
4.1 Data and analysis
The data for this study is taken from the DyViS corpus, task 1 (Nolan et al. Reference Nolan, McDougall, de Jong and Hudson2009): 100 male speakers of Southern Standard British English (SSBE) aged 18–25 recorded in simulated police interviews. Each recording lasts 20–30 minutes.
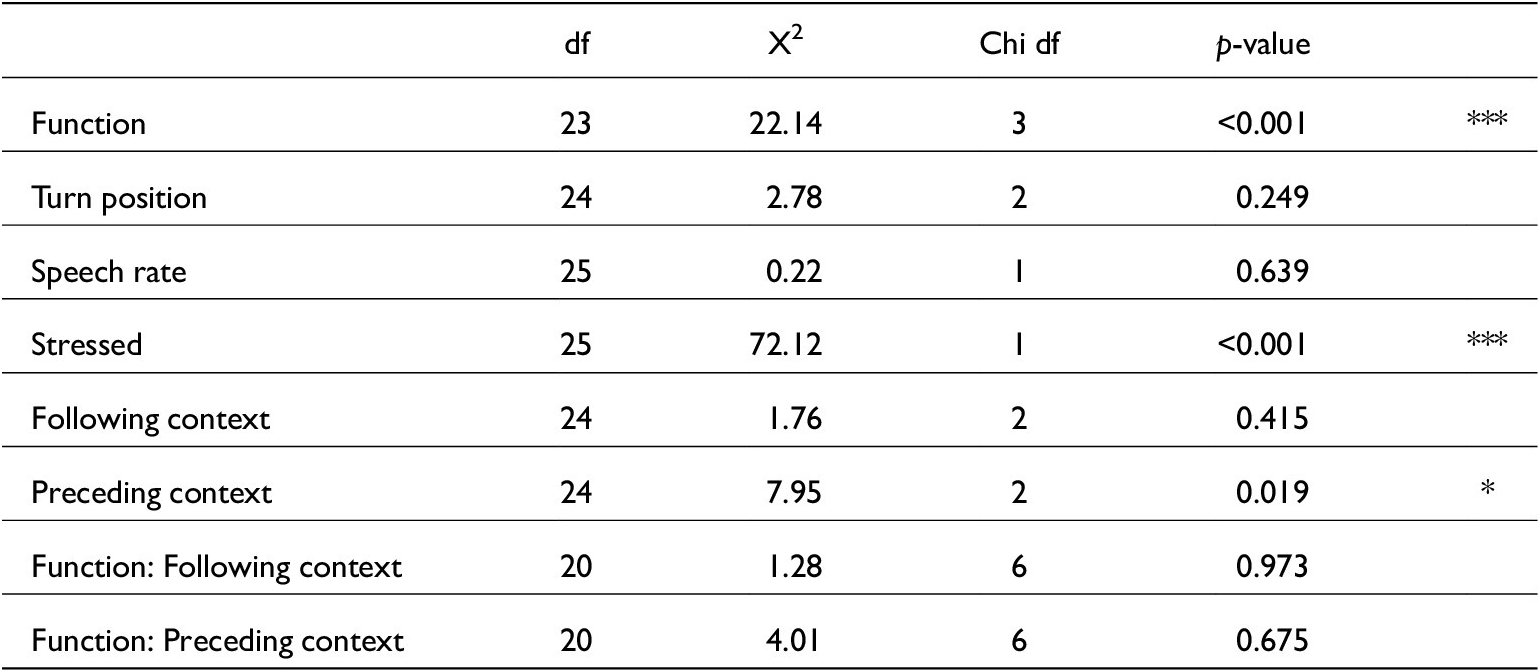
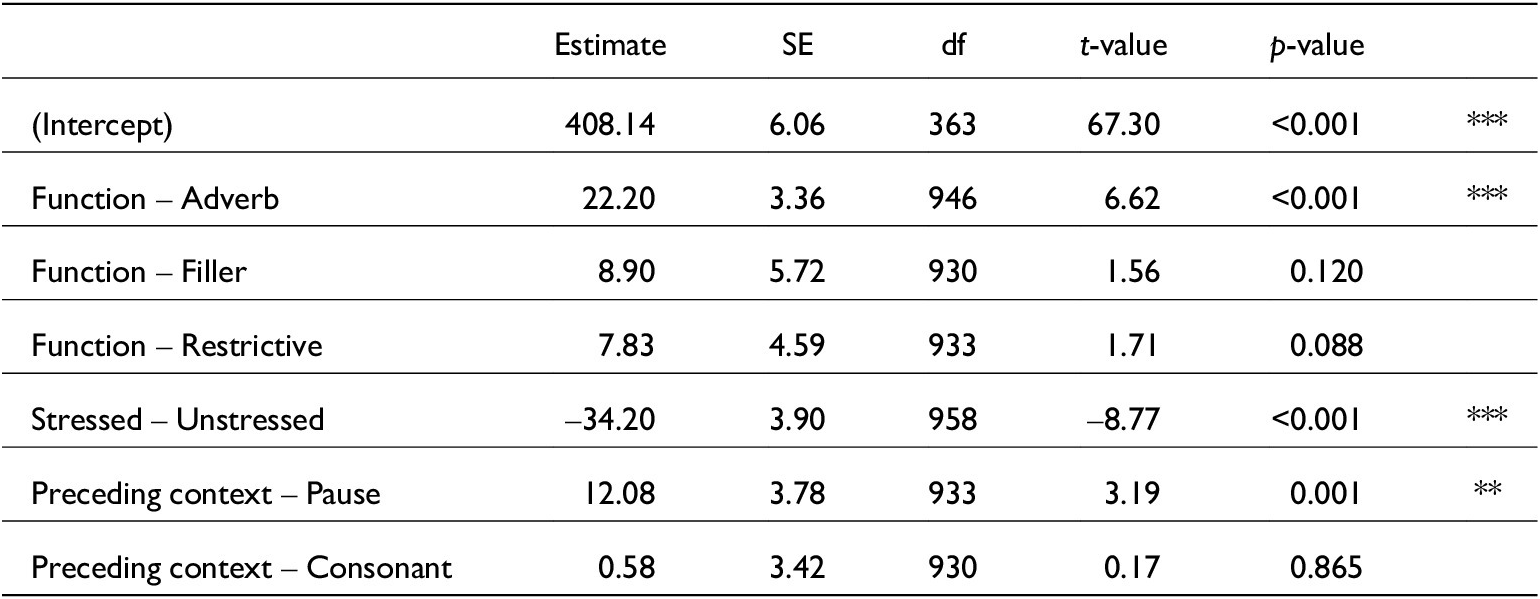
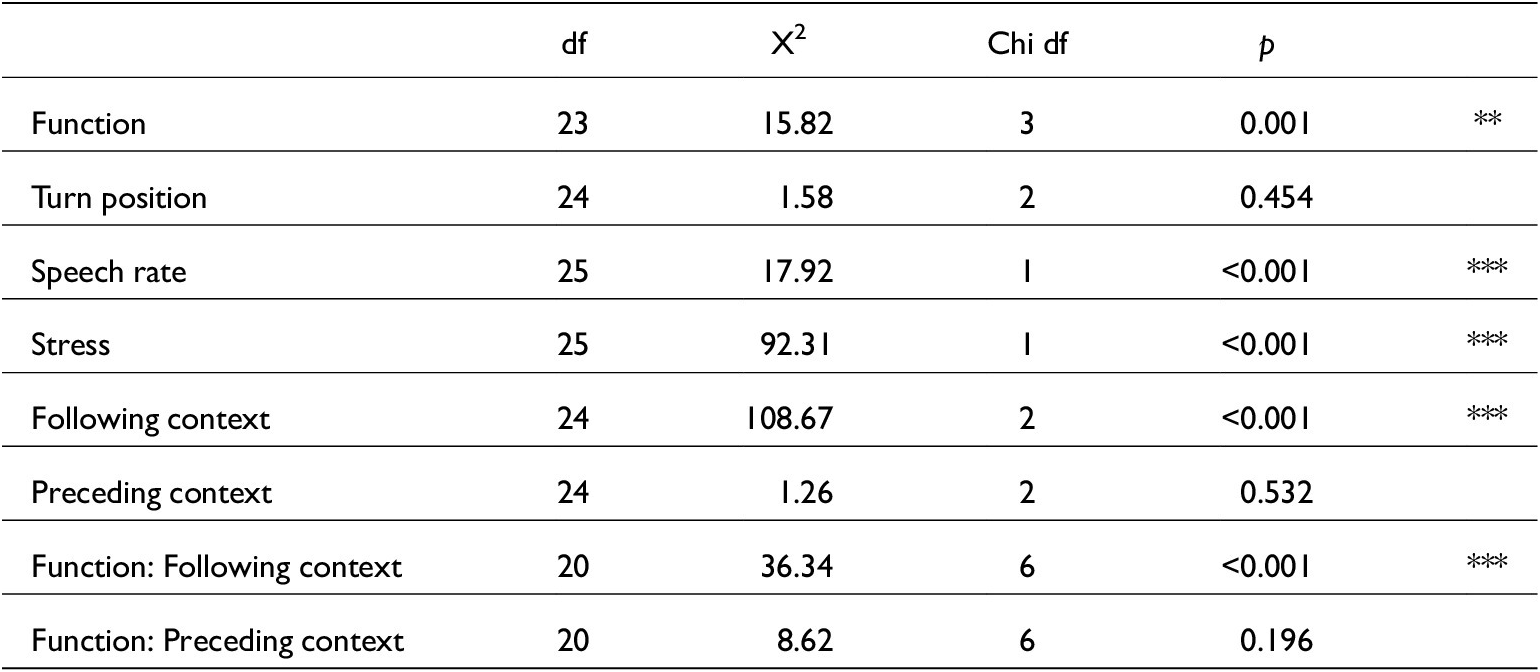
Using Praat (6.2.12) (Boersma & Weenink Reference Boersma and Weenink2022), phones were segmented and transcribed and estimates of vowel formants, speech rate, centre of gravity and duration were extracted from just in each sound file. R Studio (R Core Team Reference Team2020) and the tidyverse packages (Wickham et al. Reference Wickham, Averick, Bryan, Chang, McGowan, François, Grolemund, Hayes, Henry, Hester, Kuhn, Pedersen, Miller, Bache, Müller, Ooms, Robinson, Seidel, Spinu, Takahashi, Vaughan, Wilke, Woo and Yutani2019) were used to manipulate and visualise data. For all continuous dependent variables (formant, centre of gravity and duration estimates), afex (Singmann Reference Singmann2023) mixed() model comparisons were utilised. Every model comparison contained the following variables: function, following context, preceding context, turn position, speech rate, stress, speaker as a random effect, and two interactions: function:preceding contexts and function:following contexts. The interactions were selected to investigate the potential overlap such that some functions are more likely to occur in specific phonological contexts – responding to prediction (ii) listed in section 3.
Likelihood-ratio tests were used as Barr et al. (Reference Barr, Levy, Scheepers and Tily2013: 277) indicate this is preferable ‘where the number of observations far outnumbers the number of model parameters’. Model comparisons provided an indication of which of the independent variables significantly contributed to predicting the dependent variable. Then, a linear mixed-effects model was created utilising lme4 (Bolker Reference Bolker2022), which contained only variables found to be significant in the model comparison. For categorical dependent variables (vowel and /t/ elision rates, audible stress), only generalised linear mixed-effects (glmer) models were utilised. All model results are listed in the Appendix in full (tables A1–A22). There were four predictor levels for function, and these were consistently ordered to contrast ‘discourse’ against other functions. For preceding and following contexts, there were three predictor levels, which were ordered to contrast ‘vowel’ against the other contexts. Pairwise comparisons were achieved using the emmeans package (Lenth Reference Lenth2025).
An auditory analysis was undertaken of every token of just to identify the presence/absence of each of its four canonical segments (informing vowel and /t/ elision rates) and to annotate segments for duration estimates (see figure 1 for an example). The presence/absence of stress for each token was also coded based upon auditory impressions of duration, pitch and intensity (following Lindemann & Mauranen Reference Lindemann and Mauranen2001). The hold phase of /d͡ʒ/ was not included in duration measurements because its onset was not identifiable when just was preceded by silence. /d͡ʒ/ was measured from the plosive release (indicated by a burst of energy and an aperiodic waveform) to the beginning of open approximation for the vowel (indicated by clear formant structures, periodicity, and a higher amplitude). The end of the vowel was identified where the waveform became aperiodic, reflecting /s/ frication, and the latter /s/ boundary was defined by either closure for /t/ (indicated by a drop in amplitude and a lack of high-frequency activity in the spectrogram), or – where /t/ was elided – the beginning of an immediately following sound. Where boundaries between sounds were unclear, they were marked as unfit for duration or formant estimates and no values were taken. In the transcription scheme, <+> highlighted a segment or token as suitable for acoustic estimates, and <-> indicated it was not. Following and preceding contexts were transcribed as ‘F/P’ followed by a letter: either <P> (pause), <V> (vowel), or a transcription of consonants (e.g. <Fs> transcribed the following segment as [s] in figure 2).
Example of segmentation for a just captured in Praat

Example of just with an elided vowel and an unclear boundary between /d͡ʒ/ and /s/ captured in Praat

Tokens of fleece, kit, trap, strut, goose and the vowel from the filled pause um were also extracted from speakers as landmarks for assessing just vowel quality. In SSBE, just is expected to be [ʌ], at least when stressed, and is part of the strut lexical set (Wells Reference Wells1982). Others (Grama et al. Reference Grama, Diskin-Holdaway, Gnevsheva, Brand, Hay, Foulkes, Drager, Docherty and Travisin prep) have found, however, that in acoustic terms, the vowel in just patterns closer to kit and realised as [ɪ]. Um was chosen as, in SSBE, it often has a relatively back and open vowel, not dissimilar to strut. Following and preceding contexts were categorised as pauses (defined as >100 ms of silence),Footnote 3 consonants or vowels. Multiple Praat scripts were written to extract acoustic estimates from the TextGrid and .wav files. Formant midpoint estimates were extracted with settings adjusted to find five formants in a 5k Hz range. A manual check identified erroneously tracked formant estimates in the data and either corrected them or excluded those vowels from the analysis. Speech rate was calculated for every utterance containing a token of just using another Praat script (adjusted from de Jong et al. Reference de Jong, Pacilly and Heeren2021). This measured syllables per second by tagging clear peaks in intensity. Settings were set to default, aside from the minimum pause duration, which was adjusted to 0.3s as this provided the most accurate results when piloting the methods. Vowel formant estimates were not normalised; cross-speaker differences have been dealt with by utilising mixed effects (as outlined by Hay et al. Reference Hay, Pierrehumbert, Walker and LaShell2015).
4.2 Features and coding
Each token of just was extracted for analysis and coded according to a range of variables. Functions were based on Woolford (Reference Woolford2021) and shown in table 1, with examples taken from the data. Examples indicate interviewer ‘I’ and participants ‘P’. It is also worth noting that Beeching (Reference Beeching2016) highlights the use of just as an imperative instruction (e.g. just put that there…). No imperative tokens of just were found in the data,Footnote 4 and so this was not included in the analysis.
Variable surrounding contexts and rates of elisions caused the analysis of each segment of just to be based on a different number of tokens. 1,274 tokens were segmented overall. A single token where just was used as an adjective was excluded. Occasionally, just came before or after a turn which was incomplete due to overlapping speech. This context was defined as ‘cut-off’. Just came immediately after someone else’s talk seven times, and immediately preceded others’ talk six times in the data. It was decided to not include these tokens in the overall analysis as they were so few, and their function was often unclear, limiting the data to 1,260 tokens overall. Only 995 tokens were suitable for word duration analysis (due to fricative preceding/following contexts such as it’s just this). For individual segment duration and centre of gravity estimates, similar decisions were made due to surrounding contexts leading to 993 /d͡ʒ/, 1,041 vowel, 998 /s/ and 384 /t/ tokens. Of the vowel tokens, some of them were too short to permit any formant extraction, limiting the formant analysis to 1,019 tokens.
5. Results
In total, 1,260 tokens of just were extracted, equating to 0.88 occurrences per 100 words across the corpus. Their functions are displayed in table 2.
Just function distributions and frequency of occurrence in the data

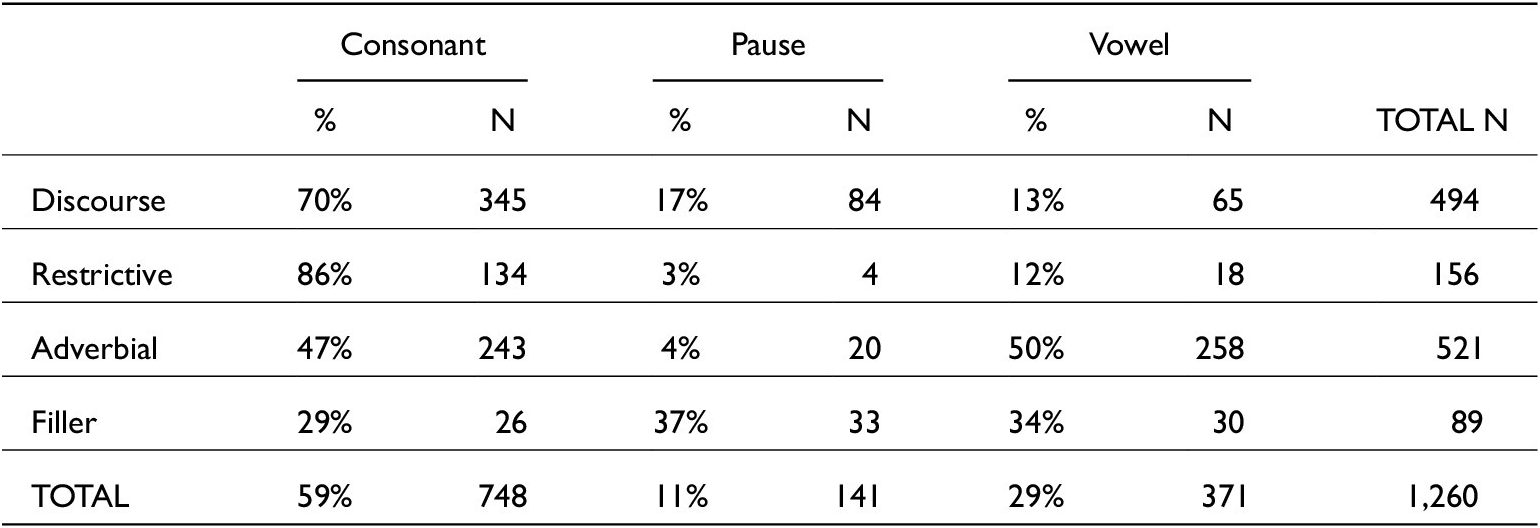
The spread of functions across preceding contexts is shown in table 3. Overall, just is most likely to occur after a consonant. Adverbial and restrictive just tokens are more likely to come after a pause (the context predicted to elicit less phonetic reduction) than other functions. There was one token of just occurring as an adjective (a just cause) which was omitted from analysis. Just has a vowel elision rate of 10.6 per cent, and a /t/ elision rate of 69.4 per cent. In terms of following contexts (shown in table 4), just occurs most before consonants. Tokens which function as fillers are most likely to occur before a pause. Discourse and restrictive just, however, are more likely to occur before a consonant (a susceptible position for /t/ elision) than a vowel or pause. Adverbial just rarely occurs pre-pausally. In summary, restrictive just is more likely to occur between consonants. Whereas discourse just occurs most after vowels and is more likely to be before a pause. Adverb just has the highest level of occurrence after pauses and is found comparably before both consonants and vowels.
Distribution of just functions across preceding contexts

Distribution of just functions across following contexts

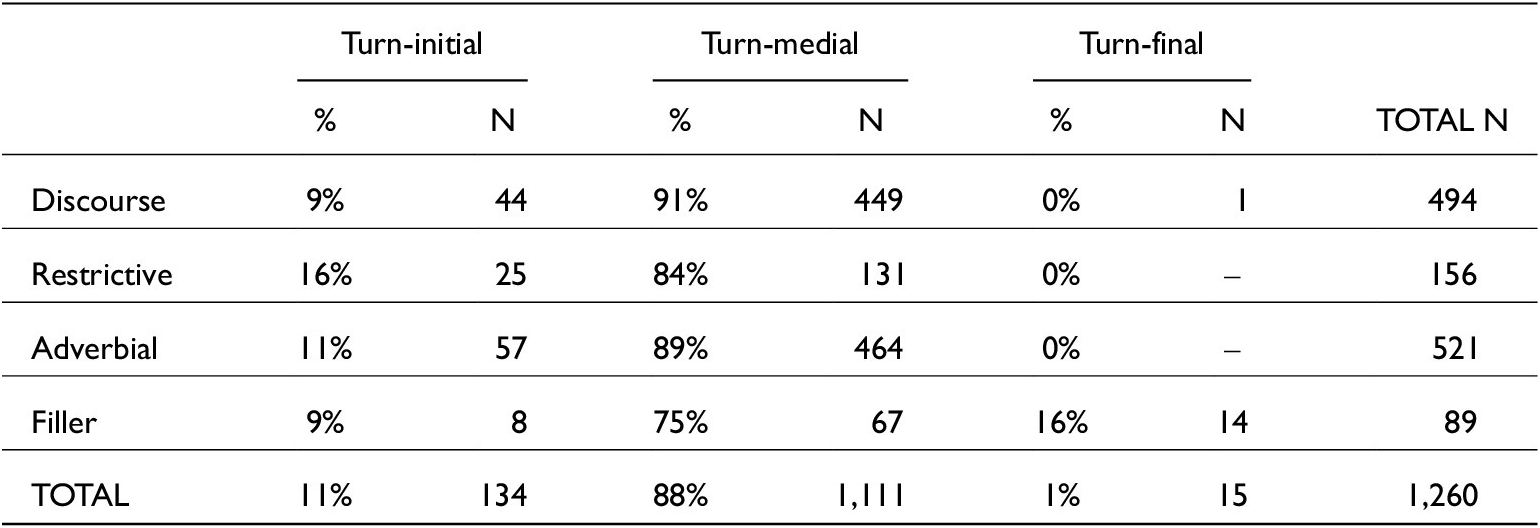
Largely, as illustrated in table 5, just appears in turn-medial position (88 per cent). All functions can occur turn-initially but restrictive just occurs there the most. Turn-final just is most likely to be transcribed as a filler. There is only one non-filler turn-final token, which was transcribed as having an adverb function. Including turn position as an independent variable in statistical models which tested /t/ elision caused them not to converge, which is likely due to most tokens being turn-medial. There was also a lack of any significant results predicting phonetic variation based on turn position except for /d͡ʒ/ centre of gravity (COG): when just is turn-medial it has a slightly higher /d͡ʒ/ COG than when it is turn-medial (although just only occurred turn-finally fifteen times). Boundary strength is therefore interpreted to be more reliably indicated by preceding/following phonological contexts, and turn position is not further discussed.
Distribution of just functions across turn positions

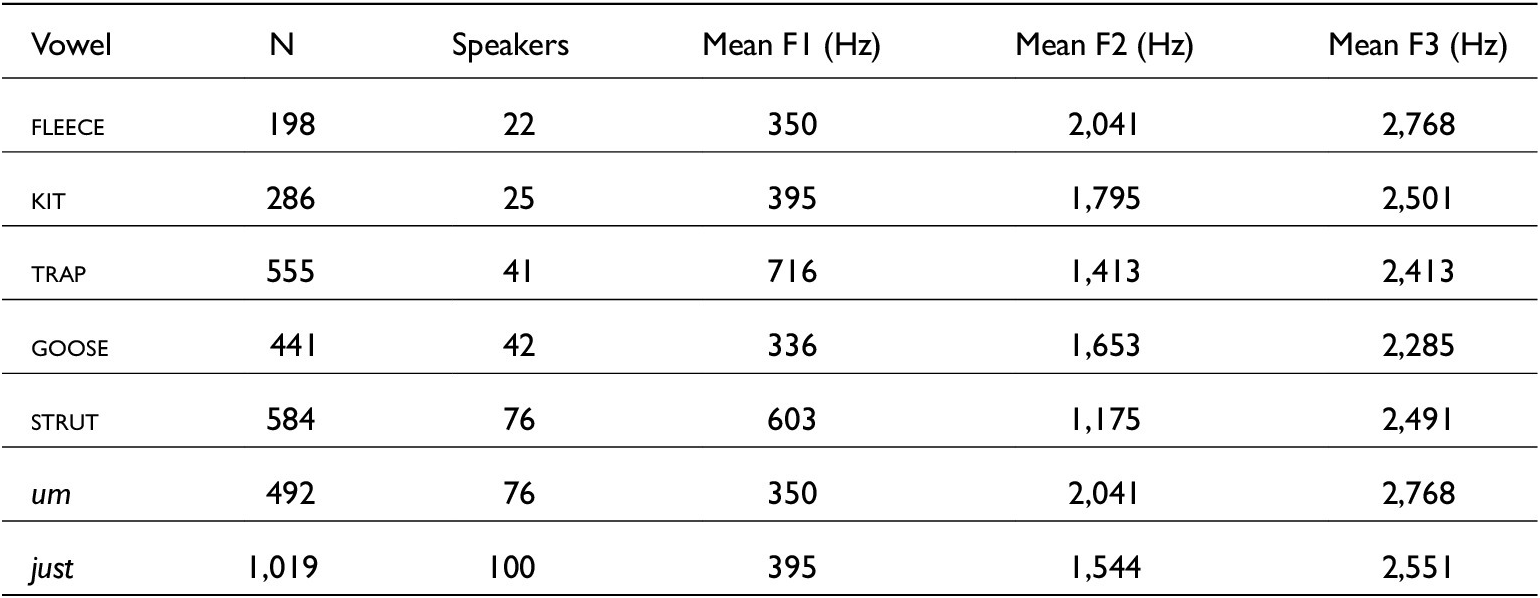
The number and mean vowel formant estimates taken from just, um and the lexical vowels are summarised in table 6. A total of 1,019 just vowel tokens were deemed suitable for formant analysis. Figure 3 displays the midpoint F1 and F2 estimates. Just vowels generally have F1 and F2 values within the back half of the distribution of kit, overlapping with um but distinct from strut (a pattern reported elsewhere, Grama et al. Reference Grama, Diskin-Holdaway, Gnevsheva, Brand, Hay, Foulkes, Drager, Docherty and Travisin prep). They are central on average, with mean F1 at 395 Hz and mean F2 at 1,544 Hz. The vowel therefore ranges from um-like [ɜ̝], to a more central [ɘ] and more front [ɪ̠]. The spread of just formant estimates across function and following context is shown in table 7.
Counts and summary information for of all lexical vowels along with um and just vowels extracted for analysis

F1~F2 plot of all just vowel midpoints extracted for analysis represented as blue diamonds. Fleece, kit, trap, strut, goose and um vowel estimates are shown in ellipses which represent mean + 2*SD of each vowel

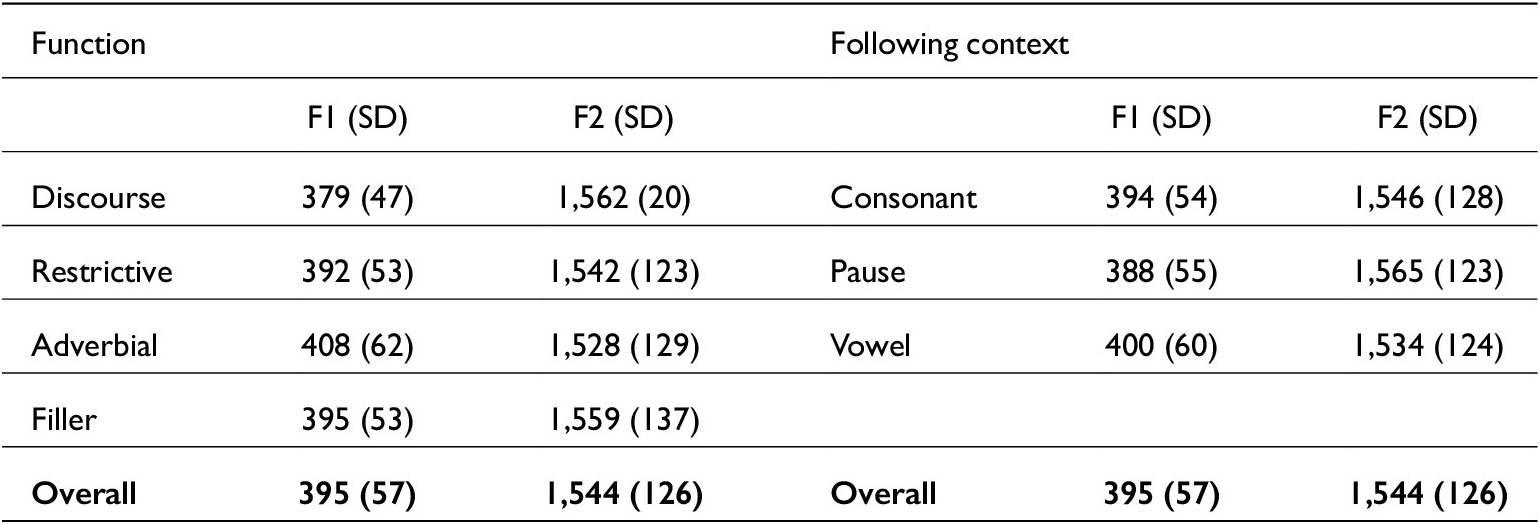
Mean and standard deviation figures for just vowel F1 and F2 estimates (Hz) by function (left) and following context (right)

Overall, 993 tokens of just were measured for /d͡ʒ/ COG with a mean of 3,235 Hz and standard deviation (SD) of 1,038 Hz. A total of 998 tokens were measured for /s/ COG, with a mean of 4,660 Hz and SD of 1,310 Hz. A total of 995 tokens were suitable for duration measurements, ranging from 49 to 537 ms with a mean of 193 ms. On average, /d͡ʒ/ was 47 ms, the vowel was 55 ms, /s/ was 74 ms and /t/ was 66 ms in duration. It should be noted that /t/ was only present for 30 per cent of tokens, so provides a less reliable duration measure.
5.1 Variation by function
Vowel elision rates across functions are illustrated in figure 4 (left panel) and the results of generalised linear mixed-effects (glmer) models are displayed in the Appendix, table A5. Note that four models for vowel and /t/ elision are displayed in the Appendix, tables A5–A8, each containing the same variables but alternating either preceding or following contexts. For vowel elision, the model containing preceding contexts has a slightly higher conditional R2 than one containing following contexts and is therefore relied on to interpret the other variables. Contrastingly, for /t/ elision, the model featuring following contexts has a much higher conditional R2 (0.48) than one containing preceding contexts (0.13) and is therefore relied on to interpret other variables.
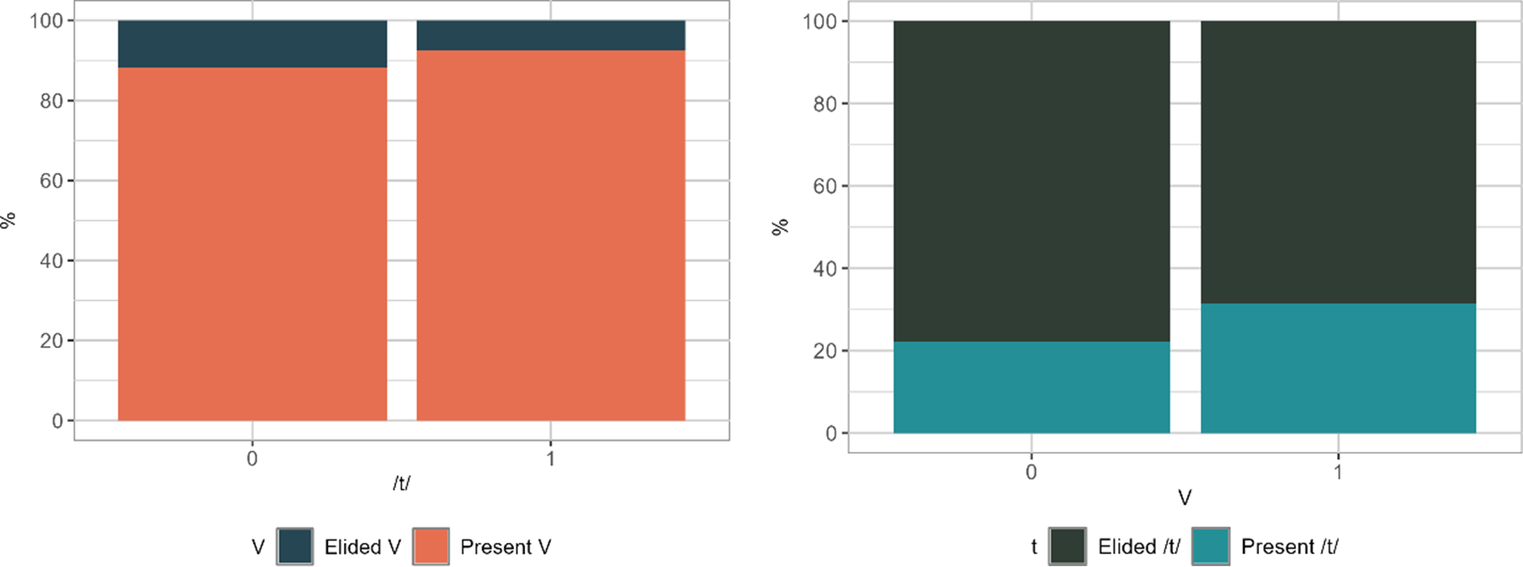
Just functions by proportion of vowel elision (left) and /t/ elision (right)

Across functions, discourse just has the highest rate of vowel elision (17.0 per cent). This is significantly greater than for adverbial tokens (z(0.3) = 5.0, p<0.001). Restrictive just has the next highest rate of vowel elision at 12.7 per cent; pairwise comparisons showed that this is significantly higher than the rate for adverb tokens (z(0.4) = 0.6, p = 0.018), though not significantly different than the rate for filler or discourse tokens.
The proportion of /t/ elision across functions is also shown in figure 4 (right panel), and glmers are summarised in tables A7 and A8. Tokens of just with a restrictive function are most likely to have elided /t/ (86.6 per cent), followed by discourse just (80.4 per cent). Table 4 shows that restrictive and discourse tokens typically occur pre-consonantally, indicating that /t/ elision is linked to segmental context (see section 4.5). Overall, discourse just embodies phonetic reduction in terms of /t/ elision, though this is not significantly different from adverbs or restrictive tokens in a model which included following contexts. Pairwise comparisons showed that none of the contrasts for functions were significant.
As figure 5 illustrates, there was a relationship between vowel and /t/ elision, such that generally tokens which had an elided vowel were more likely to have an elided /t/ (right), and if they had an elided /t/, they were slightly more likely to have an elided vowel (left). However, a vowel elision model: glmer(V ~ t + Function + Stressed + Fcon + (1 | Speaker)) failed to converge and showed that this effect was not significant (z(0.3) = -0.3, p = 0.803). A similar model testing /t/ elision also failed to converge and had a non-significant effect for vowel elision (z(0.3) = -0.4, p = 0.700).
Just proportion of vowel elision across whether /t/ was elided (0) or present (1), and vice versa for proportions of /t/ elisions

F1 and F2 estimates for just are plotted by function in figure 6. It should be noted that overall there is a high amount of variation in each function’s vowel quality (reflected by the overlapping ellipses, and high SD figures in table 7). Of the four functions, adverb is closest to strut and discourse tokens are furthest removed from strut. Adverb tokens have higher F1 overall (mean 408 Hz) than discourse tokens (379 Hz); and this is significant (t(3.4) = 6.6, p = <0.001). Restrictive just tokens also have lower F1 estimates than adverb tokens, and this was found to be significant in pairwise contrasts (t(4.4) = 3.2, p = 0.007), though no other function contrasts were significantly different. This suggests that discourse just and restrictive just have slightly closer vowels than adverbial just. For F2, adverbial tokens have slightly lower estimates (1,527 Hz) than discourse tokens (1,563 Hz) though function is not a significant predictor in a model comparison for F2 predictors (χ2(3) = 3.7, p = 0.292).
F1~F2 plot of all just vowel midpoints across functions. Ellipses represent mean + 2*SD of each function

The duration of the just token and each segment is displayed across functions in figure 7 (top). Token and segment durations, like formant estimates, were tested using likelihood-ratio model comparisons and linear mixed-effects models. Filler tokens of just are significantly longer in duration (mean 243 ms) than adverb (mean 194 ms, t(<0.1) = -5.5, p<0.001) or restrictive tokens (mean 178 ms, t(<0.1) = -3.3, p = 0.001). Discourse (mean 178 ms) tokens of just have shorter durations than adverb (t(<0.1) = -5.4, p<0.001) or restrictive tokens (t(<0.1) = -2.8, p = 0.005). However, there is also a significant interaction between following contexts and functions: discourse tokens are more likely to occur before vowels than adverb tokens. This increases the likelihood of a shorter word duration when compared with pre-consonantal (t(<0.1) = 4.5, p<0.001) and pre-pausal just (t(<0.1) = 5.3, p<0.001).
Boxplots of just token durations (top) and each segment’s duration (bottom) across functions. Grey dots represent individual data points separated by jitter. All tokens were included

Segment duration estimates are displayed across functions in figure 7 (bottom). There are no clear patterns or significant effects for /d͡ʒ/. For vowels, restrictive, discourse, and adverb tokens have a similar duration (mean 56 ms, 57 ms and 58 ms respectively). It is unsurprising then, that when testing effects in model comparisons, functions were not found to significantly predict vowel (χ2(3) = 3.2, p = 0.366) duration measurements. /s/ and /t/ duration measures provide a clearer pattern: discourse tokens have a longer /s/ (mean 78 ms) and /t/ (65 ms) whereas for adverbial tokens they are shorter (/s/ = 68 ms, /t/ = 54 ms). Both differences are significant (see tables A16 and A18). Discourse tokens also exhibit a larger SD for /s/ (36 ms) than adverbial tokens (27 ms). However, due to the amount of /t/ elision there were only 384 tokens which permitted a /t/ duration measurement, so these results are based on a smaller amount of data than the other segments.
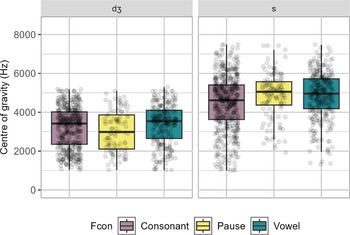
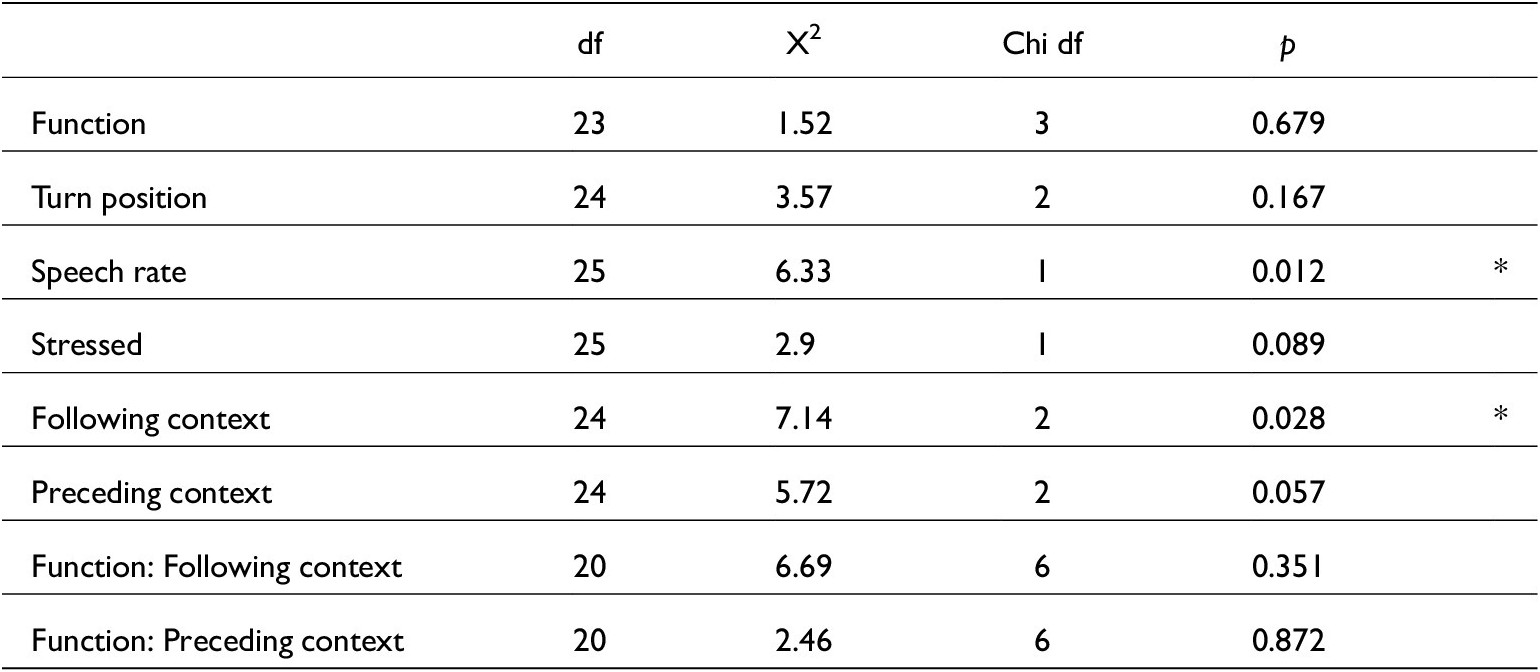
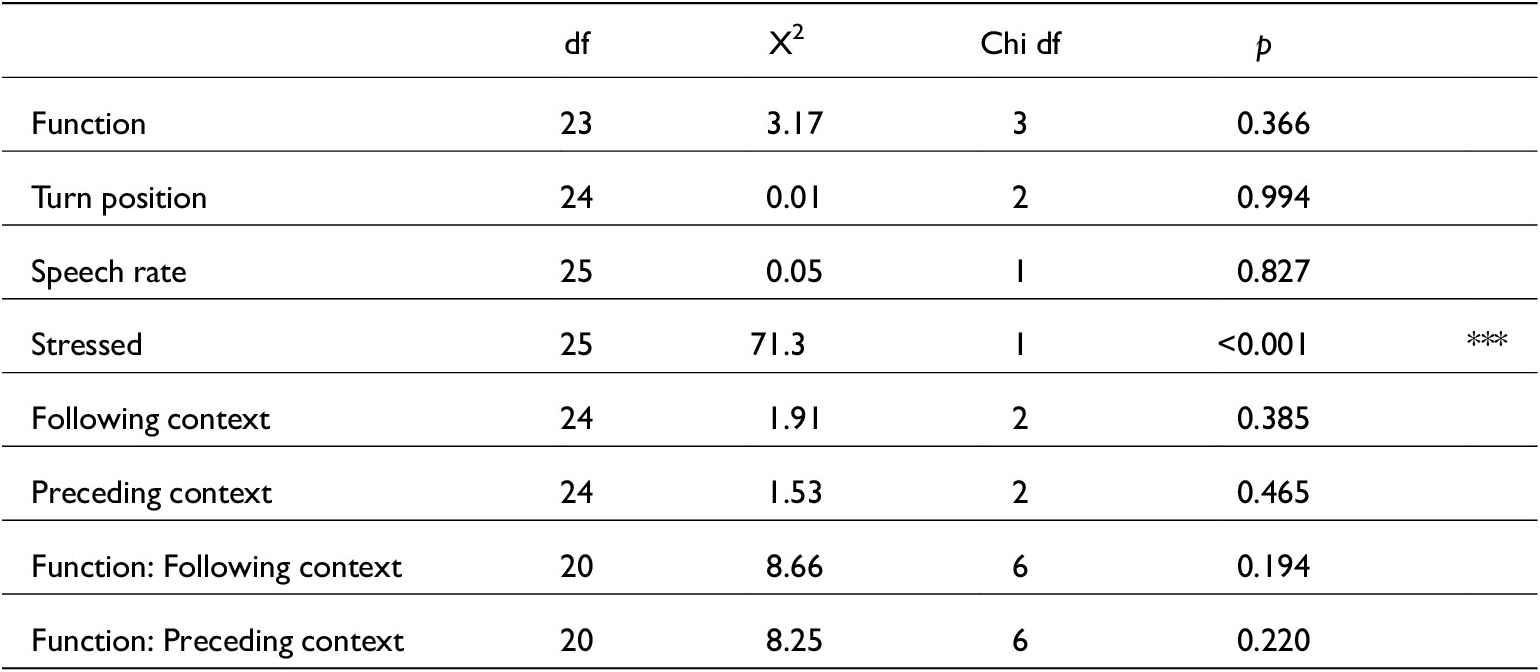
The spread of COG measurements across function categories is displayed in figure 8. For /d͡ʒ/, COG is lowest for discourse tokens (mean 3,037 Hz), though this was only significantly lower than restrictive just tokens (mean 3,257 Hz, t(21.1) = 2.0, p = 0.044). COG measurements for /s/ follow a similar pattern of low-to-high across discourse (mean 4,573 Hz) and adverb (4,757 Hz) and filler tokens (4,746 Hz) but in model comparisons, function is not a significant predictor for /s/ COG (χ 2(3) = 1.5, p = 0.675). This suggests that restrictive just may have a slightly more [s]-like /d͡ʒ/ than discourse just.
Boxplot of just fricative centre of gravity measurements across token functions. Grey dots represent individual data points separated by jitter

5.2 Variation by preceding contexts
The preceding and following contexts of just were separated into consonant, pause and vowel. The effect of preceding contexts on vowel and /t/ elision rates are plotted in figure 9.
Just preceding contexts by proportion of vowel elision (left) and /t/ elision (right)

When just follows a vowel, it is more likely to have an elided vowel (an elision rate of 16 per cent) than if it follows a consonant (an elision rate of 8 per cent). This was significant in a glmer model (z(0.3) = 2.5, p = 0.017). Post-pausal just has a similar rate of vowel elision to post-consonantal just, but post-pausal just was not significantly different from post-vocalic just (z(0.3) = 1.7, p = 0.085). For /t/ elision, there is a similar picture: post-vocalic just shows more phonetic reduction (74 per cent), and this is followed by post-pausal (70 per cent) and post-consonantal (66 per cent) contexts. However, none of these comparisons for /t/ elision were significant in glmer testing and pairwise comparisons (see table A7).
Vowel formant estimates across preceding contexts are displayed in figure 10. Post-pausal just is likely to have a less reduced vowel (385 Hz mean F1 and 1,567 Hz mean F2), whereas post-vocalic and post-consonantal just is more likely to have a vowel with a lower F1 and higher F2 (401 Hz F1, 1,567 Hz F2), which potentially shows more reduction. Preceding contexts significantly affected just F1 and F2 vowel estimates in the following ways:
-
i. Post-vocalic just has a lower F1 than post-pausal just (t(3.8) = 3.2, p = 0.001)
-
ii. Post-vocalic just has a higher F2 than post-pausal just (t(8.1) = -8.1, p<0.001) and post-consonantal (t(7.3) = -7.9, p<0.001) just.
F1~F2 plot of all just vowel midpoints across preceding contexts. Ellipses represent mean + 2*SD of each context

This indicates when just occurs after a vowel, it has a more front and raised vowel. Just after a stronger boundary (i.e. a pause), by contrast has a vowel closer to strut.
From table 3 we see that discourse tokens occur frequently after vowels (49 per cent). With this context yielding the highest rates of segment elisions, it is possible that the phonological context of discourse tokens is determining their higher rates of vowel and /t/ elision, and potentially their more kit-like vowel quality. A glmer model containing only functions, preceding contexts and an interaction of the two (glmer(V ~ Function + Pcon + Function:Pcon + (1|Speaker), data, family = binomial) did not yield any significant results for adverb against discourse tokens across post-vocalic and post-pausal FunctionAdverb:PconPause (z(0.7) = 0.2, p = 0.867) or post-vocalic and post-consonantal contexts FunctionDiscourse:PconConsonant (z(0.6) = 0.1, p = 0.907). It should also be noted that this model failed to converge. A similar model for /t/ elision also did not converge and did not yield any significant results for adverb against discourse tokens across post-vocalic and post-pausal FunctionAdverb:PconPause (z(0.4) = 0.6, p = 0.541) or across post-vocalic and post-consonantal contexts FunctionAdverb:PconConsonant (z(0.4) = -0.5, p = 0.598). Indeed, there were no significant results across any of the interaction combinations for /t/ elision.
Preceding contexts do not significantly affect any duration measurements (see tables A9–A18). The effect of preceding contexts on COG estimates from both fricatives are displayed in figure 11. Post-vocalic just has the lowest /d͡ʒ/ COG (mean 3,125 Hz), but preceding context did not significantly affect /d͡ʒ/ COG in a model comparison (χ 2(2) = 5.2, p = 0.073). There was, however, an interaction between function and preceding context; discourse tokens are more likely to occur after vowels whereas restrictive tokens are more likely to occur after consonants, and this caused discourse just to have a lower /d͡ʒ/ COG (t(27.3) = -3.0, p = 0.003). [s] and [z] made up 45 per cent of discourse just preceding consonants (e.g. it’s just / he’s just), whereas this figure was much higher for restrictive just (79 per cent), therefore it’s unsurprising that restrictive just had a higher /d͡ʒ/ COG than discourse just. There were no significant differences between preceding contexts for just /s/ COG measurements (χ 2(2) = 3.6, p = 0.731).
Boxplot of just fricative centre of gravity measurements across token preceding contexts. Grey dots represent individual data points separated by jitter

Overall, aside from vowel frontness and small increments of /d͡ʒ/ frontness, just does not seem to be phonologically restricted by its preceding contexts.
5.3 Variation by following contexts
Vowel elision rates for just across following contexts are displayed in figure 12 (left panel) and model summaries are displayed in table A5. Just preceding a vowel has the least vowel elision (6.2 per cent), with higher rates when occurring before a consonant or a pause (12.7 and 9.3 per cent respectively). However, none of these differences between following contexts and vowel elision were significant.
Just following contexts by proportion of vowel elision (left) and /t/ elision (right)

The segments following just, however, affect the rate of /t/ elision to a greater degree, as shown in figure 12 (right panel) and summarised in table A8. Pre-vocalic tokens are the least likely elide /t/ (22 per cent elision). This is a significantly lower than the rate for pre-pausal tokens (z(0.3) = -8.5, p<0.001) and pre-consonantal tokens (z(0.2) = -17.1, p<0.001). Pre-pausal just, in turn, has less /t/ elision (72 per cent) than pre-consonantal just (92 per cent) and this was also significant (in a pairwise comparison) (z(0.3) = -5.7, p<0.001).
Table 4 shows the interaction of function and context. Specifically, restrictive and discourse tokens occur more pre-consonantally than adverb tokens do (shown in figure 13). When just occurs before a consonant, it has a higher rate of /t/ elision overall, and this may have a confounding effect on the rate of elision for discourse tokens. This can be seen in figure 14, which plots the number of tokens which had present (1) or elided (0) vowel and /t/ by function and following contexts. The comparison between adverb and discourse in terms of tokens which have elisions shows that discourse tokens are much more likely to be followed by consonants. To analyse this effect, an interaction of function and following context was included in vowel and /t/ elision regression models with a smaller dataset (one without filler or pre-pausal tokens). Firstly, for vowel elision rates, the interaction of Function-Adverb:FconVowel (z(0.6) = 1.0, p = 0.307) was not significant. However, for /t/ elision there was a significant result when comparing discourse with adverb tokens across pre-vocalic and pre-consonantal contexts (z(0.5) = -2.1, p = 0.036). The same effect was found across pre-vocalic and pre-pausal contexts (z(0.6) = 2.3, p = 0.020). This suggests just /t/ elision is determined more by a token’s following context than its function. Even though restrictive tokens have the highest rate of /t/ elision and also frequently occur pre-consonantally, the interaction between adverb and restrictive functions (in a model with reordered levels) across the same contexts was not significant; FunctionRestrictive:FconVowel (z(0.7) = 1.2, p = 0.217).
Stacked bar plot showing proportions of just following contexts across pragmatic function

Bar plots showing the raw numbers for vowel (left) and /t/ elision (right) across functions and following contexts

Figure 15 displays formant values across following contexts. Pre-vocalic and pre-consonantal tokens are close in mean vowel quality, with pre-vocalic tokens having a slightly higher F1 (mean 400 Hz versus 393 Hz respectively) and a lower F2 (1,534 Hz versus 1,545 Hz). The distinct category here is pre-pausal. However, in model comparisons, following contexts were not significant predictors for F1 (X2(2) = 1.8, p = 0.415) or F2 (X2(2) = 0.7, p = 0.713), and as already mentioned, these contexts were very close to one another.
F1~F2 plot of all just vowel midpoints across following contexts. Ellipses represent mean + 2*SD of each context

For following contexts, the overall pattern of segment duration points towards pre-consonantal just being shorter. With a mean of 166 ms it is far shorter than pre-pausal (t(<0.1) = 6.6, p<0.001) and pre-vocalic (t(<0.1) = -10.6, p<0.001) tokens (both are mean 224 ms). As with functions, this is starkest across /s/ and /t/ durations. For /s/, pre-consonantal tokens have a mean length of 66 ms, significantly lower than pre-vocalic tokens at 78 ms (t(<0.1) = 7.7, p<0.001) and pre-pausal tokens at 97 ms (t(<0.1) = 6.1, p<0.001). For /t/, pre-consonantal tokens have a mean length of 60.2 ms, almost identical to pre-vocalic tokens which have a mean of 59.7 ms, but significantly shorter than pre-pausal tokens at 105 ms (t(<0.1) = 7.5, p<0.001). The pattern is less clear for /d͡ʒ/ and vowel durations with only a few milliseconds between the mean values of each following context and no significant effects.
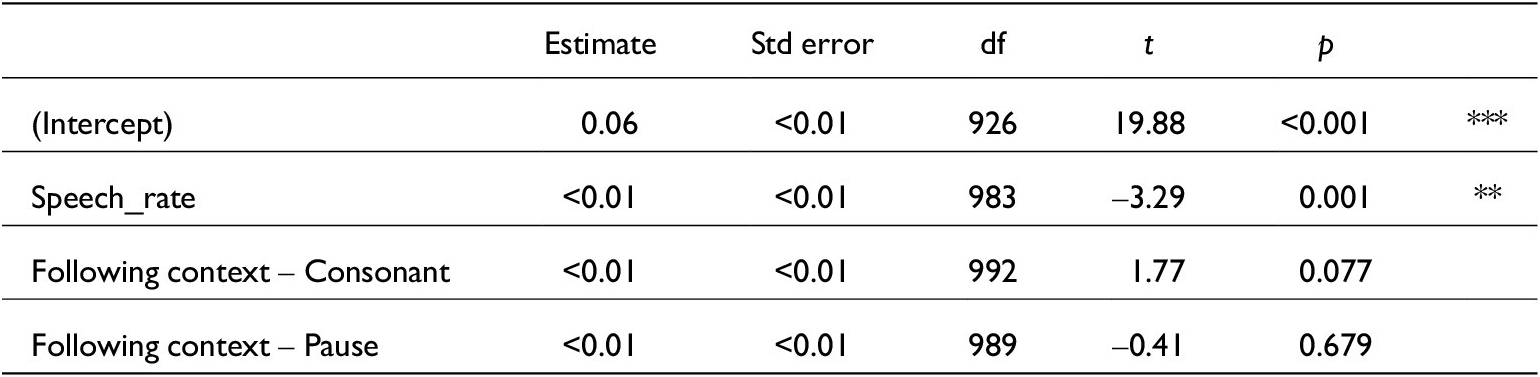
The effect of just following contexts on fricative COG measurements are plotted in figure 16. In model comparisons, following contexts unsurprisingly did not significantly predict /d͡ʒ/ COG measurements (χ 2(2) = 0.9, p = 0.653). When just occurs before a consonant, /s/ COG is significantly lower (mean 4,478 Hz) than if it comes before a vowel (mean 4,871 Hz, t(112.1) = 4.1, p<0.001) or a pause (mean 4,883 Hz, t(79.3) = 5.3, p<0.001). As discourse tokens occur disproportionately pre-consonantally, this could explain the lower /s/ COG measurements for discourse just. However, an interaction between function and following context was not a significant predictor for /s/ COG (χ 2(6) = 3.5, p = 0.748).
Boxplot of just fricative centre of gravity estimates across token following contexts. Grey dots represent individual data points separated by jitter

5.4 Variation by speech rate
Speech rate was estimated as syllables per second; the speech rate of every utterance containing just was calculated providing a relative speech rate for each token. To visualise the effect of speech rate on just phonetic variation, subsets of the data were created. Tokens of just which have elided vowels or /t/ are compared with tokens that do not. Just with an elided vowel tends to be in a turn with a lower speech rate (an overall mean of 200 syllables/second) than just with a present vowel (mean 209 syllables/second). A separate glmer model was run to test this (a model including following/preceding context did not converge): V~Function + Speech_rate + Stressed + (1| Speaker). The effect of speech rate on just vowel elision rates was not significant (z(<0.01) = 1.5, p = 0.130). For /t/ elision, there is no clear relation with speech rate. Turns containing just tokens with elided /t/ have an average speech rate of 208 syllables/second and turns containing present /t/ just have an average speech rate of 209 syllables/second. Again, in a reduced model, there was no significant effect for speech rate (z(<0.01) = -0.1, p = 0.944). Speech rate also doesn’t significantly affect F1 or F2 estimates (see tables A1 and A3), indicating that just vowel quality is not influenced by the surrounding turn’s speed.
5.5 Variation by stress
In total, there were 180 stressed tokens of just, and 1,080 unstressed tokens. This small subset was tested for its effect on segment elisions, durations, and vowel quality. First, as is predictable, stressed tokens of just have a significantly lower rate of vowel elision (z(1.0) = 2.9, p = 0.004) than unstressed tokens (figure 17, left). There was a similar difference for /t/ elision (figure 17, right). However, this effect was not significant for /t/ elision (z(0.2) = 0.8, p = 0.409). This result is based on the following model: glmer(t ~ Function + Fcon + Stressed + (1|Speaker), data, family = binomial). Footnote 5
Stress level of just tokens by proportion of vowel elision (left) and /t/ elision (right)

Stress also affects duration, as illustrated by figure 18. For every segment, stressed tokens have a longer duration. There is a larger gap for /s/ (69 ms mean duration for unstressed tokens, 82 ms for stressed tokens) and vowel (unstressed 55 ms, stressed 64 ms) durations. Indeed, in glmer models, this difference was significant for word (t(<0.01) = -10.0, p<0.001), vowel (t(<0.01) = -4.5, p<0.001) and /s/ durations (t(<0.01) = -2.9, p = 0.004).
Boxplot of just token durations (top) and each segment’s duration (bottom) across stress. Grey dots represent individual data points separated by jitter

Some just functions are more likely to carry stress than others, as displayed in figure 19. Only 7 per cent of discourse tokens carry audible stress, whereas 25 per cent of filler tokens, 19 per cent of adverb tokens and 14 per cent of restrictive tokens carry stress. Stress was found to interact significantly with discourse tokens in the following model testing vowel elision rates: glmer(V~Function + Function:Stressed + (1| Speaker), data, family = binomial) (z(1.0) = 2.1, p = 0.040). A model testing the interaction of function and stress impacting /t/ elision found a similar effect (z(0.4) = 2.2, p = 0.028); discourse tokens are more likely to be unstressed, and this causes a higher rate of segment elisions. However, the interaction of function and stress did not significantly predict word duration (χ2(3) = 5.2, p = 0.161).
Proportions of just audible stress across functions

5.6 Summary of results
-
i. Discourse just shows more phonetic reduction than adverbial just in terms of vowel elision, overall duration and vowel quality. Discourse just conversely has longer /t/ and /s/ durations than adverbial just.
-
ii. When just occurs before a consonant, it is significantly more likely to have elided /t/ and a shorter token duration (influenced by /s/ and /t/ durations) than pre-pausal just.
-
iii. There is a significant interaction between functions and following contexts. Discourse tokens are more likely to occur before consonants than adverb tokens, which leads to a higher rate of /t/ elision and shorter token durations.
-
iv. Post-vocalic just is more likely to have an elided vowel or a more fronted and raised vowel than post-consonantal just.
-
v. Just is rarely stressed, but when it is, it is less likely to have an elided vowel and has a longer duration overall (influenced by the vowel and /s/).
-
vi. There is an interaction between stress and function; discourse tokens are less likely to carry stress than adverbial tokens, and this affected vowel and /t/ elision rates (though not word duration).
6. Discussion
In the following discussion each prediction is assessed in light of the results. Overall, just is a frequent word in the data. At 0.88 tokens per 100 words, it occurs more often than in the 2014 spoken British National Corpus (Love et al. Reference Love, Dembry, Hardie, Brezina and McEnery2017) or Toronto corpora (Tagliamonte Reference Tagliamonte2016). This discrepancy may have something to do with the task participants were asked to undertake: by describing map features, it is possible that there was a higher proportion of particulariser just (e.g. the barber shop is just across from …).
The relationship between the function of just and its phonetic realisation is, as predicted, a complex one. Though the vowel in just is historically strut for SSBE, in the present data it is towards kit but does not fit either category (see figure 3). This underlines the need to consider word-specific phonetics, as words pattern uniquely and are individual units (see, e.g., Docherty et al. Reference Docherty, Paul and Simon2024). One might predict that just would reduce due to its overall frequency and therefore its vowel would be more centralised than strut. However, the vowel quality of just does not immediately suggest phonetic reduction, as it is further raised and fronted than the vowel in um (which can be seen to represent an unstressed vowel). However, there is a relationship between function and vowel quality such that adverbial functions (particulariser and restrictive just) were nearer in quality to strut whereas discourse-pragmatic uses were nearer to kit. Future work (similar to Drager’s (Reference Drager2010) work on like) may want to assess perceptions of just by considering whether listeners can detect token functions by their vowel quality alone. Functions of just are distinct in terms of vowel quality and vowel reduction. Speakers indicate different pragmatic functions of just by their choice of segments – aligning phonetic resources with pragmatic meaning. Speakers generally use just in an adverbial (to refer to a location or the recent past) or discourse-pragmatic way (to evaluate something as ‘merely’, or to intensify an item’s meaning). Although six distinct uses of just are described, these were reduced to adverb, discourse, restrictive and filler for ease of descriptions and because there were few intensifying or temporal tokens. Discourse just has more vowel elision and a more central vowel than other function categories. By contrast, adverbial just exhibits less vowel elision and the highest F1 values. This corroborates Lindemann & Mauranen’s (Reference Lindemann and Mauranen2001) claims: just carries more stress (and is less reduced) when it has an ‘older’ meaning. In this study, adverbial just represents the older meaning whereas discourse just is more recent. Indeed, discourse just is also stressed less than adverbial just and its phonetic realisation reflects this. This is beyond a simple frequency effect as adverbial just is more frequent than discourse just (42 against 39 per cent of tokens). Restrictive just additionally shows an intermediate degree of phonetic reduction in terms of vowel elisions and vowel frontness against adverbial and discourse just, potentially reflecting its position as older than discourse uses, but more recent than particulariser uses. Filler just exhibits longer /s/ and /t/ durations than adverb tokens but has no other significant effects – and no predicted direction. It is likely that filler has longer token-final segments, because these tokens were part of self-repairs or occurred turn-finally meaning they occurred pre-pausally.
Contrary to predictions of phonetic reduction, discourse just has longer /s/ and /t/ durations than adverb just and discourse just has /d͡ʒ/ segments with significantly lower COG than restrictive functions. As COG correlates positively with degree of fricative frontness, when /d͡ʒ/ has a lower COG it can be seen to be more [ʃ]-like. Although, as explained in section 5.2, preceding context interacts with function such that restrictive just occurs more after alveolar consonants (particularly [s, z]) than discourse just does.
As found with like and /t/ reduction (Schleef & Turton Reference Schleef and Turton2018), where just was adjacent to a stronger boundary (a pause) it was predicted to show less phonetic reduction. However, for preceding contexts, post-vocalic contexts stand out as showing the highest rate of elisions, whereas post-pausal and post-consonantal contexts pattern together. Post-vocalic just also is furthest from strut in terms of vowel frontness and height.
The following context of just relates to rates of /t/ elision with a hierarchy of more to less: consonants > pauses > vowels (see Tagliamonte & Temple Reference Tagliamonte and Temple2005). Although segment duration, vowel elision and vowel quality are predicted best by pragmatic function, following context is a better predictor of /t/ elision. This corroborates findings on like (Drager Reference Drager2011; Schleef & Turton Reference Schleef and Turton2018), where there is an interaction between surrounding contexts and token functions. In the present study, I found that discourse just occurs most before consonants, which precludes /t/ reduction. Pre-consonantal just is the most reduced overall, although it patterns with pre-pausal in its vowel elision rates. Discourse tokens also seem more susceptible to following contexts than restrictive tokens. It is feasible that as the more recent uses of just, they are also more susceptible to surrounding phonological constraints when this leads to higher rates of reduction. Future work might consider specific surrounding segments, allowing a deeper exploration into coarticulation effects. Research shows that when /t,d/ is followed by a syntactic boundary it is less likely to be affected by its following context (Tagliamonte & Temple Reference Tagliamonte and Temple2005). Other work on just phonetic variation might follow Tagliamonte (Reference Tagliamonte2016) and analyse whether syntactic position (e.g. just-aux-V-ing ‘I was just sitting …’) aligns with segmental variation. Further work which investigates word collocations, may wish to consider this (see Grama et al. Reference Grama, Diskin-Holdaway, Gnevsheva, Brand, Hay, Foulkes, Drager, Docherty and Travisin prep).
For very frequent words or constructions, Bybee et al. (Reference Bybee, File-Muriel and De Souza2016) argue that special reduction occurs – reduction in ways which aren’t predicted by broader sound change patterns. They specifically mention grammaticalising constructions as a location where this might occur. The reduction of just to an affricate followed by a fricative [d͡ʃs] seems to fit this category. Future work may also want to consider whether the occurrence of just in a frequent sequence such as it’s just may be driving higher levels of reduction through some form of lexicalisation.
Unexpectedly, speech rate does not predict rates of elision; in fact, it patterns weakly in the opposite direction than expected. Just tokens with an elided vowel overall occur in turns with a slower speech rate than just with a fully articulated vowel. Nevertheless, this indicates that function and surrounding context effects are not affected by any speech rate effects as I predicted. Stress had a clearer pattern. Stressed just, unsurprisingly, patterns with a more phonetically full form than unstressed just. Despite this, as predicted, function and surrounding context effects were still significant, showing that these are robust even when considering stress as a factor.
The phonetic realisation of just is more than merely a pattern of more reduced forms being aligned with discourse-pragmatic uses; it can be seen to represent a process of grammaticalisation. Discourse-pragmatic uses of just show a higher rate of reduction than adverbial uses, and discourse-pragmatic just arguably represents a more advanced stage in the grammaticalisation process. In terms of vowel realisations, discourse tokens show the most reduction, followed by restrictive tokens, followed by adverb tokens.Footnote 6 But more than reduction seems to be taking place here; discourse tokens have a longer /s/ and /t/, and a lower COG for /d͡ʒ/ when compared with adverb tokens. Further investigations of patterns of /d͡ʒ/,/s/ and /t/ realisation are needed to interpret whether just is leading or lagging a change in these environments as frequent words have been found to do with vowel shifts (Foulkes & Hay Reference Foulkes, Hay, MacWhinney and O’Grady2015; Hay et al. Reference Hay, Pierrehumbert, Walker and LaShell2015). Just patterning with kit may also be caused by coarticulation with the preceding palatal /d͡ʒ/, although (Grama et al. Reference Grama, Diskin-Holdaway, Gnevsheva, Brand, Hay, Foulkes, Drager, Docherty and Travisin prep) found this to be unique to just in a comparison with other palatal + strut combinations.
This study has considered reduction in terms of how segments of just have aligned with canonical forms. This is, of course, a binary way of looking at phonetic change. Another way to consider the phonetic variation of just would be to analyse realisations as discrete variants rather than considering each segment independently. Other work has utilised this method to describe the sociolinguistic patterning of features. For example, Pichler (Reference Pichler2013) analysed don’t think and don’t know across phonetic variants did not / didno / didnae / dinnae. Perhaps analysing just / j’st / j’s ([d͡ʒʌst] / [d͡ʒst] / [d͡ʒs]) would provide a fresh perspective on the spread of both vowel and /t/ elision and also permit a deeper analysis into the relationship between multiple segment elisions (which was touched upon in section 5.1). Another potential improvement would be a wider range of functions, which would require more data. Future work should also focus on utilising data with a broad range of styles to investigate imperative and adjective just alongside innovations in the usage of this highly frequent feature.
7. Conclusion
The analysis of the holistic realisation of a single word in British English shows that pragmatic function is a significant factor in word-based phonetic variation. By describing the phonetic variation of just with detailed acoustic analyses, it is shown that speakers utilise phonetic resources to indicate social and pragmatic meaning. This is alongside adherence to phonological patterns of contextual variation. Words can display specific phonetic patterns (Hay Reference Hay2018; Pierrehumbert Reference Pierrehumbert2006) and understanding their variation and meaning sheds light on how we communicate indexical and pragmatic meanings in grammatical as well as lexical words. Traditionally, phonological variation has focused on segments, with surrounding context, stress and speech rate interpreted as aligning with coarticulation and reduction effects. But words carry pragmatic meaning in a way that segmental realisations can align with. If the meaning of a collection of homonyms such as like or just can be distinguished by their phonetic realisations, then speakers are using phonetic resources beyond a segment-led view of phonological structure. To dive into how polyfunctional words vary in pronunciation, we need to connect with the realm of pragmatics.
Acknowledgements
I would like to acknowledge the support from my supervisors, Paul Foulkes and Vincent Hughes, without which the PhD which launched this work would have never come to fruition. Thanks also go to Traci Walker, Chloé Diskin-Holdaway, Claire Childs and George Bailey for their sage advice on various parts of the work. I also thank the White Rose College of the Arts & Humanities for funding me as an Arts and Humanities Research Council PhD student (grant number 201013361).
Appendix
A1. Vowel formant models
Below various tables showing the summaries for the results of mixed models containing vowel formants are presented (see section 4.1 for a more thorough discussion of this method). All mixed() model comparisons were run using the following syntax (‘Fcon’ = following contexts and ‘Pcon’ = preceding contexts): mixed(V_F1~ Function + Turn_pos + Speech_rate + Stressed + Fcon + Pcon + (1|Speaker), data, method=’LRT’)
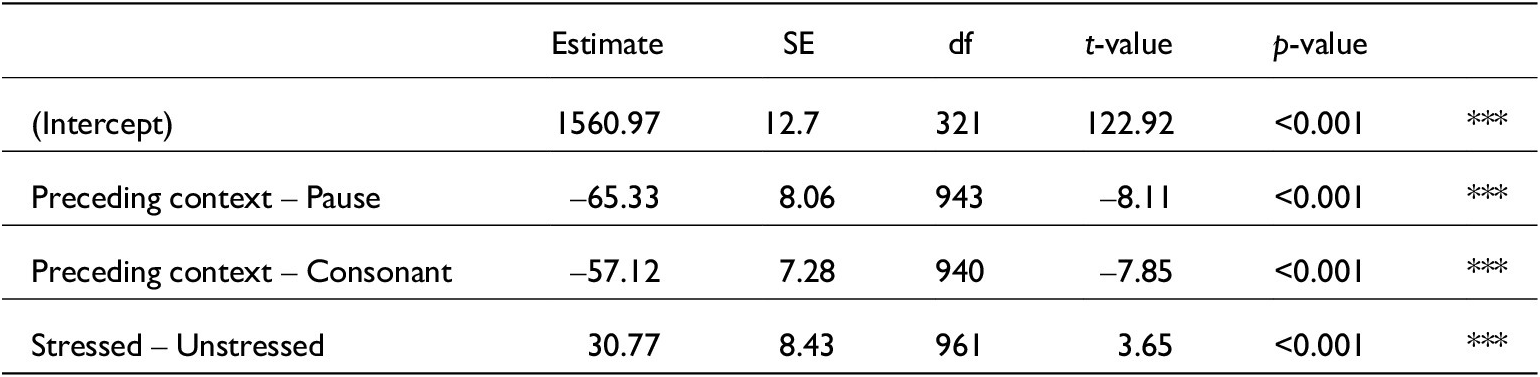
The significant predictors and interactions were indicated by the summary of these likelihood-ratio comparisons, and then a linear mixed-effects model was run containing only those features for each vowel formant. For F1, this was function, preceding contexts and stress. For F2, this was stress, and preceding contexts.
Model comparison output from mixed() testing all variables against vowel F1 estimates

Summary of the linear mixed-effects model for F1 vowel estimates. Conditional R 2 = 0.51

Model comparison output from mixed() testing all variables against vowel F2 estimates

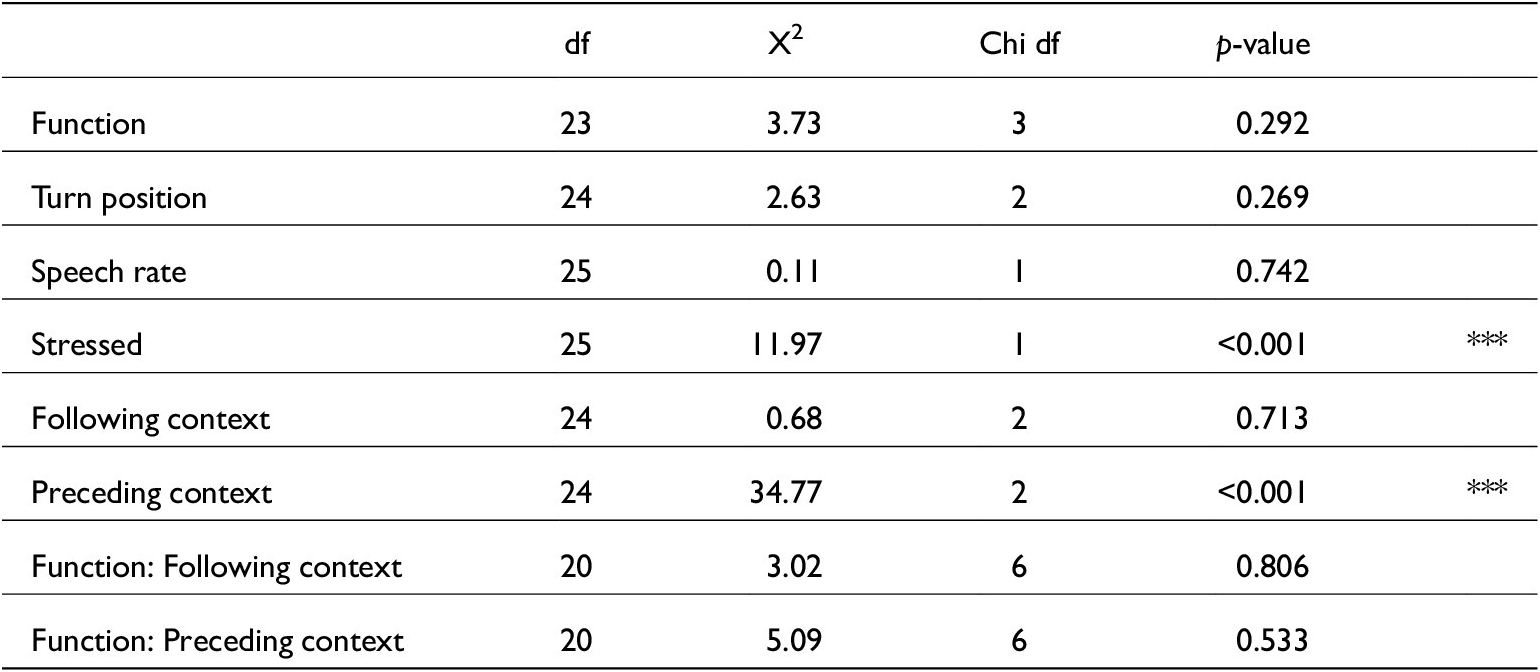
Summary of the linear mixed-effects model for F2 vowel estimates. Conditional R 2 = 0.49

A2. Vowel and /t/ elision models
Below are the tables which contain the model summaries for various tests of just vowel and /t/ elision. Two models were created to test vowel elisions because when including both preceding and following contexts as independent variables, models failed to converge. Also, testing preceding contexts and turn position caused models to not converge. Therefore, table A5 tests following contexts and turn position, and table A6 tests preceding contexts. All other variables in these models remained the same. All vowel elision tests were based on 1,260 tokens.
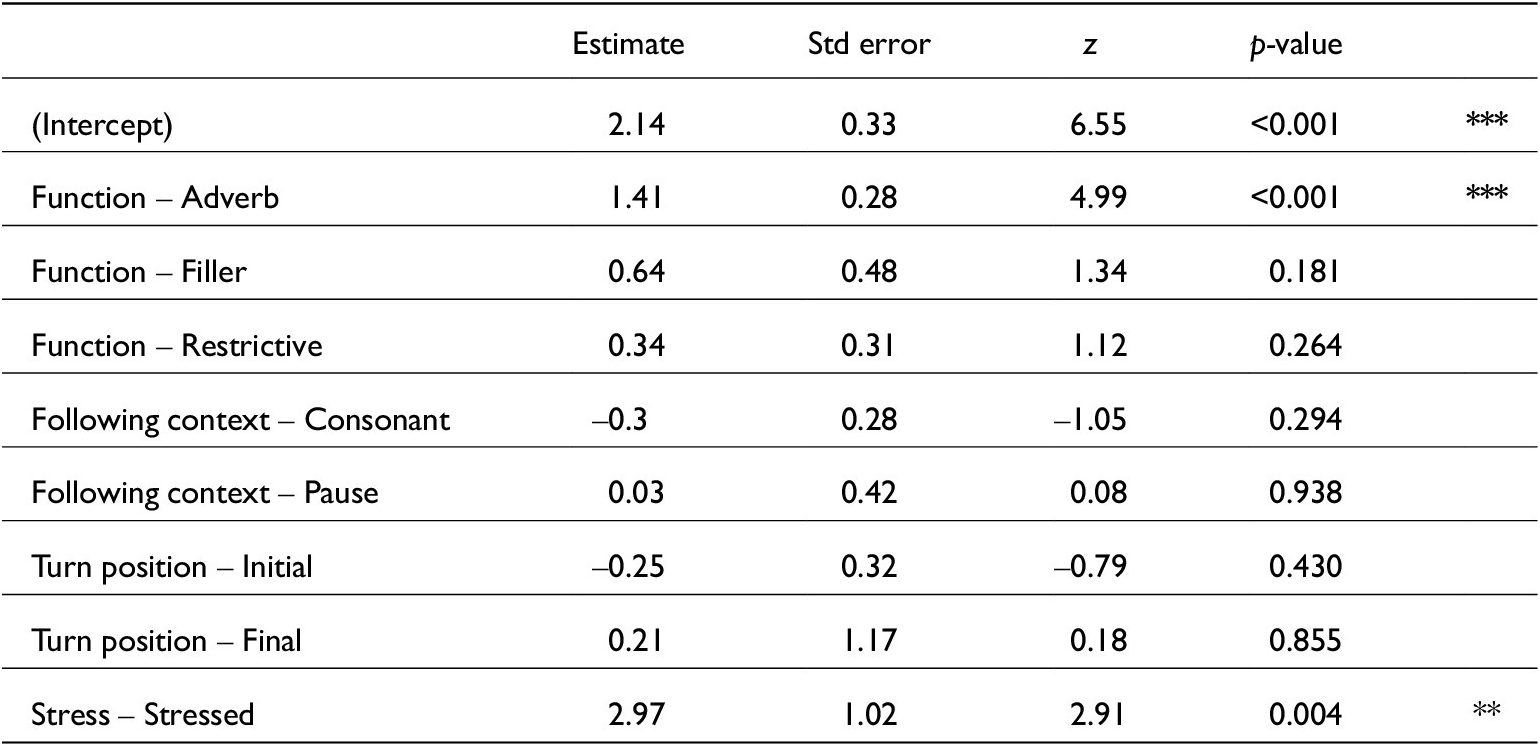
Generalised linear mixed-effects model summary for just vowel elision featuring following contexts glmer(V ~ Function + Fcon+ Turn_pos + Stressed +(1|Speaker), data, family=binomial). Conditional R 2 = 0.47

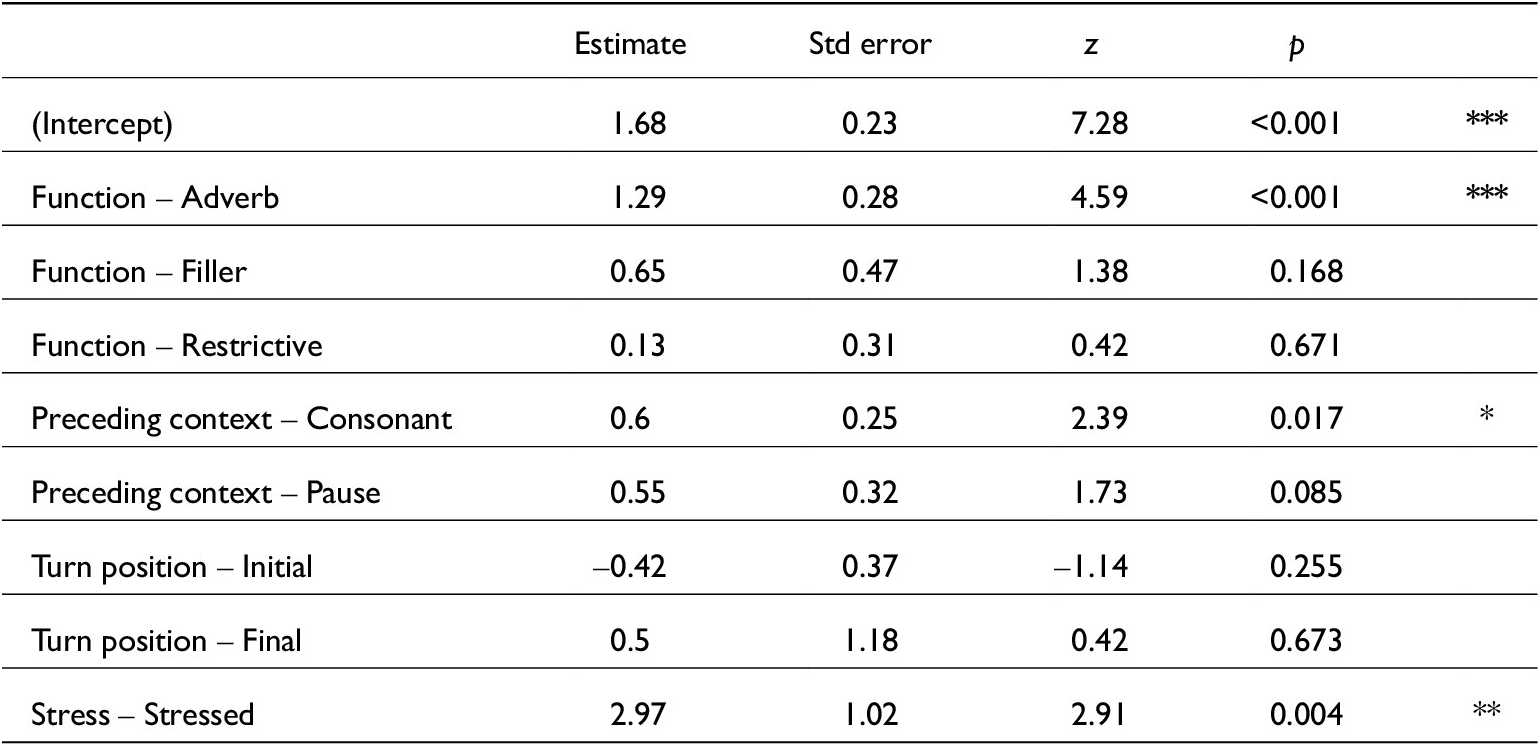
Generalised linear mixed-effects model summary for just vowel elision featuring preceding contexts glmer(V ~ Function + Stressed +(1|Speaker), data, family=binomial). Conditional R 2 = 0.48

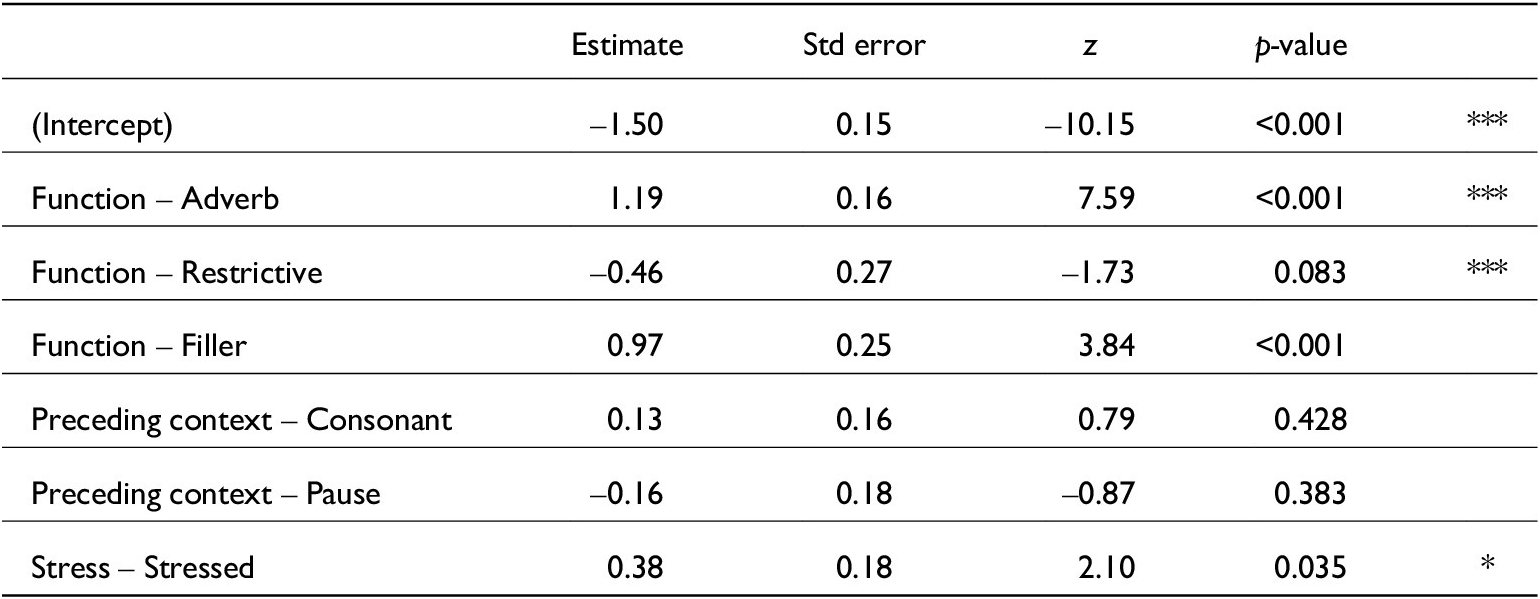
Generalised linear mixed-effects model for just /t/ elision with preceding contexts. glmer(t ~ Function + Pcon+ Stressed + (1|Speaker), data, family=binomial). Conditional R 2 = 0.14

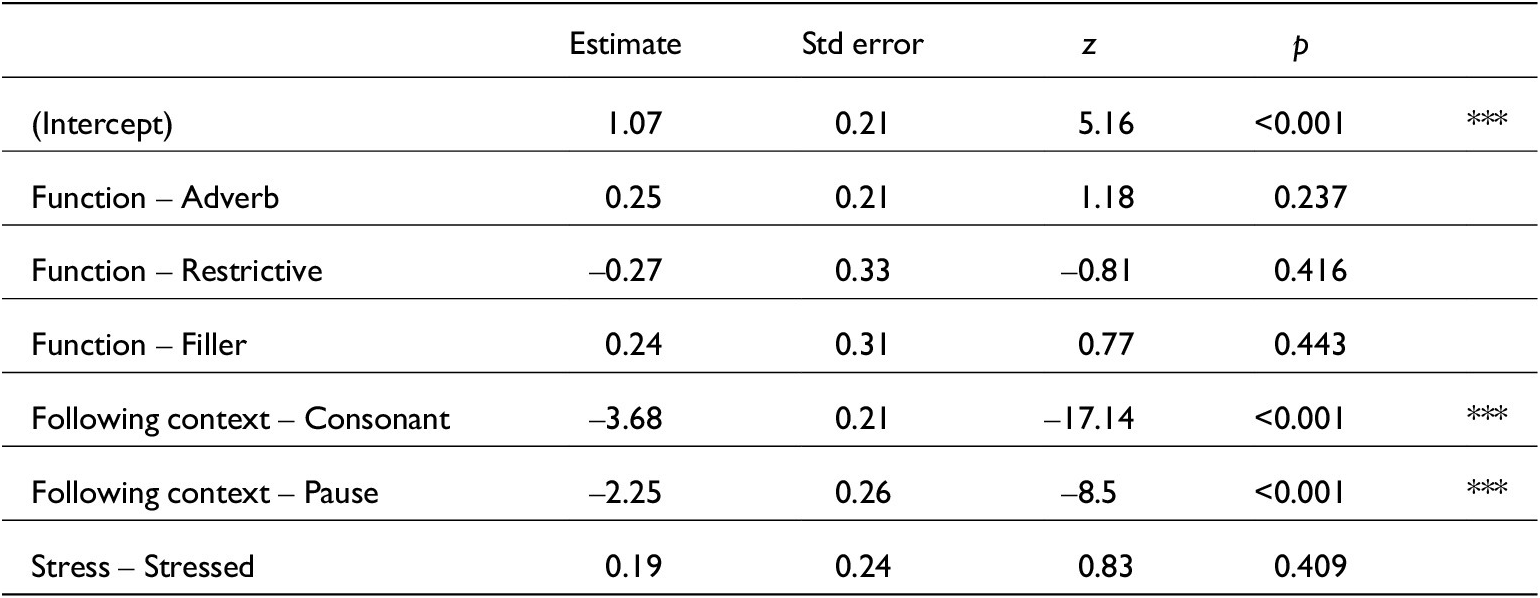
Generalised linear mixed-effects model for just /t/ elision with following contexts. glmer(t ~ Function + Fcon + Stressed + (1|Speaker), data, family=binomial). Conditional R 2 = 0.48

A3. Word and segment duration models
Model comparison from mixed() testing all variables against just word duration measurements. N = 995

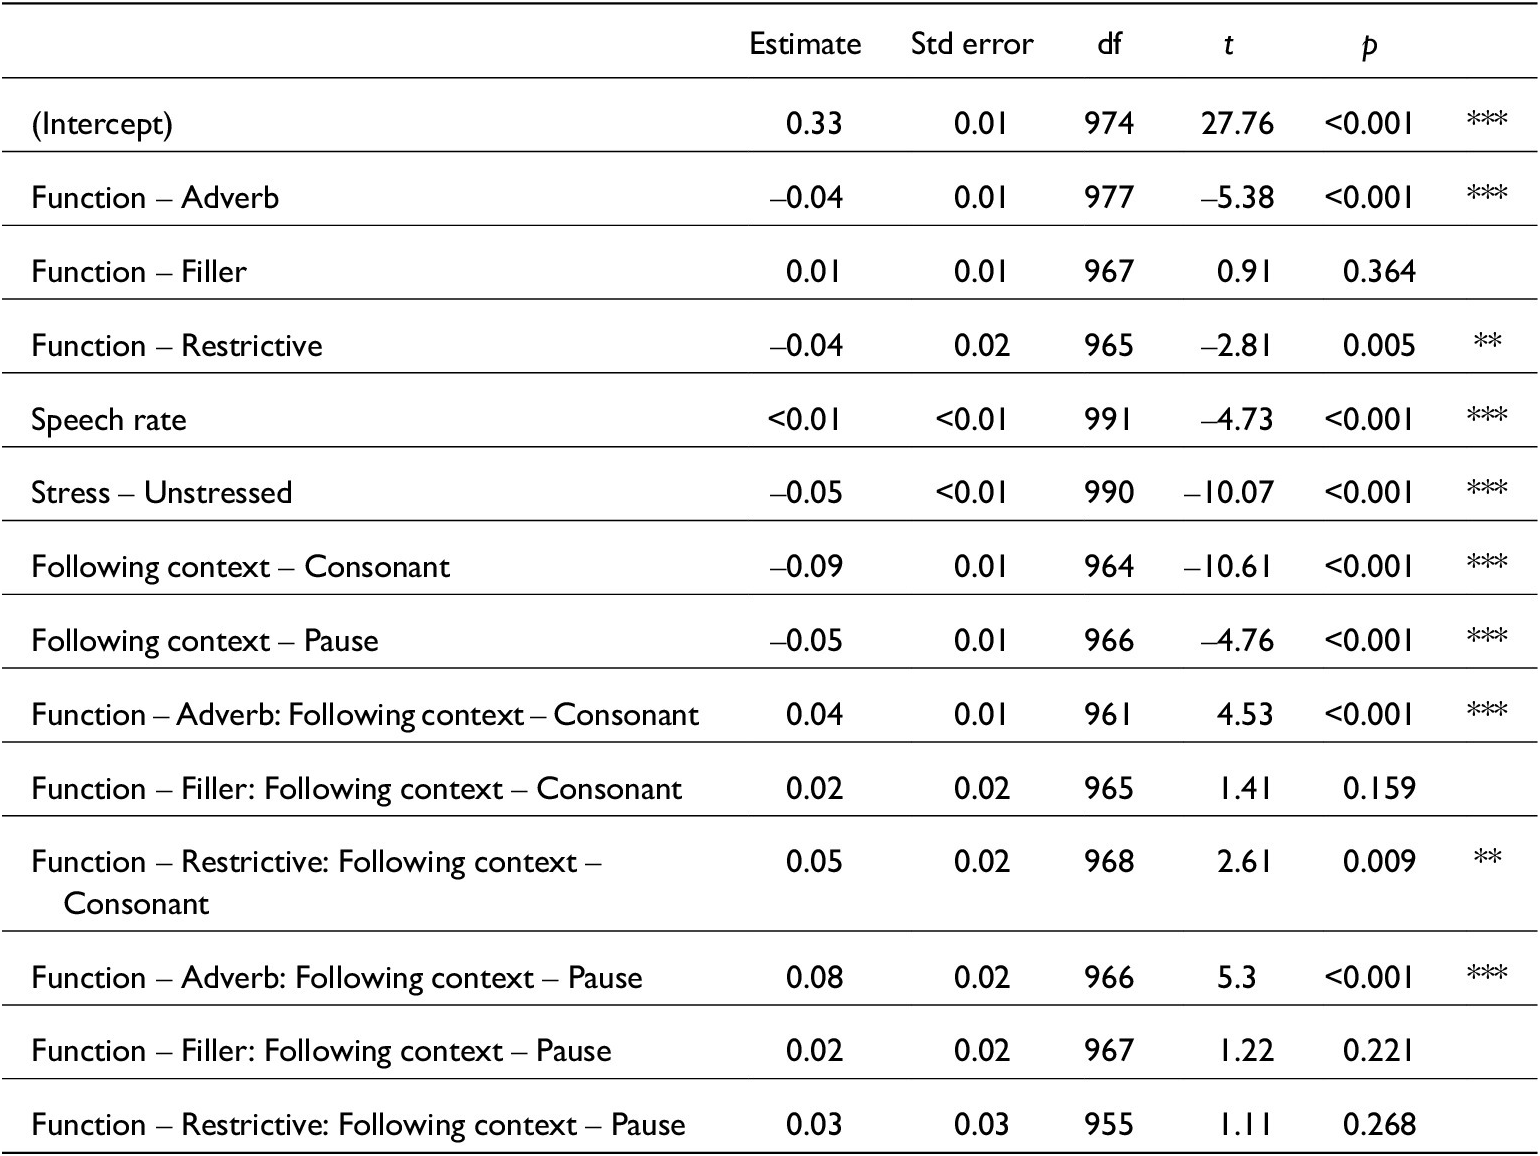
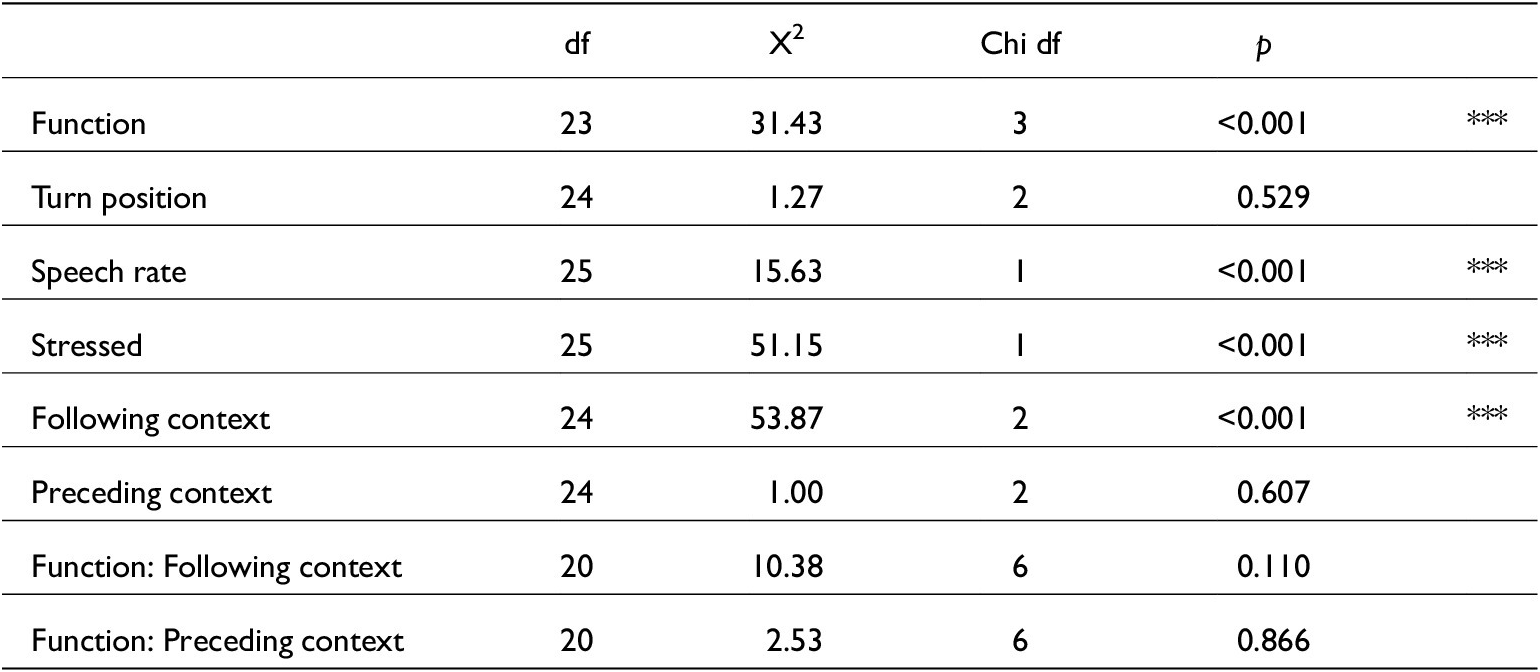
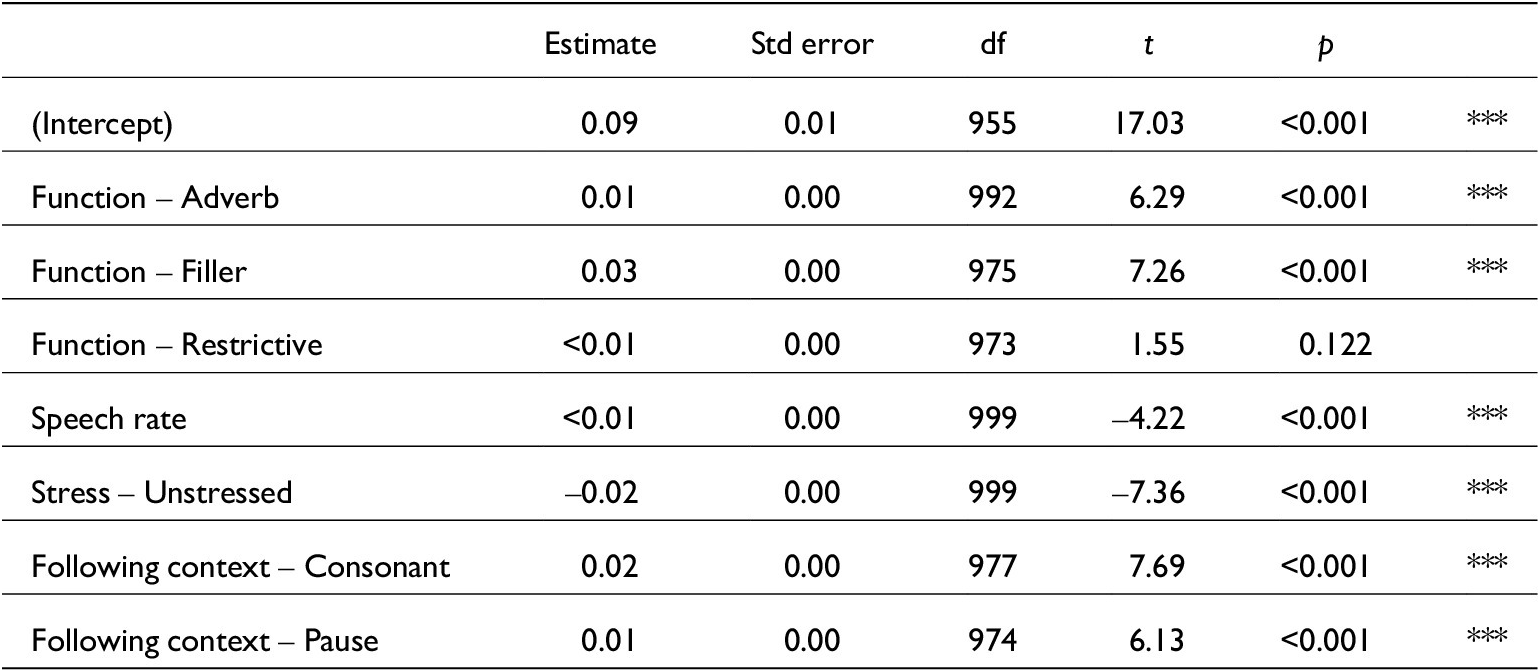
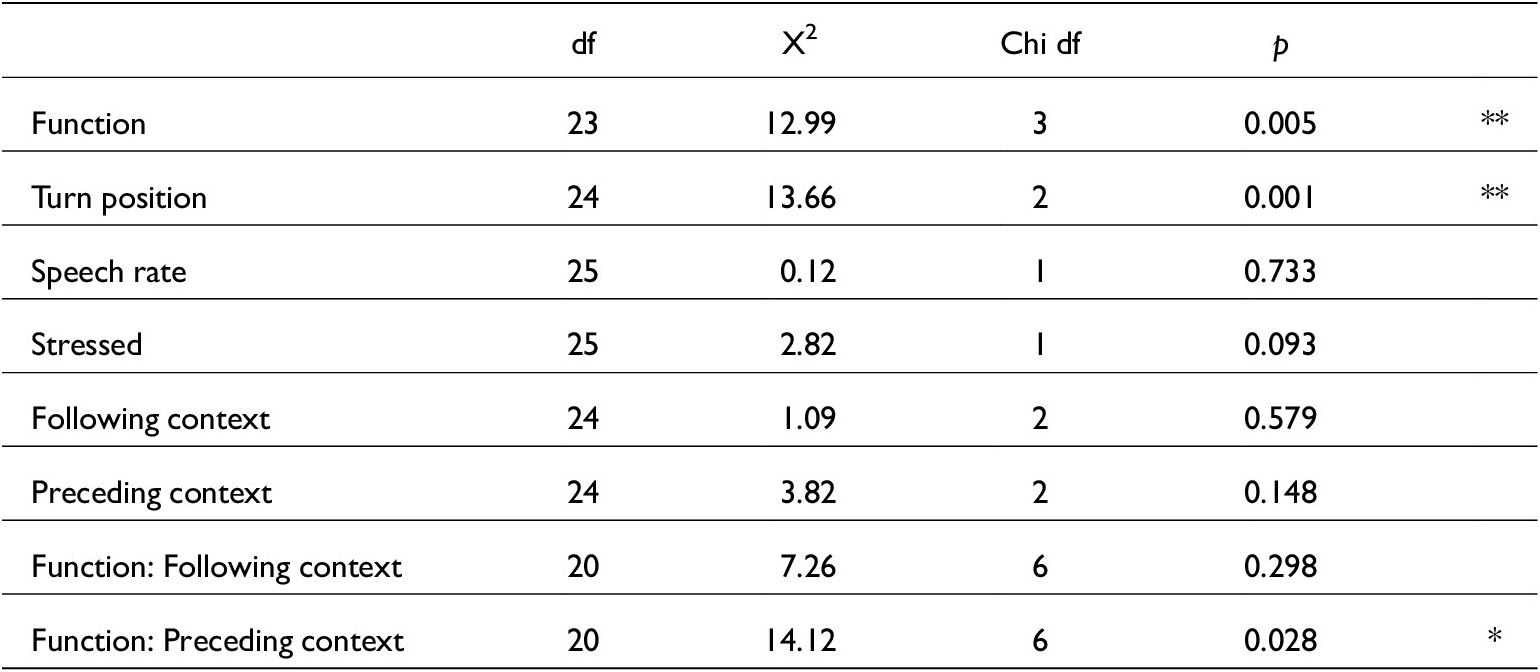
Linear mixed-effects model for just word durations. lmer(Word_dur_s~Function + Speech_rate + Stressed + Fcon + Function:Fcon + (1|Speaker), data, REML = F). Conditional R 2 = 0.40. N = 995

Model comparison from mixed() testing all variables against just /d͡ʒ/ duration measurements. N = 994

Linear mixed-effects model for just /d͡ʒ/ durations. lmer(dz_dur~ Speech_rate + Fcon (1|Speaker), data, REML = F). Conditional R 2 = 0.64. N = 994

Model comparison from mixed() testing selected variables against just vowel duration measurements. N = 1,041

Linear mixed-effects model for just vowel durations. lmer(V_dur~ Stressed + (1|Speaker), data, REML = F). Conditional R 2 = 0.30. N = 1,041

Model comparison from mixed() testing all variables against just /s/ duration measurements. N = 1,001

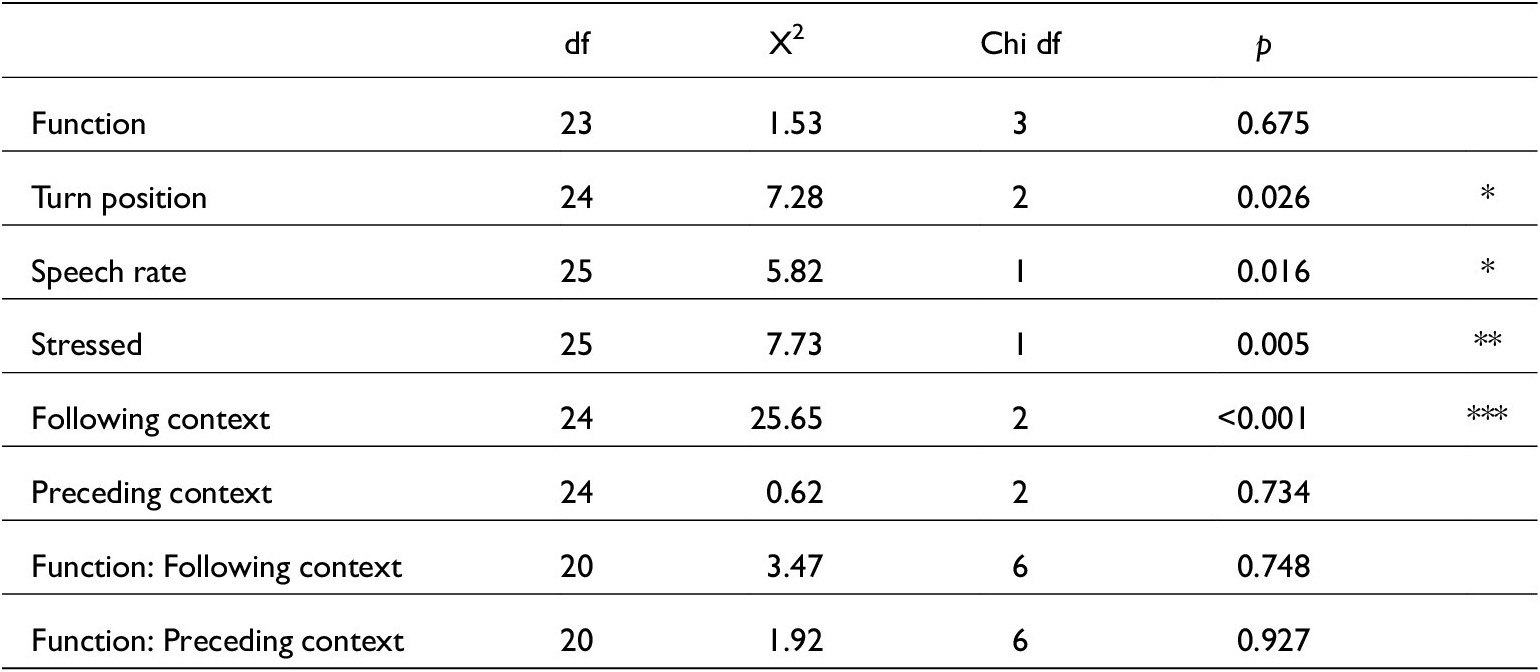
Linear mixed-effects model for just /s/ duration. lmer(s_dur~ Function + Speech_rate + Stress + Fcon + (1|Speaker), data, REML = F). Conditional R2 = 0.33. N = 1,001

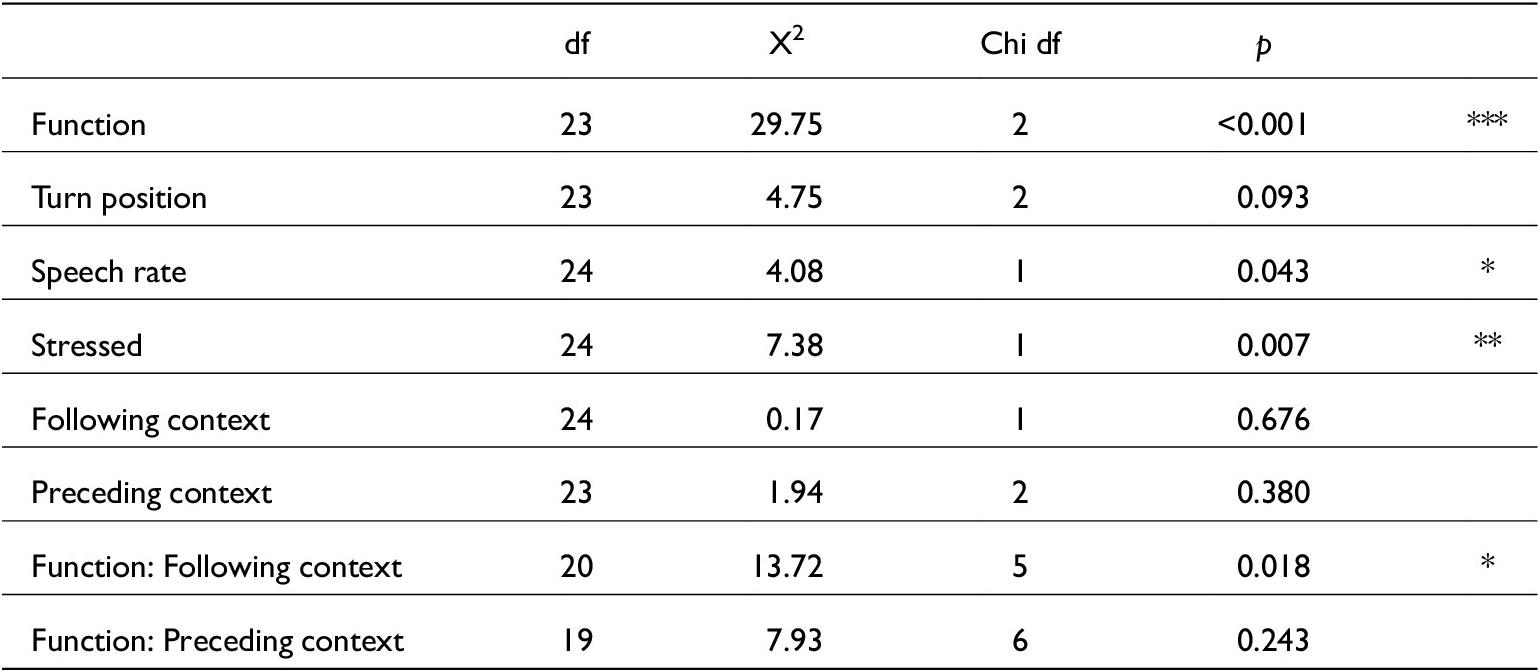
Model comparison from mixed() testing all variables against just /t/ duration measurements. N = 384

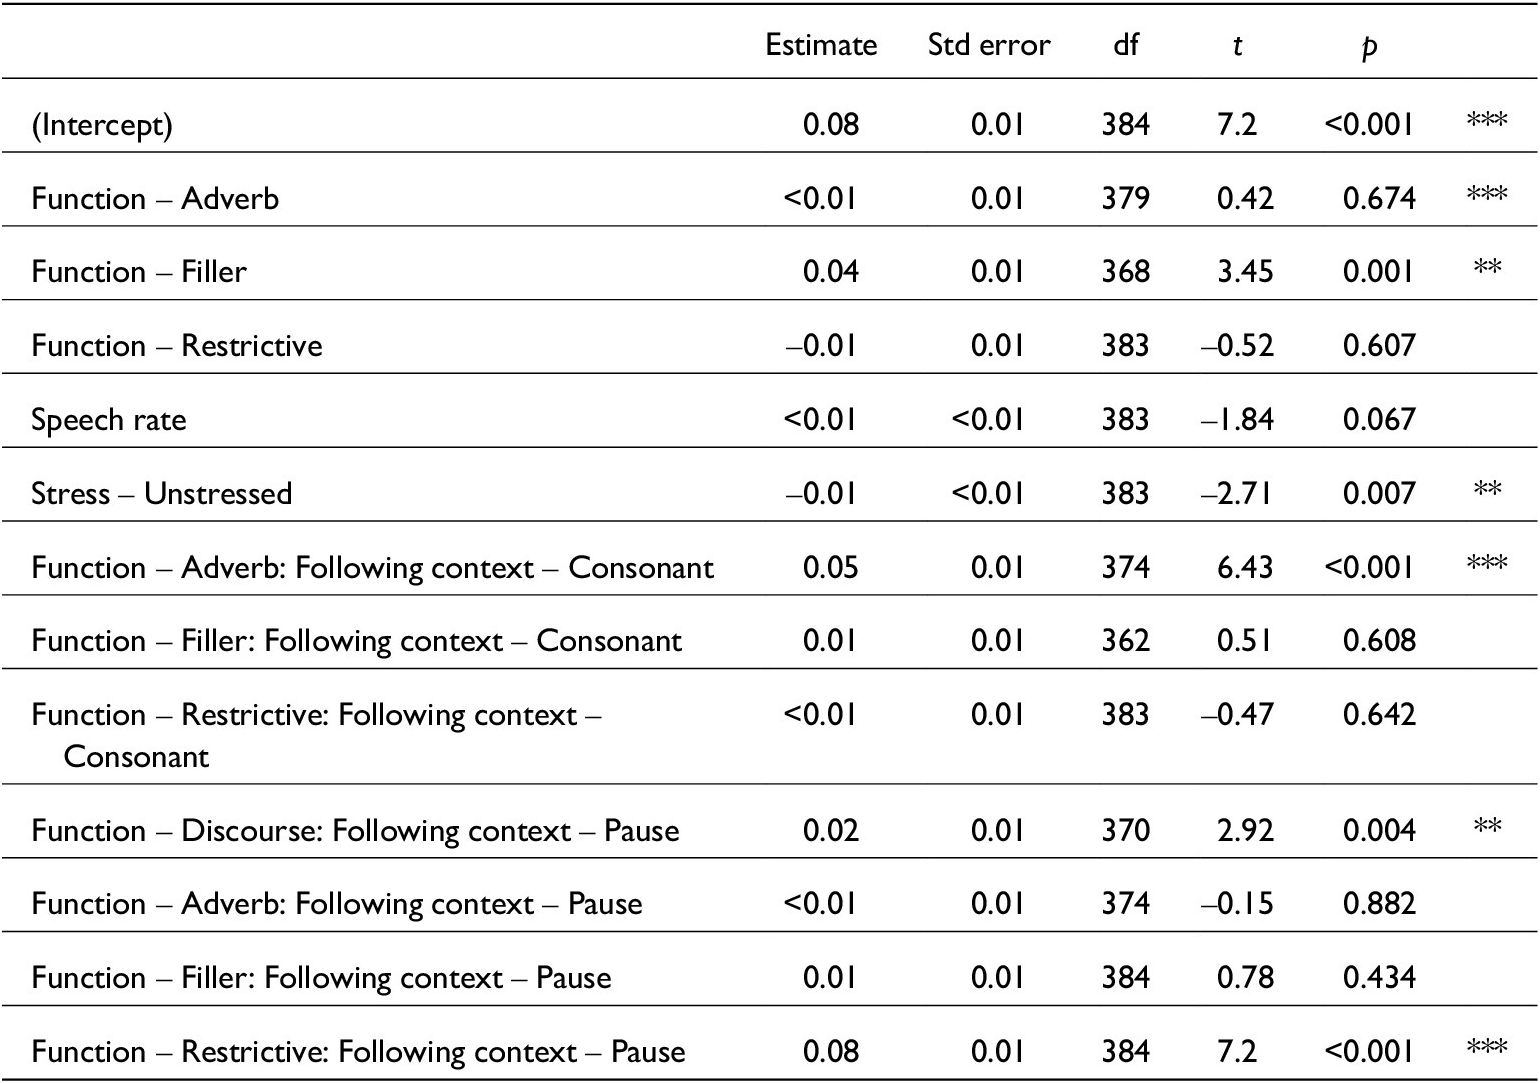
Linear mixed-effects model for just /t/ duration. lmer(s_dur~ Function + Speech_rate + Stressed + Function:Fcon + (1|Speaker), data, REML = F). Conditional R2 = 0.42. N = 384

A4. Centre of gravity models
Model comparison results from mixed() testing all variables against just /d͡ʒ/ COG estimates. N = 833

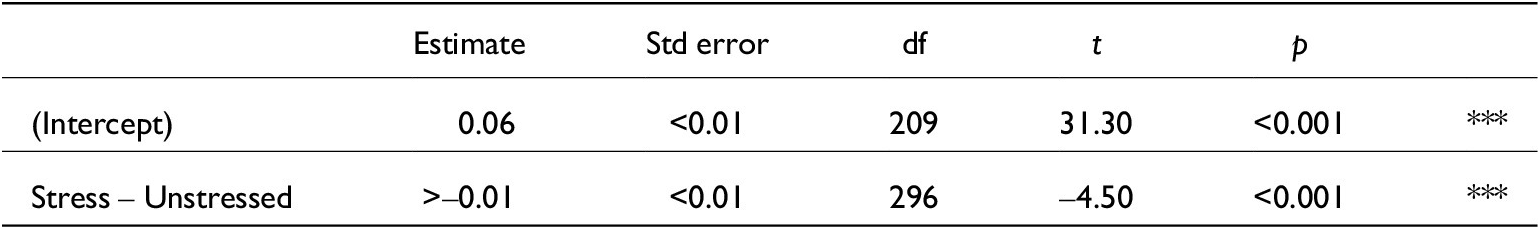
Linear mixed-effects model for just /d͡ʒ/ COG estimates. lmer(dz_COG~ Function + Turn_pos + Function:Pcon + (1|Speaker), data, REML = F). Conditional R2 = 0.33. N = 833

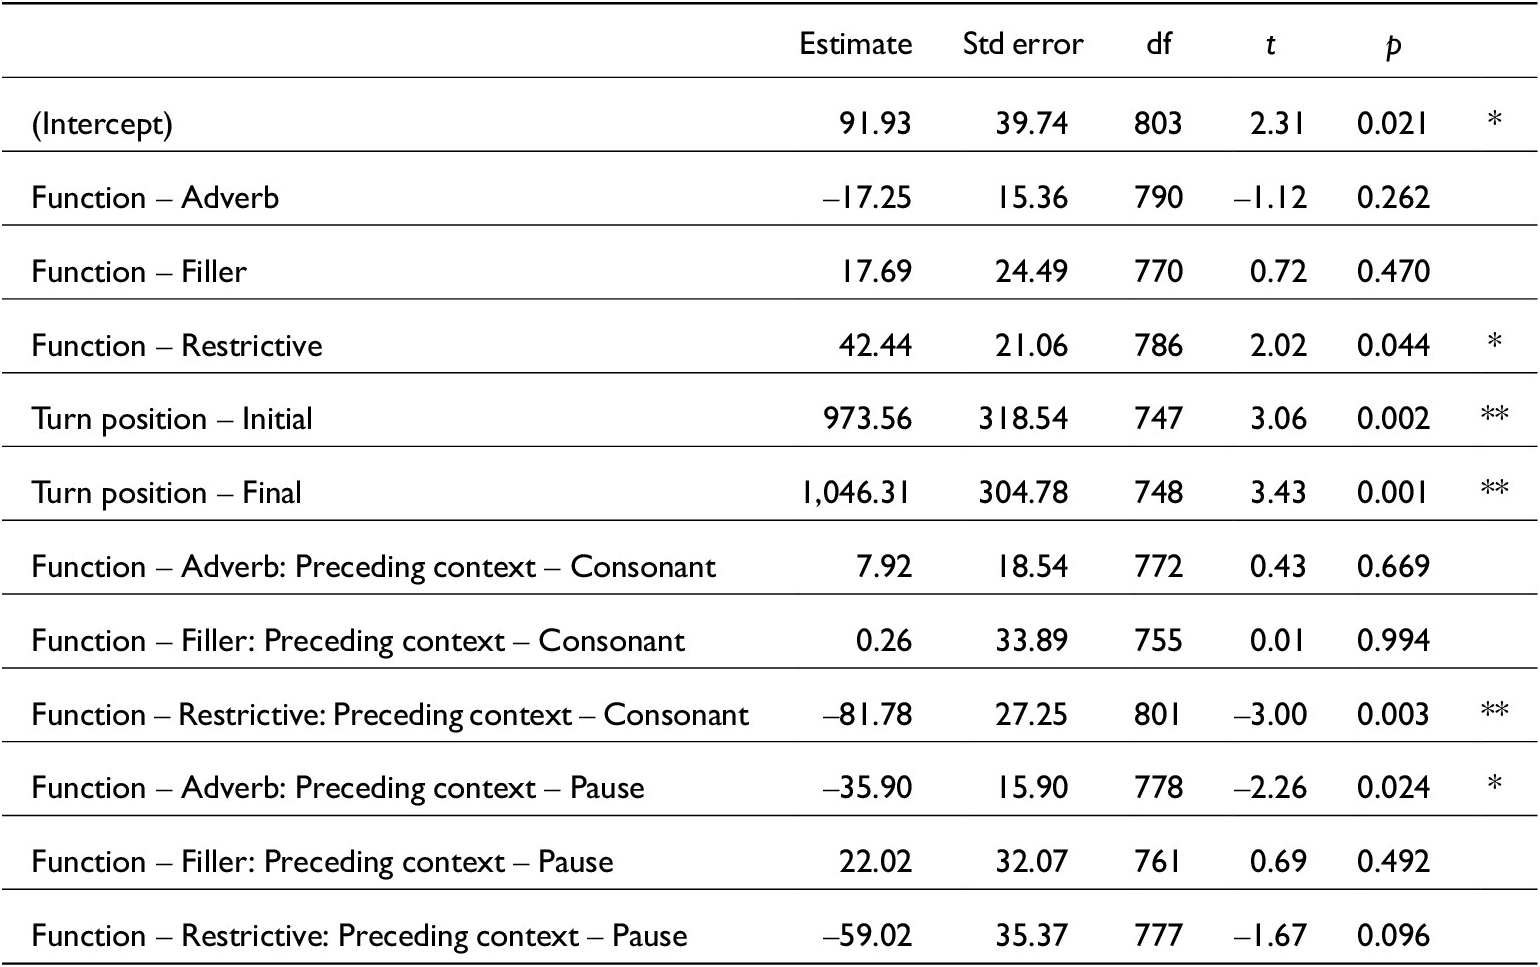
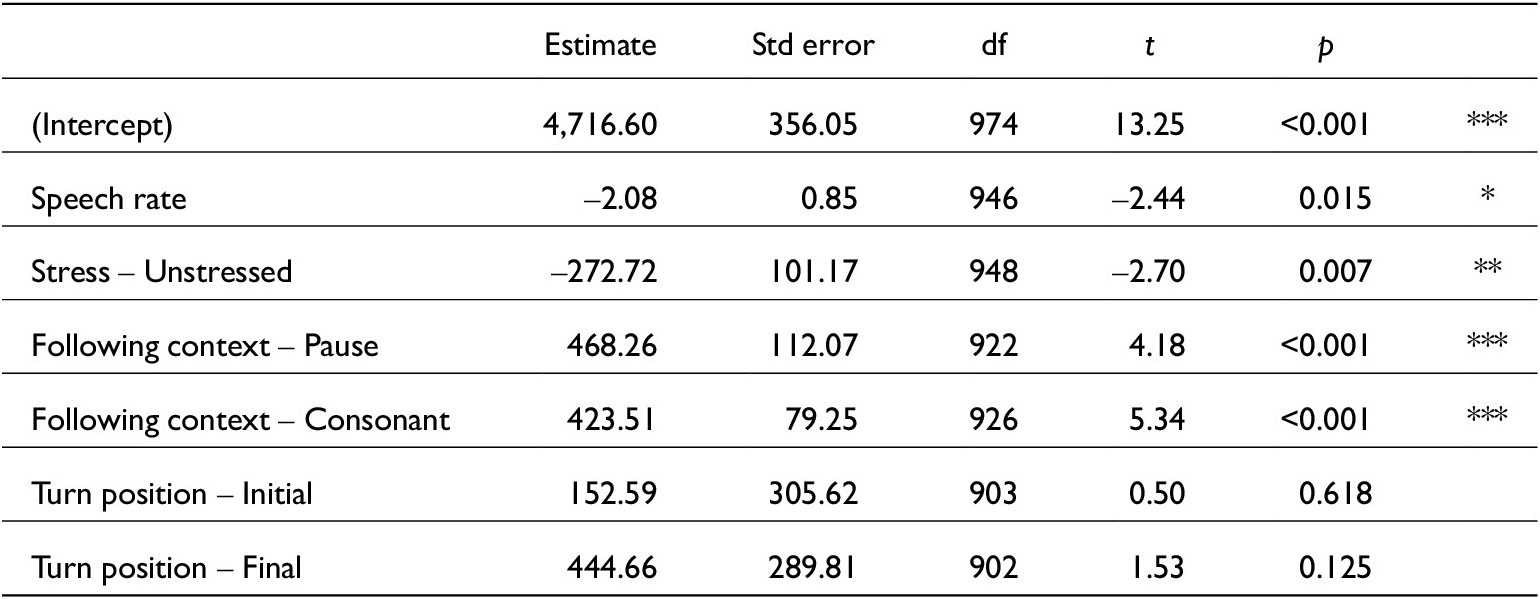
Model comparison from mixed() testing all variables against just /s/ COG estimates. N = 978

Linear mixed-effects model for just /s/ COG estimates. lmer(s_COG~ Speech_rate + Stressed + Fcon + Turn_pos + (1|Speaker), data, REML = F). Conditional R2 = 0.36. N = 978


 Open access